Article

Three Barriers to Effective Programs with Payment for Ecosystem Services: Behavioral Responses in a Computer-Based Experiment

Department of Economics, Western Kentucky University, Bowling Green, KY 42101, USA
Sustainability 2021, 13(22), 12346; https://doi.org/10.3390/su132212346
Submission received: 30 September 2021 / Revised: 1 November 2021 / Accepted: 2 November 2021 / Published: 9 November 2021

Abstract

:
Financial incentives in the form of payment for ecosystem services (PES) can encourage participation in voluntary conservation programs, but real-world experience with PES is limited for services such as the provision of endangered species habitats. A computer-based laboratory experiment with 139 US college students as subjects suggests there are three barriers to effective PES programs: (1) financial rewards can crowd out altruism—low-level PES in the experiment was less effective than the same program without PES; (2) landowners may assuage guilt over destroying habitats by making contributions to ineffective conservation programs—participants often paired destruction of habitat with token contributions to conservation efforts; and (3) landowners may strategically exit conservation agreements in ways that are detrimental to wildlife—a large proportion of participants chose to leave agreements and destroy habitats when the PESs were structured without credible deterrence of an early exit. Fortunately, the results of the experiment also suggest research to overcome these barriers by ensuring that PES financial incentives are scaled and structured to effectively promote conservation. The lessons from this study—though they issue from the particular context of this experiment—provide suggestions about how to structure benefit sharing schemes that could be used to promote conservation in a range of settings.

1. Introduction

Voluntary conservation refers to environmental programs that allow landowners and other stakeholders to choose whether to participate. In this respect, voluntary conservation is in stark contrast to traditional conservation laws which threaten fines and jail time for those who do not comply with regulations. Voluntary conservation promotes individual liberty with a meaningful set of choices for stakeholders, but may fail to achieve policy goals if not enough stakeholders choose to participate. To encourage participation, some government agencies have proposed to offer financial incentives, such as through a program with payment for ecosystem services (PES). In a PES program, landowners or other relevant stakeholders are compensated for the services—water filtration, carbon sequestration, wildlife habitat, etc.—which they provide for ecosystems under their control.
There is a need for more data to come up with sound voluntary conservation policies in this relatively new area [1]. To explore the effectiveness of PES programs, I focus on the provision of endangered species habitats, using that as the context in a computer lab-based experiment, as the conflict between economics and conservation is direct and observable. Similar issues arise with PES programs aimed at protecting wetlands, conserving open green space, and sequestering carbon to mitigate climate change. Indeed, the complex interplay of preferences and PES incentives create economic challenges in areas ranging from decreasing non-point-source water pollution to fixing environmental taxes. Therefore, the promises of voluntary conservation and the potential barriers to its success may provide lessons for a wide range of issues—especially those relating to resources managed by different public and private entities.

1.1. Traditional Regulation and Voluntary Conservation: Endangered Species in the United States

The standard method for protecting natural resources is to impose regulatory restrictions on how those resources can be used. For example, the United States Endangered Species Act (ESA) provides agencies with powerful regulatory tools to restrict development and resource extraction, but the power of the law does not always lead to favorable results. In some instances, landowners face perverse incentives to destroy habitats of species that are or may be protected under the ESA [2]. Private landowners who have endangered species on their properties often find themselves in adversarial relationships with federal regulators like the U.S. Fish & Wildlife Service (FWS) because regulators restrict land uses to encourage conservation. The FWS is usually seeking increased populations of endangered species, while more endangered species lead to more restrictions for the landowner. Landowners may try to avoid regulations by destroying a habitat before species move onto it, by destroying species before that are listed as endangered, or by illegally destroying listed species and hoping not to get caught [3]. In short, a problem with the effort to protect endangered species on private property using traditional regulatory tools is that the ESA is “all sticks and no carrots” [4].
The FWS recognized that strict regulation of endangered species on private land may be having unintended consequences such as habitat destruction, so the agency started exploring ways to mitigate the perverse incentives created by the ESA. In 1995, the FWS rolled out a voluntary program of safe-harbor agreements that presented a new option for landowners who faced possible regulation for certain listed species [5]. To enter a safe-harbor agreement, landowners promise to provide habitat sufficient to support a “baseline” number of species in exchange for a commitment from the FWS not to increase the regulatory burden if more members of the species move onto the property in the future. Safe-harbor agreements can act as insurance policies against regulatory burdens, decreasing uncertainty for landowners over such things as timber harvests. This tool can be especially attractive for landowners with a taste for conservation—to promote wildlife habitat for hunting or observation—but who want to balance it with resource extraction. The safe-harbor program has grown to cover millions of acres in dozens of states [6], and similar programs, such as habitat conservation plans and candidate conservation agreements with assurances, cover millions more acres [7]. There is evidence that the safe-harbor programs are mitigating the incentive to destroy habitat in at least one program in the eastern United States [8].
Voluntary conservation programs have grown rapidly in the past two decades, but there remain concerns about whether they are generating sufficient participation to protect enough habitats in their proper spatial configurations [9]. Indeed, there is evidence that a lack of understanding of terms like ‘ecosystem services’ serves as a practical barrier to implementation of PES policies, especially in small to medium sized government units [10]. Indicator-based management policies—a necessary component of PES systems that require some form of measurement—may allow collaboration among government units to overcome some of these challenges [11]. Issues like connectivity of green spaces pose challenges for measurement [12]. The problems of measurement and incentivizing ecosystem services are present in a range of situations from urban green spaces to marine carbon sinks [13], and the context matters for how an effective program can be structured.
The FWS has proposed rewarding landowners who provide habitat for species by providing the landowners with tradable credits in a form of PES program [14]. A landowner who provides habitat for eligible species receives credits for that habitat. The landowner can use those credits to offset habitat modification, such as timber harvest or development, on another property. Alternatively, the landowner can sell the credits to others who may want to modify habitat. By creating a market for endangered species habitats, the policy intends to provide positive financial incentives for landowners who engage in conservation efforts. The FWS hopes tradable credits will be the sought-after carrot that will incentivize landowners to cooperate with the FWS in conservation efforts. If this program goes well, incentivized voluntary conservation is likely to be used in other contexts, dealing with endangered species and beyond [15].
However, there is also a risk that putting a price on something may induce people to treat that thing differently [16]. For example, financial incentives could have unintended consequences on the preference for conservation discussed above. It may also be that financial penances serve to alleviate guilt and thereby lead to more sinful behavior [17]. If policies are designed with profit-maximizing behavior in mind, these deviations may lead to unintended consequences that could potentially make some policies backfire. In this paper, I use experimental evidence to help build evidence for the use of PES, including pointing out potential barriers created by these sorts of unintended consequences.

1.2. Existing Research

Ecosystem services have been used as a metric to measure environmental improvement, such as in Ouyang et al. [18], but PES programs take the next step of tying financial compensation to measurements of ecosystem services. PES programs have been implemented across the world, from forests provisioning water in Brazil [19] to mangroves protecting coasts in the Maldives [20]. Grima et al. [21] analyzed 40 PES programs in Latin America and found that financial compensation structure is one of the key determinants of program success, but the relationship between compensation and effective provision of ecosystem services is complicated and requires further study. Tyack et al. [22] propose a PES program to protect the biodiversity of native plants, which is a similar context to the protection of endangered species habitats. Protecting native species provides benefits that could fund a PES program that is needed because landowners currently have an economic incentive to develop or extract resources. Piñeiro et al. [23] provide a scoping review of PES programs in the agricultural context, while Goldman et al. [24] point to the importance of monitoring for program evaluation to be possible. Zhang et al. [25] find that protecting habitat does not necessarily correlate well with protecting the biodiversity we care about, so it is important to tie PES programs to metrics that matter.
In the context of biodiversity in the United States, researchers have been able to use real-world data to answer questions about the effectiveness of listing species as endangered or threatened [26] and voluntary conservation tools like habitat-conservation plans [27], but there are still many questions about which regulatory tools hold the most promise as PES programs for preserving the habitats of endangered species. Experiments allow researchers to use random assignment to test the effectiveness of policies that have not yet been implemented. Although researchers must be aware of phenomena that may be peculiar to the lab [28], lab-based results can be an important first step in assessing which tools and policies hold promise for much more resource-intensive pilot programs and field experiments. Parkhurst and Shogren [29] performed a computer-based experiment and found that landowners respond positively to a policy that provides a bonus for the conservation of properties adjacent to other conserved properties. Suter et al. [30] looked at participation in and the intensity of use of common-pool resources under a range of policy treatments. By controlling conditions in the lab, Kerr et al. [31] used interdisciplinary tools to encourage ongoing participation in PES programs after financial incentives had ended. Lab experiments have been used to look at incentives relating to a range of agricultural policies [32]. Field experiments are often conducted to better understand the external validity of lab-based experiments and nail down details of policy implementation [33,34,35].
This paper contributes to the literature by identifying barriers to voluntary conservation with experimental tests of landowner behavior in the existing safe-harbor program and with a PES program that mimics the new and proposed markets for endangered species habitats in the US. The experiment involves random assignment into treatment and control groups to see how people respond to regulations in hypothetical scenarios. By tying performance in the scenarios to real monetary payoffs, participants have incentives to pay attention and try to take home more money [36]. In this experiment, safe-harbor agreements and high PESs decrease timber harvests, but low PESs—though paired with safe-harbor agreements—do not decrease harvests. The experiment allows for insights into which regimes are still effective despite weak enforcement mechanisms and the ways in which participants appear to avoid guilt associated with destroying hypothetical habitats. It therefore builds on research about crowding out of preferences [37,38,39,40], a literature that has found several examples of positive options crowding out other positive actions. Although this concern has been documented regularly in the computer lab, often using students as participants, there are external validity concerns about whether these results translate to experienced workers making higher stakes decisions in the real world.
The paper proceeds in Section 2 with a description of the methodology used to test how landowners may respond to existing and proposed regulatory regimes. Section 3 presents results of the experiment that suggest that financial incentives hold promise to increase participation. Section 4 includes discussion of barriers to success and the importance of context in this type of research. Section 5 concludes with consideration of the policy implications of the results for proposed PES programs.

2. Materials and Methods

2.1. Experimental Design

To test how landowners respond in various regulatory regimes, 139 participants—mostly students—were recruited at Vanderbilt University in the United States in 2015. The study was approved human subjects research by the Vanderbilt Institutional Review Board #140469. Students were informed of the opportunity to participate in the study through short informational sessions held before economics classes, so approximately half of the students were undergraduate students majoring in economics. Students received payment for participating. Table 1 provides summary statistics of the participant population. The student sample was male-skewed (64%) and had a large proportion of nonwhite participants (49%). One-quarter of participants were Democrat, one-quarter were Republican, and half were independent or other. Forty percent described themselves as environmentalists and about two-thirds were risk averse based on a question about how they would handle a windfall of money. Although there are external validity concerns that come with using a convenience sample of US college students, those concerns are less severe when the behavior is driven by general economic motivations, and further research can compare results across subject pools [41]. In the relatively context-rich experiment here, the external validity concerns—discussed in Section 4—are important to keep in mind.
Participants sat at computer stations for approximately 30 minutes as they engaged in the study, which was coded in z-Tree [42], and the text of which is available in supplementary materials online. Participants were given instructions and context: they were landowners with 100 acres of mature pine trees. Each of 20 rounds represented a year in which the participant could allow trees on the property to grow older and more valuable. In each round, participants were asked how many of the 100 acres they would like to harvest. Trees became worth more money as the trees grew older, as described in Table 2. Earnings from harvests were added to the students’ accounts, which were paid to them in cash at the end of the study. All participants went through practice rounds—at least three, and more if responses deviated from profit-maximizing play—which provided familiarity with the mechanics of harvesting trees and adding money to accounts.
In each round, there was a probability that an endangered woodpecker would move onto the property. This probability increased with the average age of trees on the property, with a 0% chance of woodpeckers for trees below 20 years old and up to a 20% chance of woodpeckers for trees 50 years old. Students received a copy of Table 2, so they were informed of the probabilities of woodpeckers moving in at different tree ages. Although the numbers are not exact, they approximate conditions for landowners with potential habitats for red-cockaded woodpeckers in North Carolina, USA [8].
In each year, participants were also given the option of investing $0.25 in habitat improvement to increase by 50% the chance that woodpeckers would move in during the next year. This temporary increase in the probability of woodpeckers moving in provided an approximation of such activities as controlled burns, which temporarily benefit species like woodpeckers by improving habitats but are costly for landowners.
Participants were randomly assigned to one of four groups and were informed of the following consequences of woodpeckers moving onto their property:
Strict Regulation Group: If woodpeckers moved onto the property, no more harvests were allowed, and no additional money was added to the account. This group could be considered the control, as it most closely resembles the general restrictions put in place under general FWS policies.
Safe-Harbor Agreement Group: Same as the Strict Regulation Group, except also offered the choice of entering a safe-harbor agreement in which the player agreed to harvest no more than five acres in each year in exchange for regulators agreeing not to ban harvests if woodpeckers did move onto the property. Players could withdraw from the agreement in any year. This group faced similar choices as landowners in areas where FWS offers safe-harbor agreements.
Low PES Group: Same as the Safe-Harbor Agreement Group, except also told that the player would receive a credit for each woodpecker that moved onto the property. If the player was in the agreement at the end of 20 years, each credit was worth between $1 and $2, with the exact price determined by a random number generator picking over a uniform distribution. The PES program was intended to mimic the potential incomes—including an element of uncertainty as to exact prices—that landowners could expect with tradable credits, such as under the proposed FWS program.
High PES Group: Same as the Low PES Group, except credits for woodpeckers were worth between $3 and $4.
Participants who were in safe-harbor agreements were able to exit them in any year by entering a harvest amount larger than the five acres allowed in the agreement. If landowners who were in a safe-harbor agreement entered a harvest amount that would dissolve the agreement, they were given a warning of the result of this choice and told they would not be able to reenter the agreement. If they currently had woodpeckers residing on their property, they were given an additional warning that their harvest activity went against the purpose of the safe-harbor agreement that they had entered, and that they would be sent to the end of the game if they continued with the harvest. However, these players were allowed to continue to break out of their agreements by harvesting more than five acres in that year before being sent to the end of the game. This meant that in the twentieth year of the simulation, players in agreements could break out of the safe-harbor agreement and harvest all of their trees, even if there were woodpeckers residing on their property. A financial incentive to break out of agreements allowed for variation in people leaving the agreements, which people are not quick to do, even when enforcement mechanisms are weak [43]. This aspect of the study design enabled insights into who violates agreements when there is weak enforcement, which is a concern in a context like endangered species preservation, in which there is asymmetric information about the property and its status as a habitat [44]. However, it also raises issues of external validity, since the real world does not typically have final periods in the same way.

2.2. Empirical Specifications

Participant behavior is analyzed with summary statistics and multivariate regression models. When regressing harvest behavior on landowner group and player demographics, models of the following form are used:
Harvest = α 2 SafeHarbor + α 3 LowPES + α 4 HighPES + X β + ε
The variables of interest are the dummy variables for groups. The included variables—SafeHarbor, LowPES, and HighPES—can be compared with the omitted category of landowners in the Strict Regulation group. X is a vector of demographic variables that includes age, sex, race, political party, self-identified environmentalist, and self-reported risk preferences—all variables that were obtained in the participant survey (see in the Supplementary Materials) that was administered after the experiment. Each observation is a participant-year, so one participant has up to 20 observations. Standard errors are clustered at the treatment group and, unless reported otherwise, fixed effects are included for each round of play. Observations include only active participants, meaning that players who have been sent to the end of the game because they have woodpeckers on property that is not currently in a conservation agreement are not included for those years in which they had no active choices. Including those observations does not meaningfully change the results but makes it more difficult to interpret choice variables when some players had no active choices to make.
Results are reported for an ordinary least squares (OLS) model, which assumes that explanatory variables have a linear effect on harvest acres. I also estimate parameters using a Tobit model, a nonlinear model that accounts for the truncated nature of a dependent variable [45]. In this case, the harvest amount is bounded on the lower side by zero acres and the upper side by one hundred acres. For a third model, I use a nonlinear Probit model on a binary dependent variable that has a value of one if the participant harvested any acres above zero.
Regressions of habitat improvement use similar OLS and Probit models with a binary dependent variable. In this case, the OLS model is a linear probability model. Variables of interest and explanatory variables are similar and standard errors are again clustered at the treatment group level and fixed effects are included for each round of play.

3. Results

Because players are randomized into groups, simple averages across groups can convey meaningful results. Regression techniques allow for controlling for demographic variables and testing how demographic variables are correlated with behavior in the study. Data and code are available in supplementary materials online.

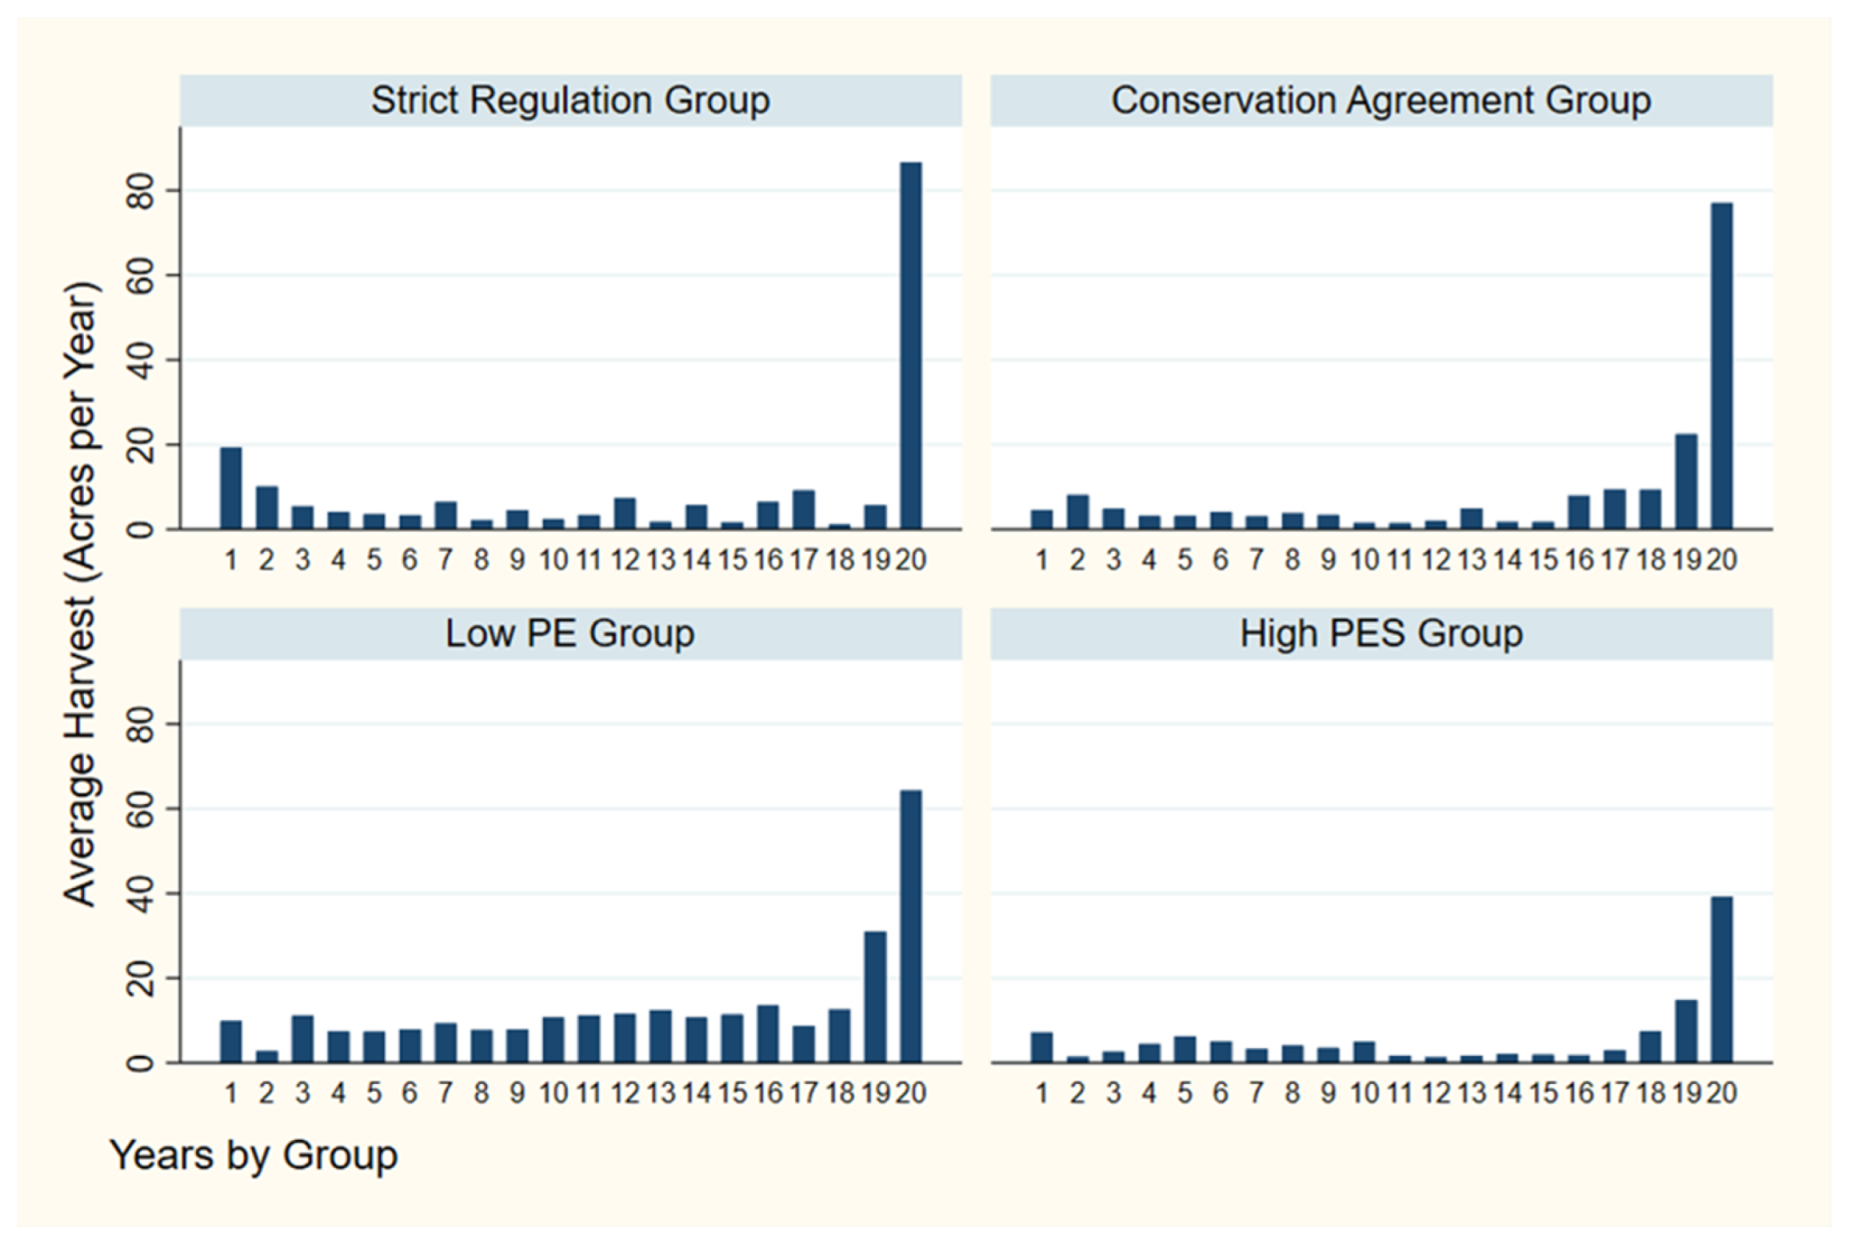
3.1. Harvest Behavior

As seen in Figure 1, landowners in all four of the groups tend to harvest a large number of acres in the final rounds, which fits with rational profit-maximizing behavior. There are also differences across the four groups in both harvest and habitat improvement activity, some of which are harder to explain with profit maximization.
Participants in the Strict Regulation Group harvest an average of 30 acres over the first two years, which is significantly more than any other group. This behavior is consistent with a strategy of harvesting enough in the first few years to bring the average age of trees down sufficiently to reduce the probability of woodpeckers moving in close to zero. The result mimics real-world behavior for those facing strict regulation [2]. Participants in the other three groups do not display this behavior of early habitat destruction, presumably because most of the participants in the Safe-Harbor and PES Groups (91%) start in conservation agreements that mitigate the consequences if woodpeckers move onto the property. In other words, the safe-harbor agreements appear to reduce preemptive habitat destruction, which also parallels real-world behavior [8].
As depicted in Table 3, the average annual harvest across the 20 years for those in the Strict Regulation Group is 8.8 acres. Those in the Safe-Harbor Agreement Group harvest an average of 7.8 acres while those in the Low PES Group harvest 13.0 acres, which is a statistically significant increase from the Strict Regulation Group. Since landowners in the Low PES have a financial reason to favor woodpeckers relatively more than landowners in the Safe-Harbor Agreement Group, it is surprising to see substantially more harvest activity, which harms woodpeckers, in the Low PES Group. A simple profit-maximization model would predict that those offered cash for woodpeckers would harvest fewer trees. The average harvest for the High PES Group is 5.8 acres—a statistically significant drop from the Strict Regulation Group—so higher financial incentives do seem to incline landowners towards habitat conservation.
To control for demographic variables, I use a regression model, as described in Section 2, and reported in Table 4. In the OLS model, the Safe-Harbor Agreement Group has a statistically significant coefficient indicating that participants in that group harvest an average of 1.1 fewer acres per year relative to the Strict Regulation Group, which is a 20% decrease from the sample-wide average harvest level of 5.5 acres per year. The Low PES Group harvests an average of 4.5 acres more than the Strict Regulation Group, which is an 82% increase over the sample-wide average. The High PES Group harvests about three fewer acres than the Strict Regulation Group, but this coefficient is not statistically significant. Controlling for demographic and risk-tolerance variables does not meaningfully change the size or significance of coefficients on the variables for the randomly assigned groups.
In the Tobit regression, the Low PES Group has increased harvests with a coefficient of 10.1. The High PES Group has decreased harvests with a coefficient of 6.4. There is no strong evidence of different behavior from the Safe-Harbor Agreement Group, with a coefficient that is not statistically significant.
In the Probit regression, both the Safe-Harbor Agreement and Low PES Groups are more likely to harvest than the Strict Regulation group. The sign flip from negative to positive on the Safe-Harbor Agreement Group coefficient, when compared with the OLS model, indicates that members of this group are more likely to harvest each year, but harvest fewer acres per harvest. This behavior is consistent with the insurance offered by safe-harbor agreements allowing landowners a guaranteed right to harvest a modest amount each year. Republicans appear more likely to harvest in the Probit model when compared with the omitted category of independents.
A regression that includes an interaction term for players in the Strict Regulation Group and the first period, reported in Table 5, indicates that those participants are more likely to engage in preemptive habitat destruction, with an increase of 10.3 acres in the first period relative to the other Groups. Older and nonwhite participants were less likely to engage in these large harvests that preemptively destroy habitat.
As seen in the large spikes in the last periods in Figure 1, the average participant harvests the majority of his or her trees in the final period. Many participants (39%) in the Safe-Harbor and PES Groups break out of safe-harbor agreements to make these large harvests, with an average 91-acre harvest for this subsample. A regression of this behavior, reported in Table 6, indicates that those in the Low PES Group are less likely to engage in this behavior and those in the High PES Group are much less likely to engage in this behavior. Republicans are more likely to exit agreements to make a large harvest and risk averse individuals are less likely to.

3.2. Habitat Improvement Behavior

As shown in Table 7, participants in the Strict Regulation Group do not engage in a substantial amount of habitat improvement—7% of the time—as expected because landowners tend to have negative incentives to do so. Those in the Safe-Harbor Agreement group are even less likely to invest in habitat improvement with a mean of 5% (p-value of difference from Strict Regulation = 0.01). With relatively weak financial incentives in the Low PES Group, players start to invest more in habitat improvement, with an average of 19% (p-value = 0.00) improving habitat each year. With stronger financial incentives in the High PES Group, 30% (p-value = 0.00) of participants improve habitat each year. The monotonic increase in habitat improvement investments with higher financial incentives fits with profit maximization.
However, not all investments in habitat improvement fit nicely with basic economic theory. Many landowners pair habitat improvement with a large harvest of trees. Of those who improve habitats, 7% of them had recently harvested 20 acres or more of trees. This percentage is even larger for those in the Strict Regulation and Safe Harbor Groups, with 32% of the habitat improvement behavior coming immediately after a tree harvest of over 20 acres. This behavior goes against predictions of profit-maximizing behavior, as it does not make sense to invest in habitat improvement—which increased the probability of woodpeckers in a multiplicative fashion—directly after a large harvest that made the probability of woodpeckers moving in zero. There may be an interaction with a taste for conservation—those who harvest a large number of acres, choosing financial gain over habitat protection, make a token contribution to habitat improvement in order to avoid feeling guilty.
The general result that the PES Groups invest in habitat improvement is confirmed with regression analysis, as reported in Table 8. Those in Low PES Group have an 11 percentage points increase in the probability of improving habitat, which is an 80% increase over the sample mean. Those in the High PES Group are 20 percentage points more likely to improve habitat, which is a 154% increase over the mean. Those who describe themselves as risk averse are less likely to invest in habitat improvement, perhaps because the financial returns to that investment come with a measure of uncertainty.

3.3. Other Outcomes

Landowner Profits

The final profits of players in the different groups provide information on how landowners fare financially in the alternative regulatory regimes. As seen in Figure 2, average profits increased as landowners made their way to later years in the simulation, with a spike in the final years as many landowners made large tree harvests or redeemed credits for woodpeckers on their properties. The average final payout was $16.22 for landowners in the Strict Regulation Group, $20.03 for those in the Safe Harbor Group, $20.33 for those in the Low PES Group, and $22.00 for those in the High PES Group.

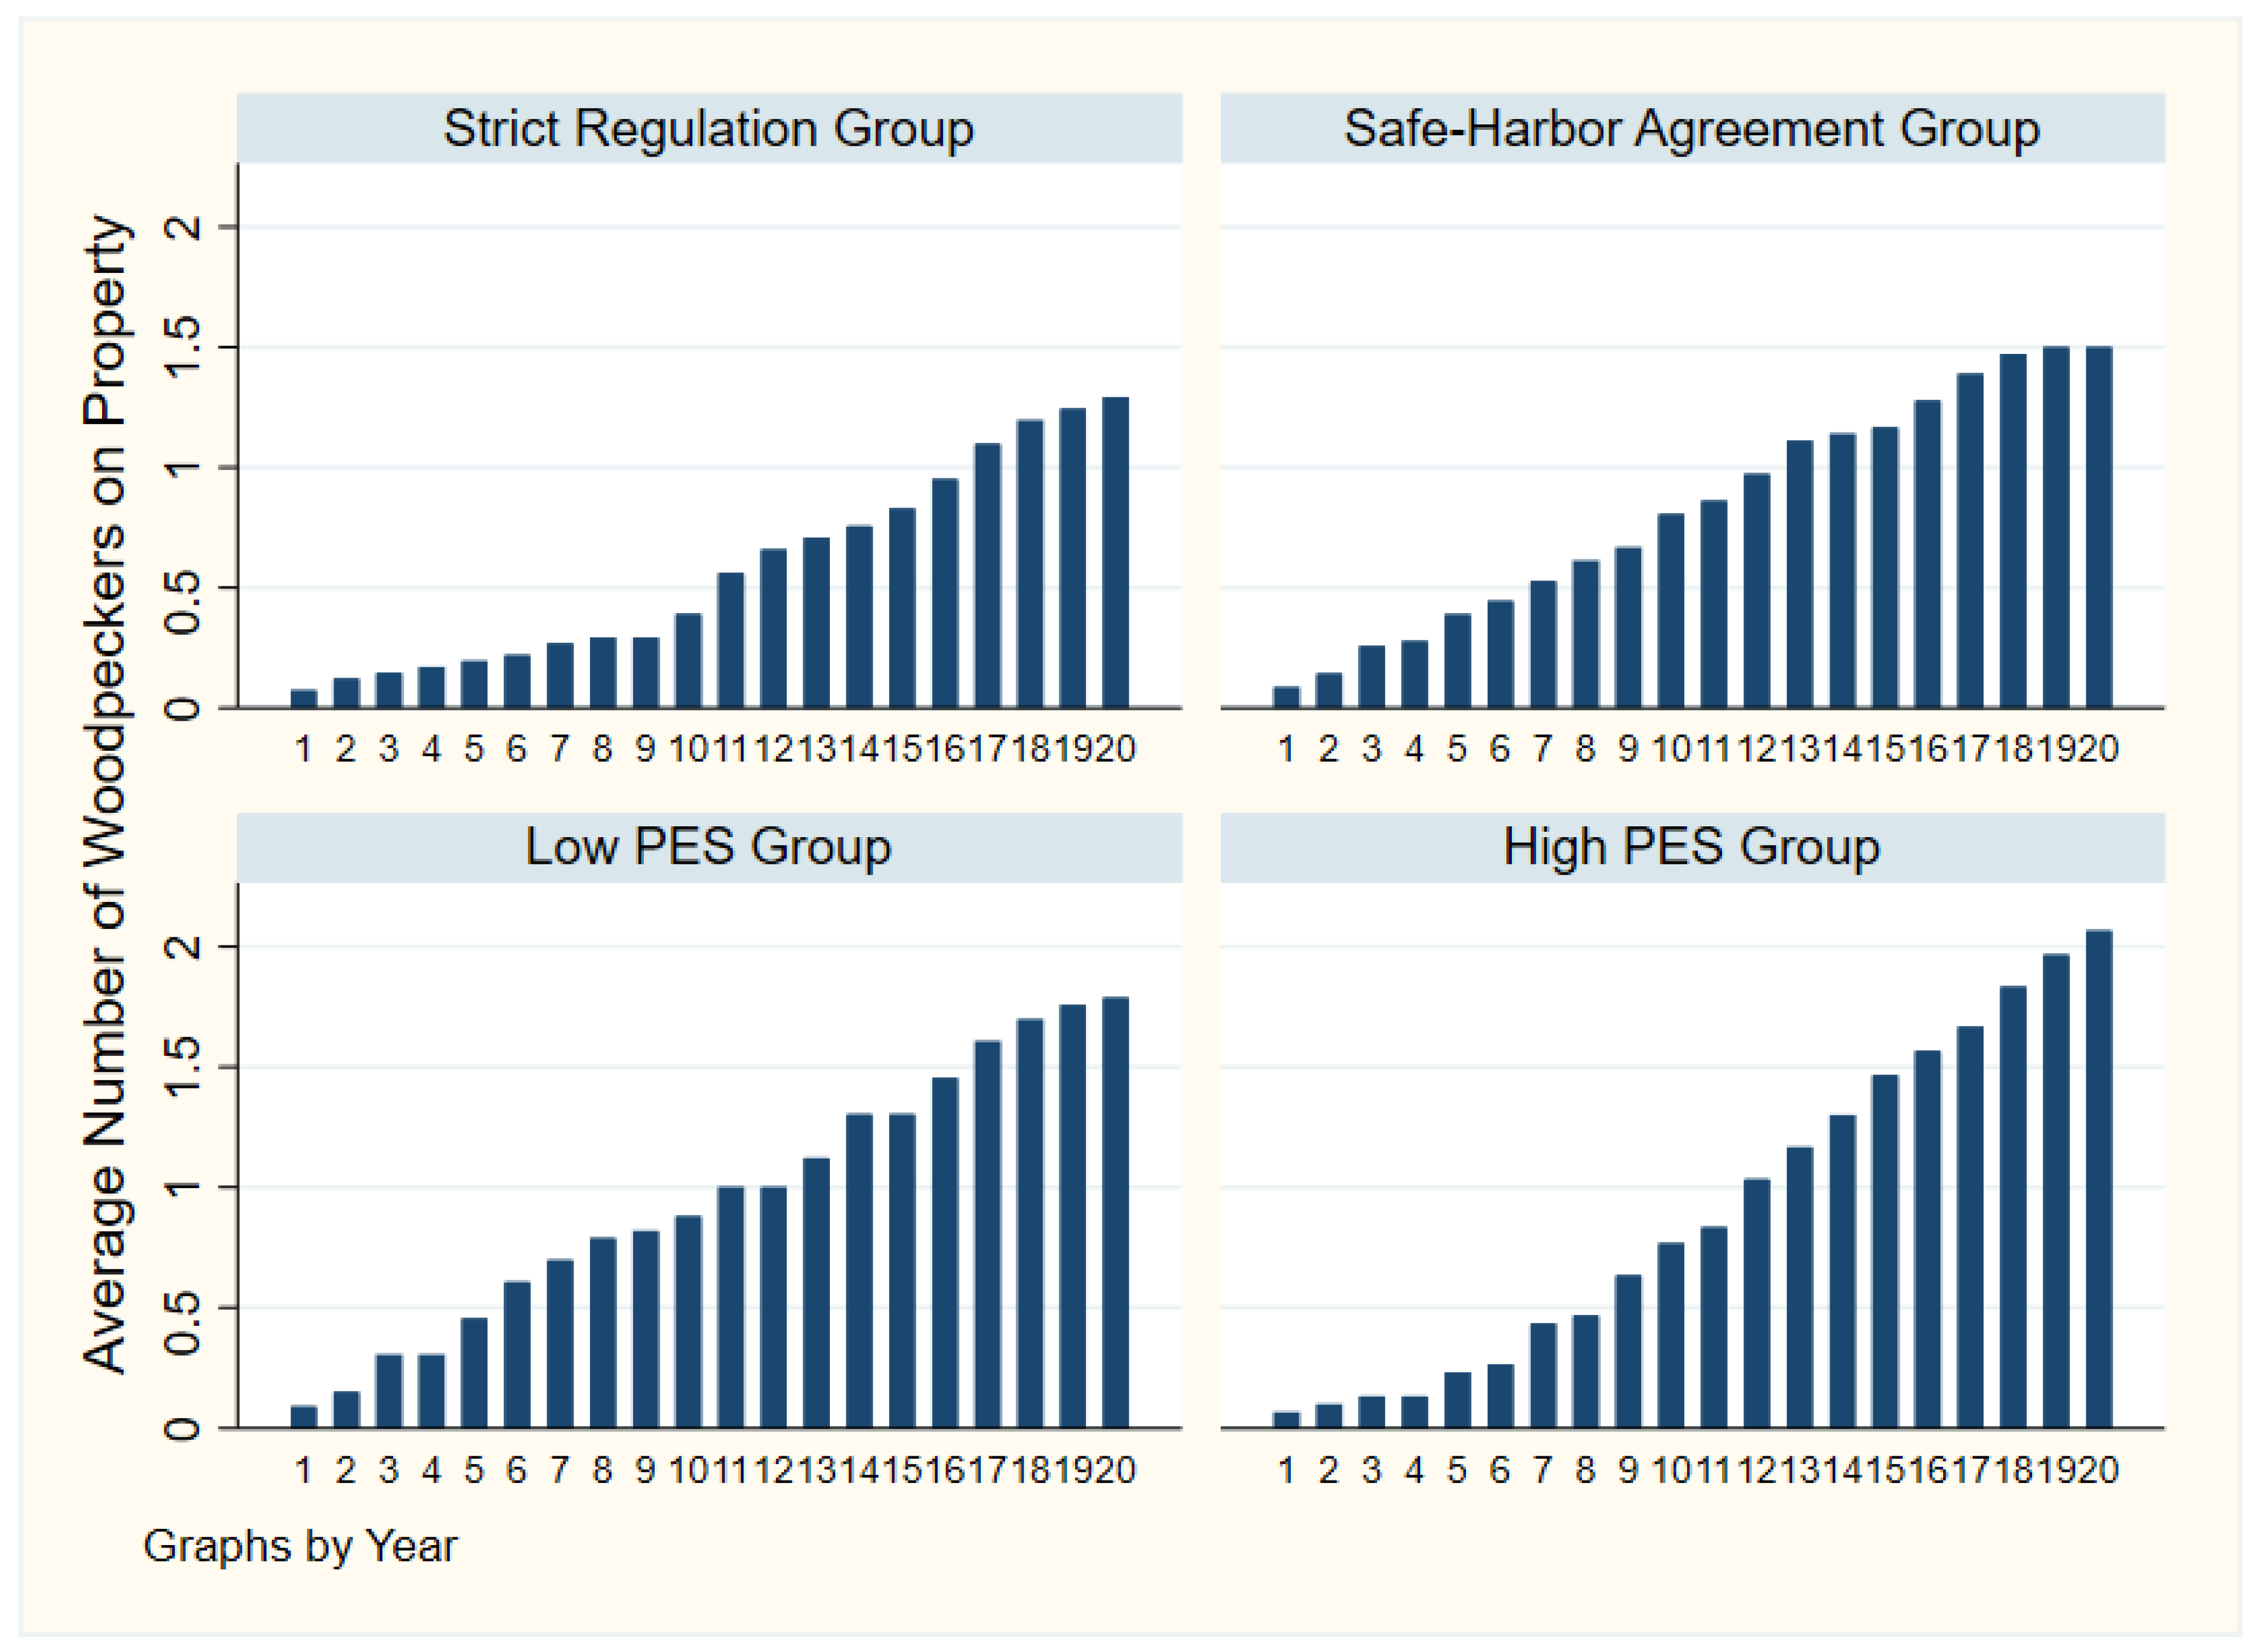
Woodpecker Populations

Although the simulation’s model of woodpecker success was a simple function of the average age of trees on a site, the results are informative about how much potential habitat there was for woodpeckers under the alternative regimes. In all of the four groups, the average number of woodpeckers increased as the simulation progressed through the 20 years, as seen in Figure 3. The average number of woodpeckers in the final year was 1.3 for the Strict Regulation Group, 1.5 for the Safe Harbor Group, 1.8 for the Low PES Group, and 2.1 for the High PES Group. Woodpeckers fared better when landowners were offered safe-harbor agreements, and even better when PES were offered.

4. Discussion

4.1. Promise of PES to Voluntary Conservation

The results of the experiment suggest that regulatory tools show promise when it comes to improving the current adversarial status quo under the ESA. Tools like safe-harbor agreements can decrease the amount of habitat destruction, which improves profits for landowners while providing benefits to endangered species. High PES can promote participation in voluntary conservation programs and decrease habitat destruction. PES can further encourage landowners to actively invest in habitat improvement, especially when payoffs are high.
But the results of the experiment also suggest that landowners may not think in purely profit-maximizing terms, pointing to three potential barriers to successful voluntary conservation.

4.2. First Barrier: Crowd out Taste for Conservation

First, offering PES for conservation may not always lead to more conservation; in this case, incentives to encourage endangered species may not always get landowners to provide more habitat. Participants in the Low PES Group harvested more than double the acreage of potential endangered species habitat per year compared to the Strict Regulation Group even though they were offered the same agreement as landowners in the Safe-Harbor Agreement Group with an additional financial bonus for woodpeckers. There is some evidence in the economics literature that offering either rewards or fines can move people towards thinking of the behavior in question as having a price attached to it [16]. If participants in the Low PES Group start thinking of woodpeckers as a financial vehicle when they are told that credits for woodpeckers are worth $1 to $2, those participants may decide that, from a financial standpoint, it makes more sense to invest in tree harvests than in woodpecker habitat. Meanwhile, participants in the Safe Harbor Agreement Group are simply offered agreements that sound like attractive insurance policies against regulatory restrictions. In other words, the offer of financial reward may have a framing effect on the way landowners think about woodpeckers. A taste for conservation, perhaps from an altruistic sense of wanting to do right, may be crowded out by PES after this shift in framing.
With the financial incentive ratcheted up to $3 to $4 per woodpecker for the High PES Group, the financial calculus tips away from tree harvests and towards woodpeckers and behavior is more in line with profit-maximization behavior. The role of a taste for conservation is an important area of further study, especially considering that the woodpeckers that were being protected in this experiment were hypothetical. When real species are at stake, the taste for conservation may be more powerful. This could make it a stronger factor in decision making but could also make it less susceptible to shifts in framing. The extent to which this barrier is context-specific and may be of less concern to experienced professionals as opposed to undergraduate student subjects is an important area for further study.
Speaking to a particular policy, as FWS determines how to distribute credits for voluntary conservation (or approve state programs that do so) and parameters of the new regulation-driven market, the agency should keep in mind that a generous distribution of credits is more likely to lead to a low market price and landowners may behave more like those in the Low PES Group. Instead, more stringent standards for earning credits would make it more likely that the market price puts landowners in a situation similar to High PES where some decide to go all-in on endangered species habitats because of the financial incentive to do so. There is admittedly a difficult balance to strike between encouraging participation in the market, which means making it easy enough to obtain credits to make it preferable to habitat destruction and encouraging a high enough market price to make the financial calculus favorable [46]. While there is great promise in the use of markets to encourage things like provision of wildlife habitat, there is also the possibility that market-driven incentives crowd out other reasons for landowners to conserve wildlife habitat.

4.3. Second Barrier: Guilt Avoidance Mechanism

A second barrier to voluntary conservation is that offering a form of token payment may alleviate guilt in a way that leads to more anti-conservation behavior. In this experiment, participants often deviate from profit-maximizing behavior by paying money to improve woodpecker habitat immediately after harvesting a large number of acres of trees in a way that does not make financial sense. These participants pay $0.25 for the probability of woodpeckers moving in to go from 0% to 0%, so they pay money for no clear change in outcomes. This behavior suggests that the role of a taste for conservation in the utility function of landowners is more complex than a simple desire for woodpeckers to do well; there may be an element of guilt avoidance. Participants make a relatively large amount of money by harvesting many acres of trees, which harms woodpeckers, but avoid feeling guilty about it by contributing a token amount to improve woodpecker habitats. Even though this does not make sense financially, it is a rational action if a small financial contribution alleviates the disutility of guilt by more than it decreases utility by a small drop in money. This finding suggests that the preference for conservation enters the utility function in a way more complicated than a simple preference for woodpeckers to do well, and there may be an element of disutility associated with guilt when the landowners engage in activity that harms woodpeckers. The role of regret and precaution have been modeled [47], but more research is needed into the role of guilt avoidance in conservation situations.
The FWS should consider how opportunities to trade habitat credits may provide a mechanism for guilt avoidance. As seen in the habitat improvement behavior of participants who put a token amount of money toward habitat improvement right after they harvested a large amount of timber, the opportunity to contribute toward a habitat fund may in some cases prompt habitat destruction by landowners who use the habitat fund as a mechanism to avoid feeling guilty about the plight of the endangered species. Conservation funds and mitigation banks are important tools that provide people with opportunities to contribute to the conservation of habitats, but FWS should keep in mind that the opportunity to pay a penance for a sin may lead to more sins being committed, and perhaps organize policies in ways that discourage token contributions.

4.4. Third Barrier: Exit or Breach with Weak Enforcement

An example of how participant behavior sometimes track predictions of profit-maximizing behavior—but can present a third barrier to voluntary conservation—is in how participants systematically break out of safe-harbor agreements in the final years of the experiment. Thirty-nine percent of participants who choose to enter conservation agreements also choose to leave them in the final years. When they do, they generally harvest all of the trees on the property. This result—largely driven by the setup of the experiment with a fixed timeframe—provides insight into how landowners may act when enforcement threats are not credible. Regulators running voluntary programs that allow for unilateral exit from agreements must understand what may drive landowners to leave those agreements or stay in them. In this study, participants in the High PES Group tended to stay in agreements so they could cash out valuable credits for woodpeckers. The weaker financial incentives in the Low PES Group were insufficient to effectively keep participants in the agreements in the final periods.

4.5. External Validity: The Importance of Context

The promise held and the barriers identified in the results of this study rely to some extent on the context of this experiment. The details of the context of the experiment matter [48], and care was taken to conduct the experiment in a way that minimized outside influences. Despite the care taken with the experimental methodology, there are external validity concerns about whether the observed choices in the lab will look like real-world choices [36]. Undergraduate students with little experience may be more prone to behavioral responses that deviate from rational action than experienced professionals who are making decisions about much larger stakes [41]. However, there is evidence that results of general economic motivations translate across subject pools, especially when in general settings [41]. In this case, the experiment involves general economic motivations for profit, but also other potential motivations like a taste for conservation and guilt avoidance. There is also quite extensive context given in this experiment, with role-playing as landowners as opposed to blank-slate choices that are void of context. This makes it harder to draw conclusions about how people may respond in other contexts beyond private landowners protecting endangered species habitat in the United States. Although that is an important issue in its own right, there are myriad other contexts that can potentially benefit from PES programs involving similar tradeoffs, as discussed in Section 1. The extent to which these experimental results translate to a more experienced subject pool, to real world decisions, and to contexts outside the USA, are important areas for further research.

5. Conclusions

Voluntary conservation, especially when bolstered by PES, holds promise to decrease the adversarial relationship between regulators and stakeholders. This experiment provides evidence that safe-harbor agreements can get landowners to alter activities like timber harvests that destroy habitat. PES can encourage participation in programs to reduce habitat destruction and actively improve habitat. Sellable credits can also alter harvest behavior and additionally prompt landowners to actively invest in habitat improvement. In line with Zhang et al. [25], it is important to line up PES metrics with the biodiversity outcome that we care most about, in this case the successful growth of endangered species populations as opposed to secondary metrics like habitat acreage. Goldman et al. [24] point out the difficulty in program evaluation with field experiments of PES programs because it is so difficult to monitor and gather good data, so these experimental results suggest promising avenues of research to fill in gaps about where and how to create effective PES programs.
It is important to consider a risk that low PESs may crowd out some of the other reasons for landowners to provide wildlife habitat, so regulation-driven markets should be designed with this barrier in mind. A second barrier to successful conservation is that programs that allow for relatively small financial contributions may provide a mechanism for landowners to avoid feeling guilty about habitat destruction, and therefore encourage more habitat destruction. A third barrier to consider is that participants are likely to exit or breach agreements to the detriment of conservation when there are incentives to do so and weak enforcement mechanisms.
Despite the challenges in design and implementation of PES in voluntary conservation programs, changes from the status quo hold the possibility of improving conditions for landowners and for endangered species. The lessons from PES programs in this context can also provide insights into a range of environmental issues from carbon sequestration to flood mitigation where PES can help promote voluntary conservation but might have to overcome barriers first. Further study of the external validity of these phenomena will be important next steps as PES programs are planned and implemented.

Supplementary Materials

The following are available online at https://www.mdpi.com/article/10.3390/su132212346/s1, Supplementary File: ENDANGERED SPECIES STUDY TEXT.

Funding

This research was funded by the Ph.D. Program in Law and Economics at Vanderbilt University. This research received no external funding.

Institutional Review Board Statement

The study was conducted according to the guidelines of the Declaration of Helsinki, and approved by the Institutional Review Board of Vanderbilt University (140469 approved on 24 March 2014).

Informed Consent Statement

Informed consent was obtained from all subjects involved in the study.

Data Availability Statement

The data presented in this study are available as supplementary materials posted online and on request from the corresponding author.

Acknowledgments

Thanks to my dissertation committee for extremely helpful feedback. Suggestions from referees were also instrumental to improving the paper.

Conflicts of Interest

The author declares no conflict of interest.

References

  1. Langpap, C.; Kerkvliet, J.; Shogren, J.F. The Economics of the Endangered Species Act: A Review of Recent Developments. Rev. Environ. Econ. Policy 2018, 12, 69–91. [Google Scholar] [CrossRef] [Green Version]
  2. Lueck, D.; Michael, J.A. Preemptive Habitat Destruction under the Endangered Species Act. J. Law Econ. 2003, 46, 27–60. [Google Scholar] [CrossRef]
  3. Ruhl, J.B. Endangered Species Act and Private Property: A Matter of Timing and Location. Cornell J. Law Public Policy 1998, 8, 37–53. [Google Scholar]
  4. Langpap, C. Conservation of Endangered Species: Can Incentives Work for Private Landowners? Ecol. Econ. 2006, 57, 558–572. [Google Scholar] [CrossRef] [Green Version]
  5. U.S. Fish and Wildlife Service. The Safe Harbor Program for Red-Cockaded Woodpeckers in North Carolina; Government Printing Office: Atlanta, GA, USA, 2006.
  6. Bean, M.J. Endangered Species Safe Harbor Agreements: An Assessment; Sand County Foundation: Madison, WI, USA, 2017. [Google Scholar]
  7. U.S. Fish and Wildlife Service. Habitat Conservation Planning Handbook; Government Printing Office: Washington, DC, USA, 2016.
  8. Byl, J.P. Perverse Incentives and Safe Harbors in the Endangered Species Act: Evidence from Timber Harvests near Woodpeckers. Ecol. Econ. 2019, 157, 100–108. [Google Scholar] [CrossRef]
  9. Mandle, L.; Symington, M. Voluntary Mechanisms. In Green Growth That Works; Mandle, L., Ouyang, Z., Salzman, J.E., Daily, G., Eds.; Island Press: Washington, DC, USA, 2019. [Google Scholar]
  10. Kohsaka, R.; Uchiyama, Y. Motivation, strategy and challenges of conserving urban biodiversity in local contexts: Cases of 12 municipalities in Ishikawa, Japan. Procedia Eng. 2017, 198, 212–218. [Google Scholar] [CrossRef]
  11. Uchiyama, Y.; Kohsaka, R. Application of the City Biodiversity Index to populated cities in Japan: Influence of the social and ecological characteristics on indicator-based management. Ecol. Indic. 2019, 106, 105420. [Google Scholar] [CrossRef]
  12. Deslauriers, M.R.; Asgary, A.; Nazarnia, N.; Jochen, A.G.J. Implementing the connectivity of natural areas in cities as an indicator in the City Biodiversity Index (CBI). Ecol. Indic. 2018, 94, 99–113. [Google Scholar] [CrossRef]
  13. Quevedo, J.M.D.; Uchiyama, Y.; Kohsaka, R. A blue carbon ecosystems qualitative assessment applying the DPSIR framework: Local perspective of global benefits and contributions. Mar. Policy 2021, 128, 104462. [Google Scholar] [CrossRef]
  14. U.S. Fish and Wildlife Service. Policy Regarding Voluntary Prelisting Conservation; Actions. 79 Fed. Reg. 42525, 22 July 2014; Government Publishing Office: Washington, DC, USA, 2014.
  15. Li, Y.W.; Male, T. Pre-Listing Conservation: Law, Policy, and Pilot Projects. In Proactive Strategies for Protecting Species; Donlan, C.J., Ed.; University of California Press: Berkeley, CA, USA, 2015. [Google Scholar]
  16. Gneezy, U.; Aldo, R. A Fine is a Price. J. Leg. Stud. 2000, 29, 1. [Google Scholar] [CrossRef] [Green Version]
  17. Hauge, K.E. Generosity and Guilt: The Role of Beliefs and Moral Standards of Others. J. Econ. Psychol. 2016, 54, 35–43. [Google Scholar] [CrossRef]
  18. Ouyang, Z.; Zheng, H.; Xiao, Y.; Polasky, S.; Liu, J.; Xu, W.; Wang, Q.; Zhang, L.; Xiao, Y.; Rao, E.; et al. Improvements in Ecosystem Services from Investments in Natural Capital. Science 2016, 352, 1455–1459. [Google Scholar] [CrossRef]
  19. Sone, J.S.; Gesualdo, G.C.; Zamboni, P.A.P.; Vieira, N.O.M.; Mattos, T.S.; Carvalho, G.A.; Rodrigues, D.B.B.; Sobrinho, T.A.; Oliveira, P.T.S. Water provisioning improvement through payment for ecosystem services. Sci. Total Environ. 2019, 655, 1197–1206. [Google Scholar] [CrossRef]
  20. Curnick, D.J.N.; Pettorelli, A.A.; Amir, T.; Balke, E.B.; Barbier, S.; Crooks, F.; Dahdouh-Guebas, C.; Duncan, C.; Endsor, D.A.; Friess, A.; et al. The value of small mangrove patches. Science 2019, 363, 239. [Google Scholar] [CrossRef] [Green Version]
  21. Grima, N.; Simron, J.S.; Smetschka, B.; Ringhofer, L. Payment for Ecosystem Services (PES) in Latin America: Analysing the performance of 40 case studies. Ecosyst. Serv. 2016, 17, 24–32. [Google Scholar] [CrossRef]
  22. Tyack, N.; Dempewolf, H.; Khoury, C.K. The Potential of Payment for Ecosystem Services for Crop Wild Relative Conservation. Plants 2020, 9, 1305. [Google Scholar] [CrossRef] [PubMed]
  23. Piñeiro, V.; Arias, J.; Dürr, J.; Elverdin, P.; Ibáñez, A.M.; Kinengyere, A.; Opazo, C.M.; Owoo, N.; Page, J.R.; Prager, S.D.; et al. A scoping review on incentives for adoption of sustainable agricultural practices and their outcomes. Nat. Sustain. 2020, 3, 809–820. [Google Scholar] [CrossRef]
  24. Goldman, R.L.; Tallis, H.; Kareiva, P.; Gretchen, C.D. Field Evidence that Ecosystem Service Projects Support Biodiversity and Diversify Options. Proc. Natl. Acad. Sci. USA 2008, 105, 9445–9448. [Google Scholar] [CrossRef] [Green Version]
  25. Zhang, L.; Turvey, S.T.; Chapman, C.; Fan, P. Effects of Protected Areas on Survival of Threatened Gibbons in China. Conserv. Biol. 2020, 35, 1288–1298. [Google Scholar] [CrossRef] [PubMed]
  26. Ferraro, P.J.; McIntosh, C.; Ospina, M. The Effectiveness of the U.S. Endangered Species Act: An Econometric Analysis Using Matching Methods. J. Environ. Econ. Manag. 2007, 54, 245–261. [Google Scholar] [CrossRef]
  27. Langpap, C.; Kerkvliet, J. Endangered Species Conservation on Private Land: Assessing the Effectiveness of Habitat Conservation Plans. J. Environ. Econ. Manag. 2012, 64, 1–15. [Google Scholar] [CrossRef] [Green Version]
  28. Brick, C.; David, K.S. When Does Being Watched Change Pro-Environmental Behaviors in the Laboratory? Sustainability 2021, 13, 2766. [Google Scholar] [CrossRef]
  29. Parkhurst, G.M.; Shogren, J.F. Spatial Incentives to Coordinate Contiguous Habitat. Ecol. Econ. 2007, 64, 344–355. [Google Scholar] [CrossRef]
  30. Suter, J.F.; Collie, S.; Messer, K.D.; Duke, J.M.; Michael, H.A. Common Pool Resource Management at the Extensive and Intensive Margins: Experimental Evidence. Environ. Resour. Econ. 2019, 73, 973–993. [Google Scholar] [CrossRef]
  31. Kerr, J.M.; Lapinski, M.K.; Liu, R.W.; Zhao, J. Long-Term Effects of Payments for Environmental Services: Combining Insights from Communication and Economics. Sustainability 2017, 9, 1627. [Google Scholar] [CrossRef] [Green Version]
  32. Mesa-Vázquez, E.; Velasco-Muñoz, J.F.; Aznar-Sánchez, J.A.; López-Felices, B. Experimental Economics in Agriculture: A Review of Worldwide Research. Agronomy 2021, 11, 1566. [Google Scholar] [CrossRef]
  33. Newell, L.W.; Stephen, K.S. Real-Payment Choice Experiments: Valuing Forested Wetlands and Spatial Attributes Within a Landscape Context. Ecol. Econ. 2013, 92, 37–47. [Google Scholar] [CrossRef]
  34. Dolan, P.; Metcalfe, R. Neighbors, Knowledge, and Nuggets: Two Natural Field Experiments on the Role of Incentives on Energy Conservation. In Becker Friedman Institute for Research in Economics Working Paper No. 2589269; University of Chicago: Chicago, IL, USA, 2015; Available online: https://ssrn.com/abstract=2589269 (accessed on 1 November 2021).
  35. Kecinski, M.; Keisner, D.K.; Kent, D.M.; William, D.S. Measuring Stigma: The Behavioral Implications of Disgust. Environ. Resour. Econ. 2018, 70, 131–146. [Google Scholar] [CrossRef] [Green Version]
  36. List, J.A.; Sadoff, S.; Wagner, M. So You Want to Run an Experiment, Now What? Some Simple Rules of Thumb for Optimal Experimental Design. Exp. Econ. 2011, 14, 439–457. [Google Scholar] [CrossRef]
  37. Banerjee, P.; Shogren, J.F. Material Interests, Moral Reputation, and Crowding Out Species Protection on Private Land. J. Environ. Econ. Manag. 2012, 63, 137–149. [Google Scholar] [CrossRef]
  38. Wunder, S. When Payments for Environmental Service Will Work for Conservation. Conserv. Lett. 2013, 6, 230–237. [Google Scholar] [CrossRef]
  39. Kits, G.J.; Adamowicz, W.L.; Boxall, P.C. Do Conservation Auctions Crowd out Voluntary Environmentally Friendly Activities? Ecol. Econ. 2014, 105, 118–123. [Google Scholar] [CrossRef]
  40. Rode, J.; Gómez-Baggethun, E.; Krause, T. Motivation Crowding by Economic Incentives in Conservation Policy: A Review of the Empirical Evidence. Ecol. Econ. 2015, 117, 270–282. [Google Scholar] [CrossRef]
  41. Fréchette, G.R. Laboratory Experiments: Professionals versus Students. In Handbook of Experimental Economics; Guillame, R.F., Adrew, S., Eds.; Oxford University Press: Oxford, UK, 2015; pp. 360–390. [Google Scholar]
  42. Fischbacher, U. Z-Tree: Zurich Toolbox for Ready-made Economic Experiments. Exp. Econ. 2007, 10, 171–178. [Google Scholar] [CrossRef] [Green Version]
  43. Wilkerson-Ryan, T. Incentives to Breach. Am. Law Econ. Rev. 2015, 17, 290–311. [Google Scholar] [CrossRef]
  44. Polasky, S.; Doremus, H. When the Truth Hurts: Endangered Species Policy on Private Land with Private Information. J. Environ. Econ. Manag. 1998, 35, 22–47. [Google Scholar] [CrossRef] [Green Version]
  45. Tobin, J. Estimation of Relationships for Limited Dependent Variables. Econometrica 1958, 26, 24–36. [Google Scholar] [CrossRef] [Green Version]
  46. Salzman, J.; Ruhl, J.B. Currencies and Commodification of Environmental Law. Stanf. Law Rev. 2000, 53, 607. [Google Scholar] [CrossRef] [Green Version]
  47. Sims, C.; Finnoff, D.; Hastings, A.; Hochard, J. Listing and Delisting Thresholds under the Endangered Species Act. Am. J. Agric. Econ. 2017, 99, 549–570. [Google Scholar] [CrossRef]
  48. Fréchette, G.R. Session Effects in the Laboratory. Exp. Econ. 2012, 15, 485–498. [Google Scholar] [CrossRef] [Green Version]
Figure 1. Harvest Behavior over 20 Years by Group. Notes: Average harvest per year for all active landowners, excluding landowners after they were sent to the end of the game if woodpeckers moved onto properties not covered by agreements.
Sustainability 13 12346 g001
Figure 2. Landowner Profits over 20 Years by Group. Notes: Average profits per year by landowner group.
Sustainability 13 12346 g002
Figure 3. Woodpeckers over 20 Years by Group. Notes: Average woodpeckers per year by landowner group.
Sustainability 13 12346 g003
Table 1. Summary Statistics of Participants.
Participant AttributesMean
(Standard Deviation)
Strict Regulation Group

Safe-Harbor Agreement Group
0.29
(0.46)
0.25

Low PES Group
(0.44)
0.24

High PES Group
(0.43)
0.22

Age
(0.41)
19.65

Male
(2.49)
0.64

Nonwhite
(0.48)
0.49

Republican
(0.50)
0.23
(0.42)
Democrat0.25
(0.43)
Environmentalist0.39
(0.49)
Risk Averse0.63
(0.48)
Notes: N = 139; standard deviations in parentheses; all variables except age are indicator variables.
Table 2. Timber Value and Woodpecker Probability by Tree Age within Experiment.
Tree AgeTimber ValueProbability of Woodpeckers
20$4.240%
25$6.065%
30$8.0010%
35$9.9713%
40$11.9115%
45$13.7418%
50$15.0920%
Notes: Values used in computer-based experiment and provided to participants. Numbers are intended to approximate conditions for landowners with mature pine in North Carolina, USA (Byl 2019).
Table 3. Average Timbers Harvests (Acres/Year) by Groups.
Strict Regulation Group
N = 599
Safe-Harbor Agreement Group
N = 646
8.816
(21.733)
7.837
(21.449; 0.247)
Low PES Group
N = 639
High PES Group
N = 597
12.994
(30.546; 0.001)
5.762
(18.392; 0.001)
Notes: Standard deviations and p-value of t-test for difference in means compared to Strict Regulation Group in parentheses. Each observation is one landowner-year. Includes all active landowners, excluding landowners after they were sent to the end of the game because woodpeckers moved onto properties when the land was not in a safe-harbor agreement.
Table 4. Regression of Harvest Behavior.
(1) OLS Model(2) Tobit Model(3) Probit Model
Safe-Harbor Agreement Group–1.07 *
(0.39)
2.71
(1.88)
0.24 ***
(0.02)
Low PES Group4.49 ***
(0.33)
10.11 ***
(0.99)
0.19 ***
(0.03)
High PES Group–2.97
(1.59)
–6.40 ***
(1.65)
–0.08
(0.08)
Age–0.22
(0.29)
0.24
(0.36)
0.03
(0.04)
Male–0.33
(2.36)
–2.14
(5.18)
–0.09
(0.19)
Nonwhite–0.19
(0.95)
1.89
(2.04)
0.12
(0.11)
Republican1.92
(2.46)
7.85
(5.24)
0.26 ***
(0.10)
Democrat–0.08
(1.90)
2.28
(1.54)
0.13
(0.11)
Environmentalist–0.92
(1.07)
–1.05
(1.21)
0.00
(0.12)
Risk Averse–0.96
(0.492)
0.81
(2.14)
0.11
(0.08)
Constant13.816 *
(5.562)
–9.15
(15.46)
–0.54
(0.83)
R-squared0.273
Notes: N = 2424; *** p < 0.01, * p < 0.10. Standard errors reported in parentheses, clustered by treatment group. (1) is an OLS model with the dependent variable of harvest in acres. Each observation is one landowner-year. Fixed effects for 20 years of the study included. Includes all active landowners, excluding landowners after they were sent to the end of the game because woodpeckers moved onto properties when the land was not in a safe-harbor agreement. Coefficients for Group dummy variables are relative to the omitted Strict Regulation Group. (2) is a Tobit regression with the same dependent variable, and (3) is a Probit regression with an indicator variable for harvest.
Table 5. Regression of Preemptive Habitat Destruction.
OLS Model
Strict Regulation Group * Period 110.28 **
(1.82)
Strict Regulation Group1.47
(1.29)
Period 12.45
(4.71)
Age–0.43 ***
(0.11)
Male–0.29
(2.93)
Nonwhite–2.66 ***
(0.52)
Republican–0.99
(2.80)
Democrat–1.38
(2.43)
Environmentalist–1.16
(2.24)
Risk Averse0.89
(0.65)
Constant15.86 **
(4.79)
Notes: N = 403; R-squared = 0.06; *** p < 0.01, ** p < 0.05. Standard errors reported in parentheses, clustered by treatment group. Includes first three periods to focus on early play. Strict Regulation Group is compared with omitted categories of those in other Groups.
Table 6. Regression of Exiting Safe-Harbor Agreements to Make Large Harvest.
OLS Model
Low PES Group–0.005 **
(0.001)
High PES Group–0.021 ***
(0.001)
Age–0.001
(0.001)
Male0.002
(0.001)
Nonwhite0.003
(0.005)
Republican0.007 **
(0.001)
Democrat0.003
(0.005)
Environmentalist0.005
(0.005)
Risk Averse–0.009 **
(0.001)
Constant0.05 **
(0.01)
Notes: N = 1865; R-squared = 0.17; *** p < 0.01, ** p < 0.05. Standard errors reported in parentheses, clustered by treatment group. Includes first three periods to focus on early play. Strict Regulation Group is compared with omitted categories of those in other Groups.
Table 7. Habitat Improvement by Groups.
Strict Regulation Group
N = 599
Safe-Harbor Agreement Group
N = 646
0.072
(0.258)
0.050
(0.217; 0.010)
Low PES Group
N = 639
High PES Group
N = 597
0.189
(0.392; 0.000)
0.302
(0.459; 0.000)
Notes: Standard deviations and p-value of t-test for difference in means compared to Strict Regulation Group in parentheses. Each observation is one landowner-year. Includes all active landowners, excluding landowners after they were sent to the end of the game because woodpeckers moved onto properties when the land was not in a safe-harbor agreement.
Table 8. Regression of Habitat Improvement Behavior.
(1) OLS Model(2) Probit Model
Safe-Harbor Agreement Group–0.013
(0.007)
–0.124 ***
(0.039)
Low PES Group0.117 ***
(0.015)
0.651 ***
(0.028)
High PES Group0.223 ***
(0.024)
0.961 ***
(0.028)
Age0.012 *
(0.005)
0.053 ***
(0.011)
Male0.001
(0.030)
0.003
(0.142)
Nonwhite–0.069
(0.043)
–0.297 *
(0.177)
Republican–0.020
(0.033)
0.042
(0.209)
Democrat0.007
(0.053)
0.117
(0.183)
Environmentalist
0.030
(0.046)
0.122
(0.181)
Risk Averse–0.074
(0.054)
–0.357 *
(0.181)
Constant–0.103 *
(0.041)
–1.729 ***
(0.353)
R-squared0.127
Notes: N = 2424; *** p < 0.01, * p < 0.10. Standard errors reported in parentheses, clustered by treatment group. (1) is a linear probability (OLS) model with an indicator-dependent variable of whether a participant invested in habitat improvement. Each observation is one landowner-year. Fixed effects for each of 20 years in the study included. Includes all active landowners, excluding landowners after they were sent to the end of the game because woodpeckers moved onto properties when the land was not in a safe-harbor agreement. Coefficients for Group dummy variables are relative to the omitted Strict Regulation Group. (2) is a Probit regression with the same dependent variable.
Publisher’s Note: MDPI stays neutral with regard to jurisdictional claims in published maps and institutional affiliations.

