Article

Legume Nitrogen Fixation and Symbioses in Low-Inputs Rainfed Rice Rotations

1
Laboratoire des Radio Isotopes, Department of Agronomy, University of Antananarivo, BP 3383, Route d’Andraisoro, Antananarivo 101, Madagascar
2
Eco&Sols, Univ Montpellier, CIRAD, INRAe, IRD, Montpellier SupAgro, 34060 Montpellier, France
3
CIRAD, UPR GECO, 97285 Le Lamentin, France
4
GECO, Univ Montpellier, CIRAD, 34398 Montpellier, France
5
CIRAD, UPR AIDA, 34398 Montpellier, France
6
AIDA, Univ Montpellier, CIRAD, 34398 Montpellier, France
7
Centre National de Recherche Appliquée au Développement Rural (FOFIFA), SRR, BP 230, Antsirabe 110, Madagascar
8
CIRAD, UPR AIDA, 97743 Saint-Denis, France
*
Author to whom correspondence should be addressed.
Sustainability 2021, 13(22), 12349; https://doi.org/10.3390/su132212349
Submission received: 11 August 2021 / Revised: 13 October 2021 / Accepted: 20 October 2021 / Published: 9 November 2021
(This article belongs to the Special Issue Sustainable Agricultural Intensification and Soil Fertility)

Abstract

:
Cropping systems with legumes play key roles in farming systems in sub-Saharan Africa. However, how commonly legume associations perform in low input-systems is not well-known. Here, we studied four legume species used in three systems in rotation with upland rice, i.e., groundnut monocropping, sorghum–cowpea intercropping, and velvet bean–crotalaria intercropping, in two fertilization managements on the previous rice, i.e., manure alone or complemented with mineral fertilization. Legume suitability was assessed using rhizobial and mycorrhizal colonization rates, plant biomass production, shoot N and P content, and biological N2 fixation based on their δ15N natural abundance. Shoot and root biomasses varied significantly between legume species and were positively correlated with nodule number (r = 0.49 and 0.74, p-value < 0.05 and <0.001, respectively) and the amount of fixed N (r = 0.73 and 0.50, p-value < 0.001 and <0.05, respectively). The proportion of plant N derived from N2 fixation also varied significantly between species, with a higher percentage for velvet bean (66%), compared to the other three species (50 to 60%). Legume roots were weakly colonized by AM fungi, with similar levels between species. Overall, fertilization management did not significantly impact legume biomass, symbioses, or N2 fixation, yet the organo-mineral fertilization significantly increased legume shoot P content. The lack of effect of mineral fertilization on N2 fixation and biomass could be due to other nutrient deficiencies (Ca, Mg, micronutrients), which can hamper symbioses with rhizobia and mycorrhizae.

1. Introduction

The conventional agriculture model, based on the use of synthetic inputs and non-renewable natural resources, has made possible an increase in productivity but at the cost of damage to the environment [1]. Ecological intensification has been proposed as a nature-based alternative that sustains agricultural production while minimizing adverse effects on the environment [2]. Among the key practices to promote ecological intensification, crop diversification has shown positive impacts on both plant production and the environment [2,3,4]. It can contribute significantly to livelihoods, improved health and nutrition, household food security, climate resilience, and ecological sustainability [5].
Nitrogen (N) is, with phosphorus (P), the most limiting nutrient for crop production in Sub-Saharan Africa (SSA) (e.g., [6]). The loss of soil organic matter and nutrients due to insufficient inputs of organic matter, such as plant residues or manure, results in soil quality degradation [7]. The situation is aggravated by the low use of mineral fertilizers by smallholder farmers due to their high cost and lack of access [8]. Legumes are widely used in agriculture as a means to reduce N fertilizer inputs due to their ability to fix N2 from the atmosphere. The introduction of legumes in cropping systems is thus an essential way of developing a sustainable intensification of agriculture in SSA [9,10]. Fixed N benefits the various crops in rotations. During the legume cropping year, N fixation supplies the legume that does not need nitrogen fertilizers. The subsequent crop further benefits from the supply of fixed N contained in root and shoot residues that remain in the field, after their mineralization [11].
Most studies in SSA focus on grain legumes (pulses) (e.g., [10]), as they are widely recognized as important sources of food proteins with diverse health benefits [12,13]. The use of legume-based cover crops, forage, or intercropping [14,15,16] in conservation agriculture or mixed crop livestock farming systems can also contribute to the improvement of crop production and soil quality. The adoption of the use of legumes in SSA’s agricultural production systems is a major objective of agricultural public policies (e.g., the N2Africa Project [17]).
Several factors can constrain the proportion of plant N derived from N2 fixation (%Ndfa). The %Ndfa of legumes growing in farmers’ fields varies in a large range according to genetic, agronomic, and environmental factors [18]. Dwivedi et al. [19] observed contrasting biological N2 fixation (BNF) capacity between a variety of legume genotypes. Low P availability is considered the principal limiting factor for legume growth as it strongly reduces N2 fixation [20] due to the large amount of energy required in the form of adenosine triphosphate (ATP). Soil acidity, associated with aluminum toxicity or calcium and magnesium deficiencies, can also contribute to low BNF [21]. The presence of efficient strains of Rhizobium for root infestation and N2 fixation is also needed. Meta-analysis shows an additive effect of co-infection by arbuscular mycorrhizal (AM) fungi and rhizobia on plant growth responses [22]. Furthermore, synergistic interactions between AM fungi and rhizobia are more likely to occur in conditions of biotic or abiotic stresses [23,24].
To date, because a limited number of studies have investigated the extent of N2 fixation by legumes and their contribution to N input in cropping systems in SSA, the ecological intensification of BNF in these systems is still challenging [10]. This is especially true in the sub-humid and humid zones of SSA where the soils are highly weathered with low P availability [25]. A better understanding of the abilities of various legume species to fix N in P-depleted soils, and the contribution of AM fungi, known to acquire P from the soil, is required.
The aim of this study was to assess the contribution of BNF to legume N nutrition in relation to the levels of rhizobial bacteria and AM fungi symbiosis, and fertilization management, in acidic Ferralsols. Three systems using legumes in rotation with upland rice were compared: a sole legume, groundnut (RG), a cereal–legume mixture of sorghum and cowpea (RSC), and a legume mixture of velvet bean and crotalaria (RVC). Plant responses were assessed in terms of rhizobial and mycorrhizal colonization, biomass production, mineral nutrition (P and N), and proportion of biological nitrogen fixation using the 15N natural abundance method.

2. Materials and Methods

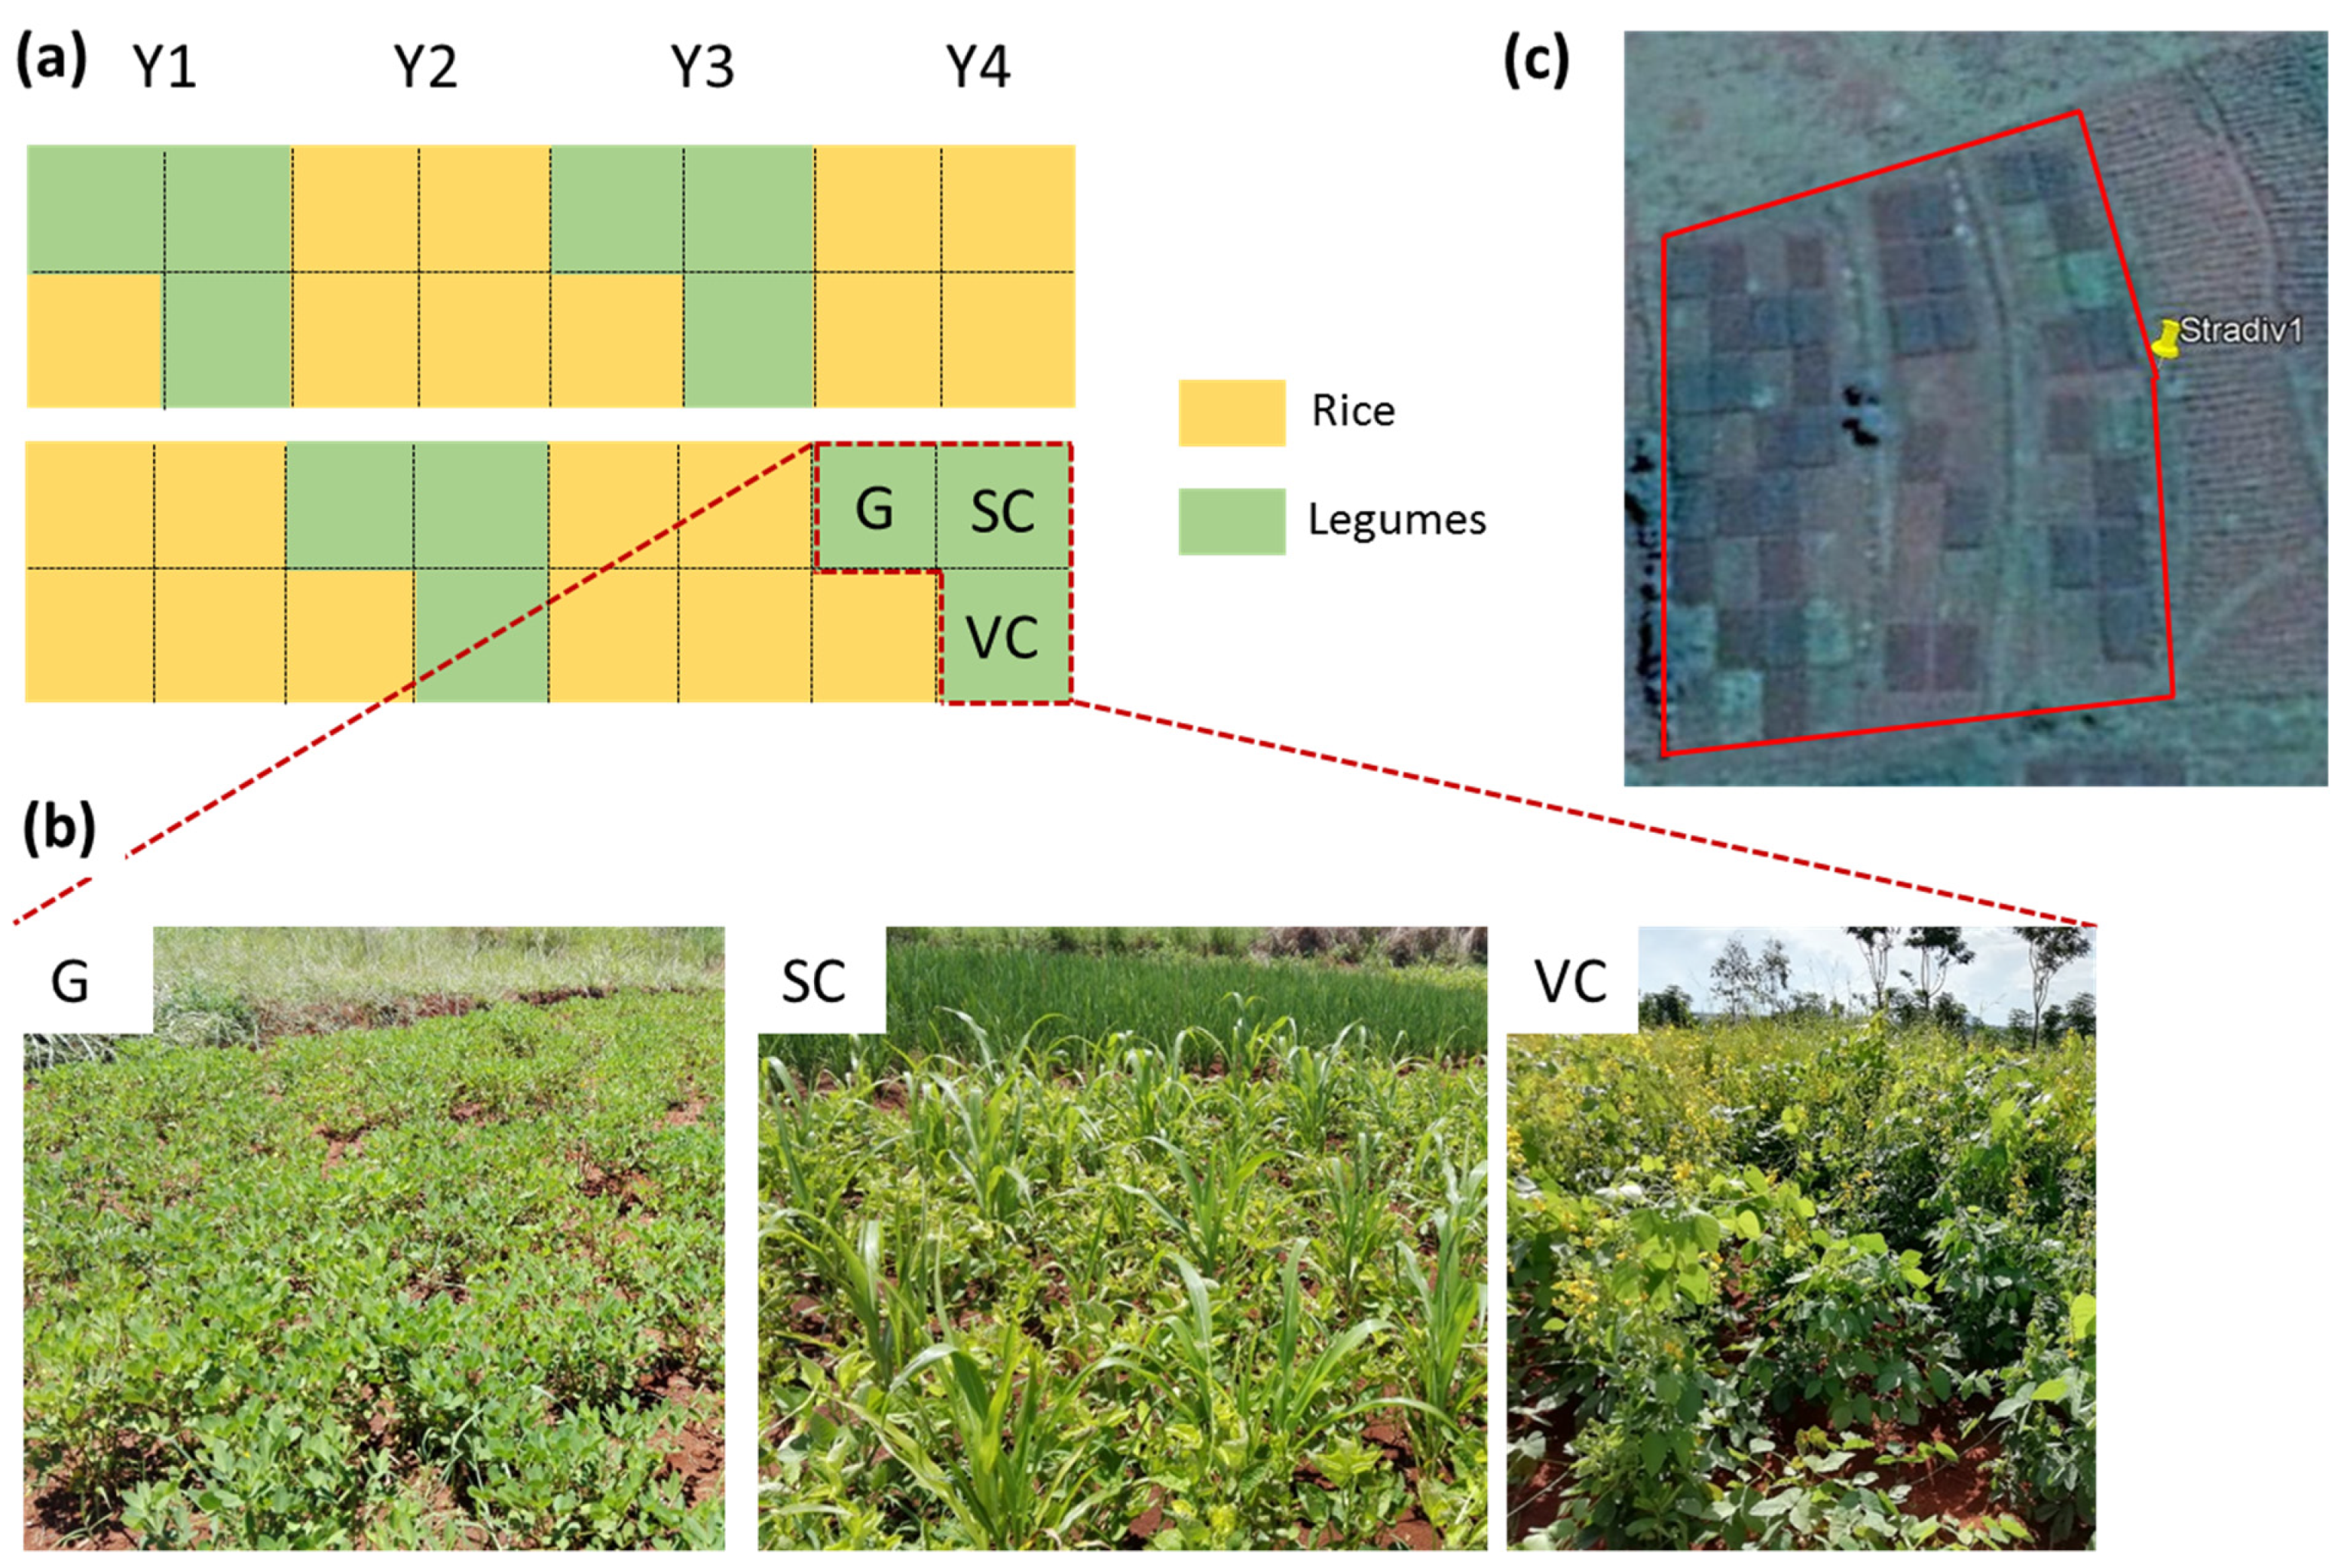
2.1. Study Site, Experimental Design, and Crop Management

This study was carried out at the Ivory station, Mid-West of Vakinankaratra, Madagascar (19°33′18.90″ lat. S, 46°24′53.83″ long. E, 930 m.a.s.l.). The soil was a sandy–clay–loamy Ferralsol with a clay–silt–sand composition of 32–18–50%. It is acidic (pHwater = 4.9 ± 0.1 in the 0–20 cm soil layer), with low total carbon content (16 ± 0.3 g kg−1), low available P content (Olsen P = 4.1 ± 1.0 mg kg−1), and low cation exchange capacity (3.1 ± 0.2 cmol kg−1). The cropping season corresponds to the rainy season that lasts from October to April. Climatic data were recorded by an automatic meteorology station, ENERCO 404 Series (CIMEL Electronique, Paris, France). Rainfall was 1187 mm and mean temperature was 24.9 °C during the cropping season (see [26] for details on monthly rainfall and temperature during the experiment).
A field experiment was established in November 2015 (see also [26]) and hereby we focus on three two-year rotations including solely legumes or a crop mixture, namely (i) rice after groundnut (RG), (ii) rice after sorghum–cowpea (Vigna unguiculata) intercropping (RSC), and (iii) rice after velvet bean (Mucuna pruriens)–crotalaria (Crotalaria spectabilis) intercropping (RVC) (Figure 1). These were compared to rainfed rice monocropping (RR) in a factorial randomized block design with four blocks on plots of 45.9 m2 each. The legumes and their cropping system integration were selected based on expert knowledge for different purposes: (i) RG for providing a cash crop and green manure with groundnut residues; (ii) RSC for providing forage for livestock with sorghum (grain and vegetative biomass) and grain opportunities for food and green manure with cowpea; and (iii) RVC for its potential to produce a high amount of green manure (combination of an erected plant and a climbing one) and to control plant-feeder nematodes [26].
Tillage, sowing, and harvest were performed manually. Groundnut, sorghum, cowpea, velvet bean, and crotalaria were sown at the end of November at a density of 17, 3, 8, 7, and 7 holes m−2 and of 1, 5, 5, 2, and 5 seeds per hole, respectively, in line with farmer practices. They were grown without any fertilizer or manure. However, the previous rice in the rotation was fertilized, with two modalities: (i) only organic fertilization (F1) with 5 t DM ha−1 year−1 manure was applied at sowing, directly into the rice holes, and (ii) organo-mineral fertilization (F2), with the same 5 t DM ha−1 year−1 manure addition than F1 and additional input of 400 kg ha−1 year−1 of NPK (11-22-6) and 200 kg ha−1 year−1 of urea. The manure is a low-quality farmyard manure, with an average composition for the four-year experiment of 0.68% dry, 18.6% organic matter, 0.65% N, 0.18% P, and 1.21% K [26]. NPK was applied during sowing, and urea was applied at 45 days and about 70 days after sowing, respectively, in line with recommendations by local extensionists. The F1 level represents the local practice, and F2 is a reference to achieving rice genetic potential. Some additional details on the management practices carried out during the four years of the trial are also available in a companion study [26].

2.2. Plant Sampling and Analyses

All legumes were sampled during the fourth cropping year, from 5 to 7 March 2019 (first sampling date), i.e., 14 weeks after sowing (WAS). Plants were collected between the full development and ripening stage of legumes: groundnut at the ripening stage (Stage 8 on the BBCH growth stage scale [27]); cowpea at the end of Stage 8; velvet bean at the full development stage (between Stages 4 and 5), and crotalaria at the flowering Stage 6.
Plants from four seed holes from the middle of each plot were taken. The plants were collected together with their roots and carefully washed. The plants were separated between shoot, root, and nodules, and the nodules were counted. The shoot, root, and nodule samples were oven dried at 60 °C for 48 h, weighed, and stored for analysis.
Shoot biomass was ground into a fine powder for chemical analysis. Total N content was determined by dry combustion using a Vario Pyro Cube CHN Analyzer (Elementar, Langenselbold, Germany). Total P content was determined after calcination of 0.5 g of ground material at 550 °C [28]. After cooling, the ash was dissolved in warm 2% HCl and analyzed by colorimetry using the blue method of Murphy and Riley [29]. The δ15N isotopic abundance of each legume plant, the rice grown in the trials, and of Digitaria sp. (an abundant weed present in all plots of the trial) were analyzed on ground plant residues using a mass spectrometer (Isoprime Precision, Elementar, Langenselbold, Germany) coupled with a CN elemental analyzer (Vario Pyro Cube, Elementar). The air N2 was used as reference to determine δ15N. The air N2 scale for nitrogen isotopes is formally defined by atmospheric N2, which has an assigned δ15N value of 0‰.
These data were then used to determine legume %Ndfa, as follows [30]:
%Ndfa = ((δ15Nref − δ15Nleg)/(δ15Nref − B)) × 100
where δ15Nleg correspond to the legume δ15N, and δ15Nref is the non-fixing reference plants δ15N, which corresponded to the average between rice and Digitaria sp. δ15N, as described by Samago et al. [31]. The “B” value is the δ15N of legume grown in a glasshouse on N-free substrate. The B values of groundnut (−2.27‰), crotalaria (−2.25‰), and velvet bean (−2.62‰) were taken from Okito et al. [32], and that of the cowpea (−2.20‰) was taken from Nyemba and Dakora [33]. The amount of N fixed by the crop was deduced by multiplying %Ndfa by shoot N content and shoot biomass.
Plants from four other holes were collected as previously for mycorrhization rate determination. Roots were carefully washed with tap water, cut into 2 cm fragments, and stored at 4 °C in 70% alcohol. The root samples were stained with Schaeffer black ink as described in Vierheilig et al. [34]. Thirty root segments selected randomly were mounted on microscope slides for observation (Figure 2). The frequency of mycorrhiza in the root system (F. Myc) and the root mycorrhization rate (M. Myc) were calculated according to Trouvelot et al. [35].
The transition from the individual plant scale (g m−2) to the intercropping plot scale (t ha−1) was performed in two steps. First, biomass of the association at the time of the first sampling was obtained by summing species individual biomass relatively to the surface areas they occupied in each plot. The amount of N fixed per ha was then deduced by the sum of each species N2 fixation within the association (i.e., by multiplying the amount of N fixed by the shoot biomass of each species). Second, another subset of individual legume plants was harvested at maturity (April–May), 20 WAS for groundnut and 26 WAS for cowpea, crotalaria, and velvet bean (second sampling date). Fresh biomass was collected in two 1 m2 quadrats and weighted. Sub-samples of approximately 200 g of fresh biomass were oven dried at 65 °C for 72 h to determine the dry weight (DW) produced at the harvest stage.

2.3. Statistical Analysis

The influence of legume species and fertilization levels on individual plant traits was first assessed with two-way ANOVAs with interactions. The nodulation variables (abundance and dry weight) that did not meet the criteria of homoscedasticity were analyzed with a linear model coupled with ANOVA with White correction [36] with the ANOVA function of the {car} R package. Since there were no legume species × fertilization interactive effects for all variables (excepted shoot N, which was analyzed separately), differences between legume species and fertilization managements were tested separately a second time with a post hoc Tukey test. Relationships between legume properties were then assessed with a principal component analysis (PCA) and a Pearson correlation matrix with Benjamini Hochberg correction for multiple comparisons. All statistical analyses were performed using R software (R-4.0.4) and the following packages: agricolae, car, factoextra, FactoMineR, multcompView, psych, and stats.

3. Results

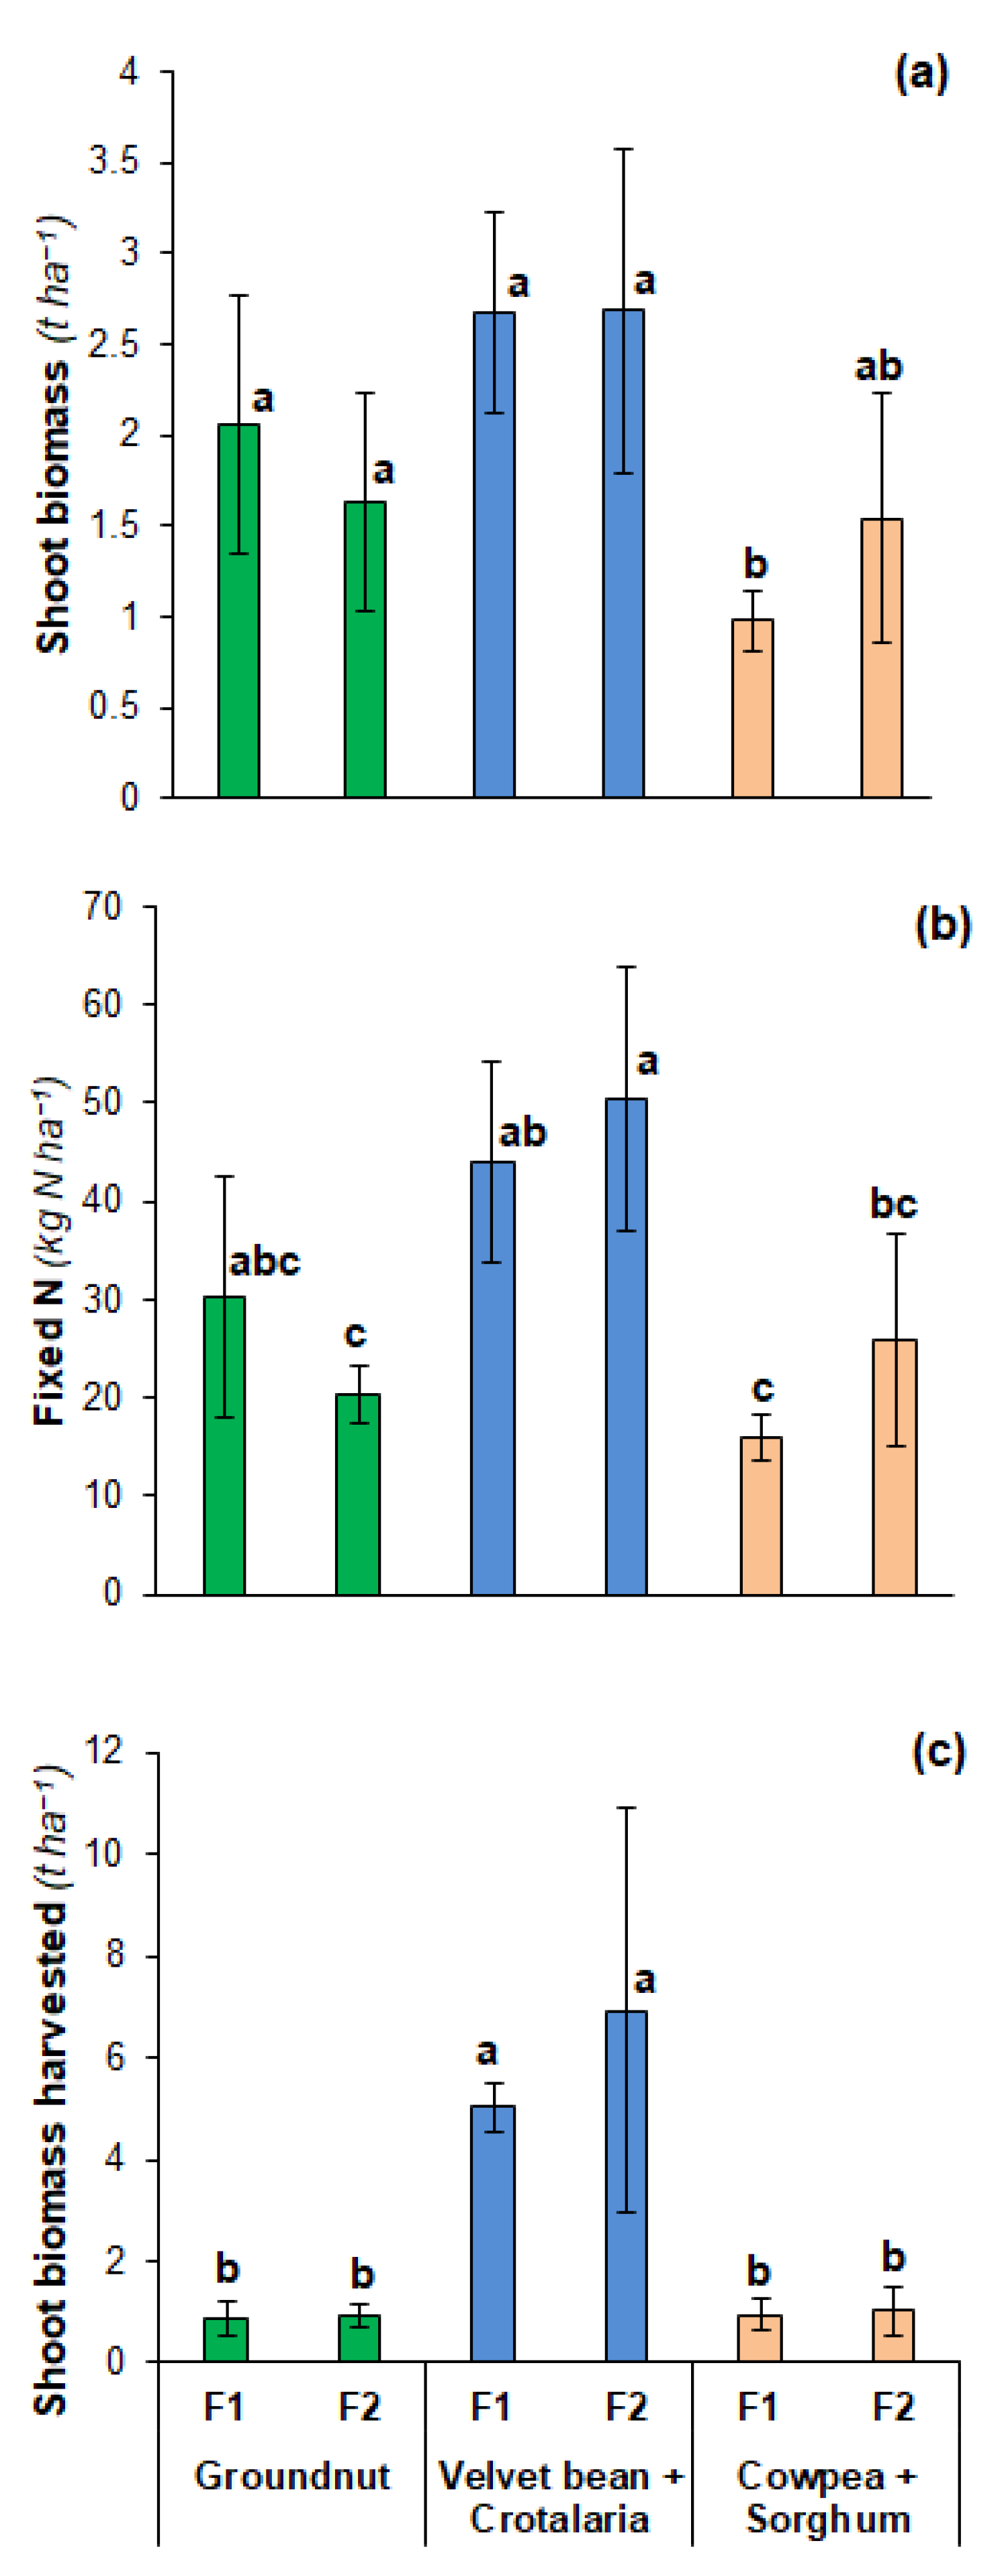
3.1. Legume Growth and Biological N2 Fixation

Shoot and root biomasses varied significantly between legume species, whereas fertilization had no effect on these variables (Table 1). The highest values of shoot biomass were found for groundnut and crotalaria (respectively, 185 ± 65 and 181 ± 52 g m−2), while the lowest ones were observed for velvet bean and cowpea (respectively, 87 ± 36 and 109 ± 19 g m−2). On the other hand, all species significantly differed in their root biomass, and were, from the highest to the lowest values: groundnut, crotalaria, cowpea and velvet bean. These differences in shoot and root biomasses resulted in variable shoot: root ratio, with the highest and lowest values for velvet bean (14.4 ± 4.0) and groundnut (3.3 ± 0.6), respectively, while both crotalaria and cowpea presented intermediate values (Table 1). The root biomass represented 18–29% of the shoot biomass for the various species, except for velvet bean, where it represented only 7% of the aboveground biomass.
Shoot N and P contents exhibited contrasting responses to legume species and fertilization levels. Shoot N content differed significantly between species only in F2, where crotalaria presented the highest N content (3.36 ± 0.22% dry matter), groundnut the lowest shoot N content (2.59 ± 0.10% dry matter), and velvet bean and cowpea showed intermediate values (Table 1). In contrast, shoot P content did not differ between species but was significantly impacted by fertilization levels, with higher content in F2 than F1 (1.83 ± 0.30‰ against 1.55 ± 0.32‰ dry matter, respectively), leading to higher shoot N: shoot P ratio in F1 than F2 modality.
The highest shoot δ15N was observed for crotalaria (3.14 ± 1.29‰) and the lowest for the three other species, with values between 0.8 and 2‰. The percentage of plant N derived from N2 fixation varied significantly between species, with a higher %Ndfa for velvet bean (66 ± 8%) compared to the other three species (50% to 60%). However, we observed no effect on the percentage of plant N using the different fertilization methods. This resulted in an average amount of fixed N in shoot biomass of 2.25 ± 0.82 g m−2 at the first sampling date, all modalities taken into account, without significant differences between species or fertilization management.

3.2. Legume Symbioses

The analysis of variance showed significant differences in nodulation between the species of legumes (p-values < 0.001), while fertilization had no effect on this symbiosis (p-values > 0.05, Table 1). Groundnut presented the highest nodule number out of all other species (10 to 19 times higher than the other species, all fertilization modes taken into account). However, both groundnut and velvet bean presented high level of total nodule dry weight, corresponding to many small nodules for groundnut (average weight of 5.5 mg per nodule) and few big nodules for velvet bean (average weight of 35.8 mg per nodule). On the other hand, both crotalaria and cowpea presented low nodule number and dry weight.
Legumes roots were weakly colonized by AM fungi, without significant effect of legume species and fertilization. The frequency of mycorrhiza in the root system (F. Myc) varied between 5% to 11%, and the root mycorrhization rate (M. Myc) was only about 1% (Table 1).

3.3. Legume Response to Symbioses

The PCA biplot indicated strong positive covariations between shoot and root biomass production, and to a lesser extent with the nodulation and the amount of fixed N on the first axis of the PCA (Figure 3). In contrast, shoot: root ratio and Shoot N content negatively covariated on the same axis. Contrastingly, shoot P content and to a lesser extent mycorhization frequency covariated positively on the second axis, while shoot N:P ratio covariated negatively on this axis. Traits contrasted between species were mainly displayed on the first axis, with globally higher biomass production and nodulation levels for groundnut and crotalaria than cowpea and velvet bean (Figure 3). The relationship between the biomass produced (shoot and root) and the amount of fixed N was highlighted by Pearson correlations (Table 2), with significant correlations between root or shoot biomass and nodule number (r = 0.74 and 0.49, respectively) and significant correlation between shoot biomass with the amount of fixed N (r = 0.73).

3.4. Biomass Production and N Restitution at the Plot Scale

At the intercropping plot scale, shoot biomass of legumes nearly at the flowering stage was the highest for velvet bean and crotalaria intercropping (2.68 ± 0.69 t ha−1) and the lowest for cowpea intercropped with sorghum (1.26 ± 0.55 t ha−1), while groundnut monocropping presented intermediate values (1.85 ± 0.65 t ha−1) (Figure 4a). The corresponding amounts of fixed N in shoot biomass were 25.3 ± 9.8 kg N ha−1 for groundnut monocropping, 21.0 ± 9.0 kg N ha−1 for sorghum–cowpea intercropping, and 47.2 ± 11.5 kg ha−1 for velvet bean–crotalaria intercropping (Figure 4b). At harvest, shoot biomass decreased for species that were at a more advanced development stage at the first sampling date (groundnut, cowpea: Stage 8) by 51% and 22%, respectively (Figure 4c). However, velvet bean and crotalaria that were between Stage 4 to 6 at the sampling date continued to grow by 123% (from 2.68 to 5.98 t ha−1) until harvest.

4. Discussion

4.1. Importances of Rhizobial and AMF Symbionts on Plant N2 Fixation in Acid Ferralsols

Nodulation of all studied legume species was observed with a quite large number of nodules per plant (Table 1), similar or higher than that reported in other studies in SSA (e.g., [37,38]). Efficient native strains seem to be present in the soil and able to nodulate the legume species. For some other species (e.g., common bean), efficient native strains could be lacking in Malagasy soils and inoculation with rhizobium could have a positive effect [24]. Our results also showed an overall significant relationship between shoot and root DW, nodule number and DW, and fixed-N (Figure 3 and Table 2). This results in a mean of 16.5 kg fixed N t−1 DM (fixed N = 16.49 × Shoot biomass − 0.64; R2 = 0.85), in line with the data of Unkovich et al. [39]. Regression analysis between shoot dry matter and amounts of shoot fixed N are generally strong for most legumes [39,40]. The meta-analysis performed by Unkovich et al. [39] for Australian studies shows that the relationship between N2 fixation and shoot dry matter had slopes between 20.2–24.3 kg N2 fixed t−1 DW for pasture legumes and between 10.7 to 23.0 kg N2 fixed t−1 DW for crop legumes, depending upon species.
Although rice in rotation with legume was fertilized, a legume P limitation could be suspected, as suggested by their high shoot N: shoot P ratio of shoot biomass, that was 17–19 (Table 1). Indeed, a N:P ratio above 16 generally suggests P-limited growth, while an N: P ratio below 13.5 suggests N-limited growth [41]. It is well known that N2 fixation is restricted by low P availability [20]. The lack of adequate levels of available P in tropical soils, as is found in Madagascar, is one of the major constraints for crop production [42] due to the high P sorption on Fe- and Al-oxides and clay minerals [43]. The organo-mineral fertilization (F2) provided to the previous rice only resulted in a significant increase in shoot P content, without any effect on shoot biomass or nodulation (Table 1). According to Kouas et al. [44], nodule numbers are significantly diminished by low P availability, whereas the intrinsic characteristics of the nodules (individual biomass and size, P concentration, and efficiency of N2 fixation) do not depend on P availability. The increase in P content with F2 fertilization showed that the bioavailability of P was improved. Therefore, the lack of response of nodulation to increased P bioavailability could be linked to other macro- or micro-nutrient deficiencies, likely to occur in these multi-deficient soils [42]. In addition, the nutrient deficiencies that affect the soil (N, P, Ca, and Si) [42] lead to a large decrease in plant growth. Indeed, as shown by Santachiara et al. [45] on soybeans, legumes can be affected by various nutrient deficiencies, such as potassium, sulfur, molybdenum, iron, etc., in addition to P, most of them having a critical control on BNF. In such degraded soils, the poor soil fertility often results in a large gap between the potential and observed yields (e.g., [7]).
It is also well-known that N2 fixation is restricted by high N availability [46]. The %Ndfa of legumes declines with high concentrations of soil nitrate, but concentrations <20–25 kg N ha−1 are generally considered too low to have an impact on %Ndfa [46]. Results of a companion study on the same trial [26] show that total mineral N content was only 13 kg N ha−1 at the harvest of the previous rice. However, nitrate levels were only measured in rice and not in legume plots. The soil mineral N had probably no or a low inhibitory effect on nodulation under these conditions. The low nitrogen content of the soil after rice cultivation may also explain the lack of effect of mineral fertilization on the nitrogen content of legume stems.
Unlike nodulation, the mycorrhization rates were very low (Table 1). Our findings for F. Myc (5–9%) were generally lower than the observations from studies published in SSA on the plants we were studying (mycorrhization rate of 2–35% for velvet bean [47,48]; 20–60% for cowpea [49]). This low mycorrhization rate is not well-understood, and different hypotheses could be proposed, such as a very low amount of soil spores or the inhibitory effects of some practices (e.g., fertilizer inputs) on mycorrhization. According to Lambers et al. [50], mycorrhizal strategies are relatively inefficient in highly weathered soils, presumably because AMF are not able to mobilize P from poorly available pools for plant roots. Moreover, the mycorrhization rate is usually restricted when P availability is low, whereas AM colonization increases after P additions in P-limited soils [48,51]. Indeed, we showed a positive relationship on the PCA between shoot P and F. Myc (Figure 3). A recent study performed on a Ferralsol typical of the hills of the Malagasy Highlands has also shown that the inoculation of a legume (common bean) with efficient native strains of AM fungi collected on the same soil promotes a significant increase in shoot biomass, plant P content, and soil phosphatase activity [24].

4.2. Amount of N Fixed by Legumes in SSA

Estimates of N inputs by BNF in cropping systems in SSA are of the uppermost importance. Nevertheless, there is a limited number of studies on the extent of N2 fixation (%Ndfa, amount of N fixed) by legumes and their contribution to N input in cropping systems in SSA, with most studies focusing on a few grain legumes (cowpea, groundnut, Bambara groundnut, and soybean) (e.g., [9]). Moreover, to our knowledge, except the pioneering study of Becker and Johnson [52], none of them focus on forage or fallow legumes (e.g., Cajanus, Crotalaria, Dolichos, Mucuna, Stylosanthes, etc.).
Our results of N2 fixation (Table 1) were based on selected B values from the literature and measurements of above-ground biomass N at various stages of plant development during the growing season. The B values for a given plant species can vary due to several parameters, such as the growth stage of the plant [53], the legume cultivar [54], the rhizobium strain(s) that colonizes the roots [32], and differences between field and greenhouse results [55]. Concerning measurements on biomass, we did not take into account the contribution of fixed N derived from the roots nor the contribution of total biomass reached at maximum plant development. An estimate of the quantity of N fixed considering these two factors can be made. Since the %Ndfa of nodulated roots and stems were found to be almost identical [46], a ‘root factor’ was applied to shoot-based data to estimate total plant N (i.e., shoot N + nodulated root N) [39]. Considering the root: shoot ratio at the sampling stage, the amount of N fixed would increase by 7–29% according to legume species to take into account the N of nodulated roots. An estimate of biomass production can also be difficult given the senescence of plants and leaf decay after flowering. For example, the biomass was lower at harvest for groundnut and cowpea than that at flowering, whereas it increased by 123% for velvet bean–crotalaria intercropping (Figure 3). For our calculations, we used the maximum biomass obtained of the two sampling dates. The estimated amounts of fixed N in total biomass (shoot and root) at maximum development stage of the legume species were 33 kg ha−1 for groundnut monocropping, 24 kg ha−1 for sorghum–cowpea intercropping, and 121 kg ha−1 for velvet bean–crotalaria intercropping. The corresponding amounts of soil-derived N in legumes were 28 kg ha−1 for groundnut monocropping, 17 kg ha−1 for sorghum–cowpea intercropping, and 89 kg ha−1 for velvet bean–crotalaria intercropping.
In the trial we studied, the hierarchy observed for the amount of fixed N by the different cropping systems, i.e., a higher amount for velvet bean–crotalaria intercropping compared to sorghum–cowpea and groundnut intercropping, is mirrored by the differences in rice yield and rice N content observed in the following rice crop cycle (see [26]). This highlights the greater contribution of forage, fodder, and green manure legumes with regard to grain legumes to provide a large amount of fixed N in agricultural systems [18].

5. Conclusions

Symbiotic N2 fixation by legumes can add a significant amount of nitrogen for the next crop in the rotation through the incorporation of residues into the soil. The overall inputs of N2 were estimated at 25–30 kg ha−1 for groundnut monocropping and sorghum–cowpea intercropping and 120 kg ha−1 for velvet bean–crotalaria intercropping. The choice of legume species to integrate into the cropping system will depend on the N balance but also on the profitability of the cropping system over the entire rotation cycle, as well as constraints linked to the production system (e.g., mulching of crop residues in conservation agriculture system or harvesting of forage in crop–livestock integrated systems). In addition, the lack of effect of NPK fertilization on highly weathered soils with low nutrient availability could be due to multiple nutrient deficiencies (K, Ca, Mg, or micronutrients). which can affect symbiosis with rhizobia or mycorrhizae. Then, the increase in the productivity of legumes requires managing fertilization in order to improve the efficiency of rhizobial or mycorrhizal symbioses. In the highland of Madagascar, inputs of P and Ca seem essential for a greater efficiency of the symbionts. The presence of native rhizobial strains in the soil may allow the nodulation of the various species studied, whereas the mycorrhization rate remained weak. Further studies should investigate if the mycorrhization rate could be increased following AMF inoculation in the soil with more efficient native or commercial mycorrhizal strains or with additional fertilization.

Author Contributions

Conceptualization, T.B., A.R. and P.A.; methodology, T.B., H.R., A.R. and P.A.; data acquisition, H.R., A.R. and P.A.; formal analysis, H.R., A.R. and P.A.; writing—original draft preparation, T.B., H.R., J.T. and M.S.; writing—review and editing, all authors; project administration, T.B. and A.R.; funding acquisition, T.B. and A.R. All authors have read and agreed to the published version of the manuscript.

Funding

This research was supported by the African Union, under reference AURG II-1-075-2016 through financial supports and a post-doctoral grant to H. Razafintsalama. We also acknowledge the Agropolis Foundation (France), who supported the field trials through the STRADIV project (project no. 1504-003) and through the “Investissements d’Avenir” program (Labex Agro: ANR-10-LABX-0001-01).

Institutional Review Board Statement

Not applicable.

Informed Consent Statement

Not applicable.

Data Availability Statement

Data were deposited on a figshare repository at the following doi:10.6084/m9.figshare.16932877 (Licence CC BY 4.0).

Acknowledgments

The authors are grateful to Pascal Tillard (INRAe) from the Laboratoire de Biochimie et de Physiologie Moléculaire des Plantes (UMR BPMP, Montpellier, France) for processing the 15N isotopic analyses. We are also thankful to Marie-Paule Razafimanantsoa (LRI, Antananarivo, Madagascar) for her technical assistance in the laboratory and to Damien Dezette (INRAe, UMR Eco&Sols) for the training provided on measuring the mycorrhization rate.

Conflicts of Interest

The authors declare no conflict of interest.

References

  1. Scopel, E.; Triomphe, B.; Affholder, F.; Da Silva, F.A.M.; Corbeels, M.; Xavier, J.H.V.; Lahmar, R.; Recous, S.; Bernoux, M.; Blanchart, E.; et al. Conservation agriculture cropping systems in temperate and tropical conditions, performances and impacts. A review. Agron. Sustain. Dev. 2013, 33, 113–130. [Google Scholar] [CrossRef]
  2. Kleijn, D.; Bommarco, R.; Fijen, T.P.; Garibaldi, L.A.; Potts, S.G.; van der Putten, W.H. Ecological intensification: Bridging the gap between science and practice. Trends Ecol. Evol. 2019, 34, 154–166. [Google Scholar] [CrossRef] [Green Version]
  3. Beillouin, D.; Ben-Ari, T.; Makowski, D. Evidence map of crop diversification strategies at the global scale. Environ. Res. Lett. 2019, 14, 123001. [Google Scholar] [CrossRef]
  4. Sauvadet, M.; Trap, J.; Damour, G.; Plassard, C.; Van den Meersche, K.; Achard, R.; Allinne, C.; Autfray, P.; Bertrand, I.; Blanchart, E.; et al. Agroecosystem diversification with legumes or non-legumes improves differently soil fertility according to soil type. Sci. Total Environ. 2021, 795, 148934. [Google Scholar] [CrossRef] [PubMed]
  5. Mango, N.; Makate, C.; Mapemba, L.; Sopo, M. The role of crop diversification in improving household food security in central Malawi. Agric. Food Secur. 2018, 7, 7. [Google Scholar] [CrossRef]
  6. ten Berge, H.F.; Hijbeek, R.; van Loon, M.P.; Rurinda, J.; Tesfaye, K.; Zingore, S.; Craufurde, P.; van Heerwaardenb, J.; Brentrupf, F.; Schrödera, J.J.; et al. Maize crop nutrient input requirements for food security in sub-Saharan Africa. Glob. Food Secur. Agric. Policy 2019, 23, 9–21. [Google Scholar] [CrossRef]
  7. Tittonell, P.; Giller, K.E. When yield gaps are poverty traps: The paradigm of ecological intensification in African smallholder agriculture. Field Crop. Res. 2013, 143, 76–90. [Google Scholar] [CrossRef] [Green Version]
  8. Chianu, J.N.; Chianu, J.N.; Mairura, F. Mineral fertilizers in the farming systems of sub-Saharan Africa. A review. Agron. Sustain. Dev. 2012, 32, 545–566. [Google Scholar] [CrossRef] [Green Version]
  9. Franke, A.C.; Van den Brand, G.J.; Vanlauwe, B.; Giller, K.E. Sustainable intensification through rotations with grain legumes in Sub-Saharan Africa: A review. Agric. Ecosyst. Environ. 2018, 261, 172–185. [Google Scholar] [CrossRef]
  10. Vanlauwe, B.; Hungria, M.; Kanampiu, F.; Giller, K.E. The role of legumes in the sustainable intensification of African smallholder agriculture: Lessons learnt and challenges for the future. Agric. Ecosyst. Environ. 2019, 284, 106583. [Google Scholar] [CrossRef]
  11. Liu, L.; Knight, J.D.; Lemke, R.L.; Farrell, R.E. A side-by-side comparison of biological nitrogen fixation and yield of four legume crops. Plant Soil 2019, 442, 169–182. [Google Scholar] [CrossRef]
  12. Mudryj, A.N.; Yu, N.; Aukema, H.M. Nutritional and health benefits of pulses. Appl. Physiol. Nutr. Metab. 2014, 39, 1197–1204. [Google Scholar] [CrossRef] [PubMed]
  13. Vaz Patto, M.C.; Amarowicz, R.; Aryee, A.N.; Boye, J.I.; Chung, H.J.; Martín-Cabrejas, M.A.; Domoney, C. Achievements and challenges in improving the nutritional quality of food legumes. Crit. Rev. Plant Sci. 2015, 34, 105–143. [Google Scholar] [CrossRef]
  14. Duchene, O.; Vian, J.F.; Celette, F. Intercropping with legume for agroecological cropping systems: Complementarity and facilitation processes and the importance of soil microorganisms. A review. Agric. Ecosyst. Environ. 2017, 240, 148–161. [Google Scholar] [CrossRef]
  15. Kocira, A.; Staniak, M.; Tomaszewska, M.; Kornas, R.; Cymerman, J.; Panasiewicz, K.; Lipińska, H. Legume cover crops as one of the elements of strategic weed management and soil quality improvement. A review. Agriculture 2020, 10, 394. [Google Scholar] [CrossRef]
  16. Lüscher, A.; Mueller-Harvey, I.; Soussana, J.F.; Rees, R.M.; Peyraud, J.L. Potential of legume-based grassland–livestock systems in Europe: A review. Grass Forage Sci. 2014, 69, 206–228. [Google Scholar] [CrossRef] [PubMed]
  17. Farrow, A.; Ronner, E.; Van Den Brand, G.J.; Boahen, S.K.; Leonardo, W.; Wolde-Meskel, E.; Adjei-Nsiah, S.; Chikowo, R.; Baijukya, F.; Ebanyat, P.; et al. From best fit technologies to best fit scaling: Incorporating and evaluating factors affecting the adoption of grain legumes in sub-Saharan Africa. Exp. Agric. 2019, 55, 226–251. [Google Scholar] [CrossRef] [Green Version]
  18. Herridge, D.F.; Peoples, M.B.; Boddey, R.M. Global inputs of biological nitrogen fixation in agricultural systems. Plant Soil 2008, 311, 1–18. [Google Scholar] [CrossRef]
  19. Dwivedi, S.L.; Sahrawat, K.L.; Upadhyaya, H.D.; Mengoni, A.; Galardini, M.; Bazzicalupo, M.; Biondi, E.G.; Hungria, M.; Kaschuk, G.; Blair, M.W.; et al. Advances in host plant and rhizobium genomics to enhance symbiotic nitrogen fixation in grain legumes. Adv. Agron. 2015, 129, 1–116. [Google Scholar]
  20. Augusto, L.; Delerue, F.; Gallet-Budynek, A.; Achat, D.L. Global assessment of limitation to symbiotic nitrogen fixation by phosphorus availability in terrestrial ecosystems using a meta-analysis approach. Glob. Biogeochem. Cycle 2013, 27, 804–815. [Google Scholar] [CrossRef]
  21. Graham, P.H.; Vance, C.P. Nitrogen fixation in perspective: An overview of research and extension needs. Field Crop. Res. 2000, 65, 93–106. [Google Scholar] [CrossRef]
  22. Larimer, A.L.; Bever, J.D.; Clay, K. The interactive effects of plant microbial symbionts: A review and meta-analysis. Symbiosis 2010, 51, 139–148. [Google Scholar] [CrossRef]
  23. Nadeem, S.M.; Ahmad, M.; Zahir, Z.A.; Javaid, A.; Ashraf, M. The role of mycorrhizae and plant growth promoting rhizobacteria (PGPR) in improving crop productivity under stressful environments. Biotechnol. Adv. 2014, 32, 429–448. [Google Scholar] [CrossRef] [PubMed]
  24. Razakatiana, A.T.E.; Trap, J.; Baohanta, R.H.; Raherimandimby, M.; Le Roux, C.; Duponnois, R.; Ramanankierana, H.; Becquer, T. Benefits of dual inoculation with arbuscular mycorrhizal fungi and rhizobia on Phaseolus vulgaris planted in a low-fertility tropical soil. Pedobiologia 2020, 83, 150685. [Google Scholar] [CrossRef]
  25. Deckers, J. Soil fertility and environmental problems in different ecological zones of the developing countries in Sub-Saharan Africa. In The Role of Plant Nutrients for Sustainable Food Crop Production in Sub-Saharan Africa; Van Reuler, H., Prins, R.W., Eds.; Vereniging Van Kunstmest Producenten: Wageningen, The Netherlands, 1993; pp. 37–52. [Google Scholar]
  26. Ripoche, A.; Autfray, P.; Blanchart, E.; Rabary, B.; Randriamanantsoa, R.; Trap, J.; Sauvadet, M.; Becquer, T.; Letourmy, P. Increasing plant diversity promotes ecosystem functions in rainfed rice based short rotations in Malagasy highlands. Agric. Ecosyst. Environ. 2021, 320, 107576. [Google Scholar] [CrossRef]
  27. Lancashire, P.D.; Bleiholder, H.; Vandenboom, T.; Langelüddeke, P.; Stauss, R.; Weber, E.; Witzenberger, A. A uniform decimal code for growth stages of crops and weeds. Ann. Appl. Biol. 1991, 119, 561–601. [Google Scholar] [CrossRef]
  28. Okalebo, R.J.; Gathua, K.W.; Woomer, P.L. Laboratory Methods of Soil and Plant Analysis: A working Manual, 2nd ed.; Sacred Africa: Nairobi, Kenya, 2002. [Google Scholar]
  29. Murphy, J.; Riley, J.P. A modified single solution method for the determination of phosphate in natural waters. Anal. Chim. Acta 1962, 27, 31–36. [Google Scholar] [CrossRef]
  30. Unkovich, M.; Herridge, D.; Peoples, M.; Cadisch, G.; Boddey, B.; Giller, K.; Alves, B.; Chalk, P. Measuring Plant-Associated Nitrogen Fixation in Agricultural Systems; Australian Centre for International Agricultural Research: Canberra, Australia, 2008; 258p. [Google Scholar]
  31. Samago, T.Y.; Anniye, E.W.; Dakora, F.D. Grain yield of common bean (Phaseolus vulgaris L.) varieties is markedly increased by rhizobial inoculation and phosphorus application in Ethiopia. Symbiosis 2018, 75, 245–255. [Google Scholar] [CrossRef] [Green Version]
  32. Okito, A.; Alves, B.R.J.; Urquiaga, S.; Boddey, R.M. Isotopic fractionation during N2 fixation by four tropical legumes. Soil Biol. Biochem. 2004, 36, 1179–1190. [Google Scholar] [CrossRef]
  33. Nyemba, R.C.; Dakora, F.D. Evaluating N2 fixation by food grain legumes in farmers’ fields in three agro-ecological zones of Zambia, using 15N natural abundance. Biol. Fertil. Soils 2010, 46, 461–470. [Google Scholar] [CrossRef]
  34. Vierheilig, H.; Coughlan, A.P.; Wyss, U.; Piche, Y. Ink and vinegar, a simple staining technique for arbuscular mycorrhizal fungi. Appl. Environ. Microbiol. 1998, 64, 5004–5007. [Google Scholar] [CrossRef] [PubMed] [Green Version]
  35. Trouvelot, A.; Kough, J.L.; Gianinazzi-Pearson, V. Mesure du taux de mycorhization VA d’un système radiculaire. Recherche de méthodes d’estimation ayant une signification fonctionnelle. In Physiological and Genetical Aspects of Mycorrhizae; Gianinazzi-Pearson, V., Gianinazzi, S., Eds.; INRA Press: Paris, France, 1986; pp. 217–221. [Google Scholar]
  36. White, H. A heteroskedasticity-consistent covariance matrix estimator and a direct test for heteroskedasticity. Econometrica 1980, 48, 817–838. [Google Scholar] [CrossRef]
  37. Pule-Meulenberg, F.; Belane, A.K.; Krasova-Wade, T.; Dakora, F.D. Symbiotic functioning and bradyrhizobial biodiversity of cowpea (Vigna unguiculata L. Walp.) in Africa. BMC Microbiol. 2010, 10, 89. [Google Scholar] [CrossRef] [PubMed] [Green Version]
  38. Belane, A.K.; Asiwe, J.; Dakora, F.D. Assessment of N2 fixation in 32 cowpea (Vigna unguiculata L. Walp) genotypes grown in the field at Taung in South Africa, using 15N natural abundance. Afr. J. Biotechnol. 2011, 10, 11450–11458. [Google Scholar]
  39. Unkovich, M.J.; Baldock, J.; Peoples, M.B. Prospects and problems of simple linear models for estimating symbiotic N2 fixation by crop and pasture legumes. Plant Soil 2010, 329, 75–89. [Google Scholar] [CrossRef]
  40. Blesh, J. Functional traits in cover crop mixtures: Biological nitrogen fixation and multifunctionality. J. Appl. Ecol. 2018, 55, 38–48. [Google Scholar] [CrossRef] [Green Version]
  41. White, P.J.; Hammond, J.P. Phosphorus nutrition of terrestrial plants. In The Ecophysiology of Plant-Phosphorus Interactions; White, P.J., Hammond, J.P., Eds.; Springer: Amsterdam, The Netherlands, 2008; Volume 7, pp. 51–81. [Google Scholar]
  42. Raminoarison, M.; Razafimbelo, T.; Rakotoson, T.; Becquer, T.; Blanchart, E.; Trap, J. Multiple-nutrient limitation of upland rainfed rice in ferralsols: A greenhouse nutrient-omission trial. J. Plant Nutr. 2020, 43, 270–284. [Google Scholar] [CrossRef]
  43. Gérard, F. Clay minerals, iron/aluminum oxides, and their contribution to phosphate sorption in soils-A myth revisited. Geoderma 2016, 262, 213–226. [Google Scholar] [CrossRef]
  44. Kouas, S.; Labidi, N.; Debez, A.; Abdelly, C. Effect of P on nodule formation and N fixation in bean. Agron. Sustain. Dev. 2005, 25, 389–393. [Google Scholar] [CrossRef]
  45. Santachiara, G.; Salvagiotti, F.; Rotundo, J.L. Nutritional and environmental effects on biological nitrogen fixation in soybean: A meta-analysis. Field Crop. Res. 2019, 240, 106–115. [Google Scholar] [CrossRef]
  46. Peoples, M.B.; Brockwell, J.; Hunt, J.R.; Swan, A.D.; Watson, L.; Hayes, R.C.; Li, G.D.; Hackney, G.B.; Nuttall, J.G.; Davies, S.L.; et al. Factors affecting the potential contributions of N2 fixation by legumes in Australian pasture systems. Crop Pasture Sci. 2012, 63, 759–786. [Google Scholar] [CrossRef]
  47. Sanginga, N.; Ibewiro, B.; Houngnandan, P.; Vanlauwe, B.; Okogun, J.A.; Akobundu, I.O.; Versteeg, M. Evaluation of symbiotic properties and nitrogen contribution of mucuna to maize grown in the derived savanna of West Africa. Plant Soil 1996, 179, 119–129. [Google Scholar] [CrossRef]
  48. Vanlauwe, B.; Nwoke, O.C.; Diels, J.; Sanginga, N.; Carsky, R.J.; Deckers, J.; Merckx, R. Utilization of rock phosphate by crops on a representative toposequence in the Northern Guinea savanna zone of Nigeria: Response by Mucuna pruriens, Lablab purpureus and maize. Soil Biol. Biochem. 2000, 32, 2063–2077. [Google Scholar] [CrossRef]
  49. Bagayoko, M.; Buerkert, A.; Lung, G.; Bationo, A.; Römheld, V. Cereal/legume rotation effects on cereal growth in Sudano-Sahelian West Africa: Soil mineral nitrogen, mycorrhizae and nematodes. Plant Soil 2000, 218, 103–116. [Google Scholar] [CrossRef] [Green Version]
  50. Lambers, H.; Raven, J.A.; Shaver, G.R.; Smith, S.E. Plant nutrient-acquisition strategies change with soil age. Trends Ecol. Evol. 2008, 23, 95–103. [Google Scholar] [CrossRef]
  51. Treseder, K.K.; Allen, M.F. Direct nitrogen and phosphorus limitation of arbuscular mycorrhizal fungi: A model and field test. New Phytol. 2002, 155, 507–515. [Google Scholar] [CrossRef] [Green Version]
  52. Becker, M.; Johnson, D.E. Legumes as dry season fallow in upland rice-based systems of West Africa. Biol. Fertil. Soils 1998, 27, 358–367. [Google Scholar] [CrossRef]
  53. Rose, T.J.; Kearney, L.J.; Erler, D.V.; Rose, M.T.; Van Zwieten, L.; Raymond, C.A. Influence of growth stage and seed nitrogen on B values and potential contributions to error in estimating biological N2 fixation using the 15N natural abundance method. Plant Soil 2018, 425, 389–399. [Google Scholar] [CrossRef]
  54. Pacheco, R.S.; Boddey, R.M.; Alves, B.J.R.; Straliotto, R.; Araújo, A.P. Growth patterns of common bean cultivars affect the ‘B’value required to quantify biological N2 fixation using the 15N nat-ural abundance technique. Plant Soil 2017, 419, 293–304. [Google Scholar] [CrossRef]
  55. Balboa, G.R.; Ciampitti, I.A. Estimating biological nitrogen fixation in field-grown soybeans: Impact of B value. Plant Soil 2020, 446, 195–210. [Google Scholar] [CrossRef]
Figure 1. The field trial in Ivory station, Mid-West of Vakinankaratra, Madagascar: (a) schematic representation of the trial (for one fertilization level); (b) pictures of plots with legumes (personal pictures by A. Ripoche); (c) aerial view of the trial. Y1 to Y4 correspond to Cropping Year 1 to 4. G: groundnut; SC: sorghum–cowpea intercropping; VC: velvet bean–crotalaria intercropping.
Sustainability 13 12349 g001
Figure 2. Mycorrhizal structures (hyphae, vesicles, and arbuscules) in crotalaria roots stained with Schaeffer black ink (magnification ×20) (picture by H. Razafintsalama).
Sustainability 13 12349 g002
Figure 3. Principal component analyses of legume traits for all species and fertilization levels. Nodule DW: nodule dry weight; Nodule numb: nodule number; F. Myc: frequency of mycorrhiza in the root system; Shoot DW: shoot dry weight; Root DW: root dry weight; Shoot: Root: Shoot: Root ratio; % N Shoot: shoot N content; ‰ P Shoot: shoot P content; Shoot N:P: shoot N:shoot P ratio; %Ndfa: percentage of plant N derived from N2 fixation; Fixed N: amount of N fixed.
Sustainability 13 12349 g003
Figure 4. Legume shoot biomass (a) and N fixation (b) at first sampling (March) and biomass at harvest (April–May) (c) at the plot scale. Significance of the differences between intercropping and fertilization were tested with two-way ANOVAs with interactions. Since only intercropping presented a significant effect, ANOVAs were coupled with post-hoc Tukey tests. Treatments with significant differences (p-values < 0.05) are shown with different lower case letters.
Sustainability 13 12349 g004
Table 1. Legume traits for all species and fertilization modalities. Significance of the differences between species and fertilization were tested with two-way ANOVAs with interactions. Since all traits, except shoot N content, presented no significant responses (p-values > 0.05) to the species × fertilization interactive effects, ANOVAs were coupled with post-hoc Tukey tests. On the other hand, separate ANOVAs and post-hoc tests were performed per level of fertilization for shoot N to consider the species × fertilization interactive effect.
Mean ± Standard Error for the Main Effectsp-Values
Legume SpeciesFertilizationLegume SpeciesFertilizationLegume × Fertilization
GroundnutCrotalariaVelvet BeanCowpeaF1F2
Shoot DW (g m−2) 185 ± 65 a181 ± 52 a87 ± 36 b109 ± 19 b143 ± 68 A138 ± 57 A<0.0010.790.50
Root DW (g m−2) 54.3 ± 10.5 a34.0 ± 8.3 b6.5 ± 2.8 d19.7 ± 6.0 c30.6 ± 21.2 A26.6 ± 17.7 A<0.0010.170.51
Shoot: Root 3.34 ± 0.56 c5.30 ± 0.70 b14.38 ± 3.99 a5.82 ± 1.45 b6.46 ± 3.75 A7.96 ± 5.65 A<0.0010.080.42
% N Shoot (%)Total2.55 ± 0.183.07 ± 0.363.06 ± 0.442.83 ± 0.312.84 ± 0.412.92 ± 0.360.0070.440.04
F12.52 ± 0.26 a2.78 ± 0.18 a3.24 ± 0.46 a2.80 ± 0.44 a--0.09--
F22.59 ± 0.10 b3.36 ± 0.22 a2.89 ± 0.39 ab2.85 ± 0.17 ab--0.006--
‰ P Shoot (‰) 1.54 ± 0.22 a1.85 ± 0.41 a1.83 ± 0.28 a1.53 ± 0.31 a1.55 ± 0.32 B1.83 ± 0.30 A0.060.010.98
Shoot N:P 16.8 ± 2.2 a17.1 ± 3.0 a17.1 ± 3.8 a19.0 ± 3.9 a18.8 ± 3.5 A16.2 ± 2.4 B0.480.030.46
δ15N (‰) 2.02 ± 0.44 ab3.14 ± 1.29 a0.8 ± 0.72 b1.82 ± 0.83 b2.15 ± 1.10 A2.36 ± 1.27 A<0.0010.220.94
%Ndfa (%) 58.6 ± 5.1 ab49.7 ± 10.6 b66.2 ± 8.0 a59.9 ± 9.0 ab56.7 ± 11.4 A60.5 ± 8.4 A0.0050.200.32
Fixed N (g m−2) 2.53 ± 0.98 a2.72 ± 0.95 a1.94 ± 0.56 a1.83 ± 0.38 a2.15 ± 0.93 A2.36 ± 0.71 A0.050.420.07
Nodule numb (m−2) * 1158 ± 767 a118 ± 109 b82 ± 39 b61 ± 64 b456 ± 782 A254 ± 329 A<0.0010.150.62
Nodule DW (mg m−2) * 5.83 ± 2.76 a0.55 ± 0.52 b2.94 ± 1.37 a0.43 ± 0.37 b2.98 ± 3.23 A1.90 ± 1.97 A<0.0010.180.57
F. Myc (%) 8.8 ± 17.0 a6.7 ± 9.9 a11.3 ± 8.9 a5.4 ± 14.0 a7.71 ± 9.2 A8.33 ± 15.3 A0.400.790.10
M. Myc (%) 0.56 ± 1.511.07 ± 1.981.13 ± 2.01.01 ± 2.841.06 ± 1.940.82 ± 2.20
Species presenting significant differences are shown with different lower case letters (a,b,c,d), while fertilization levels with significant differences are shown with different capital letters (A,B). * Lm coupled with ANOVAs with the white.adjust method were applied to correct for heteroscedasticity. Shoot DW: shoot dry weight; Root DW: root dry weight; Shoot:Root: Shoot:Root ratio; % N Shoot: shoot N content; ‰ P Shoot: shoot P content; Shoot N:P: shoot N:shoot P ratio; δ15N:15N natural abundance; %Ndfa: percentage of plant N derived from N2 fixation; Fixed N: amount of N fixed; Nodule DW: nodule dry weight; Nodule numb: nodule number; F. Myc: frequency of mycorrhiza in the root system.
Table 2. Pearson correlation coefficient matrix of legume species traits (n = 32). Correlations were corrected for multiple comparisons error with the Benjamini–Hochberg method.
Nodule NbNodule DWF. MycShoot DMRoot DMShoot:Root% N Shoot‰ P ShootShoot N:P%Ndfa
Nodule DW0.86 ***
F. Myc–0.14–0.04
Shoot DW0.49 *0.30–0.11
Root DW0.74 ***0.50 *–0.150.82 ***
Shoot:Root–0.38–0.110.17–0.49 *–0.74 ***
% N Shoot–0.42.–0.33–0.11–0.27–0.45 *0.22
‰ P Shoot–0.30–0.150.17–0.09–0.280.260.49 *
Shoot N:P0.00–0.10–0.27–0.09–0.04–0.110.21–0.74 ***
%Ndfa–0.010.12–0.24–0.36–0.320.420.00–0.170.21
Fixed N0.340.22–0.290.73 ***0.50 *–0.160.040.08–0.030.11
* represents p-values < 0.05 and *** represents p-values < 0.001. Nodule DW: nodule dry weight; F. Myc: frequency of mycorrhiza in the root system; Shoot DW: shoot dry weight; Root DW: root dry weight; Shoot: Root: Shoot: Root ratio; % N Shoot: shoot N content; ‰ P Shoot: shoot P content; Shoot N: P: shoot N: shoot P ratio; %Ndfa: percentage of plant N derived from N2 fixation; Fixed N: amount of N fixed.
Publisher’s Note: MDPI stays neutral with regard to jurisdictional claims in published maps and institutional affiliations.

