Article

Multi-Stakeholder Impact Environmental Indexes: The Case of NeXt

by
Leonardo Becchetti
1,*,
Maristella Cacciapaglia
2,
Piergiuseppe Morone
3,
Luca Raffaele
4 and
Lorenzo Semplici
4
1
Department of Economics and Finance, University of Rome Tor Vergata, 00133 Roma, Italy
2
Jonian Department of Mediterranean Economic and Legal Systems: Society, Environment, Culture, University of Bari, 70121 Bari, Italy
3
Department of Economics, University of Rome Unitelma Sapienza, 00161 Roma, Italy
4
CESVA, NeXt—Nuova Economia per Tutti, 00153 Roma, Italy
*
Author to whom correspondence should be addressed.
Sustainability 2021, 13(22), 12364; https://doi.org/10.3390/su132212364
Submission received: 27 September 2021 / Revised: 26 October 2021 / Accepted: 28 October 2021 / Published: 9 November 2021

Abstract

:
The design of proper environmental and social indicators is one of the most critical challenges when monitoring and implementing corporate and government policy measures toward ecological transitions and sustainable development. In our paper we outline and discuss the characteristics of a new vintage of “living” multi-stakeholder community-based indicators based on the principles of self-evaluation, dialogue and simplification with a specific focus on the NeXt index. We explain the main differences between them and the opposite extreme of static expert-based indicators, how they integrate firm-level scores with compliance with macro multidimensional wellbeing indicators (such as the UN Sustainable Development Goals) and how they complement with ongoing regulatory standards currently under development. As well, we discuss caveats, policy implications and impact in terms of subjective wellbeing.

1. Introduction

Environmental and social goals are always bound to be more integrated with traditional economic goals in the coming future. The pressure coming from the ecological transition and financial investors’ awareness that environmental sustainability and the reduction of exposure to ESG (environmental, social, governance) risk will be crucial factors for future corporate competitiveness are constantly pushing corporations towards greater integration of these three dimensions. In this new scenario the development of sound and implementable environmental and social indicators becomes a crucial tool enabling companies to evaluate, learn about and signal their progress in ecological transition to consumers and investors, helping them to attract public and private financial resources, as well as increase consumers’ willingness to pay for sustainable products. Social and environmental indicators will also be a fundamental intermediate tools for crucial policy related actions such as: (i) developing standards for non-financial reporting metrics (along this path Settembre-Blundo et al. [1] focus on sustainability based risk management mechanisms, while Dwivedi et al. [2] focus on how value chain flexibility/rigidity affect corporate sustainability); (ii) defining admissible investment for private and government green bond issues (the market of private and government green bonds has been dramatically growing in the last years; the Climate Bond Initiative reports that the total volume of issues amounted to an adjusted USD 257.7 billion in 2019, 51% more than in the previous year [3]); (iii) elaborating minimum environmental criteria regulating access to the “institutional vote with the wallet” in public procurement (the importance of green public procurement for sustainable development has been acknowledged with a specific target within the Sustainable Development Goals (SDGs)—SDG target 12.7: “Promote public procurement practices that are sustainable, in accordance with national policies and priorities”. Public procurement is estimated to be around 13-20% of GDP for a total amount of nearly 9.5 trillion US dollars [4]); (iv) gaining access to green finance guarantee funds or tax allowances; and (v) outlining key performance indicators used as benchmarks for managerial bonuses and workforce wage premia.
Our paper aims to contribute to the literature of social and environmental indicators by discussing the innovation of “living” indicators with specific reference to the experience of NeXt multi-stakeholder community-based indicators (NeXt is a multi-stakeholder not-for-profit organization created by a network of constituents including consumers’ associations, trade unions, entrepreneurial organizations, public administrations, NGOs, schools and universities with the goal of promoting social and environmental responsibility.) In Section 3, we explain the difference between the NeXt “living” multi-stakeholder community-based approach, based on the principles of self-evaluation, dialogue and simplification, and, opposed to this, traditional static expert-based indicators.
Multidimensional wellbeing development goals demanding the creation of fit-for-purpose indicators are gradually becoming mainstream as researchers, analysts and policy makers become aware that GDP growth is not a proper measure of life sense and satisfaction [5,6]. In parallel, the social science literature has developed a wide set of social and environmental indicators measuring quality and progress in the relevant wellbeing domains. The set of indicators and methodologies adopted obviously differ on whether the degree of multidimensional wellbeing is calculated by territorial unit (i.e., countries, regions, municipalities), by firms or in first differences (impact) on private and public investments.
What generally happens in most cases, however, is that indicators are created by technical experts without stakeholder involvement and without a revision process, defined ex ante, for adjustment over time. This approach has several shortcomings. First, stakeholders’ knowledge, experience and points of view incorporate crucial information that does not usually overlap with that of the technical experts. By example, trade unions draw their timely updated ideas on what constitutes workers’ wellbeing from first-hand information in the workplace. In the same way, consumers’ associations being long tied to customer experience reclaims them, and they can formulate clear ideas from their experiences as to how product quality and customer service can contribute to consumers’ wellbeing, which cannot be identified with the mere consumer surplus (i.e., the difference between the reservation and the market price) as it is done in standard textbook microeconomics. At the same time environmental NGOs have experience and knowledge related to the most suitable green indicators and, therefore, consultation of their knowledge and experience could help experts to create better indexes in this specific domain.
Failure of technical experts to incorporate stakeholders’ information with timely consultation mechanisms can therefore lead to the design of poorer multidimensional wellbeing indicators, especially if we look at the problem in a dynamic perspective, where the evolution of economic and social conditions can change the importance and appropriateness of indicators over time.
The “living” NeXt indicators discussed in our paper are based on a multi-stakeholder co-design and consultation process, repeated over time, thereby addressing these two limits of static expert-based indicators (details of the approach are described in Section 4 and in a methodological appendix available upon request). The indicators, at firm level and in each of the relevant wellbeing domains, are also integrated with macroeconomic indicators, such as Sustainable Development Goals, and, in this way measuring corporate progress toward and contribution to those goals (an example on how development programs correlate with SDGs is provided by Zengin et al. [7] with reference to Society 5.0. Jianu et al. [8] show how SDG goals (in the specific case) can be useful to understand how much different countries are distant from wellbeing goals and how these goals can be achieved). Another crucial characteristic of the NeXt living indicators is the corporate self-assessment starting point of the process, helping to reduce fixed costs of evaluation that represent a barrier for small- and medium-sized companies and ensure proper adjustment to changes in the social and economic environment and dynamics.
This is the reason why, as we argue in what follows, “living” indicators based on a dynamic process of multi-stakeholder co-design, revision and participation can produce better outcomes than static technical expert indicators. The “assets” produced in the two cases are completely different. In the latter case the asset is the static indicator subject to depreciation over time, in former case the asset is the multi-stakeholder community and its process of dialogue and co-design and, as such, it has higher value being hardly replicable and depreciable.
The rest of our paper is organized as follows. In the Section 2, we present a short review of the literature, also identifying hybrid ancestors of the NeXt living indicator that follow intermediate methods between the static expert-based approach and the NeXt approach. In the Section 3 we sketch a theoretical framework on the quality and social acceptance of indicators. In the Section 4 we present characteristics of the NeXt indicators in detail, and Section 5 we describe their limits, policy implications and complementarities with the ongoing development of regulatory taxonomies.

2. A Short Review of the Literature

The literature on multidimensional wellbeing indicators originates from the consideration that GDP is not a sufficient indicator of subjective wellbeing as shown by the seminal contribution of the Easterlin [5] paradox and the following empirical research in the life satisfaction literature [9,10,11,12,13,14,15,16,17,18,19,20,21,22,23,24]
Accordingly, there have been numerous attempts to offer an alternative that has the same synthetic clarity as the GDP, which communicates its message with a single number or score (composite indices and indices directly in competition with GDP). These attempts include the Green GDP, the Ecological Footprint, the Index of Human Development, the Happy Life Years, the Happy Planet Index and the Happiness Atlas. These and similar attempts share a common multidimensional wellbeing approach (2007 Istanbul Declaration [24]). Among the latter, at an international level, similar innovative patterns have been followed by the Gallup research, the Australian experience, the Gross Domestic Happiness, the Canadian Index of Wellbeing, the Quality of Life index, the Better Life Index and the UN Happiness Report.
All these methodologies are mainly expert-based and do not include developed forms of stakeholder participation. The creation of BES (Benessere Equo e Sostenibile) indicators, in Italy, is an example of an intermediate hybrid form between the NeXt living community index and static expert-based indexes. The creation of the index followed “beyond GDP” suggestions of the Sen-Stiglitz Commission [25].
In order to develop the BES, the Italian National Statistical Institute (ISTAT) developed a four-step process. In the first step representative stakeholders of the Italian society were asked to define the main wellbeing dimensions [26] (these including: health, education and training, work and lifetime balance, economic wellbeing, social relations, politics and institutions, safety, subjective wellbeing, landscape and cultural heritage, environment, research and innovation, quality of services). In the second step, statistical and social science experts worked, in groups, on each of these dimensions to develop proper indicators. In the third step, the set of indicators created by experts was discussed with stakeholder representatives. In the fourth step the experts of each group defined the final list of selected indicators.
Overall, the BES includes 152 indicators grouped in the following three category lists: (1) global outcome indicators, able to provide information on the phenomenon as a whole; (2) specific life cycle indicators, which enrich global information with in-depth analysis related to risks that characterize specific phases of the life cycle; (3) indicators relating to risk factors or health protection factors deriving from lifestyles, which are useful for assessing the sustainability of the current levels of health of the population and their desirable improvement.
The BES system is a hybrid intermediate example between the static expert-based system and the living community-based system. It includes a process of dialogue, even though neither employ a co-design process nor a joint periodic update involving relevant stakeholders. Additionally—and differently from the NeXt index—BES is directed to measure wellbeing at the geographical level and not at the firm level, and, consequently, the interaction with corporate end-users (starting, in the NeXt indicators case, from corporate self-assessment) is not as relevant as it is the case when measuring corporate sustainability.
Beyond the BES process, community-participation approaches have gained prominence in recent years by improving governance and sustainability practices to include fair and valid evidence of impacts and by being the supply of information to the active involvement of stakeholders in projects decision. According to a “bottom-up” perspective, also driven by the awareness of the limits of “top-down” approaches, participatory methods can generate accurate quantitative and qualitative data and they can capture local priorities for greater validity in final decisions. Second, the legitimacy of the final outcome is higher when the potentially affected parties can state their own case before their peers and have an equal chance to influence the outcome (i.e., the process is fair). Third, public participation is identified as the proper conduct of a democratic government in public decision-making activities, since citizens mature into responsible democratic citizens and reaffirm democracy when they become involved in working-out a mutually acceptable solution to a project or problem that affects their community and their personal lives. Furthermore, participants can grow to understand their own strengths and abilities, leading to a sense of empowerment, specifically as in the case of empowerment evaluation [27,28,29,30,31,32,33,34].
More specifically, in the evaluation field, participation combined with both qualitative and quantitative methods of data collection can be suited to the purpose of engaging diverse stakeholders and capturing a system’s complexity and dynamics. On these premises, Guba and Lincon [35] proposed the so-called “fourth generation evaluation”, according to which evaluators cannot separate themselves from evaluands since data are created within this interaction. In this sense, evaluators must use a hermeneutic dialectic process and carry out their inquiries “in a way that will expose the constructions of the variety of concerned parties, open each to critique in the terms of other constructions, and provide the opportunity for revised or entirely new constructions to emerge”.
Similarly, integrated impact assessment and collaborative evaluation show the relevance of evaluations in which there is a significant use of varying combinations of survey, qualitative and participatory methods, as well as a certain degree of collaboration between the evaluator and stakeholders in the evaluation process’’ in order to meet competing demands [29,36].
Nevertheless, such approaches are often associated with little credible evidence on the impact of policy interventions or social projects. On the one hand, several community-based initiatives remain constrained by the need for quantifiable and ‘objectively verifiable indicators’ that allow regions to be compared. On the other hand, the few studies relying on rigorous impact evaluation strategies have not evaluated more comprehensive attempts to inform and involve the community in their process. Additionally, in evaluation studies as much as in urban ones, experts are not always involved to overcome a classical problem of active citizenship: the engagement of “really” disempowered citizens—the most vulnerable people, without any chance to affirm their voice [37,38,39].

3. A Theoretical Sketch of Our Hypothesis

In Equations (1)–(5) we sketch a theoretical argument outlining the difference between the NeXt multi-stakeholder community indicators and the static expert-based indicators.
We define the quality (by which we mean the capacity to capture, synthetically, the crucial features of a given phenomenon, its granularity (i.e., its capacity to translate different performances of corporate end users in indicator differences on a quantitative scale), the biunivocal correspondence between ranking order and quantitative order of two different performances; using the language of the utility function in economics these properties translate into reflexivity, transitivity and monotonicity) of an indicator (QI) as a function of the incorporated knowledge and experience of the different relevant stakeholders (ST) and corporate end users (CEU) plus the competence and technical skills of the statistical experts (SE).
QIt = f(CEUt, SEt, ΣiSTit) where = 1, …, N
Relevant stakeholders are those having skills, experience and competences on the given wellbeing domain (i.e., trade unions for the workers domain, consumers’ association for the product quality domain, environmentalist NGOs for the environmental sustainability domain). Statistical experts are those having know-how on the state-of-the-art and methodologies of wellbeing indicators, while end-users are the same object of companies’ NeXt scores that accept scrutiny and become users, since its definition confers to them advantages in terms of learning and monitoring their competitive position in an ecological transition.
We assume that the knowledge, experience and skills of the three actors do not perfectly overlap. More specifically, we assume that technical experts dispose of all analytical and statistical skills but, without sector specific experience, can miss the fact that some technically valid solutions fail to capture relevant aspects of the reality in that domain, or that it is impossible for corporate end-users to collect reliable information on a given indicator. On the other hand, corporate end-users and relevant stakeholders have important domain and sector specific knowledge but fail to understand how that knowledge can be translated into methodologically rigorous indicators.
Relevant stakeholders, corporate end-users and statistical expert abilities are updated following the evolution of the state of affairs in the social, environmental and economic dimension, as in Equation (2):
STit = k(w(ST)t), CEUt = e(w(CEU)t), SEit = s(w(SE)t)
where k, e and s are the different functional forms reflecting how different actors of the index update their skill (w) over time.
The degree of social and political acceptance of an indicator, on stakeholders’ and corporate end-users’ side (SA), is, in turn, a function of its quality (QI), cost (in terms of adoption and compliance) (C), friendliness (F), and involvement (FI).
SAt = g(QIt, Ct, Ft, Invt)
All of the four factors are higher in a living index due to the process of dialogue between experts and stakeholders first producing a co-design of the indicators, followed by periodic consultation for revision.
In the opposite extreme, a static expert-based index fails to incorporate information from stakeholders. Its quality is lower and the degree of acceptance by stakeholders is markedly inferior, both due to a lack of involvement in the process (we refer, here, to the theoretical and empirical literature of procedural utility [19] showing that the acceptance of a given decision of an individual depends on the degree of her/his involvement in the process leading to such decision).
This theoretical framework makes it easy to understand how a static expert-only-based index (SEI) is at the extreme opposite of a living multi-stakeholder community (NEXT) index.
We, in fact, obtain:
QIt(SEI) = f(SEt0) < QIt(NEXT) = f(CEUt, SEt, ΣiSTit)
and
SAt(SEI) = g(f(SEt0)) < SAt(NEXT) = g(f(CEUt, SEt, ΣiSTit), Ct, Ft, Invt)
Another crucial difference between an SEI and a NeXt index is that the asset of the former is the set of indicators defined at a given point in time. As such the asset is subject to strong depreciation and can be easily imitated. In the NeXt case, the asset is the community of technical experts, relevant stakeholders and corporate end-users in dialogue and consultation. Such asset is not subject to the same rate of depreciation and cannot be easily imitated.
To conclude, living multi-stakeholder indexes of higher quality and adoption rates create the conditions for their superior contribution to sustainability progress.
The NeXt index, therefore, proves much more suitable for the process of trial, error and update required by the complexity of the task at stake and the evolving nature of the economic scenario.

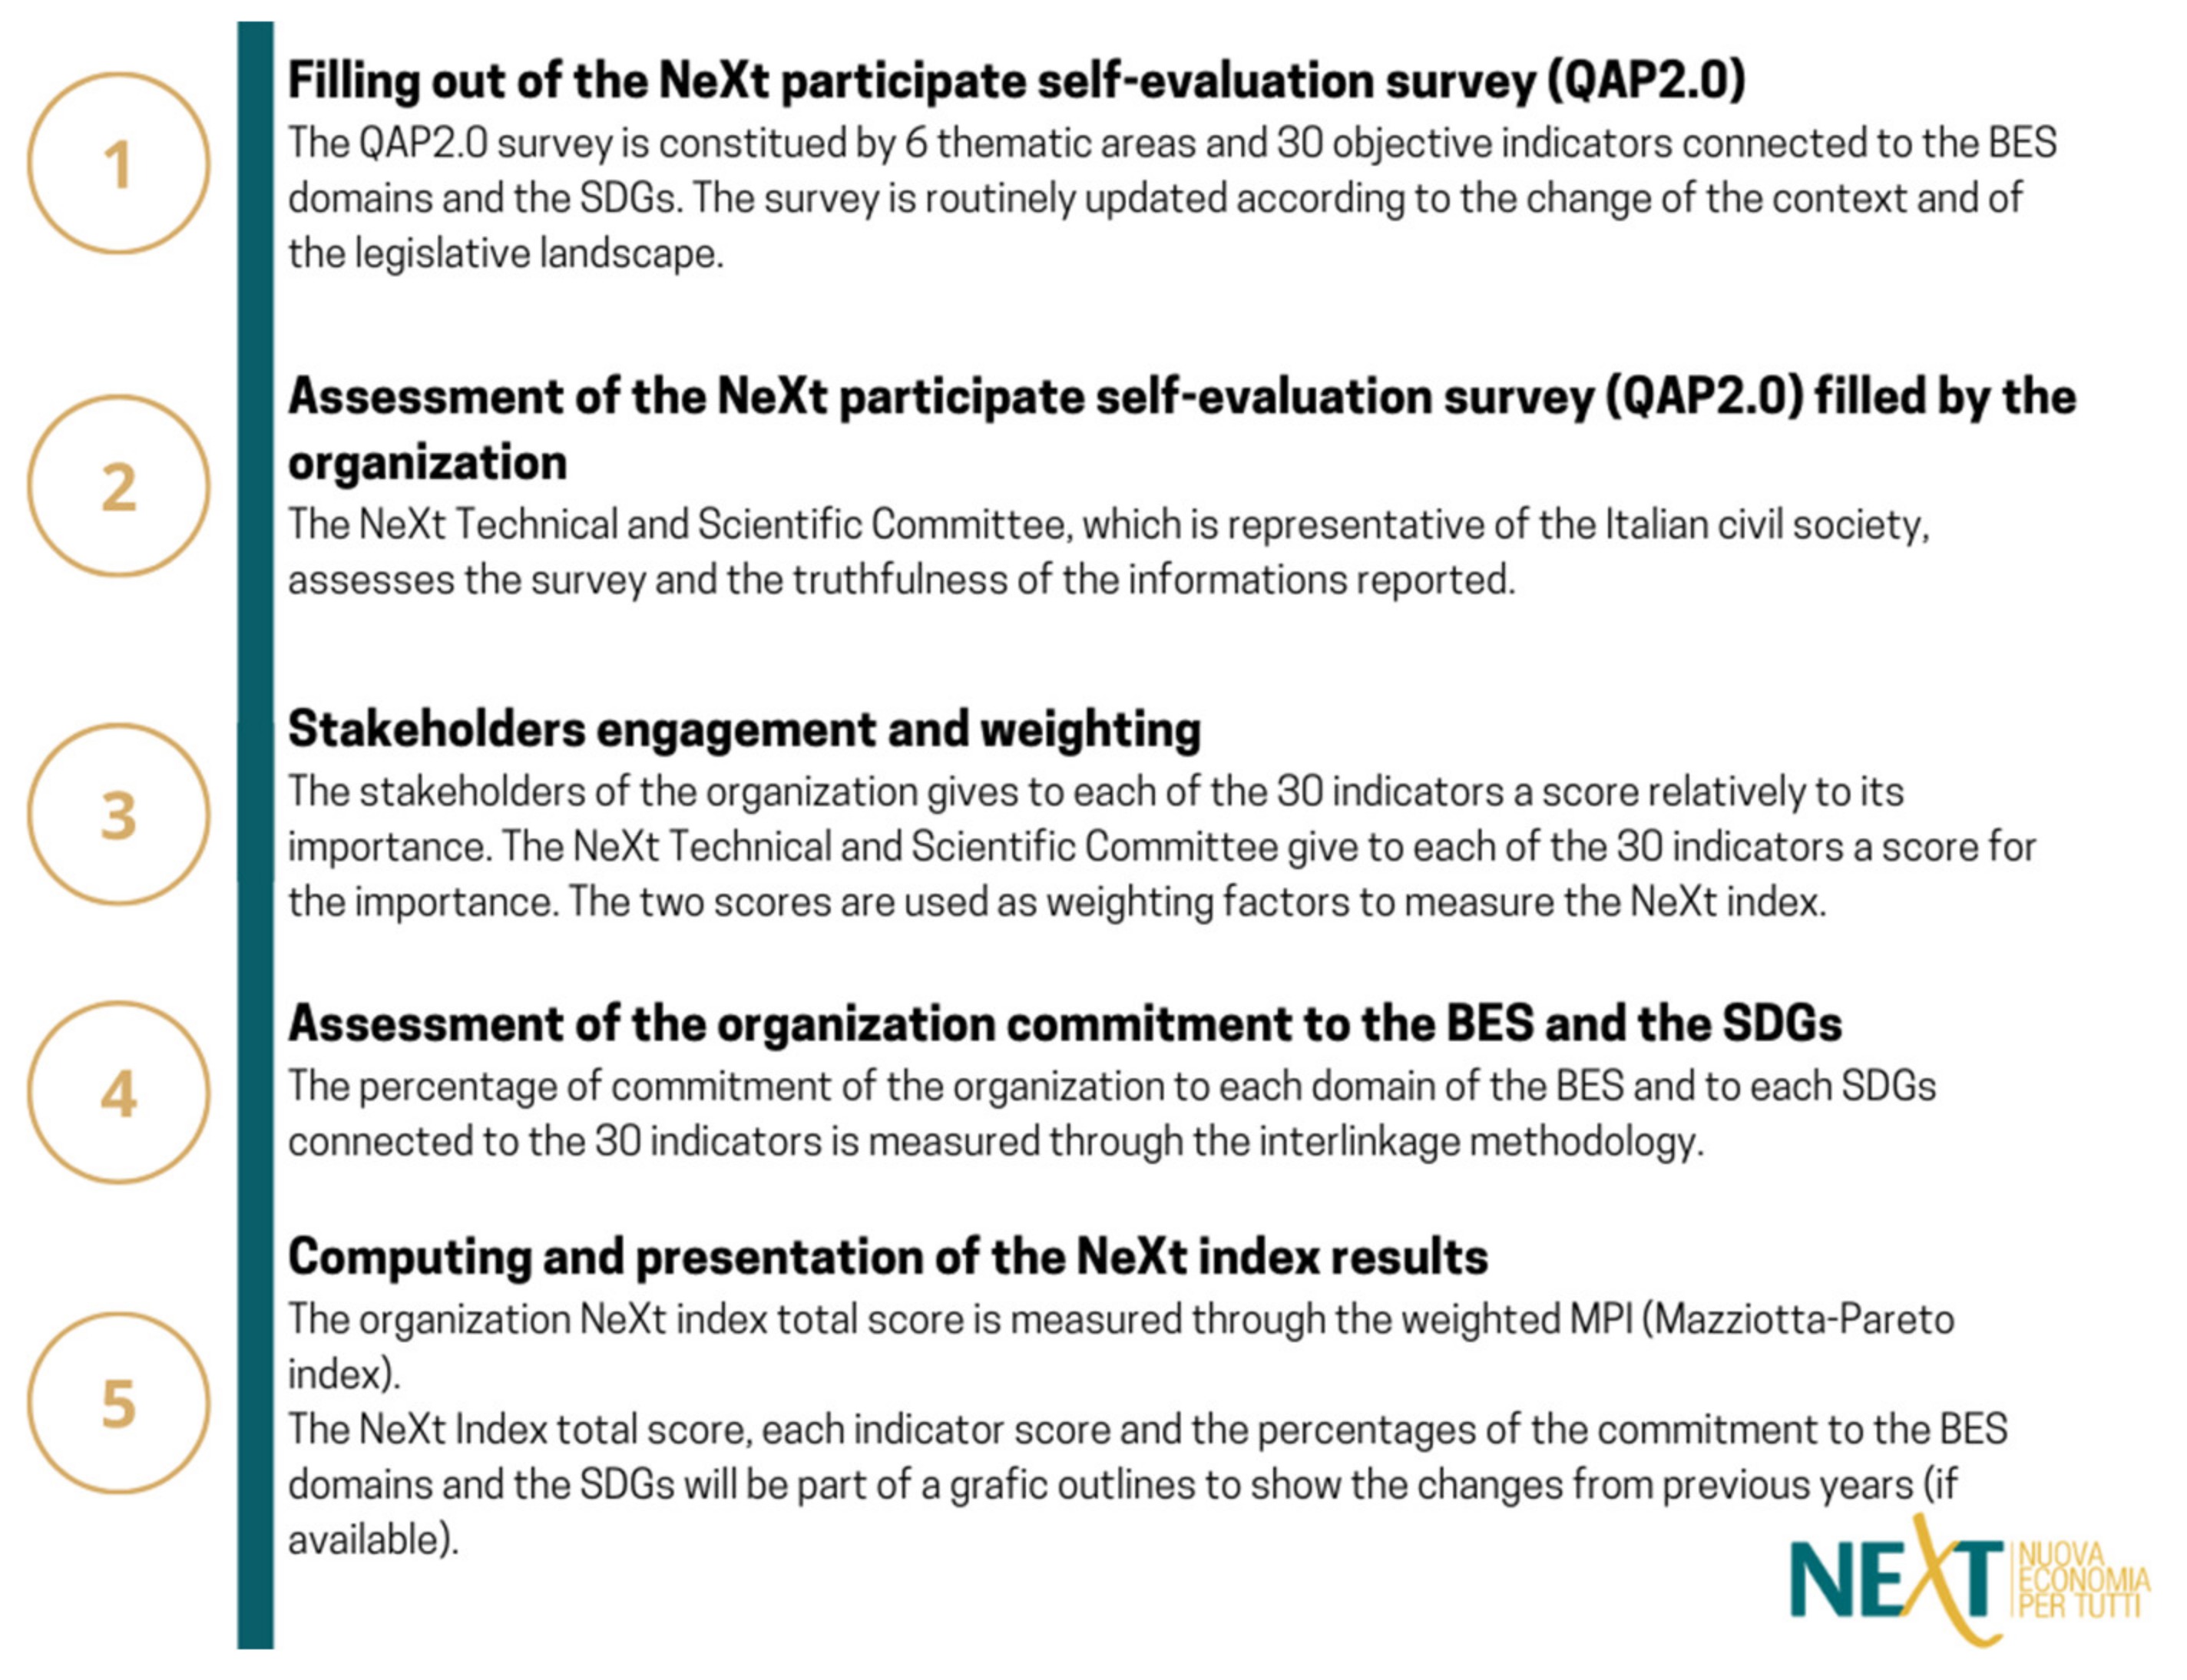
4. The Process for the Construction of the NeXt Index

The basic tool to calculate NeXt indicators is the Participatory Self-Assessment Survey 2.0 (PSAS 2.0) co-designed over time by a community including statistical experts, relevant stakeholders and corporate end users and timely revised at regular intervals (see Figure 1 for a graphic description of the steps required to create the Index (the PSS 2.0-NeXt index can be accessed on-line at www.nexteconomia.org, accessed on 9 October 2020, where corporate end users are asked to register before performing their self-assessment). The group of statistical experts is based on members of the NeXt Scientific Committee (see the list provided in Appendix A).
The survey includes five indicators for each of the following six relevant domains: (i) governance; (ii) workers; (iii) consumers; (iv) the environment; (v) suppliers in the value chain and (vi) local communities, for a total of 30 indicators. Scores for each indicator are provided on a discrete qualitative scale from one (minimum) to five (maximum) (questionnaire details, describing each domain and the related indicator, are in Appendix B).

4.1. Calculus and Ponderation of Individual NeXt Indicators

The evaluation process follows two steps. In the first step corporate end-users perform their self-assessment report attributing a score in a one-to-five range to each of the 30 indicators in the six different domains. For any indicator, the survey presents a column where corporate end users are asked to copy links to corresponding documents supporting their self-assessed score. In the second step of the evaluation process the relevant stakeholders and statistical experts evaluate whether the information provided is consistent with the self-assessed score. If so, they confirm the self-assessed score, otherwise they ask for further evidence consistent with the self-attributed score or revise the latter, consistently with the available information.
If statistical experts evaluate that a given indicator does not apply to the given business the indicator is left missing and the overall score is reparametrized using a standard n/n-m correction factor that takes it into account where m is the total number of indicators in the NeXt index and m is the number of missing indicators.

4.2. Aggregation of NeXt Indicators

Aggregation of indicator specific scores from each of the five domains (for total scores in domains and across domains) is performed using the Mazziotta-Pareto [40] Index (MPI) (see Appendix C). This methodological choice has been made to penalize horizontal variability (i.e., companies with higher variability in individual scores) for a given same unweighted arithmetic mean in order to give value to regularity and penalize low scores on some indicators implying poor evaluation from some of the relevant stakeholders. The theoretical rationale is that the logic of “integral” (all-round) sustainability implies a penalty for low scores on a specific indicator or area.
The total aggregate scores and total domain scores are rescaled on a 0–100 interval.

4.3. Calculation of NeXt Indicators’ Impacts in Terms of Macroeconomic BES and SDG Domains

Each indicator is linked to a priority reference BES and SDG domain. More specifically on this point, the overall structure of the PSAS2.0 NeXt index is based on a two-sided reference framework:
(i)
An international framework calculating links and the consistency of NeXt indicators with the Sustainable Development Goals of Agenda 2030 (https://unric.org/it/agenda-2030/, accessed on 9 October 2020), issued in 2015 by the United Nations; this implies that each of the 30 NeXt indicators is linked with a reference priority SDG. Such ink made by connecting the survey indicators, the GRI framework indicators (https://www.globalreporting.org/Pages/default.aspx, accessed on 9 October 2020) and the SDGs to each other. The first match was made by the NeXt Study Center, while the SDGs Compass platform (https://sdgcompass.org/, accessed on 9 October 2020) was used for the second match. This platform helps companies implement coherent business strategies with the social and environmental sustainability indicators set by the UN Agenda 2030.
(ii)
A national framework calculating links of NeXt indicators with the 12 domains of Benessere Equo e Sostenibile (https://www.istat.it/it/benessere-e-sostenibilit%C3%A0/la-misurazione-del-benessere-(bes)/gli-indicatori-del-bes accessed on 9 October 2020), the Italian multidimentional wellbeing framework designed by Istat [41,42,43], here recalibrated on a corporate basis, becoming BESA, which stands for “fair and sustainable corporate wellbeing” (this implies that each of the 30 NeXt indicators is linked with a reference to a priority BES domain). Link made by connecting the survey indicators, the GRI framework indicators and BES domains to each other. The first match was made by the NeXt Study Center while the BESA theoretical framework was used for the second match.
Reference to these three frameworks enables the PSAS2.0-NeXt to calculate the corporate end-user’s capacity to generate multidimensional wellbeing, through the activation of network based processes of sustainable development.
At the end of the evaluation process the final set of NeXt scores (compared with past evaluations, if applicable) is given by: (i) total aggregate score; (ii) degree of corporate commitment in terms of BES and SDG domains; (iii) domain score and (iv) individual scores for each of the 30 indicators (an example of results is provided in Figure 2).

5. Discussion

The success of the living index depends on the level of commitment of the actors from the three involved categories (statistical experts, relevant stakeholders and corporate end-users) and their willingness to participate in and activate the process. This, in turn, will depend on the perceived participation benefits. The benefit of statistical expertise is the refinement of the indicators (and underlying theories and methodologies) with knowledge and experience of the relevant stakeholders and corporate end-users, allowing the design of proof-tested, better fit-for-purpose indicators. The benefits from relevant stakeholders’ participation are found in possibility of co-designing tools that can help them to achieve their statutory goals, as represented by the wellbeing of their stakeholder category. The living indicators can, in fact, create a dialogue with corporate end-users that fosters progress toward higher labor dignity and worker satisfaction (the goal of trade unions), higher product quality and consumers satisfaction (the goal of consumers’ association), greater environmental sustainability (the goal of environmentalists’ association) and a higher quality of life of local communities. The goal of other NGOs and organizations included among relevant stakeholders). The benefit of involving corporate end-users consists in having a dashboard of indicators that allows them to monitor progress and position in terms of stakeholder satisfaction. Monitoring such position is going to be increasingly relevant, given the recent strategies and orientations of financial investors and regulators; the CEO of the first global investment fund, BlackRock, in its 2018 letter to CEOs said that Without a sense of purpose, no company, either public or private, can achieve its full potential. It will ultimately lose the license to operate from key stakeholders. It will succumb to short-term pressures to distribute earnings, and, in the process, sacrifice investments in employee development, innovation, and capital expenditures that are necessary for long-term growth. It will remain exposed to activist campaigns that articulate a clearer goal, even if that goal serves only the shortest and narrowest of objectives. And ultimately, that company will provide subpar returns to the investors who depend on it to finance their retirement, home purchases, or higher education” [44]. From this perspective the living index tends to create a separating equilibrium among potential corporate end-users. On the one hand are those reporting high scores, who regard, as optimal, their reputational gains from publicizing their scores (thereby earning a place on the NeXt online, geo-referenced good-practice map that can lead to these individual scores, https://www.nexteconomia.org/, accessed on 6 September 2020). On the other hand are those having lower scores, who prefer they not become public but nonetheless find it important to calculate the values of the indicators in order to monitor their positions with relevant stakeholders.
An important limit of the NeXt approach is that its score attribution, starting from the corporate end-user self-assessment, can certainly reduce costs and simplify the process, at the risk, however, of self-reporting bias. The problem relates to the main issue of green and social washing [45], wherein washing becomes the corporate choice when gains from upward-biased self-declared corporate responsibility are higher than expected costs (probability of being detected times the cost of “punishment”) of loss of reputation once caught [46,47].
The NeXt approach corrects for this in three ways. First, it defines strict correspondence between objective outcomes and indicator scores for items where this is possible (i.e., the ratio between the top and bottom corporate wages, taking a value of one to five, according to different intervals of the corporate top–bottom wage ratio). Second, it asks companies to provide evidence and documentation, where available, to justify their own self-assessment. Third and more important, it asks relevant stakeholders to evaluate such self-reported scores. The advantage of the living-index-participation approach is, therefore, that of providing an immediate stakeholder check of corporate declarations, thereby increasing the expected cost of being detected in terms of the timing of audits, the quality of information and country-representativeness of the auditing stakeholders). This is expected to reduce the temptation toward green and social washing, despite of the opportunity to self-report one’s own level of corporate responsibility.
A second crucial issue is how NeXt indicators interact with existing regulation in progress. As is well known, there has been a growing effort in incorporating ESG factors in the financial industry in recent years. According to a recent PWC survey, 77% of global fund managers plan to exclude stocks with low ESG standards from their portfolios in the next two years, and most of them calculate the exposure of their stock to ESG risk, considered a risk factor independent from those traditionally considered (https://www.bloomberg.com/news/articles/2020-10-19/almost-60-of-mutual-fund-assets-will-be-esg-by-2025-pwc-says, accessed on 3 January 2021). Given the growing relevance of corporate social responsibility (CSR) concerns and the willingness of responsible financial investors to pay for it, the temptation of fraudulent CSR reporting grows and, with it, the risk of greenwashing if the expected gains are higher than the expected costs of detection and punishment, in economic and reputational terms. This is why EU institutions have launched two main initiatives. The first is the EU Taxonomy on Sustainable Activities (https://ec.europa.eu/info/business-economy-euro/banking-and-finance/sustainable-finance/eu-taxonomy-sustainable-activities_en, accessed on 7 November 2020), in which the characteristics of investment that can be regarded as sustainable in each of the six domains (climate adaptation, climate mitigation, circular economy, pollution, water, biodiversity) are progressively defined for each industry. The second is the regulation on sustainability-related disclosure in the financial services sector (https://ec.europa.eu/info/business-economy-euro/banking-and-finance/sustainable-nance/sustainability-related-disclosure-financial-services-sector_it, accessed on 8 October 2020) that is redefining ESG disclosure precisely to address greenwashing. According to this regulation, investment funds can promote their ESG characteristics to investors only if they rigorously report progress in the environmental quality of their stock portfolio and alignment with the EU Taxonomy for the so-called Article-8 and Article-9 products.
Differently from the recent EU regulation that mainly concerns large capitalization of listed securities, the NeXt approach is also implementable also for small- and medium-sized companies (the large majority, especially in European economies) and covers a wider range of CSR domains, not limiting its scope to environmental issues. The issue of following as close as possible (or not falling into contradiction with the two ongoing regulatory processes) nonetheless applies when the different measurement paths apply to the same companies.
A crucial issue arising with the living indicator approach, similar to the circumstances for static indicators, is the risk of not speaking the same language, as international standards are going to be progressively created in the field. The reasons why occur are, however, different between these two cases. In static expert-based indicators, this occurs because of the missing revision process. In the case of living indicators, it can happen because the dynamic evolution driven by the interaction among participants can lead to directions that do not converge on international standards. A living index has, however, two strategies for coping with the problem. The first is endogenous in the process, since all participants feel the need to comply with international standards and to push toward them. The second is that the system includes methodologies that translate the original indicators into effort in standard classification domains (as is the case for BES and SDGs).

6. Conclusions: Limits and Direction for Future Research

Social and environmental indicators will play an increasing role in the future of ecological transition under the pressure of the urgent transformation required by the climate challenge and the induced reforms of the regulatory framework.
In our paper, we have argued that the move from static expert-only based indicators to “living” multi-stakeholder community-based indicators, developed through participatory processes and co-design between statistical experts, end-users and relevant stakeholders, is crucial to the quality of indicators and their success, in terms of adoption by end-users and society overall. While, in the first type of index, the main asset is the static set of indicators and, as such, it is subject to rapid obsolescence and depreciation, in the second type of (living multi-stakeholder) index, the asset is the dialogue and interaction (co-design and periodic revision) within a heterogeneous community of technical experts, relevant stakeholders and end-users.
We have also emphasized that a living community-based index has other important advantages, as it fosters a process of learning among participants, it simplifies and reduces the costs of reporting for companies and is, therefore, easily implementable, even by small- and medium-sized firms, allowing them to keep pace with and monitor their progress toward ecological transition.
The main policy conclusion of our research is that the development of community-based living indicators can significantly improve upon traditional ones in several respects, such as better considering the points of view of end-users and relevant stakeholders, leading to easier social acceptance, easier implementation for small- and medium-sized firms, timely updating and greater involvement and participation from all the relevant actors in society. Owing to these properties, such indicators have the advantage of more effectively stimulating involvement in ecological transition goals and, therefore, progress in sustainability.

Author Contributions

All authors (L.B., M.C., P.M., L.R. and L.S.) contributed to Section 2, Section 3 and Section 4 related to the construction and discussion of the methodology. M.C., L.S. and L.B. worked on introduction, discussion and conclusions. All authors have read and agreed to the published version of the manuscript.

Funding

This research received no external funding.

Institutional Review Board Statement

Not applicable.

Informed Consent Statement

Not applicable.

Data Availability Statement

Not applicable.

Conflicts of Interest

The authors declare no conflict of interest.

Appendix A

Table A1. List of the 42 NeXt stakeholders by stakeholder type.
StakeholdersStakeholder Type
EarthDay Italia, Legambiente, Kyoto Club,Environmental Ngos
Acli, AOI Cooperazione, ARCI, Cittadinanzattiva, CSVNet, CVX, Fondazione Lanza, Forum Nazionale del Terzo Settore, Transparency International, Opera del Murialdo, Fondazione EbbeneOther Ngos
Adige, Fim-CISL, CGIL, CISL, First Social Life, Flaei, UIL,Trade Unions and/or workers’ associations
Adiconsum, Adoc, Federconsumatori, Movimento Consumatori,Consumers’ association
Aipec, Anima, UCID, Fondazione Sodalitas, Entepreneurs’ associations
Altromercato, Banca Etica, Confcooperative, Federcasse, Legacoop,Cooperative associations and/or social business
FairTradeItalia, Impronta Etica, PEFC Italia,Label and/or certifying and rating companies
Istituto Maria Ausiliatrice, Tor Vergata, Unitelma Sapienza, ErsHub,Education institutions
VitaMedia Companies

Appendix B

Table A2. The NeXt Participatory Self-Assessment Survey 2.0 (PSAS 2.0): areas and indicators.
AREASINDICATORSLINK with SDGs and BES
THE CORPORATE AND ITS GOVERNANC1.1. Transparency on shareholders and sources of capital
Criterion: transparency on capital ownership with respect to a control group (percentage value). For example: if the main shareholders are X (15%), Y (12%) and Z (8%), the information concerns 35% of the ownership.
-
Less than 10% (score 1)
-
11–30% (score 2)
-
31–50% (score 3)
-
51–70% (score 4)
-
Greater than 70% (score 5)
Sustainability 13 12364 i001
1.2. Corporate culture and actions against illegality and corruption
Criterion: control of suppliers’ legality and transparency, to be expressed in percentage terms with respect to the controlled suppliers total amount
-
Less than 10% (score 1)
-
11–30% (score 2)
-
31–50% (score 3)
-
51–70% (score 4)
-
Greater than 70% (score 5)
Sustainability 13 12364 i002
1.3. Management strategy and attention to diverse stakeholders
Criterion: levels and modes of stakeholders’ engagement, to be expressed through numerical values
-
The firm disregards stakeholders’ engagement (score 1)
-
The firm is aware of the stakeholders’ engagement value, but there is no direct involvement (for example, the company only engages them via indirect links and online research) (score 2)
-
The firm is aware of the stakeholders’ engagement value and their direct involvement (for example, one meeting with stakeholders) (score 3)
-
The firm dialogues with its stakeholders and also involves them in corporate strategy decisions (for example, at least two meetings with stakeholders (score 4)
The firm dialogues with its stakeholders, involves them in corporate strategy decisions, and measures stakeholders’ satisfaction levels (for example, at least three meetings with stakeholders and measurement of satisfaction level for each of them)
Sustainability 13 12364 i003
1.4. Employee participation and involvement in corporate strategy decisions
Criterion: stakeholders’ engagement in corporate strategy decisions, to be expressed in percentage terms (100% stands for their engagement in every corporate decisions made)
-
None (score 1)
-
Consulting employees for less than 30% of corporate decisions (score 2)
-
Consulting employees for more than 30% of corporate decisions (score 3)
-
Sharing and asking for employees’ participation in less than 30% of corporate strategy decisions (score 4)
-
Sharing and asking for employees’ participation in more than 30% of corporate strategy decisions (score 5)
* Explain what kind of decision is shared.
Sustainability 13 12364 i004
1.5. Differential between min. and max. remunerations within the company
Criterion: differential between the maximum annual remuneration for the best paid and the minimum annual remuneration for the least paid.
-
Less than 6 (score 5)
-
6–12 (score 4);
-
13–25 (score 3);
-
26–40 (score 2);
-
More than 41 (score 1)
Sustainability 13 12364 i005
PEOPLE AND THE WORKING ENVIRONMEMT2.1. Collaborative, participatory and supportive working environment
Criterion: job satisfaction share based on work climate surveys, (percent of at least satisfied workers)
-
Less than 40% (score 1)
-
41–50% (score 2)
-
51–65% (score 3)
-
66–80% (score 4)
-
More than 80% (score 5)
* To be applied to companies with more than 100 employees only.For companies with less than 100 employees: express the company’s own value, explaining the choice on the basis of employees’ participation/engagement.
Sustainability 13 12364 i006
2.2. Respect for employee dignity through fair remuneration (concerning work schedule, tasks performed, and responsibilities assigned)
Criterion: positive differential between the total amount of remunerations paid by the company and the minimum levels set by the main union contracts (annual basis), to be expressed in percentage terms
  • None (score 1)
  • Less than 5% (score 2)
  • 5–10% (score 3)
  • 11–20% (score 4)
  • More than 20% (score 5)
* To be applied to companies with more than 50 employees only. In any other case, to be considered as “not applicable”
Sustainability 13 12364 i007
2.3. Dialogue with workers representatives on health and safety at work
Criterion: attendance and engagement (of both informative and consultative kind) of one workers’ representative for safety and one workers’ representative for territorial safety
-
None (score 1)
-
Attended, but neither informed nor consulted (score 2)
-
Attended, but informed only on a few aspects (score 3)
-
Attended and informed on all aspects (e.g.: accidents at work, risk assessment, prevention and organizational measures, etc.) (score 4)
-
Attended, informed, and consulted on all aspects (score 5)
Sustainability 13 12364 i008
2.4. Work-Life balance (smart working, gender opportunities, etc.)
Criterion: attendance and diversity of work-life balance agreements
-
None (score 1)
-
One agreement or unilateral decision on work-life balance for a specific employee category (score 2)
-
One agreement or unilateral decision on work-life balance for all employee categories (score 3)
-
Two agreements or unilateral decisions on work-life balance for a specific employee category or for all employee categories (score 4)
-
More than two agreements or unilateral decisions on work-life balance for a specific employee category or for all employee categories (score 5)
Sustainability 13 12364 i009
2.5. Employee career development, rewarding employees skills and experience through training and lifelong learning
Criterion: for each employee, annual average of training and continuing education hours
-
Less than 10 (score 1)
-
11–20 (score 2)
-
21–30 (score 3)
-
31–50 (score 4)
-
Higher than 51 (score 5)
Sustainability 13 12364 i010
RELATIONSHIPS WITH CITIZENS AND CONSUMERS3.1. Listening, dialogue and relationships tools with consumers to understand and improve their satisfaction (by facilitating dialogue on both new and traditional media, etc.)
Criterion: attendance and diversity of relational tools with clients/consumers
-
None (score 1)
-
Unilateral dialogue (e.g., toll-free number) (score 2)
-
Regulated dialogue (e.g., regulated toll-free number) (score 3)
-
Digital/analogue channels with precise guidelines (score 4)
-
Digital/analogue channels with dedicated employee(s), in accordance with corporate mission and culture (score 5)
Sustainability 13 12364 i011
3.2. Full and documented information on the environmental and social sustainability of products/services and all related processes, available to customers
Criterion: information on products/service available on labels and informative material
-
Information available on labels as legally required (score 1)
-
Additional information available on labels, beyond the legally required information (score 2)
-
Additional information available on labels, through a link to the corporate website (score 3)
-
Additional information available on labels about supply chain traceability (score 4)
-
Additional information about supply chain through ICT/multimedia systems (e.g., blockchain, GS 1 barcode) (score 5)
* To be applied to companies developing services for citizens only
Sustainability 13 12364 i012
3.3. Customers’ valorization as a stimulus for partnership innovations and co-design of products/services
Criterion: attendance and diversity of interaction modes with clients
-
The firm disregards customers’ suggestions and indications (score 1)
-
The firm considers customers’ suggestions and indications (score 2)
-
The firm interacts with single customers’ (e.g., through social media and F.A.Q.) (score 3)
-
The firm interacts with consumers associations (score 4)
-
The firm develops shared improvement actions (score 5)
Sustainability 13 12364 i013
3.4. Effective ways for complaint management and resolution, guaranteeing proper response times and satisfaction levels
Criterion: attendance and diversity of complaint management strategies
-
No way of contact with customers after-sale (score 1)
-
Unregulated and unilateral after-sale contact with customers (e.g., online form) (score 2)
-
Direct after-sale contact with customers (score 3)
-
Regulated and direct after-sale contact with customers (score 4)
-
Joint conciliation and activation of stable partnerships with consumers associations (e.g., ethical and control committees created with consumers associations in order to monitor processes and all tracking criteria) (score 5)
Sustainability 13 12364 i014
3.5. Measurement of customers satisfaction rate (percent of customers at least satisfied customers)
Criterion: customer satisfaction rate
-
Less than 60% (score 1)
-
60–70% (score 2)
-
71–80% (score 3)
-
81–90% (score 4)
-
Higher than 90% (score 5)
Sustainability 13 12364 i015
THE SUPPLY CHAIN4.1. Supply chain transparency
Criterion: public visibility of suppliers on the company’s website, to be expressed in percentage terms (percent value share of visible suppliers on total suppliers value)
-
No information available (score 1)
-
Less than 10% (score 2)
-
10–30% (score 3)
-
31–60% (score 4)
-
Higher than 60% (score 5)
Sustainability 13 12364 i016
4.2. Activation of criteria and procedures concerning the choice of direct suppliers and their socio-environmental sustainability
Criterion: relationship between sustainable suppliers and all suppliers, to be expressed in percentage terms (avoiding minimum price bid auctions without concern for environmental and social criteria and choices based on cost savings only)
-
None (score 1)
-
Less than 10% (score 2)
-
10–30% (score 3)
-
31–60% (score 4)
-
Greater than 60% (score 5)
Sustainability 13 12364 i017
4.3. Adoption and applications of monitoring tools by suppliers on the socio-environmental sustainability
Criterion: monitoring suppliers’ care towards ethics and human rights, through local visits as well as interviews to managers and employees, to be expressed in percentage terms (percent of the value share of monitored suppliers on total suppliers value)
-
None (score 1)
-
Less than 10% (score 2)
-
10–30% (score 3)
-
31–60% (score 4)
-
Higher than 60% (score 5)
Sustainability 13 12364 i018
4.4. Fair and transparent agreements on suppliers’ payments
Criterion: late payments with respect to the total amount of payments to suppliers, to be expressed in percentage terms
-
Higher than 70% (score 1)
-
51–70% (score 2)
-
31–50% (score 3)
-
11–30% (score 4)
-
Less than 10% (score 5)
Sustainability 13 12364 i019
4.5. Indirect suppliers’ compliance with sustainability principles for the purchase of raw/processed products
Criterion: relationship between the number of materials/tools/products purchased according to sustainability criteria and the total number of materials/tools/products, to be expressed in percentage terms
-
Less than 10% (score 1)
-
11–30% (score 2)
-
31–50% (score 3)
-
51–70% (score 4)
-
Higher than 70% (score 5)
Sustainability 13 12364 i020
ATTITUDES/RESPONSABILITY TOWARD THE ENVIRONMENT5.1. Climate change mitigation and energy efficiency
Criterion: energy efficient deviation from the sectors’ standard greenhouse gases emissions, percent
-
None (score 1)
-
Less than sector standards (score 2)
-
0–5% (score 3)
-
6–15% (score 4)
-
Higher than 15% (score 5)
Sustainability 13 12364 i021
5.2. Circular economy approach through proper waste management
Criterion: efficiency trend about resource use (reduction of landfill waste), percent
-
None (score 1)
-
1–5% (score 2)
-
6–10% (score 3)
-
11–20% (score 4)
-
Higher than 20% (score 5)
Sustainability 13 12364 i022
5.3. Energy supply from renewable sources
Criterion: energy supply from renewable sources, percent
-
Less than 30% from outside distributors (score 1)
-
31–60% from outside distributors (score 2)
-
More than 60% from outside distributors (score 3)
-
31–60% from own renewable sources (score 4)
-
Higher than 60% from own renewable sources (score 5)
Sustainability 13 12364 i023
5.4. Communication and education initiatives to promote environmental responsibility among citizens
Criterion: availability of communication and education initiatives to promote environmental responsibility among citizens, to be expressed in percentage terms (e.g., if the firm provides information for environmental education on 30 products over 100, the answer is 30%)
-
Information for environmental education on less than 20% of products/services (score 1)
-
Information for environmental education on 20–40% of products/services (score 2)
-
Information for environmental education on 41–60% of products/services (score 3)
-
Information for environmental education on 61–80% of products/services (score 4)
-
Information for environmental education on more than 80% of products/services (score 5)
Sustainability 13 12364 i024
5.5. Responsible consumption of natural resources (raw materials, water, soil, etc.)
Criterion: two-year reduction trend of raw materials consumed for corporate activities, percent
-
No reduction (score 1)
-
3–5% (score 2)
-
6–7% (score 3)
-
8–10% (score 4)
-
Greater than 10% (score 5)
Sustainability 13 12364 i025
ATTITUDES/RESPONSABILITY TOWARDS THE LOCAL COMMUNITY6.1. Openness and confrontation with local communities on corporate activities and their impact
Criterion: worked hours in activities such as meetings on the local heritage, in comparison with the total amount of worked hours, percent
-
None (score 1)
-
Less than 2% (score 2)
-
3–4% (score 3)
-
5–6% (score 4)
-
Higher than 6% (score 5)
Sustainability 13 12364 i026
6.2. Constant dialogue and sharing with local stakeholders (institutions, organizations and others)
Criterion: average number of meetings with each stakeholder’s category (initiatives and working groups)
-
None (score 1)
-
1–2 (score 2)
-
3–5 (score 3)
-
6–10 (score 4)
-
Higher than 10 (score 5)
Sustainability 13 12364 i027
6.3. Participation and support to local development policies, including valorization of local environment and cultural heritage
Criterion: reference to projects supporting local development policies, to be expressed in percentage terms in comparison with the corporate profit
-
Less than 1% (score 1)
-
1–5% (score 2)
-
6–10% (score 3)
-
11–20% (score 4)
-
Higher than 20% (score 5)
Sustainability 13 12364 i028
6.4. Promotion and growth of stable work at a local level
Criterion: increase in permanent jobs (on a three-year basis), related to locally trained people, percent
-
No growth (score 1)
-
Less than 1% (score 2)
-
1.1–2% (score 3)
-
2.1–5% (score 4)
-
Higher than 5% (score 5)
Sustainability 13 12364 i029
6.5. Mission achievement in collaboration with other companies and local stakeholders
Criterion: local outsourcing, supporting local supply chains and non-profit organizations, percent
-
Less than 10% (score 1)
-
11–20% (score 2)
-
21–40% (score 3)
-
41–50% (score 4)
-
Higher than 50% (score 5)
Sustainability 13 12364 i030
Source: own preparation.

Appendix C. The Mazziotta-Pareto Approach to Calculation of the Final Index Score

The score for each domain is computed as
A i = M A i S D i C V i
where:
M i = j = 1 5 i j 6 ;   M A i = j = 1 5 i j w j j = 1 5 w j ;   S D i = j = 1 5 ( i j M i ) 2 w j j = 1 5 w j ;   C V i = S D i M A i
and
(i)
A i is the i-th domain score
(ii)
i j is the j-th indicator score
(iii)
w j is the score weight
(iv)
M i is the unweighted arithmetic average of indicators’ scores in the i-th domain
(v)
M A i is the weighted average of indicators’ scores in the i-th domain
(vi)
S D i is the weighted standard deviation of indicators’ scores in the i-th domain
(vii)
C V i is the weighted coefficient of variation in the i-th domain
The final total score is computed as:
T = M T S D T C V T
where:
M T = i = 1 6 A i 6 ; S D T = i = 1 6 ( A i M T ) 2 6 ; C V T = S D T M T
and:
(i)
T is the aggregate (NeXt Index) score
(ii)
A i is the i-th domain score
(iii)
M T is the unweighted arithmetic average of domain scores
(iv)
S D T is the standard deviation of domain scores
(v)
C V T is the coefficient of variation of domain scores.

References

  1. Settembre-Blundo, D.; González-Sánchez, R.; Medina-Salgado, S.; García-Muiña, F.E. Flexibility and Resilience in Corporate Decision Making: A New Sustainability-Based Risk Management System in Uncertain Times. Glob. J. Flex. Syst. Manag. 2021, 1, 1–26. [Google Scholar] [CrossRef]
  2. Dwivedi, A.; Agrawal, D.; Jha, A.; Gastaldi, M.; Paul, S.K.; D’Adamo, I. Addressing the Challenges to Sustainable Initiatives in Value Chain Flexibility: Implications for Sustainable Development Goals. Glob. J. Flex. Syst. Manag. 2021, 1, 1–19. [Google Scholar] [CrossRef]
  3. 2019 Green Bond Market Summary. Available online: https://www.climatebonds.net/files/reports/2019_annual_highlights-final.pdf (accessed on 6 September 2020).
  4. Global Public Procurement Database: Share, Compare, Improve! Available online: https://www.worldbank.org/en/news/feature/2020/03/23/global-public-procurement-database-share-compare-improve (accessed on 10 September 2020).
  5. Easterlin, R.A. Does Empirical Growth Improve the Human Lot? Some Empirical Evidence. In Nations and Households in Economic Growth: Essay in Honor of Moses Abramovitz; David, P.A., Reder, M.W., Eds.; Academic Press: New York, NY, USA, 1974; pp. 89–125. [Google Scholar]
  6. Stiglitz, J.E.; Sen, A.; Fitoussi, J.P. Report by the Commission on the Measurement of Economic Performance and Social Progress. 2012. Available online: https://ec.europa.eu/eurostat/documents/8131721/8131772/Stiglitz-Sen-Fitoussi-Commission-report.pdf (accessed on 6 September 2020).
  7. Zengin, Y.; Naktiyok, S.; Kaygın, E.; Kavak, O.; Topçuoğlu, E. An Investigation upon Industry 4.0 and Society 5.0 within the Context of Sustainable Development Goals. Sustainability 2021, 13, 2682. [Google Scholar] [CrossRef]
  8. Jianu, E.; Pîrvu, R.; Axinte, G.; Toma, O.; Cojocaru, A.V.; Murtaza, F. EU Labor Market Inequalities and Sustainable Development Goals. Sustainability 2021, 13, 2675. [Google Scholar] [CrossRef]
  9. Easterlin, R.A. Income and happiness: Towards a unified theory. Econ. J. 2001, 111, 465–484. [Google Scholar] [CrossRef]
  10. Oswald, A.J. Happiness and economic performance. Econ. J. 1997, 107, 1815–1831. [Google Scholar] [CrossRef]
  11. Clark, A.E.; Frijters, P.; Shields, M.A. Relative Income, Happiness, and Utility: An Explanation for the Easterlin Paradox and Other Puzzles. J. Econ. Lit. 2008, 46, 95–144. [Google Scholar] [CrossRef] [Green Version]
  12. Diener, E. Subjective Well-Being: The Science of Happiness and a Proposal for a National Index. Am. Psychol. 2000, 55, 34–43. [Google Scholar] [CrossRef]
  13. Diener, E.; Kahneman, D.; Helliwell, J. International Differences in Well-Being; Oxford University Press: Oxford, UK, 2010. [Google Scholar]
  14. Dolan, P.; White, M.P. How can measures of subjective well-being be used to inform public policy? Perspect. Psychol. Sci. 2007, 2, 71–85. [Google Scholar] [CrossRef]
  15. Di Tella, R.; MacCulloch, R. Some uses of happiness data in economics. J. Econ. Perspect. 2006, 20, 25–46. [Google Scholar] [CrossRef] [Green Version]
  16. Blanchflower, D.G.; Oswald, A.J. Well-being over time in Britain and the USA. J. Public Econ. 2004, 88, 1359–1386. [Google Scholar] [CrossRef] [Green Version]
  17. Di Tella, R.; MacCulloch, R.J.; Oswald, A.J. Preferences over inflation and unemployment: Evidence from surveys of happiness. Am. Econ. Rev. 2001, 91, 335–341. [Google Scholar] [CrossRef]
  18. Frey, B.S.; Stutzer, A. Happiness, economy and institutions. Econ. J. 2000, 110, 918–938. [Google Scholar] [CrossRef]
  19. Frey, B.S.; Stutzer, A. Beyond outcomes: Measuring procedural utility. Oxf. Econ. Pap. 2005, 57, 90–111. [Google Scholar] [CrossRef] [Green Version]
  20. Graham, C. Happiness around the World: The Paradox of Happy Peasants and Miserable Millionaires; Oxford University Press: Oxford, UK, 2012. [Google Scholar]
  21. Kahneman, D.; Diener, E.; Schwarz, N. Well-Being: The Foundations of Hedonic Psychology; Russell Sage Foundation: New York, NY, USA, 2003. [Google Scholar]
  22. Kahneman, D.; Krueger, A.B.; Schkade, D.; Schwarz, N.; Stone, A.A. Would you be happier if you were richer? A focusing illusion. Science 2006, 312, 1908–1910. [Google Scholar] [CrossRef] [Green Version]
  23. United Nations Development Programme. Human Development Report 1996; Oxford University Press for the United Nations Development Programme UNDP: New York, NY, USA, 1996. [Google Scholar]
  24. United Nations Development Programme. Human Development Report 2010; Oxford University Press for the United Nations Development Programme UNDP: New York, NY, USA, 2010. [Google Scholar]
  25. Stiglitz, J.; Sen, A.; Fitoussi, J.P. The Measurement of Economic Performance and Social Progress Revisited: Reflections and Overview; Commission on the Measurement of Economic Performance and Social Progress: Paris, France, 2009. [Google Scholar]
  26. Veenhoven, R. Well-being in nations and well-being of nations. Soc. Indic. Res. 2009, 91, 5–21. [Google Scholar] [CrossRef] [Green Version]
  27. Becchetti, L.; Corrado, L.; Fiaschetti, M. The regional heterogeneity of wellbeing ‘expenditure’ preferences: Evidence from a simulated allocation choice on the BES indicators. J. Econ. Geogr. 2017, 17, 857–891. [Google Scholar] [CrossRef]
  28. Barber, B.R. Strong Democracy: Participatory Politics for a New Age; University of California Press: Berkeley, CA, USA, 1984. [Google Scholar]
  29. Webler, K.; Kastenholz, H.; Renn, O. Public Participation in Impact Assessment: A Social Learning Perspective. Environ. Impact Assess. Rev. 1995, 15, 443–463. [Google Scholar] [CrossRef]
  30. Mayoux, L.; Chambers, R. Reversing the paradigm: Quantification, participatory methods and pro-poor impact assessment. J. Int. Dev. 2005, 17, 271–298. [Google Scholar] [CrossRef]
  31. Miller, R.L.; Campbell, R. Taking Stock of Empowerment Evaluation: An Empirical Review. Am. J. Eval. 2006, 27, 296–319. [Google Scholar] [CrossRef]
  32. Fraser, E.D.G.; Dougill, A.J.; Mabee, W.E.; Reed, M.; McAlpine, P. Bottom up and Top down: Analysis of Participatory Processes for Sustainability Indicator Identification as a Pathway to Community Empowerment and Sustainable Environmental Management. J. Environ. Manag. 2006, 78, 114–127. [Google Scholar] [CrossRef]
  33. Esteves, A.M.; Franks, D.; Vanclay, F. Social Impact Assessment: The State of the Art. Impact Assess. Proj. Apprais. 2012, 30, 34–42. [Google Scholar] [CrossRef]
  34. Worthen, M.; Veale, A.; McKay, S.; Wessells, M. The Transformative and Emancipatory Potential of Participatory Evaluation: Reflections from a Participatory Action Research Study with War-Affected Young Mothers. Oxf. Dev. Stud. 2019, 47, 154–170. [Google Scholar] [CrossRef]
  35. Guba, E.G.; Lincoln, Y.S. Fourth Generation Evaluation; Sage: Newcastle-Upon-Tyne, UK, 1989. [Google Scholar]
  36. O’Sullivan, R.G. Collaborative Evaluation within a Framework of Stakeholder-Oriented Evaluation Approaches. Eval. Program Plann. 2012, 35, 518–522. [Google Scholar] [CrossRef]
  37. Bell, S.; Morse, S. Learning from experience in sustainability. In Proceedings of the International Sustainable Development Research Conference 2003, Nothingham, UK, 24–25 March 2003. [Google Scholar]
  38. Björkman, M.; Svensson, J. When is community-based monitoring effective? evidence from a randomized experiment in primary health in Uganda. J. Eur. Econ. Assoc. 2010, 8, 571–581. [Google Scholar] [CrossRef]
  39. Bobbio, L.; Pomatto, G. Il coinvolgimento dei cittadini nelle scelte pubbliche. Nuove Forme Di Democrazia 2007, 58, 1000–1024. [Google Scholar]
  40. Mazziotta, M.; Pareto, A. Measuring Well-Being Over Time: The Adjusted Mazziotta–Pareto Index Versus Other Non-compensatory Indices. Soc. Indic. Res. 2018, 136, 967–976. [Google Scholar] [CrossRef]
  41. Istat. Rapporto SDGs 2019. Informazioni Statistiche per l’Agenda 2030 in Italia. 2019. Available online: https://www.istat.it/it/files//2019/04/SDGs_2019.pdf (accessed on 6 October 2020).
  42. Istat. BES 2019. Il Benessere Equo e Sostenibile in Italia. Available online: https://www.istat.it/it/files//2019/12/Bes_2019.pdf (accessed on 6 October 2020).
  43. Istat. Appendice Statistica al Rapporto. BES 2019, Il Benessere Equo e Sostenibile in Italia. Available online: https://www.istat.it/it/archivio/236714 (accessed on 6 October 2020).
  44. A Sense of Purpose. Available online: https://corpgov.law.harvard.edu/2018/01/17/a-sense-of-purpose/ (accessed on 3 January 2021).
  45. Laufer, W.S. Social accountability and corporate greenwashing. J. Bus. Ethics 2003, 43, 253–261. [Google Scholar] [CrossRef]
  46. Lyon, T.P.; Maxwell, J.W. Greenwash: Corporate environmental disclosure under threat of audit. J. Econ. Manag. Strategy 2011, 20, 3–41. [Google Scholar] [CrossRef]
  47. Nyilasy, G.; Gangadharbatla, H.; Paladino, A. Perceived greenwashing: The interactive effects of green advertising and corporate environmental performance on consumer reactions. J. Bus. Ethics 2014, 125, 693–707. [Google Scholar] [CrossRef]
Figure 1. Construction steps of the NeXt Index. Source: CESVA NeXt.
Sustainability 13 12364 g001
Figure 2. Showing QAP2.0-NeXt results: an example. Source: CESVA NeXt.
Sustainability 13 12364 g002
Publisher’s Note: MDPI stays neutral with regard to jurisdictional claims in published maps and institutional affiliations.

