Abstract
Urban sustainability has been revealed as one of the key elements in achieving global sustainability. There is a wide range of indicators in this field; however, sustainability indicators have not been exempt from criticism, in both their formal aspects and practical usefulness. If measuring sustainability is “measuring the immeasurable”, then the objective of this article is to propose a composite indicator that evaluates only the deficits of sustainability or, which is the same thing, the unsustainability of cities. This focus has the advantage of showing up the particular deficiencies and thus the priorities that each city must attend to. For this purpose, only unsustainability, defined as the distance to a sustainability target, was considered. Aggregation was carried out through generalized means, which lead to a proper balance between compensatory and non-compensatory aggregation. The results emerging from the application of our methodology to a sample of fifty different cities suggest that all cities should attend to some aspect concerning sustainability, and that no city is sustainable, but only less unsustainable, showing both significant differences between cities in terms of the degree of unsustainability and a common underlying structure of unsustainability in which the environmental dimension contributes the most.
1. Introduction
Concern for sustainability has been growing in social sciences [1] and particularly in urban economics. Since the Bruntland report [2], the concept of sustainable development as one that “meets the needs of the present without compromising the ability of future generations to meet their own needs” has been generally accepted, and there is widespread acceptance that sustainability encompasses three major dimensions: economic, social and environmental [3,4].
Sustainability is fundamentally decided in very specific territorial spaces: the cities. Cities have a remarkable impact on global sustainability; thus, since 2009, most of the world’s population has been concentrated in cities. It is estimated that by 2030—the reference year of the Sustainable Development Goals—in developing countries, population growth will double, and the constructed area will do so by 200% [5]. More than 80% of the world’s economic activity takes place in cities—60% in the 600 most productive cities [6]. Cities are also responsible for 85% of the GDP of high-income countries and up to 80% of the global energy consumption—75% of the consumption of natural resources and 75% of the global carbon emissions [7].
We could place the origin of urban sustainability in the article “The importance of ecological studies as a basis for land use planning” [8], which highlights the importance of the ecological vision in urban planning. The first global and institutional document addressing urban sustainability was the “Action Plan for the Human Environment” presented at the United Nations Conference on the Human Environment in Stockholm in 1972. This document with an environmental perspective was the origin of Habitat I (1976), which in turn gave rise to Agenda 21, the Rio Summit of 1992 and the later Habitat II (1996) and Habitat III (2016).
The concept of sustainable urbanization integrating economic, social and environmental aspects was proposed at the beginning of this century [9]. Hence, cities are recognized as the key element on the road to global sustainability by the European Commission and the United Nations [10,11], which states that urban sustainability is defined as the challenge to solve the problems experienced within cities and by cities, assuming that they are a fundamental part of the path to global sustainability.
In 2015, the United Nations approved the Sustainable Development Goals (SDG), establishing a global framework for the world that it hopes to achieve by 2030. Thus, in its 2016 review of urban agglomerations, the United Nations points out that these objectives of global sustainability must be adapted in urban terms because “waiting for the results of spontaneous processes is a luxury, which the world and its population can ill afford” [11]. For this purpose, Guiding Principles for a New Urban Agenda were established as follows:
- Ensuring that the new organization model contains mechanisms and procedures that protect and promote human rights and the rule of law;
- Ensuring equitable urban development and inclusive growth;
- Empowering civil society, expanding democratic participation and reinforcing collaboration;
- Promoting environmental sustainability;
- Promoting innovations that facilitate learning and the sharing of knowledge.
The introduction of indicators to assess the performance of cities in their economic, social and environmental aspects is completely necessary [12]. This has already been highlighted regarding the general concept of sustainability [13]. Thus, in the urban field, many indicators have been developed [14,15] to deal with the problem of constructing composite indicators and compensation [16], as well as the summing of its dimensions [17].
Despite the enormous production [14,18] and the general acceptance of the advantages of composite indicators [19,20], sustainability indicators have been criticized for such formal aspects as their lack of transparency or their construction deficiencies, as well as their scarce practical application [18,21].
Thus, the Sustainable Development Goals index (SDGs) developed for monitoring the 2030 Agenda has been considered unsuitable for such an objective [22]. Likewise, SDGs have been described as “incompatible” with each other [23].
Furthermore, the existing urban sustainability indicators may not provide an overall picture of urban sustainability in both developed and developing countries, which is mainly due to the scarcity of data at the local level [24]. Thus, they limit their focus to a specific issue [25,26] or to a very small sample of cities [12].
If measuring sustainability is considered to be “measuring the immeasurable” [16] due to its “aspirational nature” [27] and because the ranking of urban sustainability can encourage policymakers to focus on the aspects that can be successful in their cities [28], an alternative way of studying urban sustainability problems may be necessary.
Given the problems identified in the study of urban sustainability, which have been referred to in the previous paragraphs, this article proposes an innovative and alternative focus in this field, with the aim of developing a synthetic or composite indicator, the Urban Non-Sustainability Index (UNSI).
This composite indicator or index (UNSI) will allow the deficits of urban sustainability to be identified and quantified based upon the consideration and measurement of solely those aspects in which each city is not sustainable, defining sustainability deficits, unsustainability or “non-sustainability” in each individual indicator as the distance between its value and a “sustainability threshold” value.
This focus, adopted from the multidimensional measurement of poverty [29], provides very interesting novelties. Firstly, it encourages cities not to fall into the trap of complacency upon finding certain aspects concerning sustainability in which they need to improve—even though they may be well-placed in the urban sustainability ranking. Secondly, this focus uses an aggregation technique that avoids compensation between indicators with good results and those that present unsustainability in such a way that the relevant information is not “diluted” and lost among the good results. Thirdly, it identifies not only where a city’s problems lie, but also how important they are, given that it scores the importance of each sustainability problem between 0 and 1; the closer the score is to 1, the worse the problem. Fourthly, the composite indicator also has the possibility of being deconstructed in order to know which dimension—economic, social or environmental—most contributes to the unsustainability.
On the basis of such advantages, the indicator can be a useful tool [20] for prioritizing policies in order to achieve a city oriented towards a desirable state of sustainability. Every strategic plan needs an adequate diagnosis [30], and this indicator can play the key role in the evaluation of cities [31].
In order to consider and measure only those aspects in which cities are not sustainable, we dedicate the second section of the Materials and Methods to the selection of 40 indicators that represent the greatest aspects of the economic, social and environmental dimensions of sustainability, and which are also part of other indicators (see Appendix A).
Following that, we define unsustainability for each of the said indicators as the values that are not above a certain threshold and then proceed to standardizing these values between 0 and 1 according to the existing distance with respect to the said threshold for each value of each indicator [29,32,33].
Therefore, the further each value is from the sustainability threshold established for that indicator, the closer its normalized value will be to 1. The closer each value is to the sustainability threshold established for that indicator, the closer its normalized value will be to 0. The values that are above the said threshold and thus considered to be “sustainable” are then normalized with the value of 0.
The aggregation is carried out by generalized means, which is an aggregation technique that has important advantages in terms of the balance between compensatory and non-compensatory aggregation or, which is really the same thing, between weak and strong sustainability [34]. Finally, in Section 3, we present the results of the indicator, taking a sample of fifty cities chosen using criteria that allow us to obtain an ample typology of cities for which there are also existing data.
Using this methodology, we reach our main conclusion which is that even those cities that are considered to be more sustainable [35] have problems they should resolve, and which should be prioritized in their public agenda. Similarly, the unsustainability measurement between 0 and 1 allows us to conclude that there are very different degrees of unsustainability, but that they all depend to a large degree on the environmental dimension.
2. Materials and Methods
As pointed out in the previous section, urban sustainability is a multidimensional phenomenon that cannot be captured by a single indicator, so a composite indicator focused on sustainability deficits may be needed. However, to avoid controversy, before constructing and using composite indicators, methodological issues must be considered [36,37]. For this reason, it is important to clarify and justify all the decisions adopted while being aware that each one is open to public debate.
Thus, we propose to construct a composite indicator that relies on the sustainability deficits instead of the achievements. In this way, some results from the measurement of multidimensional poverty can be transferred to this framework [29,33]. Furthermore, we consider the influential work of Nardo et al. [19], guidance about the steps that should be followed, including the selection of indicators and their sustainability threshold values, normalization and aggregation.
Since it has been considered that one of the weaknesses of the concept of sustainability is that it has a loosely defined conceptual base [38], it would seem convenient to offer a clear framework of our concept of sustainability and its deficits. We define urban sustainability as the quantifiable development process through which the transformation of a city takes place towards economic, social and environmental targets. The values of the indicators that do not achieve these objectives are considered “non-sustainable”. What do we understand by the economic, social and environmental dimensions?
Economic dimension: This refers to those facts that influence the sustainability of the economic development in the medium to long term, including four subdimensions. The first is the level of income and its distribution; the second is the labor conditions; the third can be referred to as smart development and the fourth is that which is related to the financial sustainability of the city.
Social dimension: This features all the aspects that allow the conditions of equal opportunities, access to basic services and quality of life of the city to be evaluated.
According to the World Bank [39], the social sphere of development focuses on “putting people first” in the development process.
Poverty is more than low income; it is also vulnerability, exclusion, unreliable institutions and exposure to violence. We therefore assess access to and permanence in the education system, as well as quality health care, as they are the most basic mechanisms of personal development and social inclusion and the main elements working against marginalization. Likewise, the degree of social cohesion is measured on the basis of indicators that show to what extent there is availability in the access to quality urban services, as well as a sufficient degree of institutional reliability to facilitate an environment of security and stability for a city’s inhabitants.
Environmental dimension: This considers those aspects that evaluate efficiency in the use of resources in relation to three major subdimensions, namely energy, water and environmental pollution, which occurs not only in the city, but in the nonurban environment closest to it.
In order to have access to “intra-dimensional” information, we define as “sub-dimensions” each of the elements that make up the dimensions of sustainability and which will also serve as the basis for selecting individual indicators.
2.1. The Selection of Urban Indicators and Sustainability Thresholds
There were no lists of standardized indicators with a database that could be applied interchangeably to a diverse set of cities until 2014. Hiremath et al. [40] and Bell and Morse [21] carried out reviews of some of the indicators recently used and what should be next in the literature.
To avoid arbitrariness in the process of selecting indicators, they must also meet the following requirements [33]:
- Evaluate impacts that the city has beyond its own territory (such as waste generation or air pollution);
- Belong to one of the three dimensions in a way that allows us to encompass the multidimensional vision of sustainability;
- Be applicable to cities with different levels of development or income;
- Adequately describe urban environments.
The World Council on City Data (WCCD) implemented a standardized set of urban sustainability indicators in 2014 (ISO 37120:2014) [41], updated in 2018, which meets the requirements described above. We selected a total of forty indicators from more than one hundred proposed in ISO 37120:2014 with the aim of describing in the most precise way each of the subdimensions that make up the concept of sustainability proposed in this article.
Thus, the 40 individual indicators selected (Appendix A features a set of other composite indicators to compare the suitability of proposed individual indicators) for each of the subdimensions and the aspirational sustainability target or sustainability threshold for each of them are presented in Table 1.

Table 1.
Individual indicators, subdimensions, dimensions and sustainability targets.
2.2. Normalization
Before addressing the latter issues, let us introduce some notation. Let Kj denote the set of all subdimensions in dimension j, with j = 1, 2 and 3, and let Ljk denote the set of all indicators in subdimension k of dimension j. For any city i, with i = 1,…,50; dimension j, with j = 1, 2 and 3; subdimension Kj and any indicator Ljk, we write for city i’s outcome in indicator l of subdimension k of dimension j.
Generally, individual indicators have different scales of measurement, so some transformation is needed to make indicators comparable. A great variety of normalization techniques have been proposed; among the most commonly used are statistical standardization and min–max transformation (see Freudenberg [42] and Nardo et al. [43] for a general discussion and Pollesch and Dalle [44] for a review of the normalization used in sustainability indicators).
In our case, we first make directional adjustments when it is necessary, so that higher indicator scores correspond to better performance in terms of sustainability. Then, a normalization method is employed that resembles the one used in poverty analysis and focuses on the shortfall. We fix a sustainability threshold for each individual indicator below which a city is identified as non-sustainable and above which the city is sustainable. We write for the cutoff of individual indicator Ljk of subdimension Kj in dimension j and for the value of individual indicator Ljk of subdimension Kj in dimension j at city i. If city i is said to be non-sustainable in that indicator with a standardized value; if city i is sustainable in that indicator and the standardized value assigned is 0. Sustainability targets are shown in Table 1 and the criteria selected for each one can be seen in Appendix B.
Therefore, if city i is non-sustainable in indicator Ljk, gijkl is a gap between its standardized value and the standardized cutoff computed as follows:
Thus, standardized indicators take values between 0 and 1, where 0 corresponds to the best possible value of the indicator (i.e., sustainable) and 1 to the worst.
In doing this, the censured standardized gap ratios are assumed to be comparable across indicators. It is important to remark that this normalization method allows us to focus only on unsustainability. In fact, a value above the cutoff in one basic indicator, such as increasing the GDP per capita above the cutoff, cannot compensate for unsustainability in another basic indicator, such as greenhouse gas emissions.
Furthermore, unlike one of the more common normalization methods, the z-score normalization variance is not common to all censured standardized gap ratios, with features of the original indicators somehow prevailing. On the other hand, this kind of normalization could be interpreted more clearly as a distance from an assigned target or sustainability threshold [44] and can be of great help if what matters is solving the problems that hinder the sustainable development of cities and is consistent with the sustainability concept raised in this article.
2.3. Aggregation and Weighting
One issue that determines the aggregation rule is compensation between dimensions, i.e., the possibility of compensating for any deficit in one dimension with a suitable surplus in another [19,45]. At this point, it is important to remark, as we did above, that only basic indicators with a deficit are considered for aggregation, and it is not permissible to compensate with good performance in one indicator above the target poor performance in another indicator below the target. Therefore, regardless of the aggregation rule, compensation is only possible as long as basic indicators are below the target.
Different aggregation rules could be found to build a composite indicator (see Nardo et al. [43] and Gan et al. [46] for a review of the aggregation rules in sustainability). Commonly applied aggregation options include arithmetic or geometric means. In brief, aggregation comes down to two options [47]: compensatory and non-compensatory. The first implies acceptance of a “trade-off” among its variables, as happens with the arithmetic mean, while the second does not, as happens with the maximum or multicriteria approach developed by Munda and Nardo [48]. However, there are mixed strategies that can use a combination of the two [49]. In the field of sustainability, total non-compensation would involve a “strong sustainability” approach [33,34,50].
In this article, we use a step-by-step approach with different types of generalized means (the generalized mean is an aggregation function that has been used in different fields related to well-being (see, for example, Annad and Sen [51] and Lasso de la Vega et al. [52])) that range from total compensation, using arithmetic means in the aggregation of individual indicators and subdimensions, to a partially compensatory aggregation used in the final aggregation between dimensions. This unbalance-adjusted function, as Tarabusi and Guarini [45] called it, produces very consistent results, as we shall discuss later. Aggregation using generalized means offers an intermediate solution between both extremes and allows for different degrees of compensation [53].
The aggregation happens in three stages that correspond to the three levels of urban sustainability previously established. In the first stage, indicators are aggregated up to the subdimension level. This is done by averaging across indicators to obtain subdimension indices. Then, in the second stage, the subdimensions are averaged to obtain dimension indices. Finally, to obtain the global index, an average is taken across the three dimension-specific indices. In each stage, a generalized mean is used. Specifically, we proceed in a sequential process as follows. In the first step, for city i, dimension j and subdimension k, the standardized indicators are aggregated in a subdimension index, Iijk, i.e.,
where is the weight associated with indicator with . In other words, Iijk is the average value of the standardized gap among all the instances of a given subdimension in which any city is non-sustainable. Thus, provides information about the depth of non-sustainability in a specific subdimension.
In the second step, dimension index is obtained as the weighted mean of the subdimension indices of a given dimension; in other words, for each city i and dimension j, the dimensional index is assessed as follows:
where is the weight associated with subdimension with . In this case, gives information about the depth of non-sustainability in a specific dimension.
Finally, in the third step, a global index, i.e., the Urban Non-Sustainability Index (UNSI), is obtained by aggregating across the three-dimensional indices with the generalized mean. Thus, the UNSI of city i is obtained as follows:
where is the weight associated with the dimension with with ; is a parameter to obtain different profiles of compensation in the aggregation as we shall explain later. This function yields the arithmetic mean if , the geometric mean if and the maximum of if .
Another decision to take when a composite indicator is built refers to the choice of weights attributed to each criterion in a composite index [47]. This is a controversial issue because it has a great influence on the values and interpretation of the indices. In the literature, there are different approaches to weighting [16,19,43]. In many cases, the weights are chosen to neutralize the problem of double counting, as there may be collinearity in the basic indicators [19,42]. On the other hand, another approach is to choose the weights according to the importance of the different criteria.
In our case, given the hierarchy structure of our framework, equal weights are applied to dimensions, to subdimensions in a particular dimension and to basic indicators in a given subdimension. Thus, ; , with being the number of subdimensions in dimension and , where is the number of indicators in subdimension .
In the end, as we can see, both subdimensions and basic indicators are not weighted equally. This is due to the different number of subdimensions in each dimension and the different number of basic indicators in each subdimension.
Apart from the simplicity of this hierarchy weighting structure, it also emerges from the theoretical framework discussed in Section 2. Furthermore, although the associations between criteria are inevitable, given that all of them aim to capture the same phenomena since the discussion of the theoretical framework, each basic indicator, subdimension and dimension index somehow provide unique information about specific aspects of urban sustainability. In fact, the association of criteria simply means a concentration of the strengths or weaknesses in the cities.
Next, some properties of the composite index that we propose are pointed out (other properties of generalized means were described by Anand and Sen [51], Ruíz [53], Lasso de Vega and Urrutia [54] and Chakravarty [55]). First, the UNSI is bounded between 0 and 1, with 0 indicating a city with no deficits in each individual indicator and 1 indicating a city with no achievements in each individual indicator. As the deficits and the number of deficits increase in a city, the UNSI increases, capturing not only the incidence, but also the intensity of non-sustainability.
Another interesting property is that the UNSI is non-decreasing in the parameter. Therefore, when > 1, given two cities with the same sum of dimensional indices, the greater the difference between the respective dimensional indices, the higher the UNSI level.
Perhaps the most interesting property of the UNSI is that it enables different profiles of compensation between unbalanced dimensions to be controlled. This control over the levels of compensation is carried out using parameter . Thus, for specific and different values of , it is possible to consider different profiles of compensation among the dimensions.
The use of generalized means with an appropriate value leads to a reasonable middle ground to solve the problem of non-compensation between dimensions. This is so because if there are values very close to the sustainability target in one dimension but very far away in another, this aggregation method avoids the problems of a purely non-compensatory approach (which would only take the worst value and omit the fact that the city is not so deficient in other dimensions). In addition, those values resulting from a purely compensatory aggregation (an arithmetic mean would hide the main problem of the city) would also be avoided.
An explanation of the performance of is suitable here. To do this, we take the theorical cities shown in Table 2 as an example. All of them have the same arithmetic mean value. However, the generalized mean with different penalizes the city that has a more extreme value in any dimension index with respect to the others and the ranking between the cities does not vary regardless of the value chosen.

Table 2.
Effect of different on cities with same aggregated value.
Thus, these four cities have different balances in the values of each dimension. The city that offers the greatest imbalance between values is City D. If we choose to aggregate according to the arithmetic mean, we would obtain a value of 0.13, which shows the effect of opting for total compensation in the aggregation (arithmetic mean), omitting the serious environmental problem. However, a totally non-compensatory aggregation choosing maximum would result in 0.40, which reflects the problem of environmental sustainability of City D but hides the fact that it is sustainable in the economic (0) and social (0) dimensions.
Therefore, an intermediate point between total compensation and total non-compensation given by choosing an appropriate value for is highly desirable. Similarly, in the other three cities, with a different balance between their values, it can be observed how the aggregation with generalized means offers a final value of the UNSI that is more in line with the balance shown between the economic, social and environmental values. Thus, the more balanced the three values are, the closer the aggregated value is using the arithmetic mean and the generalized mean. This would suggest that the technique of the generalized mean offers an appropriate equilibrium between the effect of compensatory and non-compensatory aggregation or, in other words, between strong and weak sustainability [34].
2.4. Deconstruction of the Urban Non-Sustainability Index (UNSI)
Following Chakravarty and Majumder [56], a transformation of the UNSI ordinal equivalent is
The new version is the weighted sum of dimensional indices, each raised to the power of and it enables us to analyze the contribution of each dimension in the index. Therefore, the contribution of dimension j to the unsustainability of city i could be assessed as follows:
The deconstruction of by dimensions is a very appealing property since a high contribution dimension should deserve priority attention.
A sample of fifty cities was chosen to check the functioning of the indicator.
The cities were selected using the following criteria:
- Belonging to different geographical areas throughout the globe;
- Having different levels of human development and income (cities belonging to countries with different income levels, according to the World Bank’s classification);
- Population corresponding to the scale described by Shen et al. (2017): small city (fewer than 500,000 inhabitants); medium-sized city (between 500,000 and 1,000,000 inhabitants); large city (between 1,000,000 and 3,000,000 inhabitants); supercity (between 3,000,000 and 10,000,000 inhabitants) and megacity (more than 10,000,000 inhabitants);
- Data availability.
In order to complete the geographical scale, requests for information on the selected indicators were sent to other numerous cities, obtaining results from Moscow (Russia) and Medellin (Colombia).
Table 3 shows the selected cities as well as the countries to which they belong.

Table 3.
Cities selected.
3. Results and Discussion
Table 4 shows the results from the lowest to the highest Urban Non-Sustainability Index (UNSI) using γ = 3, as well as the contribution of each dimension to the final value.

Table 4.
UNSI ranking and dimensions’ contributions.
We shall now discuss the results, dividing the theoretical and the practical aspects that can be deduced from the indicator.
As for the theoretical implications, the results suggest the most adequate value of γ for carrying out the aggregation shown in Table 4.
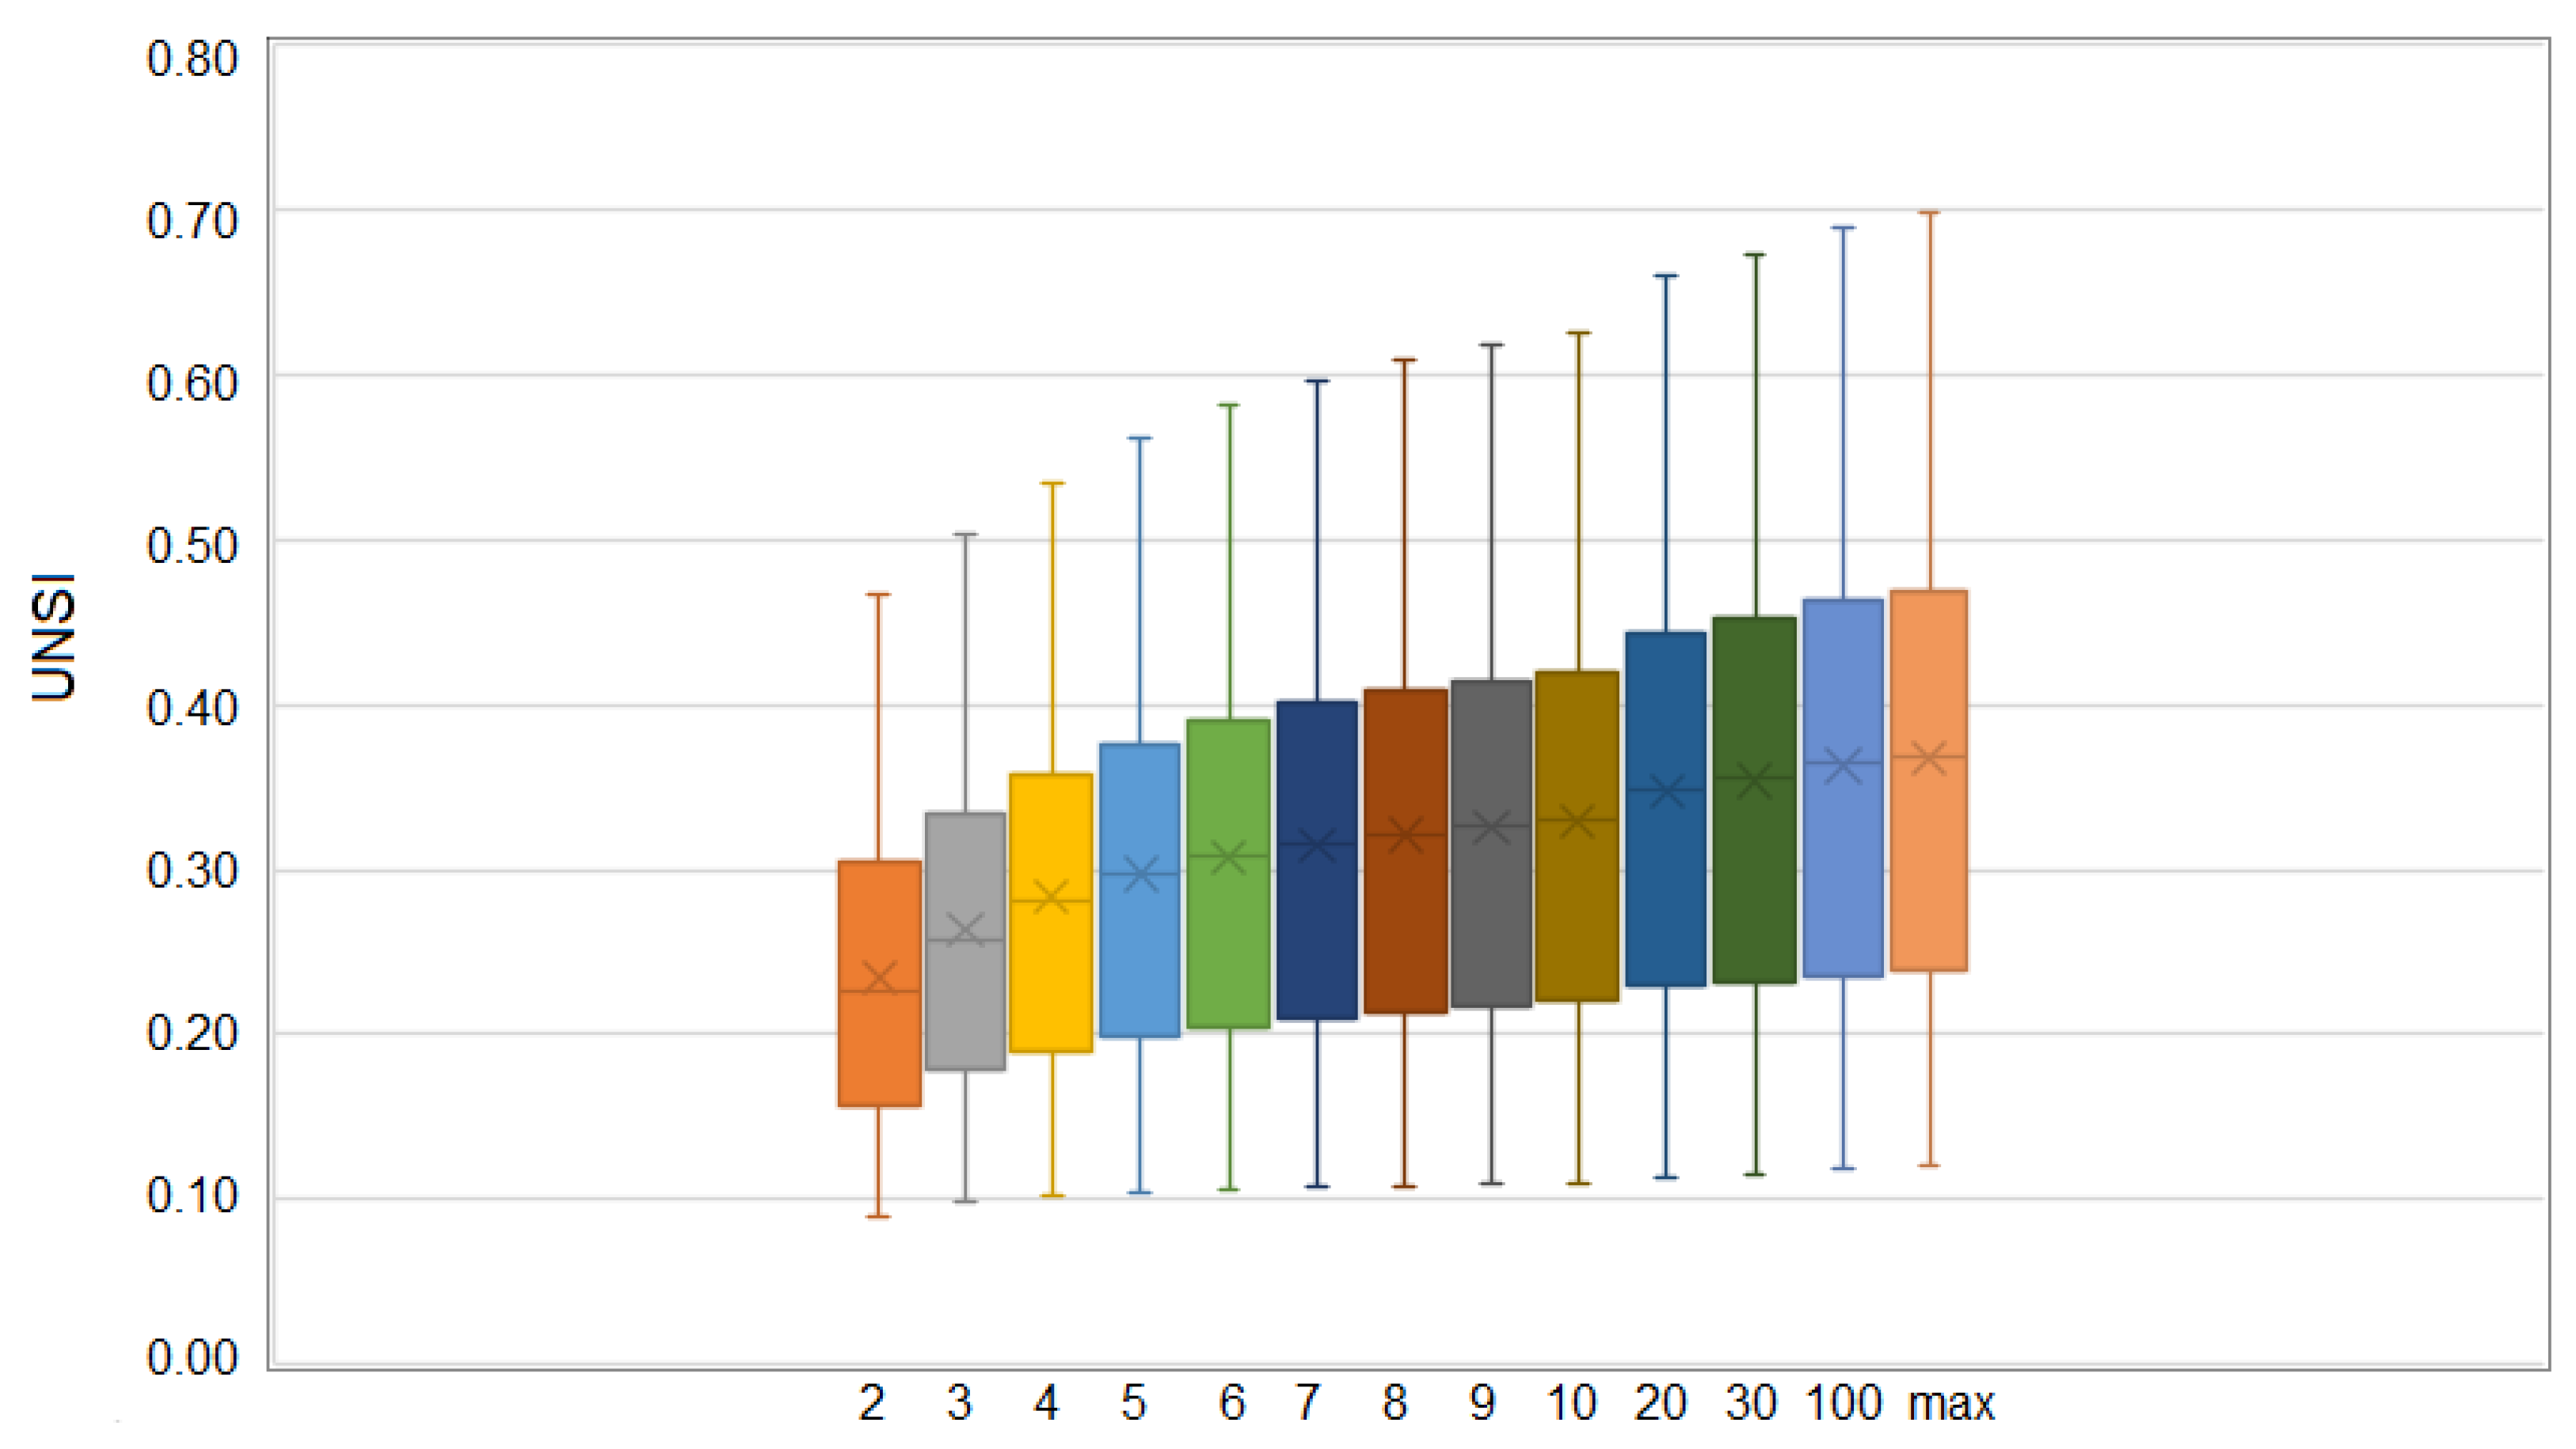
Two tests were carried out to select the most adequate value of . On the one hand, different values of were taken (2, 3, 4, 5, 6, 7, 8, 9, 10, 20, 30, 100, maximum) to check where the greatest aggregation variation occurs. Evidently, as a result of one of the properties of the UNSI, it grows if grows. However, it stabilizes from a certain value of . Figure 1 and Table 5 show that this occurs with = 3.
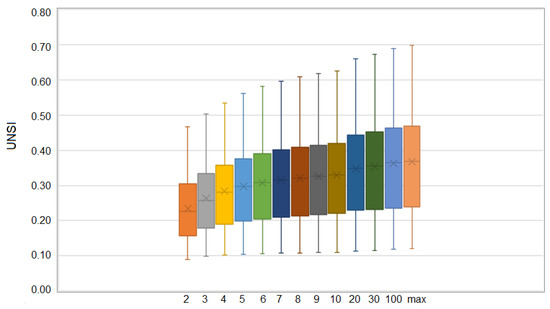
Figure 1.
UNSI boxplot with different

Table 5.
Evolution of some statistics with different .
Table 5 shows the maximum, minimum, mean and median values, as well as the standard deviation, when verifying the UNSI for different values. As can be seen, all values experience their greatest growth when they shift from 2 to 3, stabilizing from this point on.
It is important to point out that this work takes the data gathered in order to prove which value of γ is the most adequate and the selection of γ = 3 is the same as that of Anand and Senn in the Human Poverty Index (1997) and to build the United Nations’ Human Poverty Index (HPI). In this particular case, there is a positive adjustment for imbalances because of the convexity of the function [57].
The second test carried out consists of performing correlation tests to study how different gamma values affect the ranking of cities. The results of the correlation tests are shown in Table 6.

Table 6.
Correlation test with different .
Table 6 shows the high degree of correlation between UNSI using different . This information must be interpreted carefully, because it is not that the value of is irrelevant. It means that having established = 3 because it represents an appropriate balance between compensatory and non-compensatory aggregation, this choice does not alter the final ranking significantly. In other words, any other gamma would give a very similar ranking result but would not offer the necessary balance between compensation and non-compensation.
Thus, the main theoretical implication of the UNSI indicator is that it eliminates the subjectivity in choosing the degree of compensation in the aggregation as a consequence of the use of generalized means. In other words, it is the values offered in the different dimensions that determine the degree of importance or relative weight that each one of them should have in the final value of the indicator.
As for the practical implications of our proposal, as pointed out in Section 1, this technique of measuring sustainability deficits or, in other words, of measuring unsustainability or non-sustainability shows that cities with very good practices in terms of sustainability policies [58] still have aspects that need to be improved. The following aspects are particularly worth mentioning.
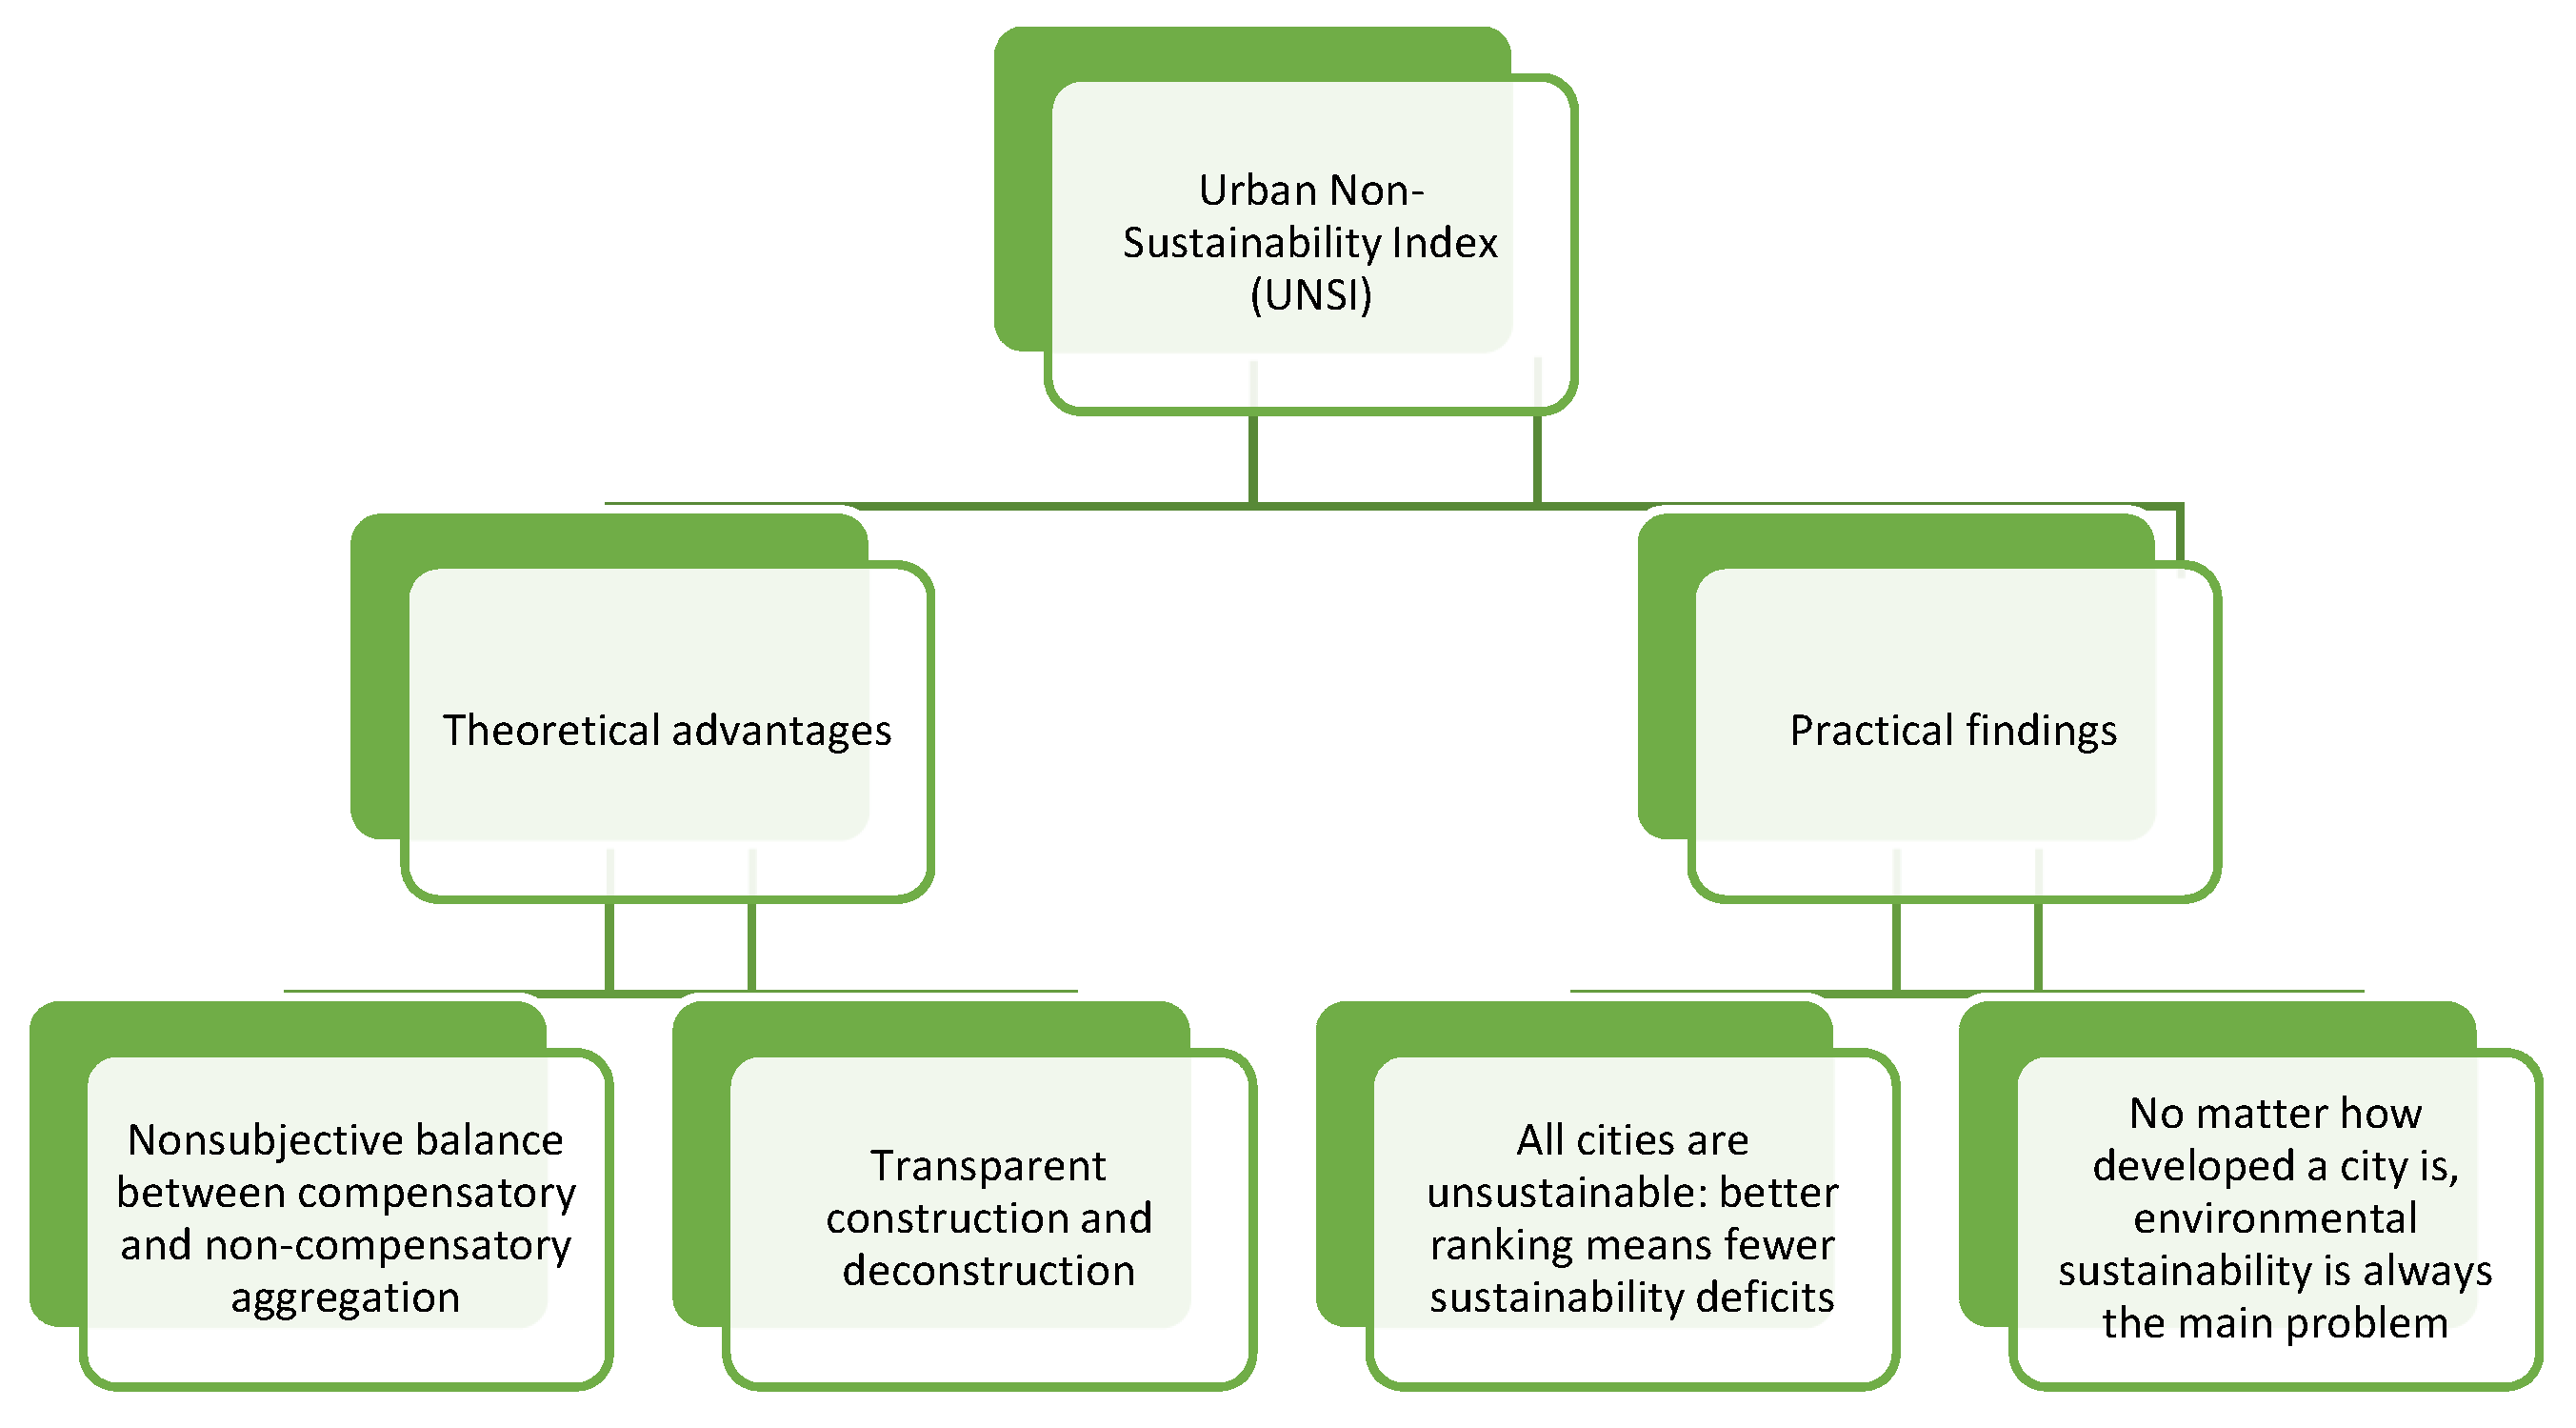
Firstly, it should be noted that all the cities in the sample are unsustainable. The best-ranked city (Oslo) is not the most sustainable but the one with the least sustainability problems. This alternative approach avoids the interpretation of the rankings of “more sustainable cities in the world”, which are usually presented and interpreted as if these cities do not have any problems. Our proposed indicator (UNSI) detects problems to solve even in cities usually shown as examples of sustainability.
Secondly, we can observe that the greatest sustainability problems arise in the environmental dimension in all the cities in the sample. In fact, except for nine cities—Sintra, Cape Town, Johannesburg, Tshwane, Leon, Surat, Pune, Makkah and Minna—the ranking follows the correlative order with respect to environmental unsustainability, suggesting that the proposed aggregation, without being totally non-compensatory, clearly reflects the priority of the problems that each city must face.
One of the advantages that the indicator provides is deconstruction; thus, using a simple mathematical operation (see Equation (6)), we can determine the contribution of each dimension to the total aggregation.
Table 4 also shows that out of a total of 50 cities, more than 90% of the non-sustainability is due to the environmental dimension in 35 of them; in 26 of these, this value is more than 95%. This deconstruction demonstrates the seriousness of environmental non-sustainability in the global problem of lack of sustainability.
The economic and social dimensions are the second most important problem in half of the cities in the sample each. However, slightly higher levels of contribution are observed in the economic dimension than in the social dimension. This phenomenon increases as cities become more unsustainable according to the total aggregation.
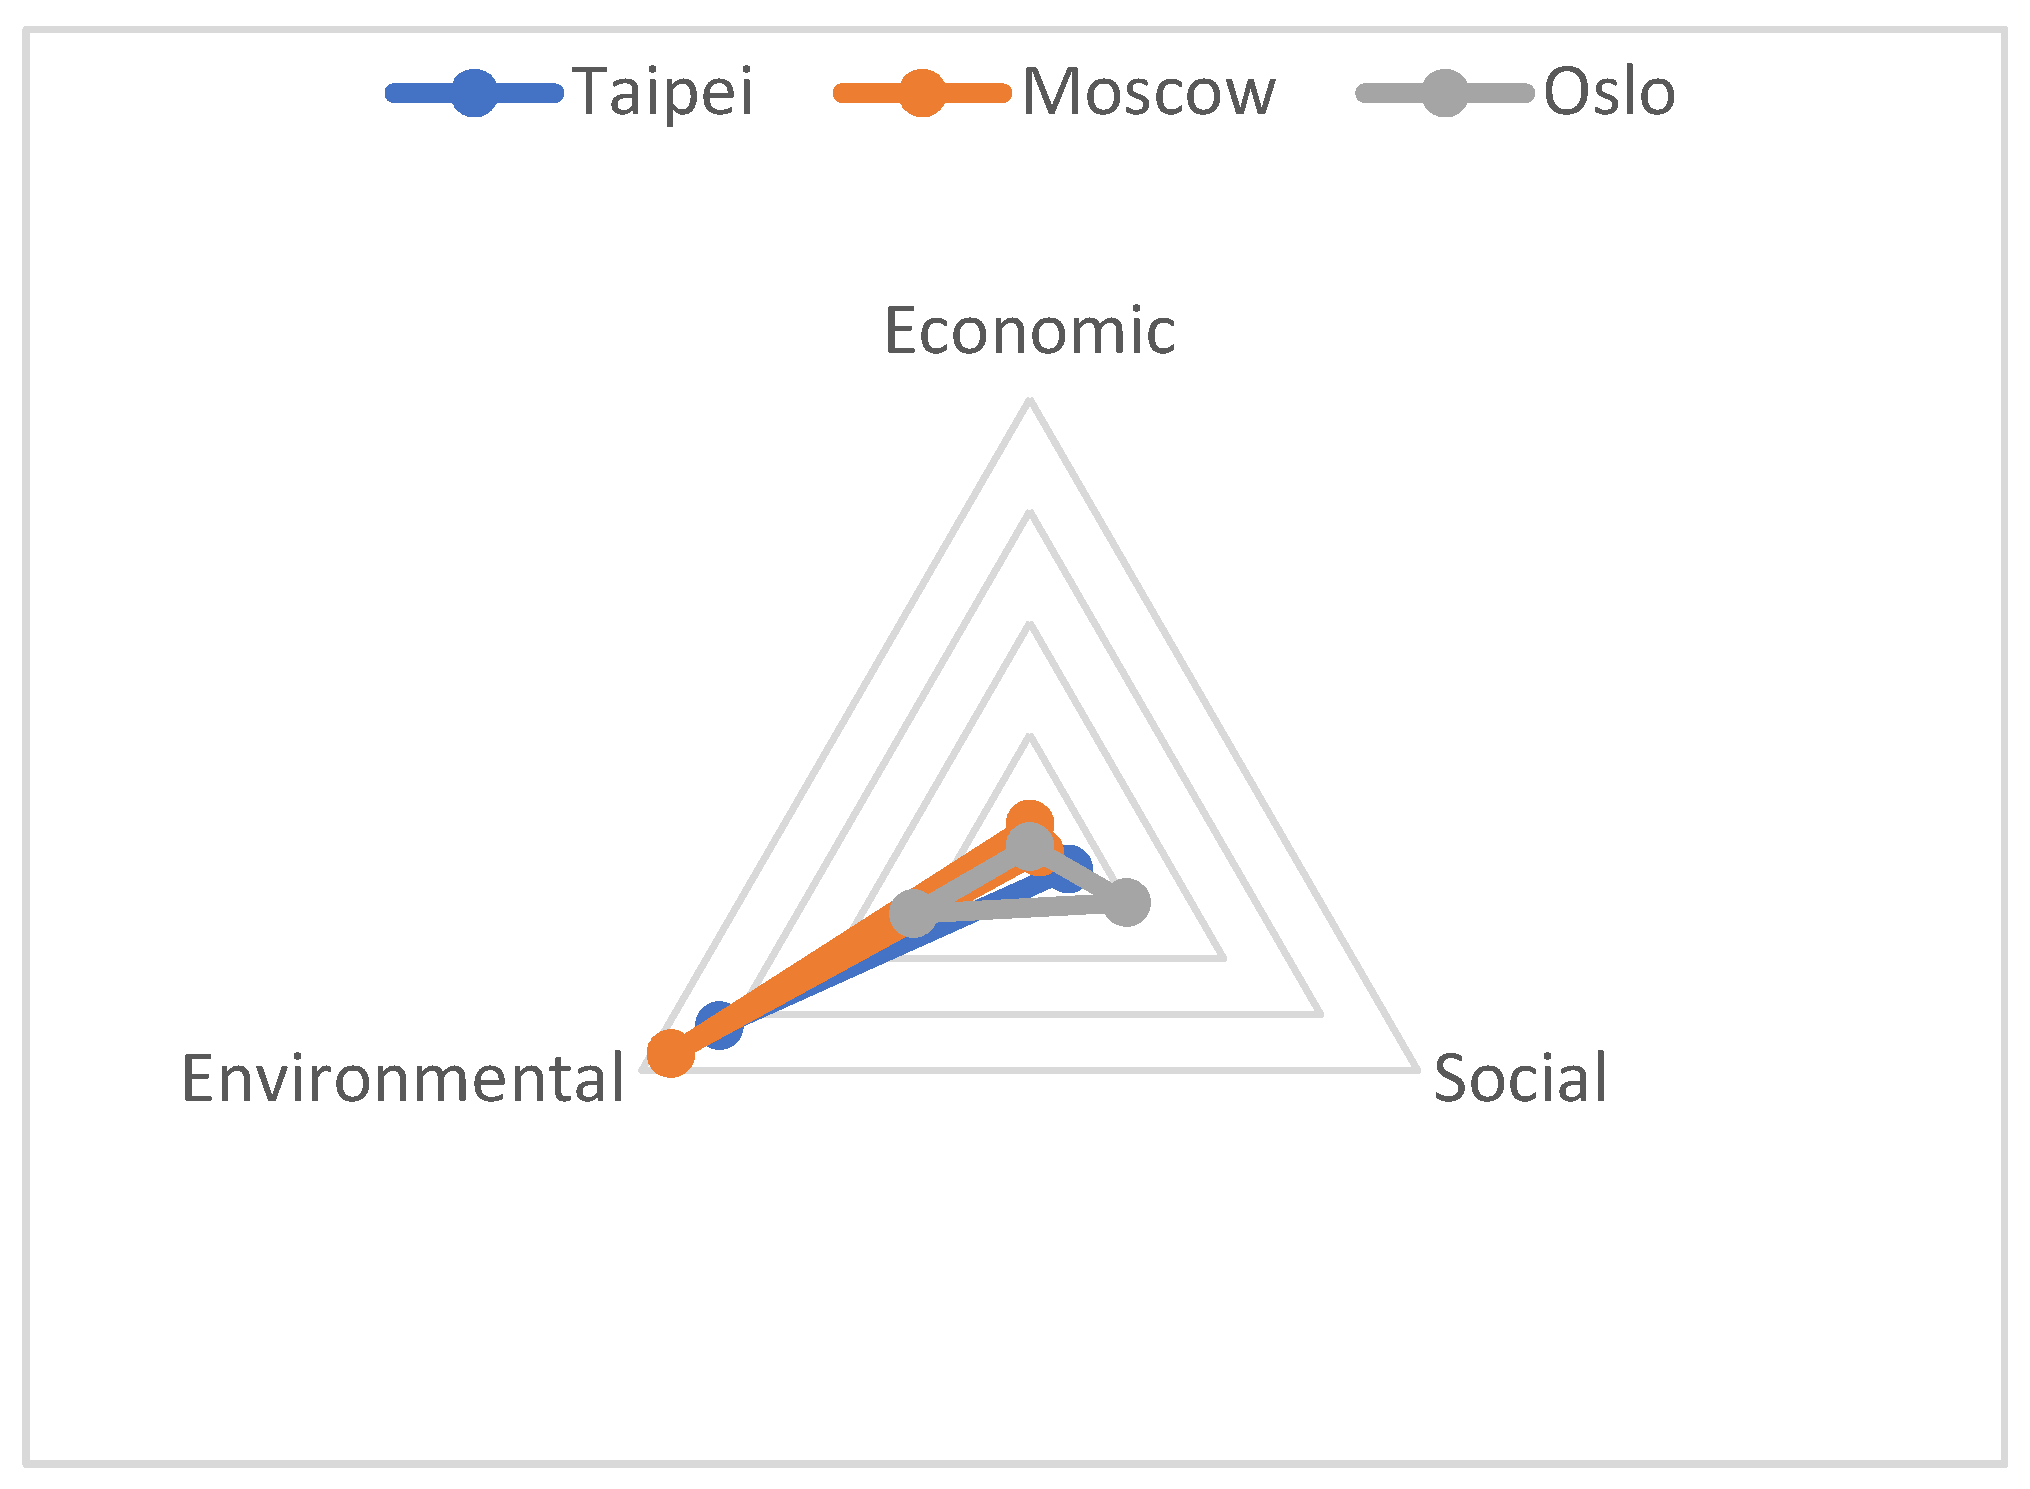
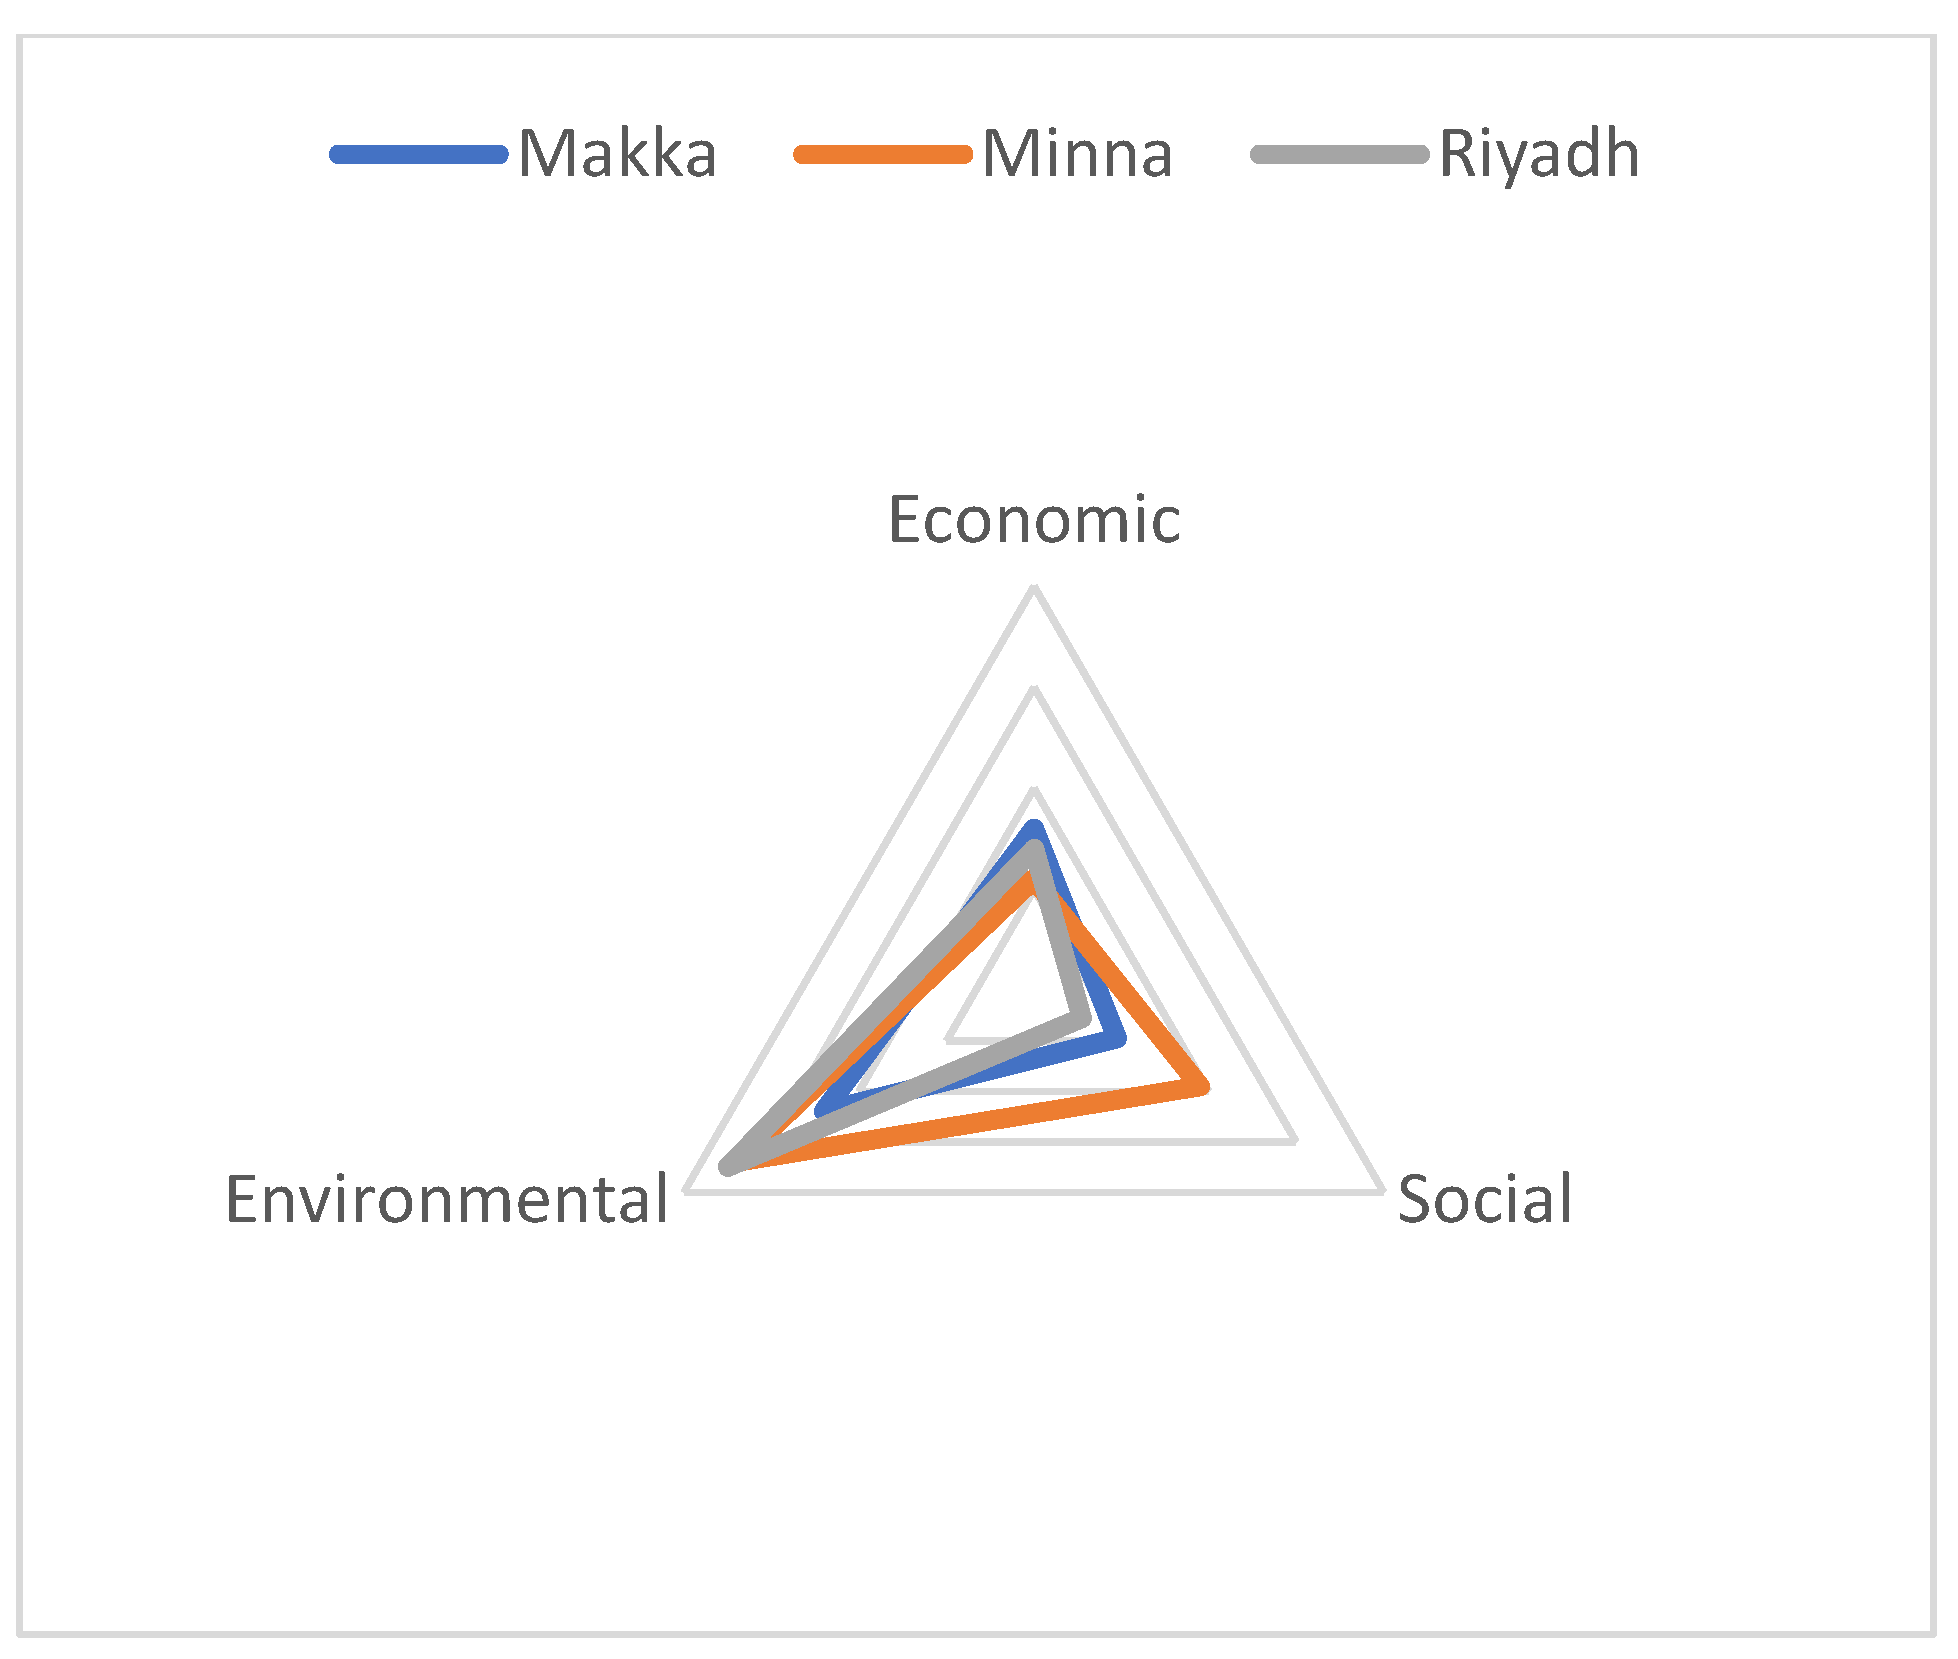
Figure 2 and Figure 3 illustrate how, in spite of remarkable differences in their economic and social dimension profiles, the three cities that achieve the best and worst positions by dimension share the fact that their largest sustainability problems lie in the environmental dimension.
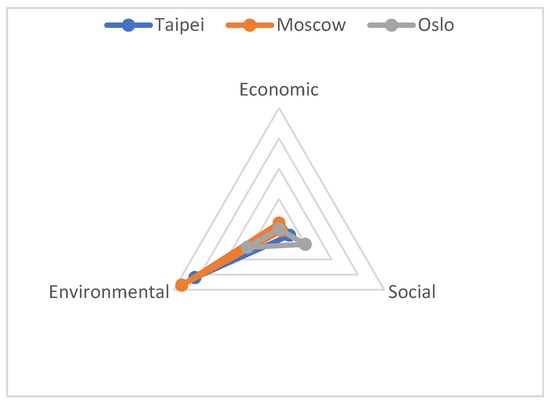
Figure 2.
Unsustainability profile: cities closest to the sustainable target by dimension.
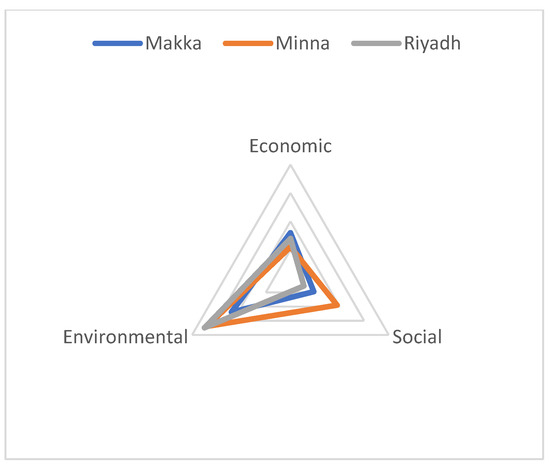
Figure 3.
Unsustainability profile: worst cities by dimension.
Taipei is the city that presents the lowest sustainability deficit in the economic dimension (0.00), Moscow—in the social dimension (0.01), Oslo—in the environmental dimension (0.12). The interpretation of the subdimensions should be done in the same way as in the UNSI itself, i.e., the closer to 0, the lower the sustainability deficit, while the closer to 1, the more unsustainable it is in that particular dimension. As can be seen in Figure 2, those three cities have similar profiles, yet the dimension with the greatest sustainability deficit in all three is the environmental one.
The same thing occurs with those cities that have the worst results in each dimension; thus, Makka, presents the worst result in the economic dimension (0.32), Minna—in the social (0.38), Riyadh—in the environmental (0.7). The unsustainability profiles are a little more varied, but as with the cities that have the best results, all three worst cities have the most serious problems in the environmental dimension.
This type of analysis has the advantage that it can point to where the main problems are, and it can descend to the level of subdimension and even of the individual indicator or indicators that are the cause of the results.
The graphical analysis shown in Figure 2 and Figure 3 allows different kinds of approaches. For instance, we can compare cities with populations of fewer than 500,000 inhabitants with cities with populations of over 5,000,000 in developed and developing countries.
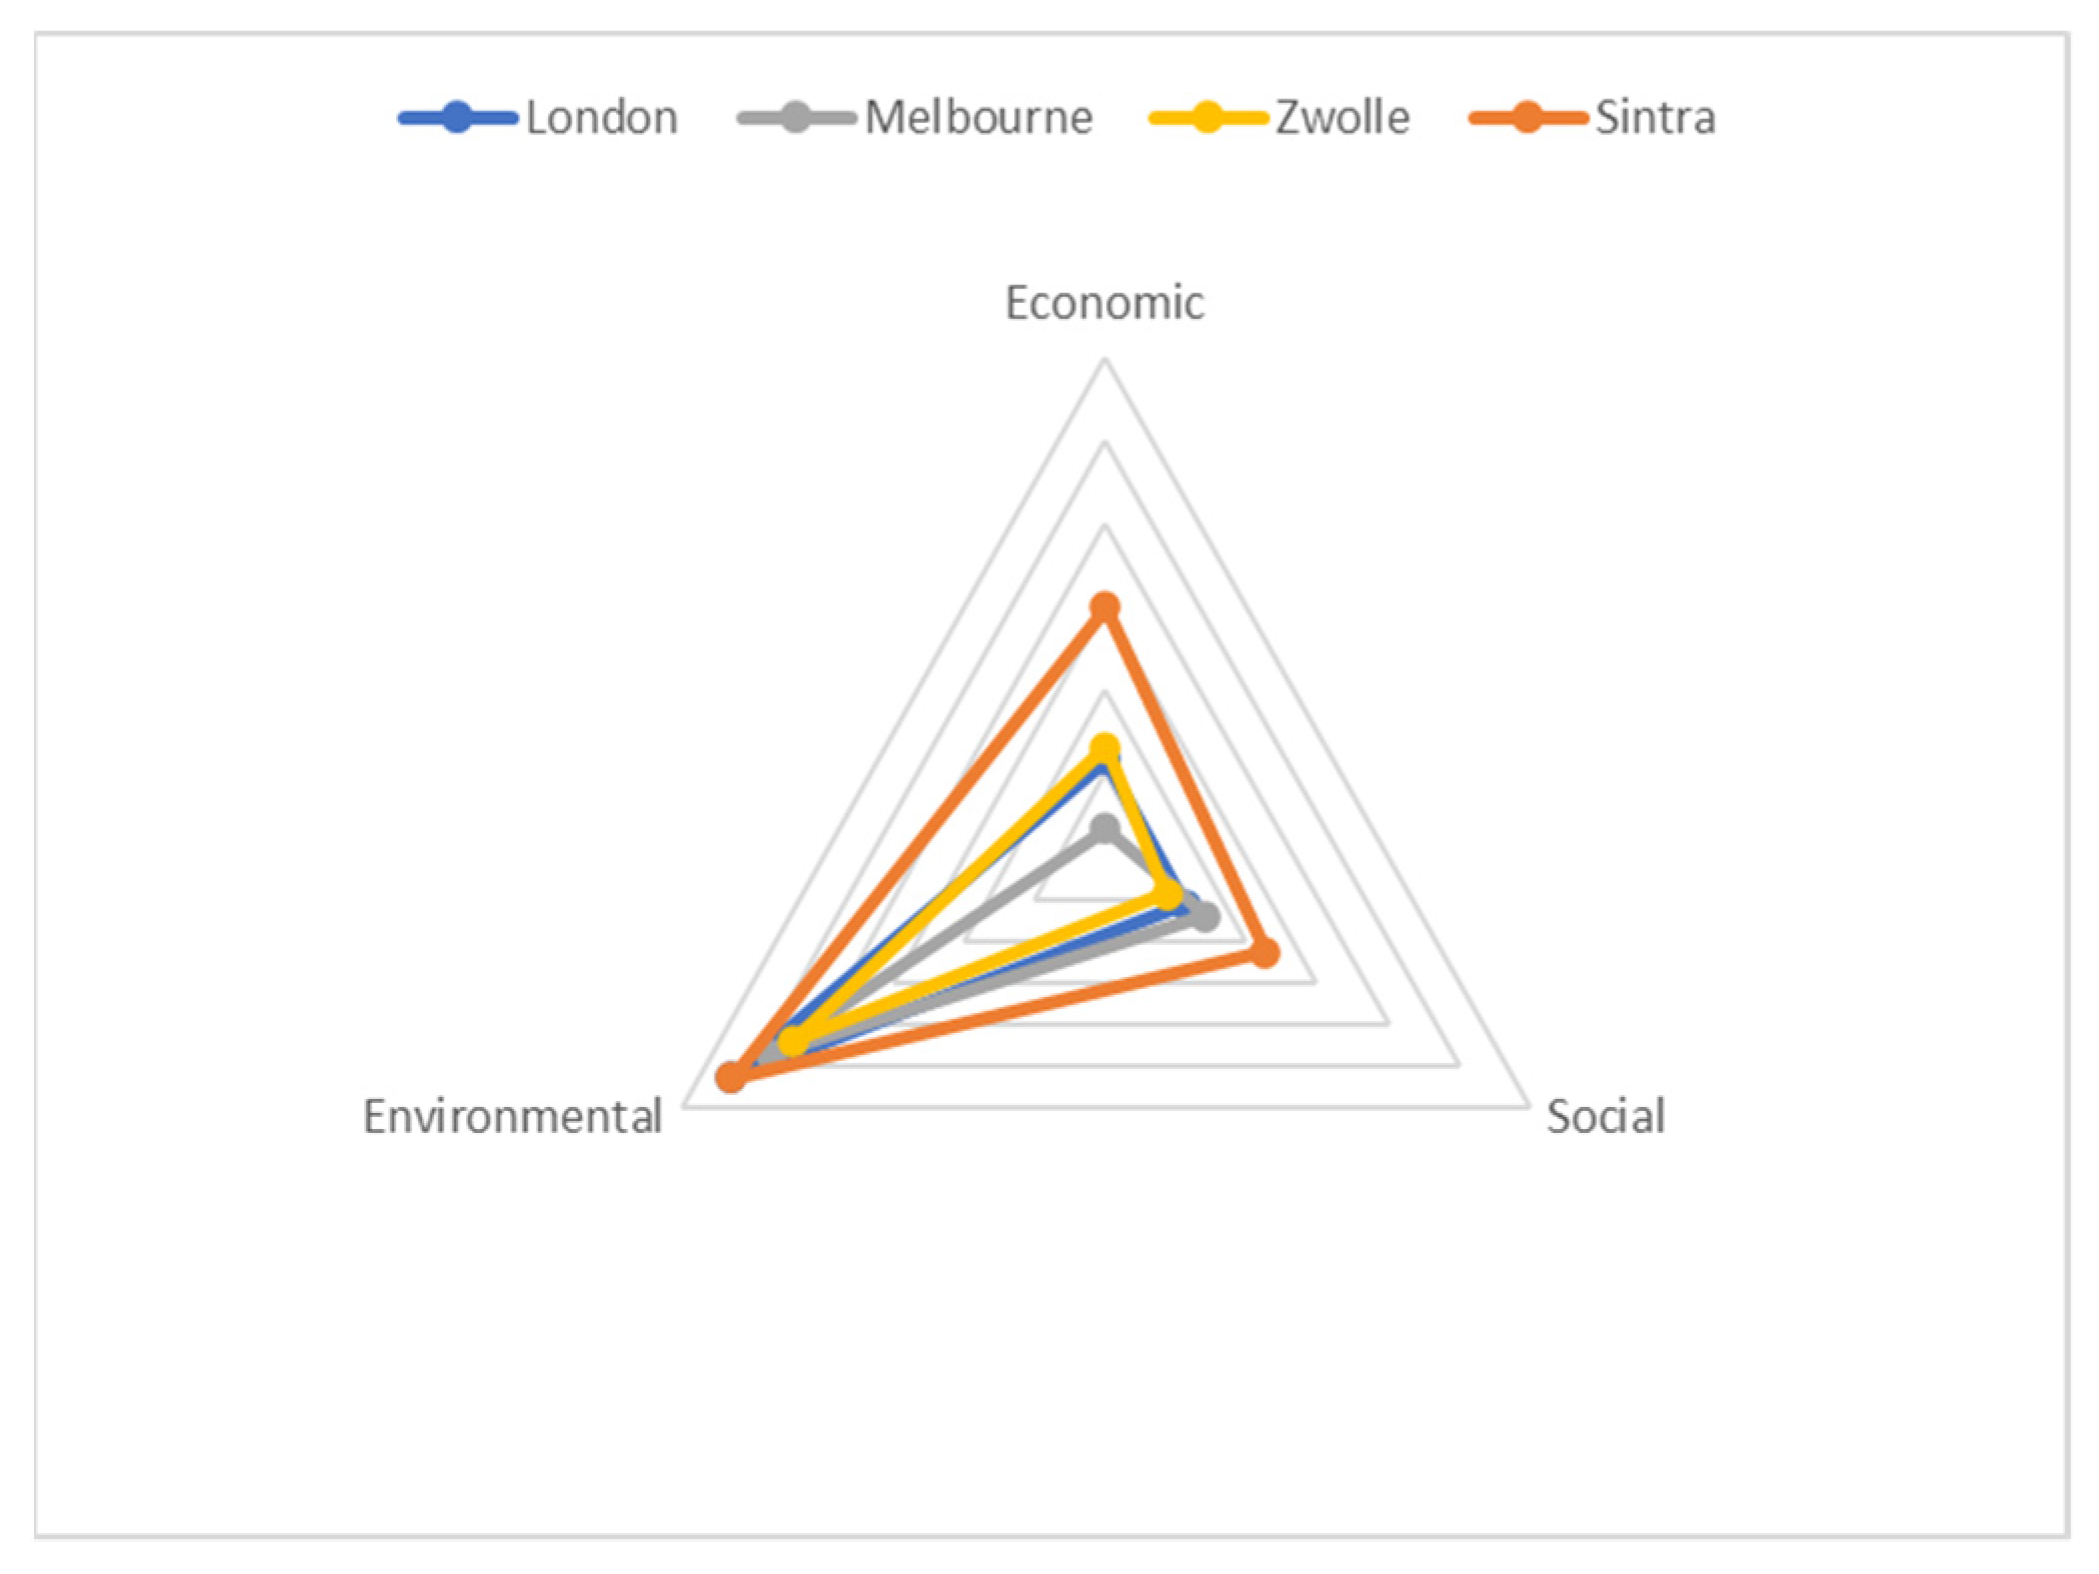
Figure 4 illustrates the comparison between two cities with fewer than 500,000 inhabitants (Sintra and Zwolle) with two cities with more than 5,000,000 inhabitants (Melbourne and London). All of them belong to developed countries.
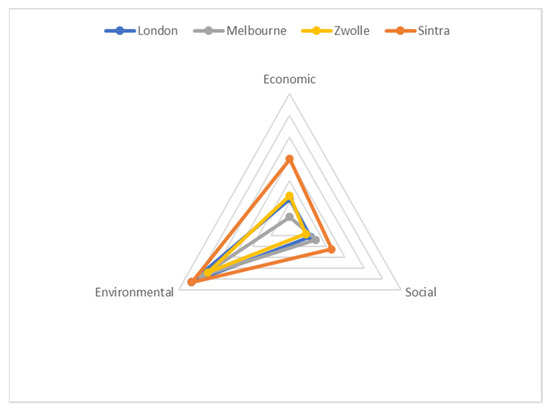
Figure 4.
Unsustainability profile by population in cities belonging to developed countries.
Figure 4 shows how the four cities have their main problem in the environmental dimension. However, the cities with a smaller population (Sintra and Zwolle) have a greater tendency towards economic problems than larger cities.
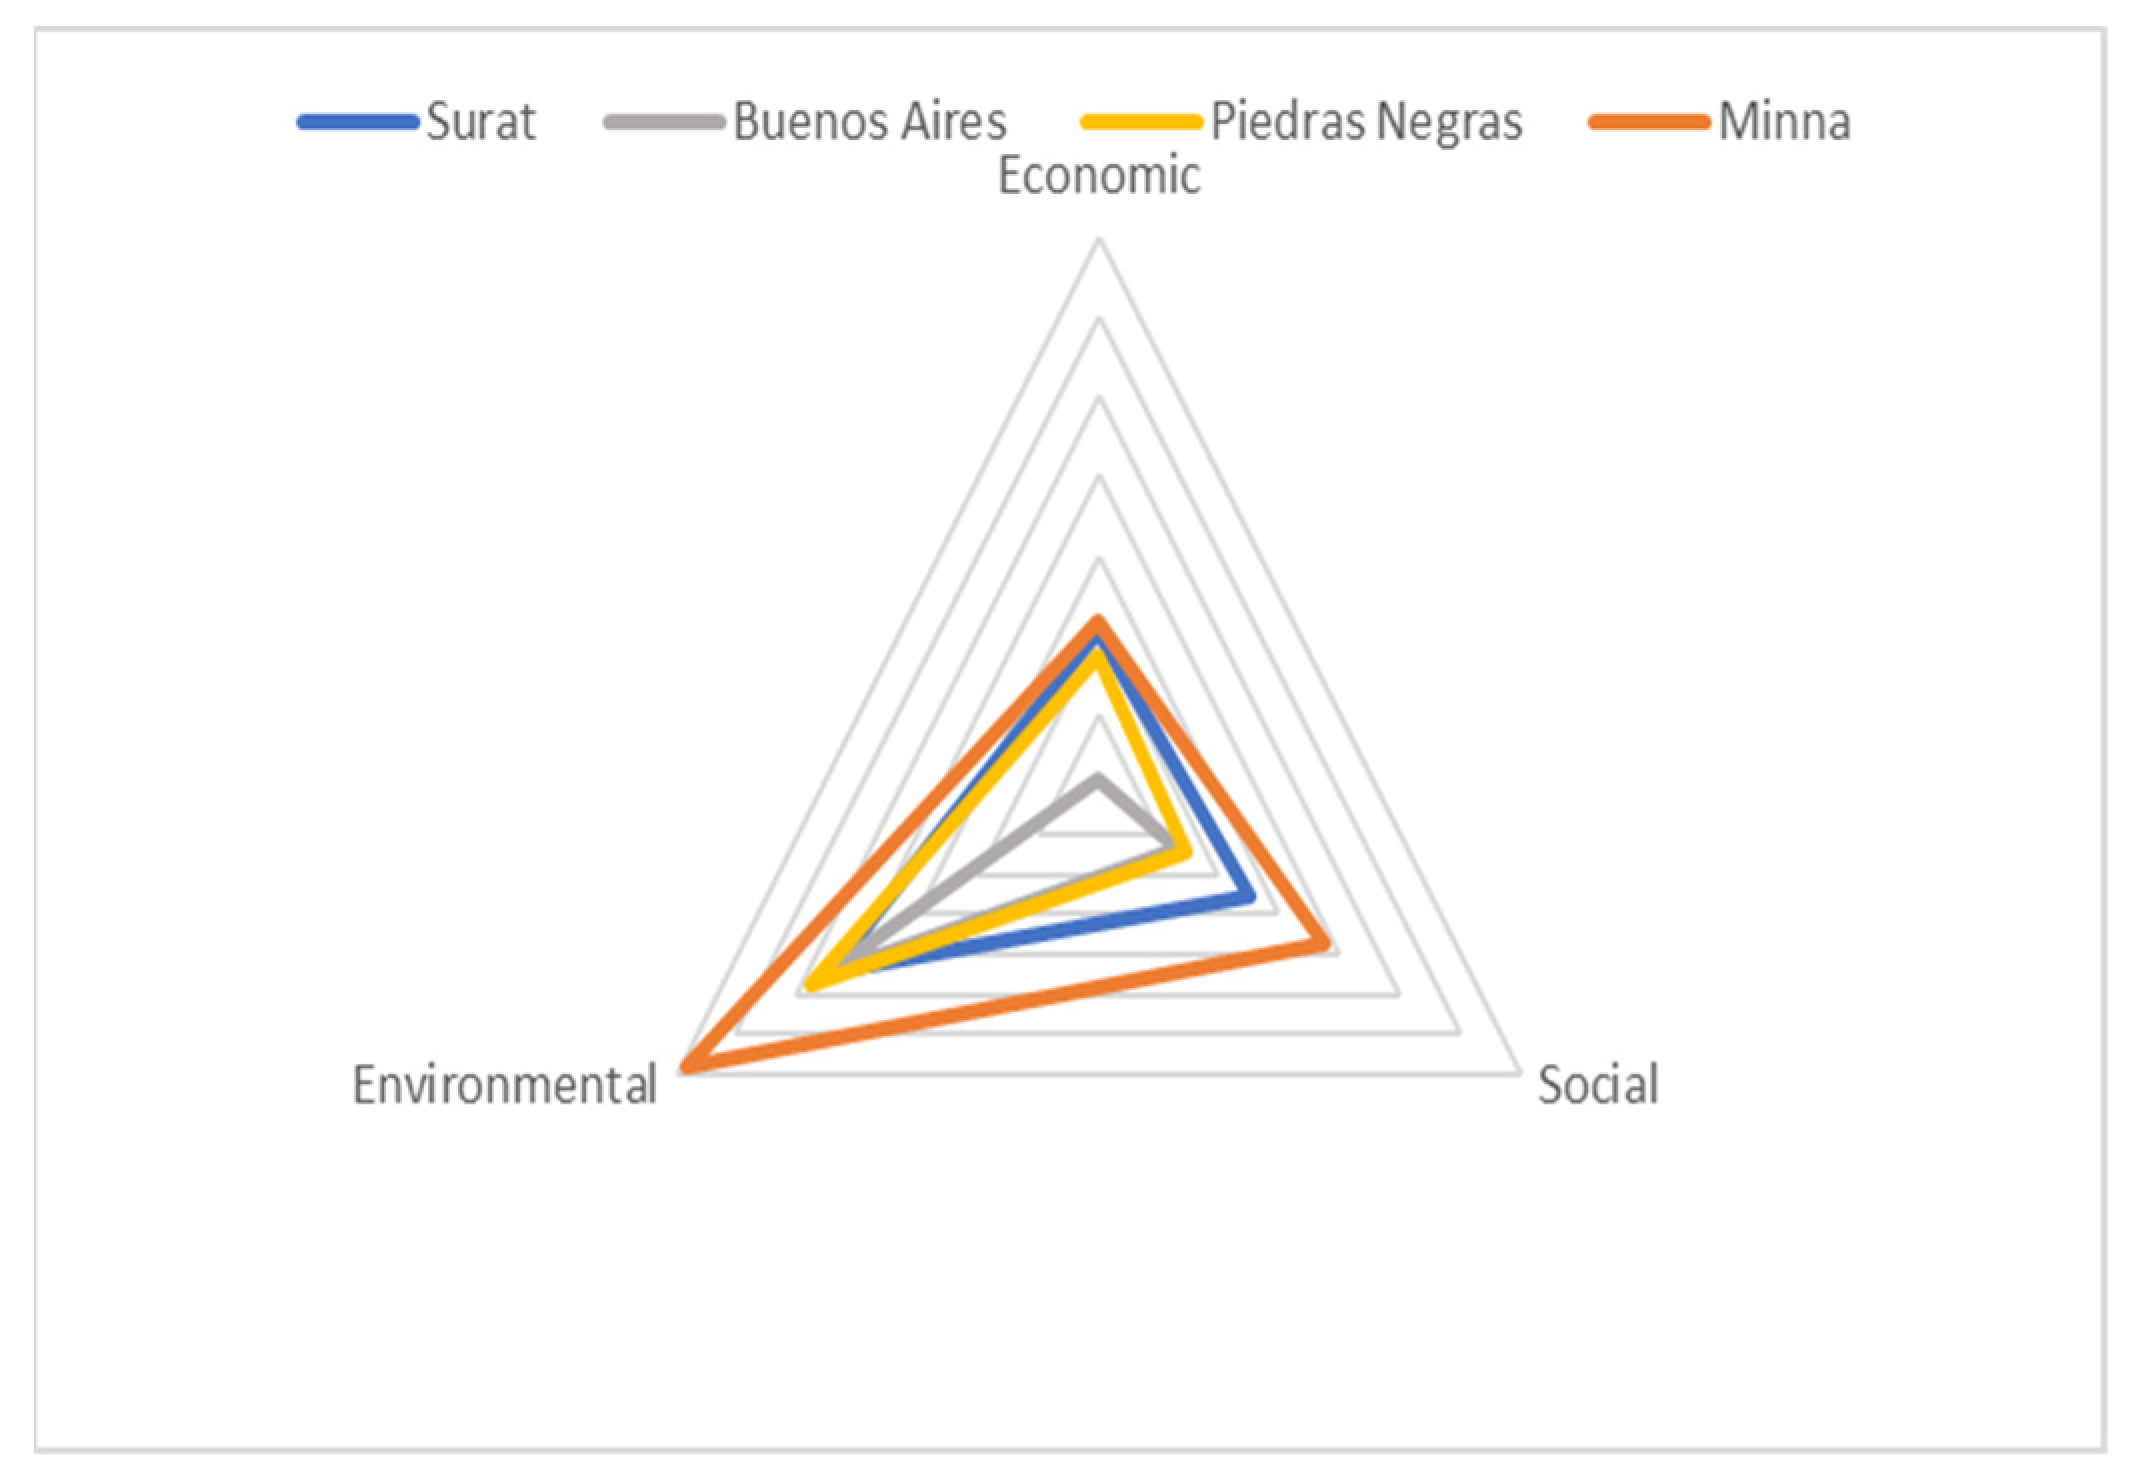
Figure 5 illustrates the comparison between two cities with fewer than 500,000 inhabitants (Piedras Negras and Minna) with two cities with more than 5,000,000 inhabitants (Surat and Buenos Aires) belonging to developing countries.
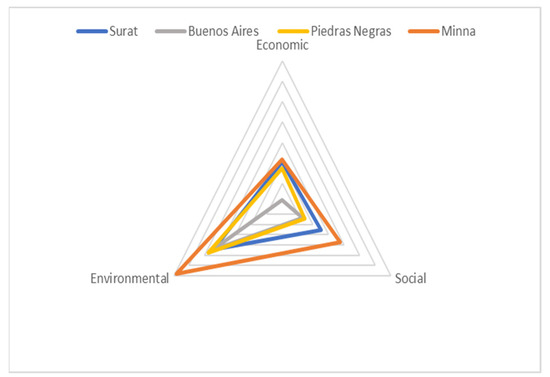
Figure 5.
Unsustainability profile by population in cities belonging to developing countries.
In cities belonging to developing countries, the most important issue is also the environmental problems. However, in these cities, there is no common pattern according to population similarities. For cities in developing countries, their second most important problems are in the social dimension.
Figure 6 summarizes the main findings of this work.
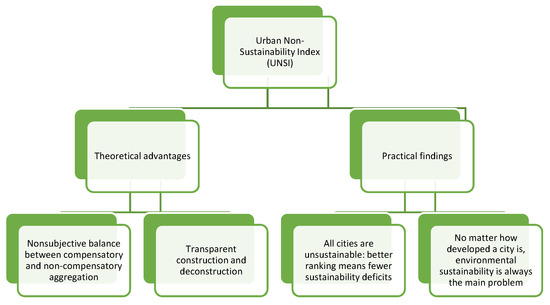
Figure 6.
Advantages and findings of the Urban Non-Sustainability Index (UNSI).
4. Conclusions
This article sets out a means to evaluate urban sustainability from the perspective opposite to the usual one. Seeking the shortcomings and measuring the gap with respect to objective targets allows us not only to make homogeneous comparisons between cities, but also to quickly identify where each city should direct its budget in efforts to face sustainability problems. In other words, the Urban Non-Sustainability Index (UNSI) is a useful tool for planning, applying and prioritizing public urban policies.
This is so because the selected indicators describe, to a great extent and in their different dimensions, the problems of sustainability that cities face and which are common all over the world. In addition, although it is true that the methodology applied is not novel, as it has been adapted from the measurement of poverty, it is the first time that the said methodology is used to analyze the problems of urban sustainability and with very promising results.
Furthermore, having found the adequate value of the penalization parameter to be 3 confirms the selection carried out by other researchers who opted for generalized means as an aggregation methodology to construct composite indicators. This is one of the principal contributions to the field, not only of urban sustainability, but also any field that uses indicators whose aggregation requires a medium term between totally non-compensatory and compensatory aggregation.
Thus, this balance is not defined in advance, but occurs spontaneously depending on whether there are extreme values in some dimension or not. The more similar the values of each dimension are, the closer the final aggregation will be to the arithmetic mean (compensatory aggregation). On the other hand, the more extreme a dimension value is, the more the final aggregation will approach that value (non-compensatory aggregation).
Regarding the practical implications, the fundamental one is its usefulness in the diagnosis of the main problems that each city must solve on the road to urban sustainability. In this way, the UNSI can be a fundamental element in the urban policy agenda and in the quantitative diagnostic processes for the strategic planning of cities. In other words, this approach demonstrates—unlike the usual rankings of sustainable cities—that all the cities are, to a greater or lesser extent, unsustainable. It is therefore necessary to evolve from an “ideal approach” to a “practical approach” that will allow us to identify the priorities so that each individual city would know exactly where to focus their economic efforts and their governing actions in the interests of sustainability.
What is more, the chosen sample of cities points to the fact that every city should prioritize the environmental aspects of sustainability.
Nevertheless, some limitations have been found to this approach. First, the lack of recent data in many cities and the need for more indicators that can allow more cities to be compared homogeneously, which does not allow a more accurate framework to be built with greater applicability throughout the world.
Another limitation has been the impossibility of studying the evolution of UNSI over time. Although some cities (Medellin) provided data that allowed this study to be carried out, a study of the evolution of UNSI in the sample as a whole was not possible.
However, UNSI, as an evaluation and diagnostic technique for the sustainability of cities, currently provides sufficient advantages to be considered a substantial novelty and a breakthrough in the field of sustainability and public urban policies.
The means of measuring unsustainability proposed in this article is a useful tool for cities to encourage them to monitor these indicators, which will allow them to objectively evaluate the state of the city’s situation in its sustainability problems. In short, if sustainability is a process towards standards and can be achieved by implementing public policies with limited financial resources, this proposal is useful for setting those priorities on the public agenda because it allows us to determine not only which problems the city has, but also their severity.
Funding
This research received no external funding.
Data Availability Statement
The data presented in this study are available on request from the author.
Acknowledgments
The author would like to thank both anonymous referees and the collaboration of Ramiro García Fernández and Carmen Rodríguez Sumaza of the Faculty of Economics of the University of Valladolid (Spain).
Conflicts of Interest
The author declares no conflict of interest.
Appendix A

Table A1.
Economic dimension: individual indicators.
Table A1.
Economic dimension: individual indicators.
| Economic Dimension | ||||||||
|---|---|---|---|---|---|---|---|---|
| Individual Indicator | IUSIL [10] | Smart City Ranking [15] | Technology Achievment Index [59] | Environmental Sustainability Index [60] | Composite Index of Sustainable Development at Local Scale [61] | Urban Sustainable Framework for India [62] | City Prosperity Index [63] | FEEM Sustainability Index [17] |
| City’s GDP per capita | X | X | X | |||||
| Percentage of city population living in poverty | X | X | X | X | ||||
| Gini coefficient | X | X | X | |||||
| City’s unemployment rate | X | X | X | X | X | |||
| Youth unemployment rate | X | X | ||||||
| Percentage of persons in full-time employment | X | |||||||
| Number of higher education degrees per 100,000 people | X | X | X | |||||
| Number of new patents per 100,000 people per year | X | X | ||||||
| Number of businesses per 100,000 people | X | |||||||
| Debt service ratio | X | X | X | |||||
| Capital spending as a percentage of total expenditures | X | X | ||||||
| Tax collected as a percentage of tax billed | X | |||||||

Table A2.
Social dimension: individual indicators.
Table A2.
Social dimension: individual indicators.
| Social Dimension | ||||||||
|---|---|---|---|---|---|---|---|---|
| Individual Indicator | IUSIL [10] | Smart City Ranking [15] | Technology Achievment Index [59] | Environmental Sustainability Index [60] | Composite Index of Sustainable Development at Local Scale [61] | Urban Sustainable Framework for India [62] | City Prosperity Index [63] | FEEM Sustainability Index [17] |
| Average life expectancy | X | X | X | |||||
| Suicidie rate per 100,000 people | X | |||||||
| Under age five mortality per 1000 live births | X | X | X | |||||
| Number of in-patient hospital beds per 100,000 people | X | X | ||||||
| Number of physicians per 100,000 people | X | X | ||||||
| Percentage of school-aged girls enrolled in schools | X | X | ||||||
| Percentage of students completing primary education: survival rate | X | X | ||||||
| Percentage of students completing secondary education: survival rate | X | X | ||||||
| Percentage of school-aged children enrolled in schools | X | |||||||
| Percentage of city population with authorized electrical service | X | X | X | X | ||||
| Percentage of city population with regular solid waste collection | X | X | ||||||
| Percentage of city population with wastewater collection service | X | X | X | X | ||||
| Percentage of city population with potable water supply service | X | X | X | |||||
| Number of firefighters per 100,000 people | X | X | ||||||
| Number of homicides per 100,000 people | X | X | X | |||||
| Crimes against property per 100,000 people | X | |||||||
| Violent crime rate per 100,000 people | X | X | X | X | ||||
| Transportation fatalities per 100,000 people | X | X | ||||||

Table A3.
Environmental dimension: individual indicators.
Table A3.
Environmental dimension: individual indicators.
| Environmental Dimension | ||||||||
|---|---|---|---|---|---|---|---|---|
| Individual Indicator | IUSIL [10] | Smart City Ranking [15] | Technology Achievment Index [59] | Environmental Sustainability Index [60] | Composite Index of Sustainable Development at Local Scale [61] | Urban Sustainable Framework for India [62] | City Prosperity Index [63] | FEEM Sustainability Index [17] |
| Percentage of the total energy derived from renewable sources as a share of the city’s total energy consumption | X | X | ||||||
| Total electrical energy use per capita (kWh/year) | X | X | X | |||||
| Kilometers of high-capacity public transport system per 100,000 people | X | X | ||||||
| Percentage of the city’s wastewater receiving no treatment | X | X | ||||||
| Percentage of the city’s wastewater receiving tertiary treatment | X | |||||||
| Total domestic water consumption per capita | X | X | X | X | X | X | ||
| Percentage of the city’s solid waste that is recycled | X | X | ||||||
| Total collected municipal solid waste per capita | X | X | ||||||
| Fine particulate matter (PM2.5) concentration | X | X | X | |||||
| Greenhouse gas emissions measured in tonnes per capita | X | X | X | X | ||||
Appendix B
All references done to the median are referred to the sample of cities shown in Table 3.

Table A4.
Criteria for establishing sustainability thresholds: economic dimension.
Table A4.
Criteria for establishing sustainability thresholds: economic dimension.
| Indicator | Sustainability Threshold | Source |
|---|---|---|
| City’s GDP per capita | 9489.00 USD/hab | 60% of the median incomee of thcountries classified as “upper middle income” by the World Bank |
| Percentage of city’s population living in poverty | 8.5% | 60% of the median |
| Gini coefficient | 0.4 | Based on the United Nations Standard [64] |
| City’s unemployment rate | 6.17 | Median |
| Youth unemployment rate | 11.86 | Median |
| Percentage of persons in full-time employment | 37.8% | 60% of the median |
| Number of higher education degrees per 100,000 people | 26.8 | Median |
| Number of new patents per 100,000 people per year | 5.33 | 60% of the median |
| Number of businesses per 100,000 people | 3.000 | 60% of the median |
| Debt service ratio | 60% | Based on the criteria adopted for monetary union convergence |
| Capital spending as a percentage of total expenditures | 14.57% | Median |
| Tax collected as a percentage of tax billed | 80% | Based on local goverment uses in Spain. |

Table A5.
Criteria for establishing sustainability thresholds: social dimension.
Table A5.
Criteria for establishing sustainability thresholds: social dimension.
| Indicator | Sustainability Threshold | Source |
|---|---|---|
| Average life expectancy | 80.7 | OECD average (2017) |
| Suicidie rate per 100,000 people | 4.8 | 60% of the median |
| Under age five mortality per 1000 live births | 3.5 | OECD average (2017) |
| Number of in-patient hospital beds per 100,000 people | 470 | OECD average (2017) |
| Number of physicians per 100,000 people | 350 | OECD average (2017) |
| Percentage of school-aged girls enrolled in schools | 99% | SDG 4: all school-aged population have to complete primary and secondary education levels in 2030 |
| Percentage of students completing primary education: survival rate | 98% | SDG 4: all school-aged population have to complete primary and secondary education levels in 2030 |
| Percentage of students completing secondary education: survival rate | 97% | SDG 4: all school-aged population have to complete primary and secondary education levels in 2030 |
| Percentage of school-aged children enrolled in schools | 99% | SDG 4: all school-aged population have to complete primary and secondary education levels in 2030 |
| Percentage of city population with authorized electric service | 99% | SDG 7: universal access in 2030 |
| Percentage of city population with regular solid waste collection | 98% | SDG 11: universal access in 2030 |
| Percentage of city population with wastewater collection service | 99% | SDG 6: total population served in 2030 |
| Percentage of city population with potable water supply service | 99% | SDG 6: total population served in 2030 |
| 100 | International Standard | |
| Number of homicides per 100,000 people | 1.3 | 60% of the median |
| Crimes against property per 100,000 people | 682 | 60% of the median |
| Violent crime rate per 100,000 people | 252 | 60% of the median |
| Transportation fatalities per 100,000 people | 1.6 | 50% of the median (based on SDG 3.6) |

Table A6.
Criteria for establishing sustainability thresholds: environmental dimension.
Table A6.
Criteria for establishing sustainability thresholds: environmental dimension.
| Indicator | Sustainability Threshold | Source |
|---|---|---|
| Percentage of the total energy derived from renewable sources, as a share of the city’s total energy consumption | 27% | Median decreased by 27%. Based on the European Comission Standard. |
| Total electrical energy use per capita (kWh/year) | 3523 (kWh/year) | Median decreased by 27%. Based on the European Comission Standard. |
| Kilometres of high-capacity public transport system per 100,000 people | 1.54 | 50% of the median |
| Percentage of the city’s wastewater receiving no treatment | 0 | Authors’ criterion |
| Percentage of the city’s wastewater receiving tertiary treatment | 90% | Authors’ criterion |
| Total domestic water consumption per capita | 100 l/person/day | International Standard [x] |
| Percentage of the city’s solid waste that is recycled | 50% | Based on the European Union standard |
| Total collected municipal solid waste per capita | 0.16 | Median reduced by 55%. Based on the European Union standard |
| Fine particulate matter (PM2.5) concentration | 25 µg/m3 (24 h average) | World Health Organization Standard |
| Greenhouse gas emissions measured in tonnes per capita | 2.87 | Based on the European Union standard |
References
- Bybee, R.W. Planet Earth in crisis: How should science educators respond? Am. Biol. Teach. 1991, 53, 146–153. [Google Scholar] [CrossRef]
- World Commission on Environment and Development. From One Earth to One World: An Overview; Oxford University Press: Oxford, UK, 1987. [Google Scholar]
- Tanguay, G.A.; Rajaonson, J.; Lefebvre, J.F.; Lanoie, P. Measuring the sustainability of cities: An analysis of the use of local indicators. Ecol. Indic. 2010, 10, 407–418. [Google Scholar] [CrossRef]
- Hacking, T.; Guthrie, P. A framework for clarifying the meaning of Triple Bottom-Line, Integrated, and Sustainability Assesment. Environ. Impact. Assess. Rev. 2008, 28, 73–89. [Google Scholar] [CrossRef]
- Seto, K.C.; Fragkias, M.; Güneralp, B.; Reilly, M.K. A Meta-Analysis of Global Urban Land Expansion. PLoS ONE 2011, 6, e23777. [Google Scholar] [CrossRef]
- Gardner, G.; Prugh, T.; Renner, M. Can a City Be Sustainable? Worldwatch Institute: Washington, DC, USA, 2016. [Google Scholar]
- Swilling, M.; Robinson, B.; Marvin, S.; Hodson, M. City-Level Decoupling: Urban Resource Flows and the Governance of Infrastructure Transitions. In Summary for Policy Makers; UNEP: Nairobi, Kenya, 2013. [Google Scholar]
- Cain, S.A. The importance of ecological studies as a basis for land use planning. Biol. Conserv. 1968, 1, 33–36. [Google Scholar] [CrossRef]
- Drakakis-Smith, D.W. Third World Cities; Routledge: London, UK, 2000. [Google Scholar] [CrossRef]
- European Commission. Targeted Summary of the European Sustainable Cities Report for Local Authorities; European Commission: Brussels, Belgium, 1996. [Google Scholar]
- United Nations Human Settlements Programme (UN-Habitat). Urbanization and Development: Emerging Futures. In World Cities Report 2016; UN-Habitat: Nairobi, Kenya, 2016. [Google Scholar]
- Shen, L.; Ochoa, J.J.; Shah, M.; Zhang, X. The application of urban sustainability indicators—A comparison between various practices. Habit. Int. 2011, 35, 17–29. [Google Scholar] [CrossRef]
- UNCED (The United Nations Conference on Environment and Development, earth Summit). Rio Declaration on Environment and Development; UNCED: Rio de Janeiro, Brazil, 1992. [Google Scholar]
- Briassoulis, H. Sustainable development and its indicators: Through a (planner’s) glass darkly. J. Environ. Plan. Manag. 2011, 44, 409–427. [Google Scholar] [CrossRef]
- Giffinger, R.; Fertner, C.; Kramar, H.; Kalasek, R.; Pichler-Milanovic, N.; Meijers, E. Smart Cities-Ranking of European Medium-Sized Cities; Centre of Regional Science, Vienna University of Technology: Vienna, Austria, 2007. [Google Scholar]
- Böhringer, C.; Jochem, P.E.P. Measuring the immeasurable—A survey of sustainability indices. Ecol. Econ. 2007, 63, 1–8. [Google Scholar] [CrossRef] [Green Version]
- Cruciani, C.; Giove, S.; Oinar, M.; Sostero, M. Constructing the FEEM Sustainability Index: A Choquet Integral Application. Nota Di Lavoro; Fundazione Eni Enrico Mattei: Venice, Italy, 2013. [Google Scholar] [CrossRef]
- Vollmer, D.; Regan, H.M.; Andelman, S.J. Assesing the sustainability of freshwater systems: A critical review of composite indicators. Ambio 2016, 45, 765–780. [Google Scholar] [CrossRef] [Green Version]
- Nardo, M.; Saisana, M.; Saltelli, A.; Tarantola, S.; Hoffmann, A.; Giovannini, E. Handbook on Constructing Composite Indicators: Methodology and User Guide; OECD Publishing: Paris, France, 2008. [Google Scholar]
- Pupphachai, U.; Zuidema, C. Sustainable indicators: A tool to generate learning and adaptation in sustainable urban development. Ecol. Ind. 2017, 72, 784–793. [Google Scholar] [CrossRef]
- Bell, S.; Morse, S. Sustainability Indicators Past and Present: What Next? Sustainability 2018, 10, 1688. [Google Scholar] [CrossRef] [Green Version]
- Diaz-Sarachaga, J.M.; Jato-Espino, D.; Castro-Fresno, D. Is the Sustainable Development Goals (SDG) index an adequate framework to measure the progress of the 2030 Agenda? Sust. Dev. 2018, 6, 663–671. [Google Scholar] [CrossRef]
- Spaiser, V.; Ranganathan, S.; Swain, R.B.; Sumpter, D. The sustainable development oxymoron: Quantifying and modelling the incompatibility of sustainable development goals. Int. J. Sust. Dev. World. Ecol. 2017, 24, 457–470. [Google Scholar] [CrossRef]
- Kühner, T.; Da Silva Pinto, C.V.; David Amorim, C.N. International urban agendas and sustainable integrated urban development in developing countries: The case of Brazil. Cidades. Comunidades Territ. 2021, 21, 120–138. [Google Scholar] [CrossRef]
- Shen, L.; Yan, H.; Zhang, X.; Shuai, C. Experience mining based innovative method for promoting urban sustainability. J. Clean. Prod. 2017, 156, 707–716. [Google Scholar] [CrossRef]
- Kumar, A.; Anbanandam, R. Development of social sustainability index for freight transportation system. J. Clean. Prod. 2019, 210, 77–92. [Google Scholar] [CrossRef]
- Pollesch, N.; Dale, V.H. Applications of aggregation theory to sustainability assessment. Ecol. Econ. 2015, 114, 117–127. [Google Scholar] [CrossRef] [Green Version]
- Sáez, L.; Heras-Saizarbitoria, I.; Rodríguez-Núñez, E. Sustainable city rankings, benchmarking and indexes: Looking into the black box. Sustain. Cities Soc. 2020, 53, 101938. [Google Scholar] [CrossRef]
- Prieto, M.; González, Y.; García, C. La pobreza en España desde una perspectiva multidimensional. Rev. Econ. Aplic. 2016, 70, 77–110. [Google Scholar]
- Fernández Güell, J.M. Planificación Estratégica de Ciudades: Nuevos Instrumentos y Procesos; Editorial Reverté: Barcelona, Spain, 2006. [Google Scholar]
- Verma, P.; Raghubanshi, A.S. Urban sustainability indicators: Challenges and opportunities. Ecol. Indic. 2018, 93, 282–291. [Google Scholar] [CrossRef]
- Guio, A.C. What can be learned from deprivation indicators in Europe? Method. Work. Pap. 2009, 40, 1–33. [Google Scholar]
- Mori, K.; Christodoulou, A. Review of sustainability indices and indicators: Towards a new City Sustainability Index (CSI). Environ. Imp. Assess. Rev. 2012, 32, 94–106. [Google Scholar] [CrossRef]
- Díaz-Balteiro, L.; Romero, C. In search of a natural systems sustainability index. Ecol. Econ. 2004, 49, 401–405. [Google Scholar] [CrossRef]
- Cloutier, S.; Larson, L.; Jambeck, J. Are sustainable cities “happy” cities? Associations between sustainable development and human well-being in urban áreas of the United States. Environ. Dev. Sustain. 2013, 16, 633–647. [Google Scholar] [CrossRef]
- Meijering, J.V.; Kern, K.; Tobi, H. Identifying the methodological characteristics of European green city rankings. Ecol. Ind. 2014, 43, 132–142. [Google Scholar] [CrossRef]
- Ebert, U.; Welsch, H. Meaningful environmental índices: A social choice approach. J. Environ. Econ. Manag. 2004, 47, 270–283. [Google Scholar] [CrossRef]
- Pissourios, I.A. An interdisciplinary study on indicators: A comparative review of quality of life, macroeconomic, environmental, welfare and sustainability indicators. Ecol. Ind. 2013, 34, 420–427. [Google Scholar] [CrossRef]
- World Bank Group. Available online: http://documents.worldbank.org/curated/en/703901468147574810/Social-development-putting-people-first (accessed on 1 June 2021).
- Hiremath, R.; Balachandra, P.; Kumar, B.; Bansode, S.S.; Murali, J. Indicator-based urban sustainability—A review. Energy Sustain. Dev. 2013, 17, 555–563. [Google Scholar] [CrossRef]
- International Standardization Organization. ISO 37120: Sustainable Development of Communities—Indicators for City Services and Quality of Life; ISO: Geneve, Switzerland, 2014. [Google Scholar]
- Freudenberg, M. Composite indicators of country performance: A critical Assesment. OECD Sci. Technol. Ind. Work. Pap. 2003, 16, 1–34. [Google Scholar] [CrossRef]
- Nardo, M.; Munda, G. Constructing Consistent Composite Indicators: The Issue of Weights; European Commission: Luxembourg City, Luxembourg, 2005. [Google Scholar]
- Pollesch, N.; Dale, V.H. Normalization in sustainability assessment: Methods and implications. Ecol. Econ. 2016, 130, 195–208. [Google Scholar] [CrossRef] [Green Version]
- Tarabusi, E.C.; Guarini, G. An Unbalance Adjustment Method for Development Indicators. Soc. Indic. Res. 2013, 112, 19–45. [Google Scholar] [CrossRef]
- Gan, X.; Fernández, I.C.; Guo, J.; Wilson, M.; Zhao, Y.; Zhou, B.; Wu, J. When to use what: Methods for weighting and aggregating sustainability indicators. Ecol. Indic. 2017, 81, 491–502. [Google Scholar] [CrossRef]
- Greco, S.; Ishizaka, A.; Tasiou, M.; Torrisi, G. On the methodological framework of composite indices: A review of the Issues of Weighting, Aggregation and Robustness. Soc. Indic. Res. 2019, 141, 61–94. [Google Scholar] [CrossRef] [Green Version]
- Munda, G.; Nardo, M. Non-compensatory/non-lineal composite indicators for ranking countries. A defensible setting. Appl. Econ. 2009, 41, 1513–1523. [Google Scholar] [CrossRef] [Green Version]
- Mazziotta, M.; Pareto, A. Measuring Well-Being Over Time: The Adjusted Mazziotta-Pareto Index Versus Other Non-compensatory Indices. Soc. Indic. Res. 2018, 136, 967–976. [Google Scholar] [CrossRef]
- Ziemba, P. Towards Strong Sustainability Management -A Generalized PROSA Method. Sustainability 2019, 11, 1555. [Google Scholar] [CrossRef] [Green Version]
- Sen, A.; Annad, S. Concepts of Human Development and Poverty: A multidimensional Perspective. In Poverty and Human Development: Human Development Papers; United Nations Development Programme: New York, NY, USA, 1997. [Google Scholar]
- Lasso de la Vega, C.; Díez, H.; Urrutia, A. Multidimensional unit-and subgroup-consistent inequality and poverty measures: Some characterizations. Res. Econ. Inequal. 2008, 16, 189–211. [Google Scholar] [CrossRef]
- Ruiz, N. Measuring the joint distribution of household’s income, consumption and wealth using nested atkinson measures. OECD Stat. Work. Pap. 2011, 5, 1–37. [Google Scholar] [CrossRef]
- Lasso de la Vega, C.; Urrutia, A. Characterizing how to aggregate the individual’s deprivations in a multidimensional framework. J. Econ. Inequal. 2011, 9, 183–194. [Google Scholar] [CrossRef]
- Chakravarty, S.R. Analyzing Multidimensional Well-Being: A Quantitative Approach; Wiley: Hoboken, NJ, USA, 2017. [Google Scholar]
- Chakravarty, S.R.; Majumder, A. Measuring Human Poverty: A Generalized Index and an Application Using Basic Dimensions of Life and Some Anthropometric Indicators. J. Hum. Dev. 2005, 6, 275–299. [Google Scholar] [CrossRef]
- United Nations. Human Development Report. In Overcoming Barriers-Human Mobility and Development; UNDP: New York, NY, USA, 2009. [Google Scholar] [CrossRef]
- Klimaetaten Oslo Kommune. Available online: www.klimaoslo.no/2020/06/10/oslos-new-climate-strategy/ (accessed on 31 July 2021).
- Cherchye, L.; Moesen, W.; Rogge, N.; Van Puyenbroeck, T.; Saisana, M.; Saltelli, A.; Liska, R.; Tarantola, S. Creating composite indicators with DEA and robustness analysis: The case of the Technology Achievement Index. J. Oper. Res. Soc. 2008, 59, 239–251. [Google Scholar] [CrossRef]
- Sands, G.R.; Podmore, T.H. A generalized environmental sustainability index for agricultural systems. Agric. Ecosyst. Environ. 2000, 79, 29–41. [Google Scholar] [CrossRef]
- Salvati, L.; Carlucci, M. A composite indez of sustainable development at the local scale: Italy as a case study. Ecol. Ind. 2014, 43, 162–171. [Google Scholar] [CrossRef]
- Panda, S.; Chakraborty, M.; Misra, S.K. Assessment of social sustainable development in urban India by a composite index. Int. J. Sustain. B Environ. 2016, 5, 435–450. [Google Scholar] [CrossRef] [Green Version]
- Wong, C. A framework for ‘City Prosperity Index’: Linking indicators, analysis and policy. Habitat Int. 2014, 45, 3–9. [Google Scholar] [CrossRef]
- López Moreno, E. Construcción de Ciudades más Equitativas. In Políticas Públicas Para la Inclusión en América Latina; CAF: Bogotá, Colombia, 2014. [Google Scholar]
Publisher’s Note: MDPI stays neutral with regard to jurisdictional claims in published maps and institutional affiliations. |
© 2021 by the author. Licensee MDPI, Basel, Switzerland. This article is an open access article distributed under the terms and conditions of the Creative Commons Attribution (CC BY) license (https://creativecommons.org/licenses/by/4.0/).

