Using AI-MCDM Model to Boost Sustainable Energy System Development: A Case Study on Solar Energy and Rainwater Collection in Guangdong Province
Abstract
:1. Introduction
2. Literature Review
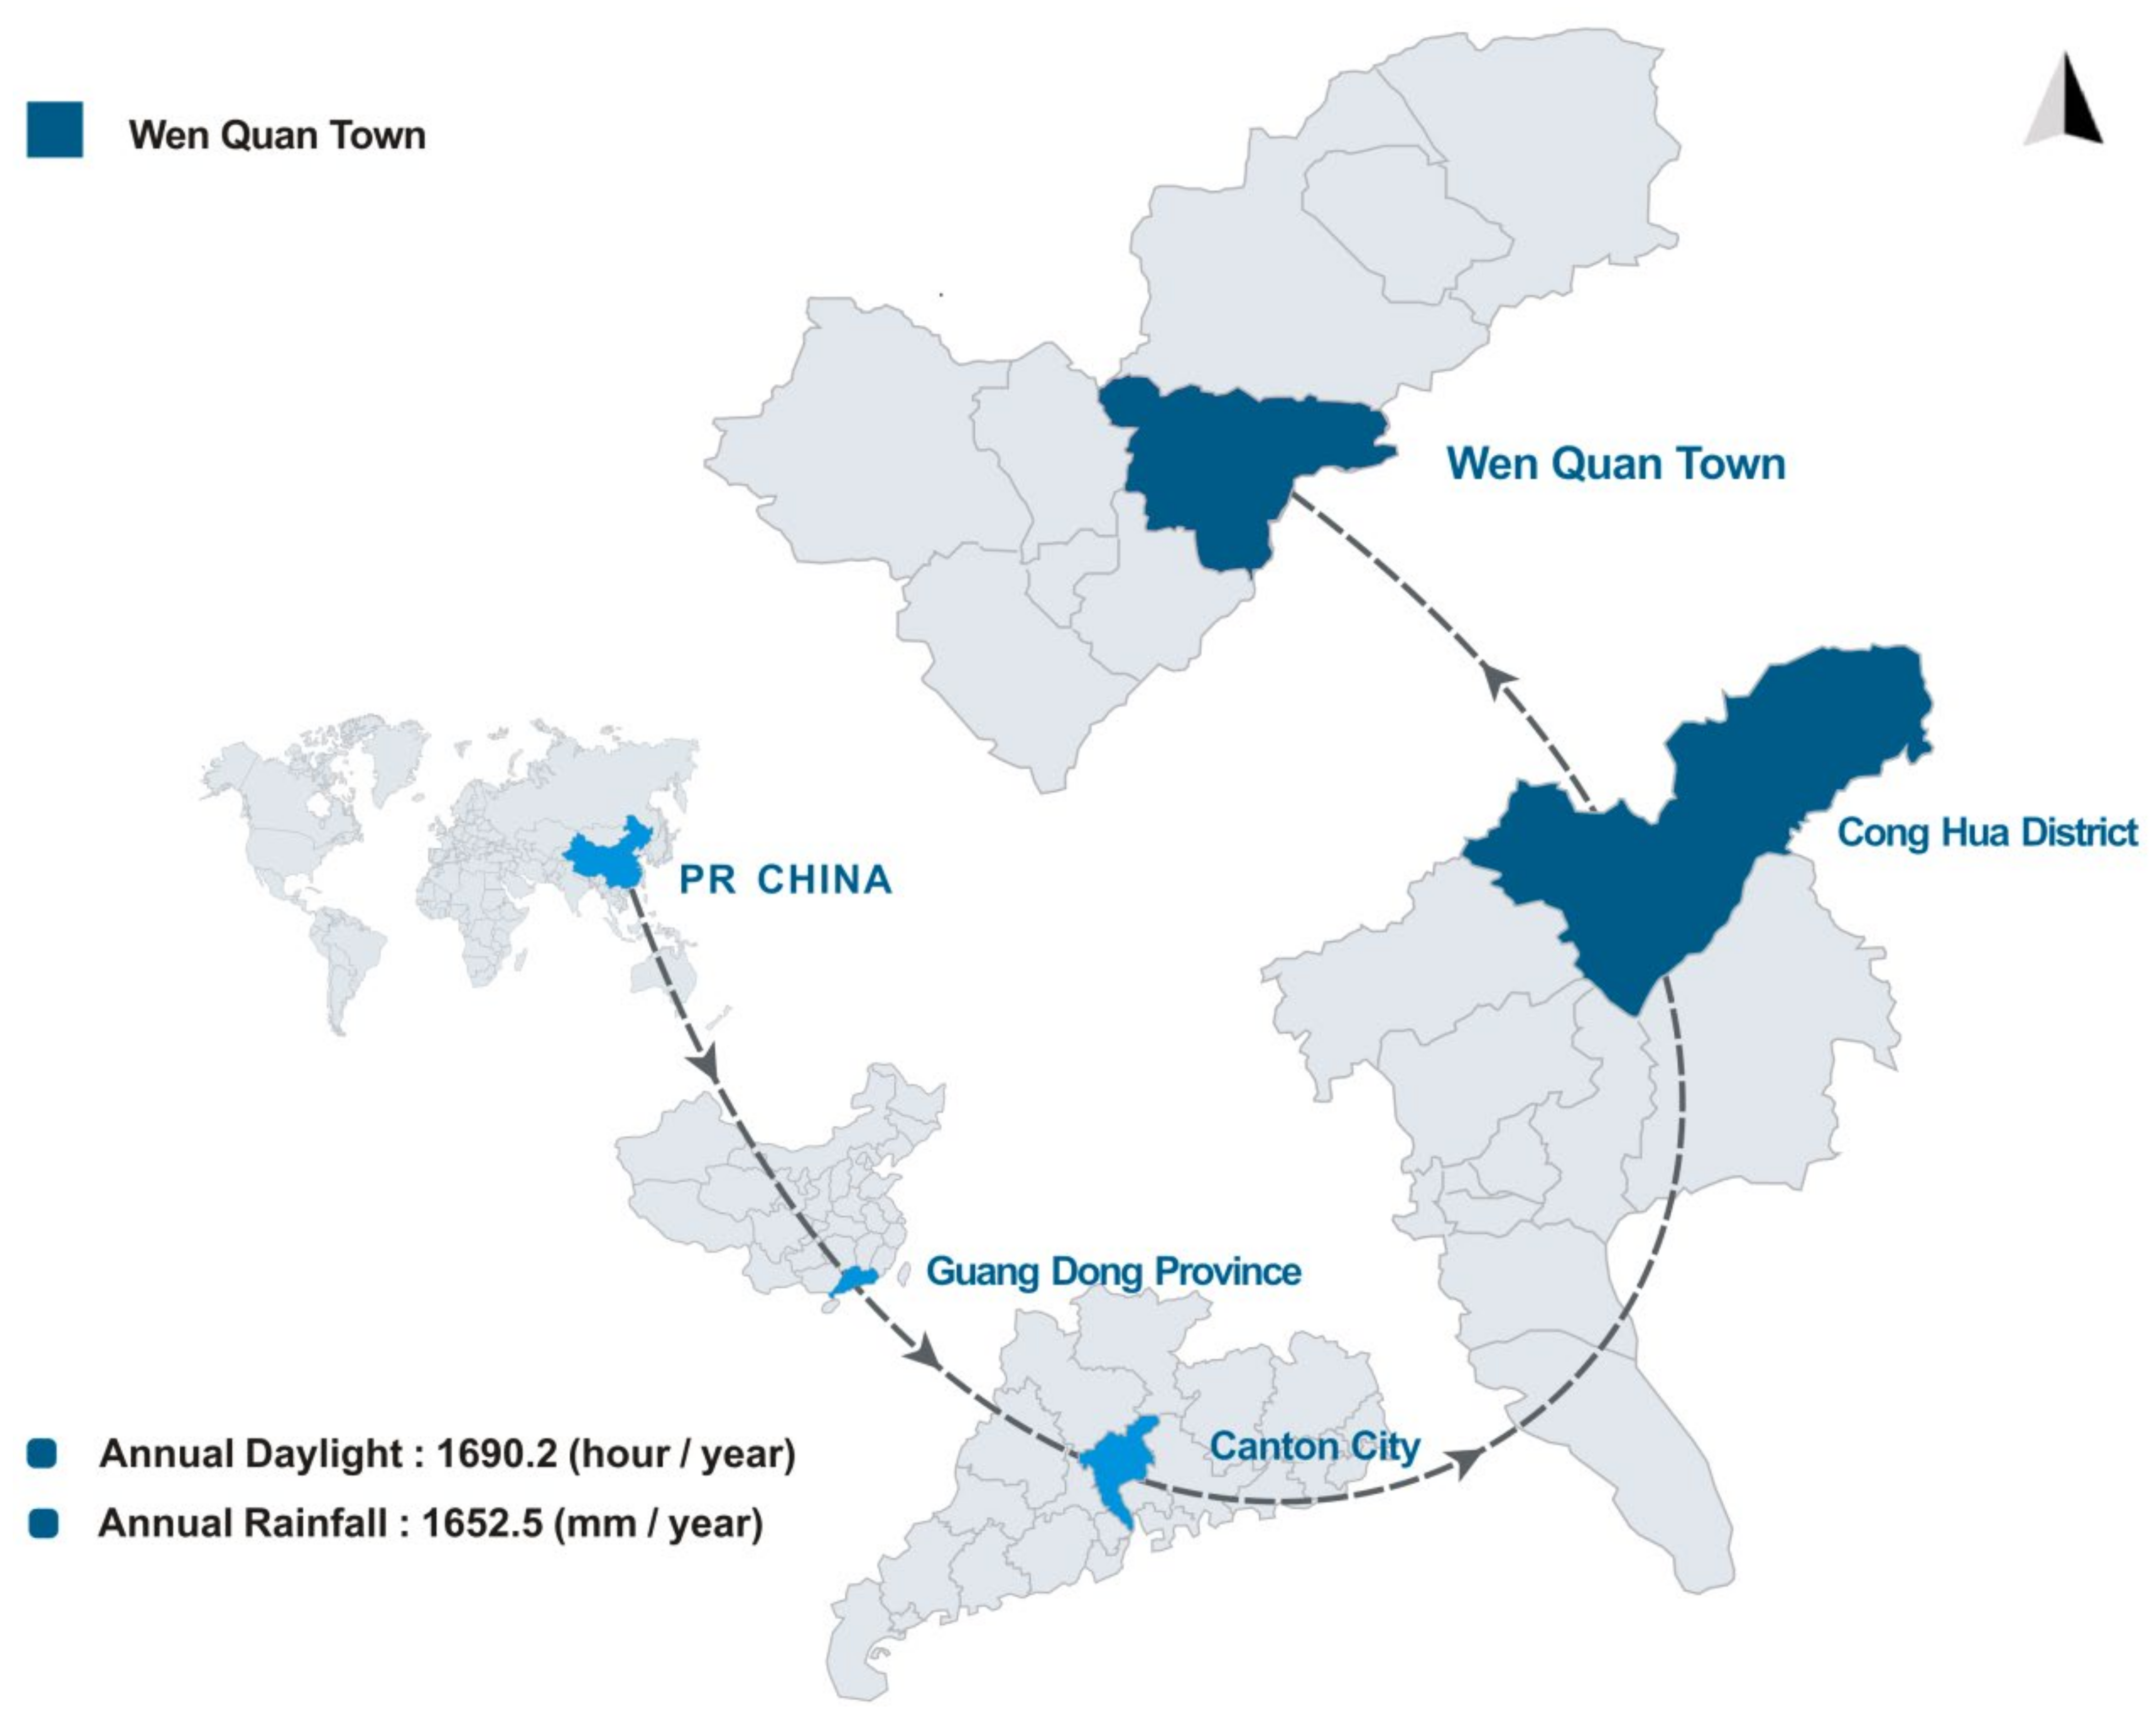
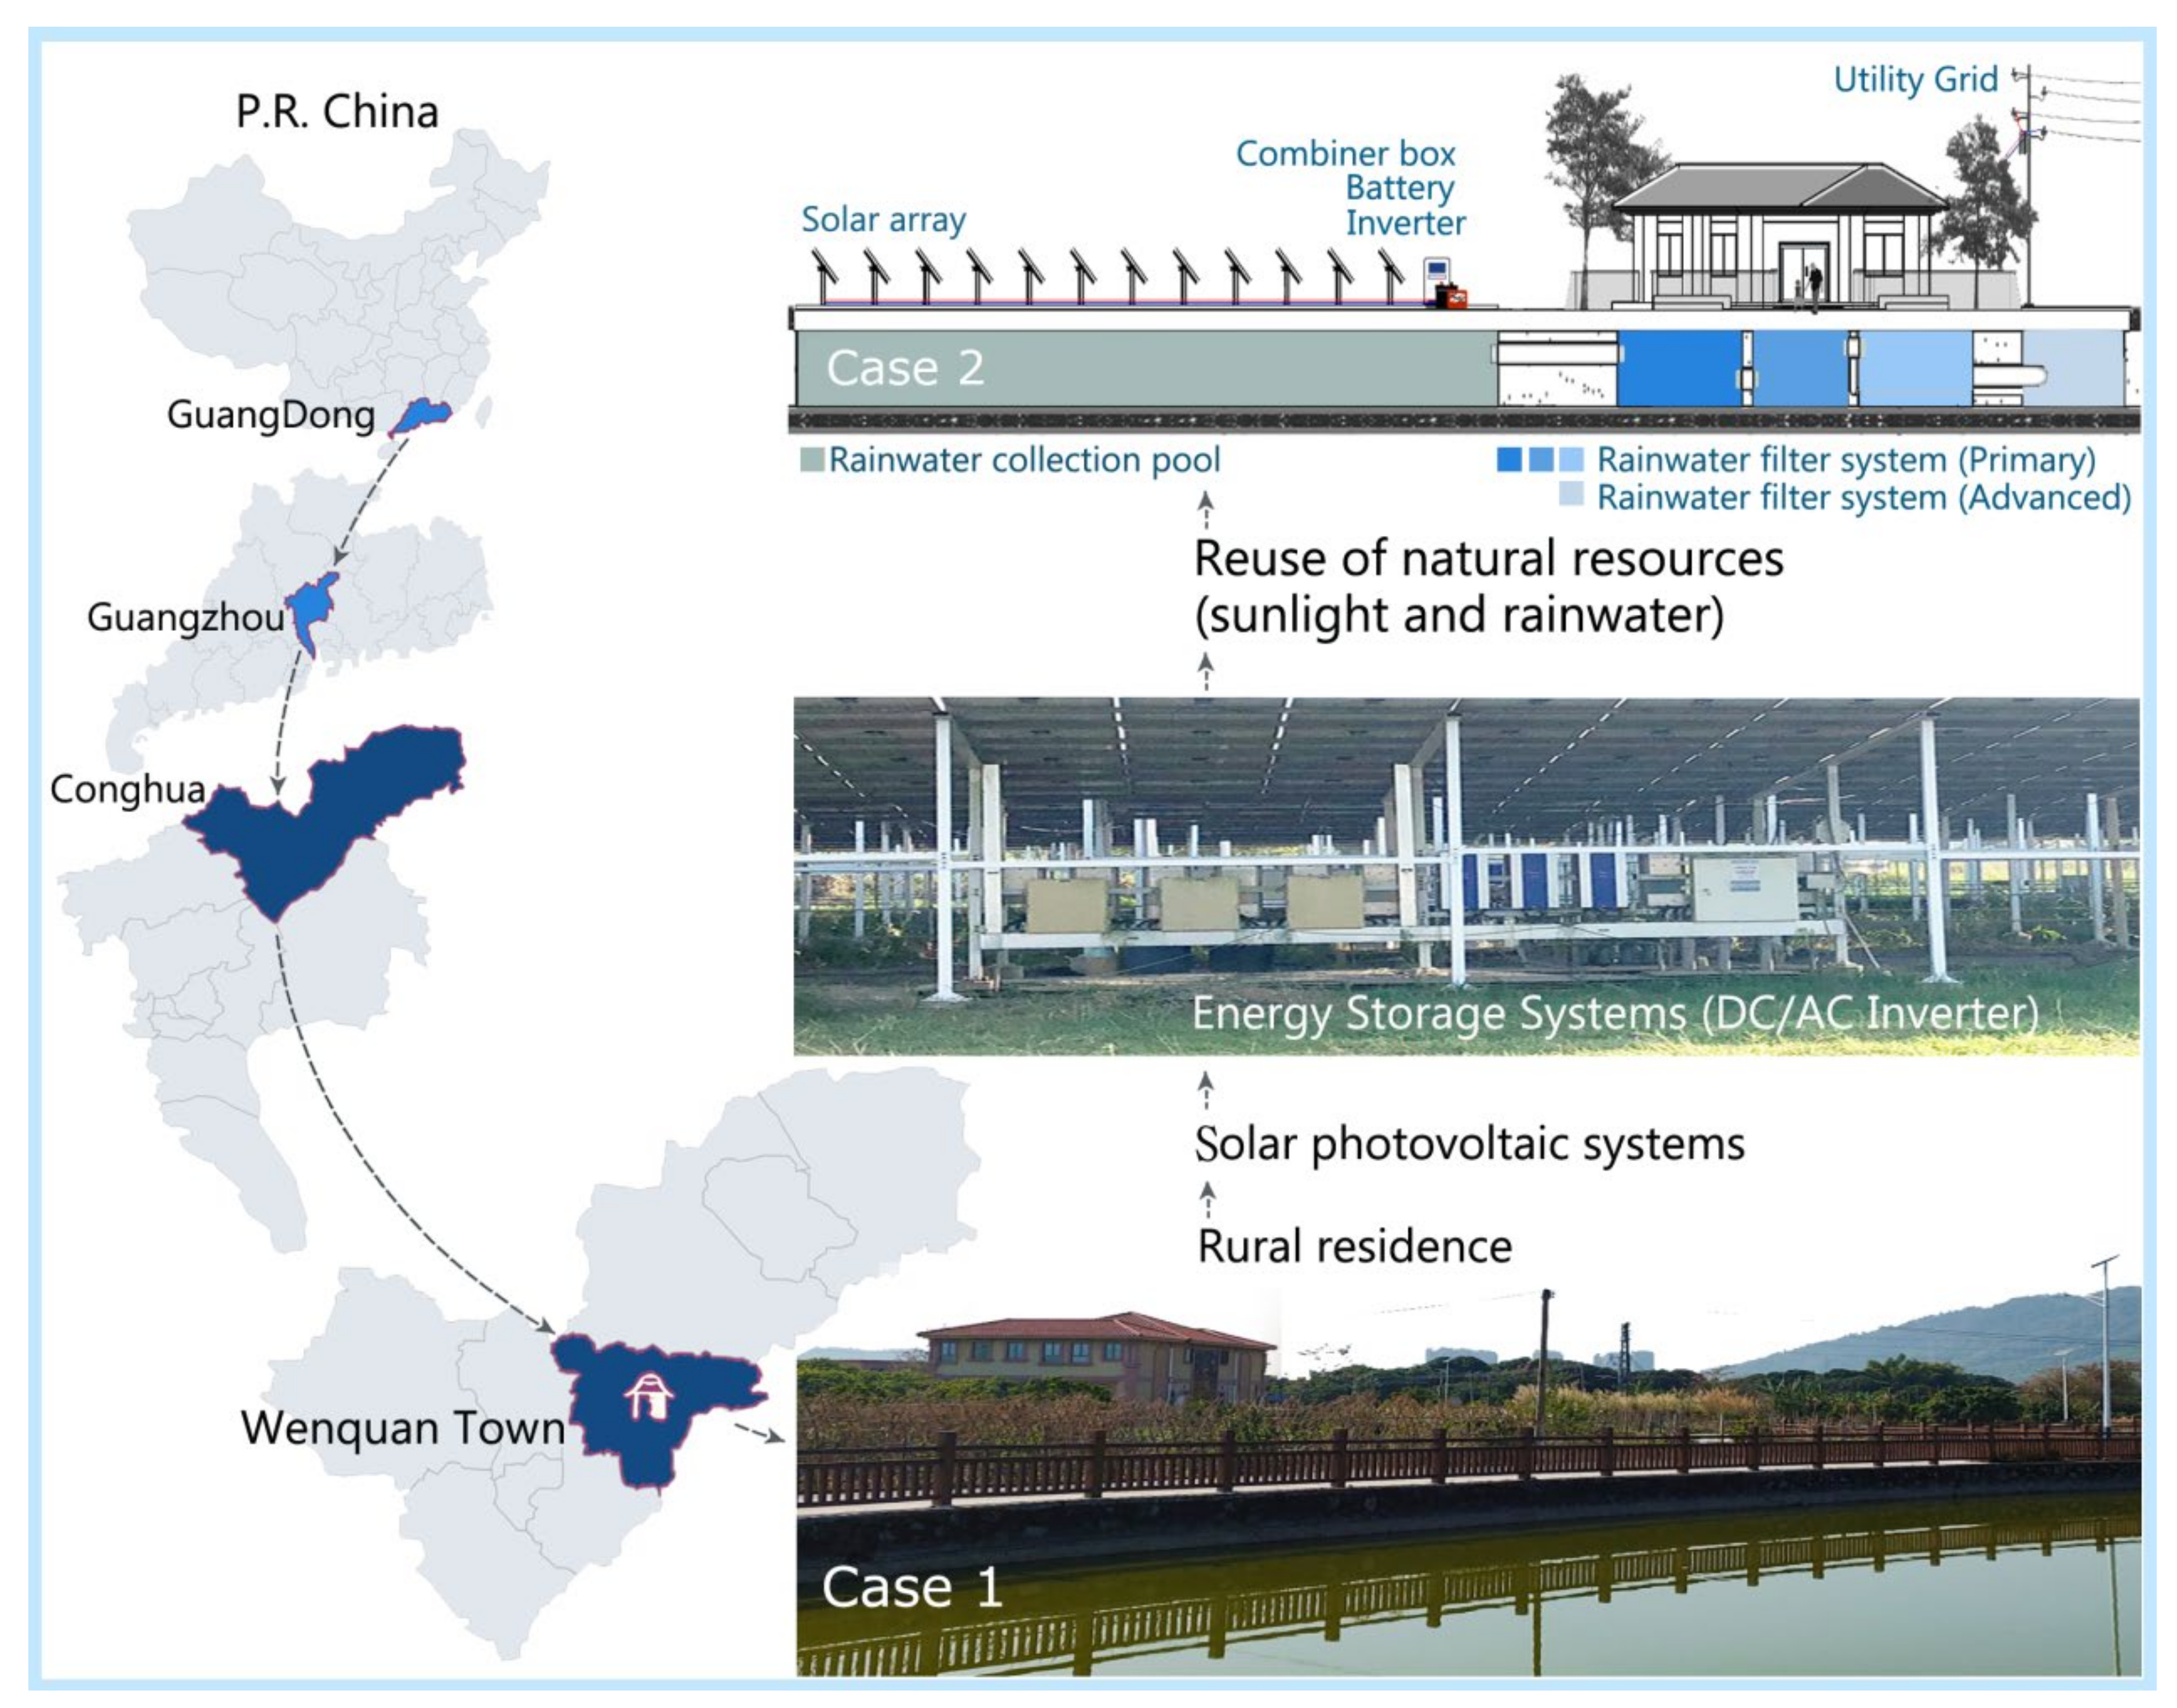
2.1. Wenquan, Guangdong Province
- (1)
- Latitude and longitude: latitude 113.55, longitude 23.57;
- (2)
- Area: total area of Guangzhou City: 7434 km2; Conghua District is its largest district, accounting for 1974.5 km2;
- (3)
- Population: the total population of Guangzhou City is approximately 14,904,400. Conghua District has the lowest permanent population in Guangzhou City, accounting for 647,100 residents, and has an urbanization ratio of 45.08% [26];
- (4)
- Average annual rainfall: the average annual rainfall of Wenquan is 1652.5 mm [27];
- (5)
- Average annual sunshine hours: 1690.2 h [28];
- (6)
- Registered rural households: 105,700 households [29].
2.2. Summary of Energy Consumption by Buildings and Residences in China
2.3. Sustainable Resource Use Subsidies for Rural Residential Buildings and Regional Energy Development
2.4. Compilation of Initial Criteria
- (1)
- Public policy design: reduce CO2 emissions (pollution prevention), environmental governance, energy consumption characteristics, subsidy budgeting, implementation benefits;
- (2)
- Solar electricity: rooftop solar energy generators, solar photovoltaic systems, solar home systems (maintenance and transaction);
- (3)
- Rainwater collection: rainwater tanks, rainwater collection pool, building rainwater harvesting, rainwater collection system, green stormwater infrastructure;
- (4)
- Public attitude (Public demand): public participation, environmental awareness (pro-environmental), subsidy method, subsidy amount.
2.5. Multi-Attribute Decision-Making Artificial Intelligence Model: Delphi Fuzzy–Delphi Analytic Hierarchy Process Model
3. Overview of the Delphi Fuzzy–Delphi Analytic Hierarchy Process
3.1. Summary of Delphi, Fuzzy Logic, and AHP Methods
- (1)
- A set with three elements (tall, standard, and short) measured in meters.
- (2)
- A set with five elements (very heavy, heavy, normal, light, and very light) measured in kilograms.
3.2. DFuzzy Model Development
3.2.1. Validating Criteria for Model Development
- (1)
- Participation situation: pro-environmental, pattern of subsidies, ratio of subsidy;
- (2)
- Generating capacity: solar home systems, solar photovoltaic parks (solar PV parks), carbon trading;
- (3)
- Storage facilities: private rainwater collection pool (private RWC pool), public rainwater collection pool (public RWC pool), green rainwater infrastructure (GRW infrastructure).
3.2.2. DFuzzy Model Parameter Definitions and Overview of the Fuzzy Logic Inference System Simulation Algorithm
- (1)
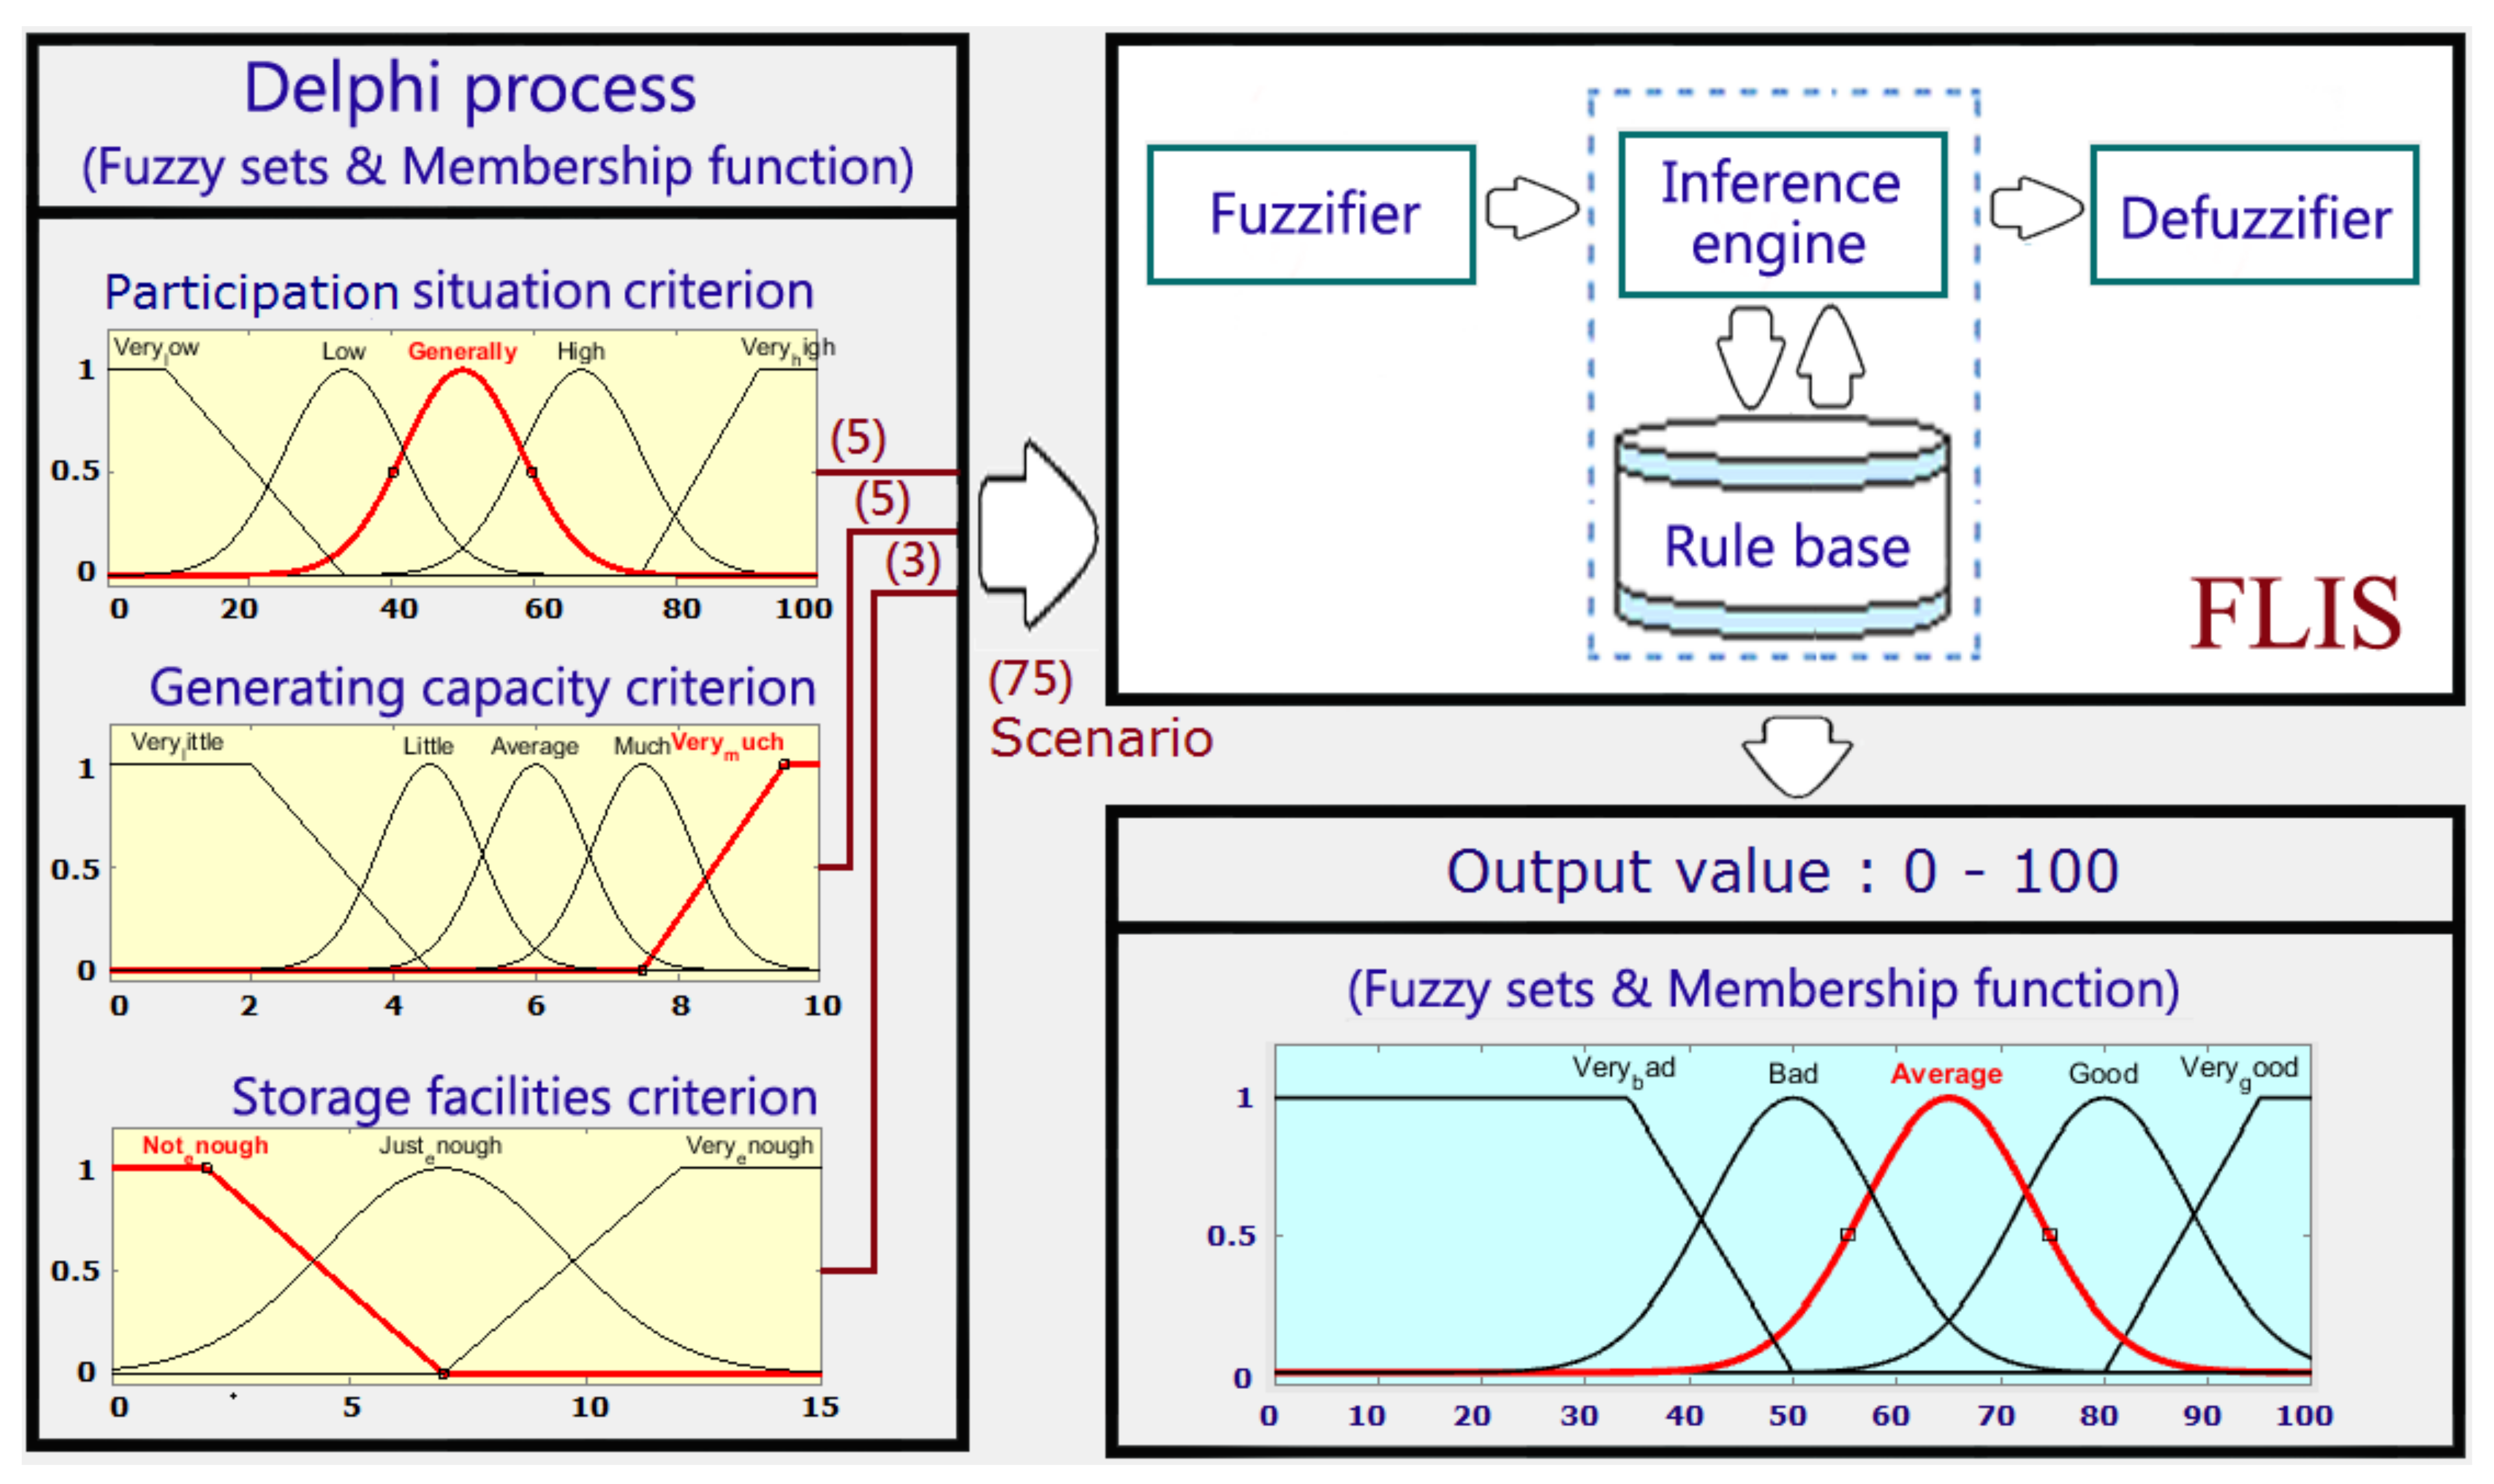
- Input scenario: The DFuzzy model established by this study can differentiate between 75 types of assessment input data and process input data with imprecise and unclear adjectives. For example, for the variable “participation situation,” the scale items “very high, high, generally, low, very low” can serve as precise quantified values or as a hybrid between quantified and qualified input;
- (2)
- Fuzzifier: After inputting scenarios into the FLIS, the data are processed by the Fuzzifier;
- (3)
- Inference engine: After Fuzzifier processing, the processed scenarios are input into the IF-THEN rule base through the inference engine for attribute comparison;
- (4)
- Defuzzifier: After the inference engine completes the rule base comparison, the Defuzzifier process is conducted to establish the corresponding quantified output value for each input scenario.
3.3. DAHP Model Development
- (1)
- Using the Delphi process, criteria which experts reached a consensus on were obtained to design the AHP questionnaire;
- (2)
- The AHP paired comparison questionnaire was sent out (or an interview was conducted using it);
- (3)
- AHP consistency verification criteria: (a) the Consistency Index (C.I.) had to be ≤0.1 to satisfy the tolerance deviation value for verification; (b) the Consistency Ratio (C.R.) had to be ≤0.1 (C.R. = C.I./R.I.). The AHP-paired comparison questionnaire had to fulfill these criteria to be viewed as providing effective investigation data. R.I. refers to random index and was obtained from a random index table;
- (4)
- The questionnaires were retrieved and compiled. Questionnaire data that did not conform to AHP-consistent verification were excluded;
- (5)
- The paired comparison matrix (dual matrix) for assessment factors were established to compute the relative weight of each assessment factor, which served as a reference for decision-making assessment and application.
3.4. DFAHP Model Development and Application
- (1)
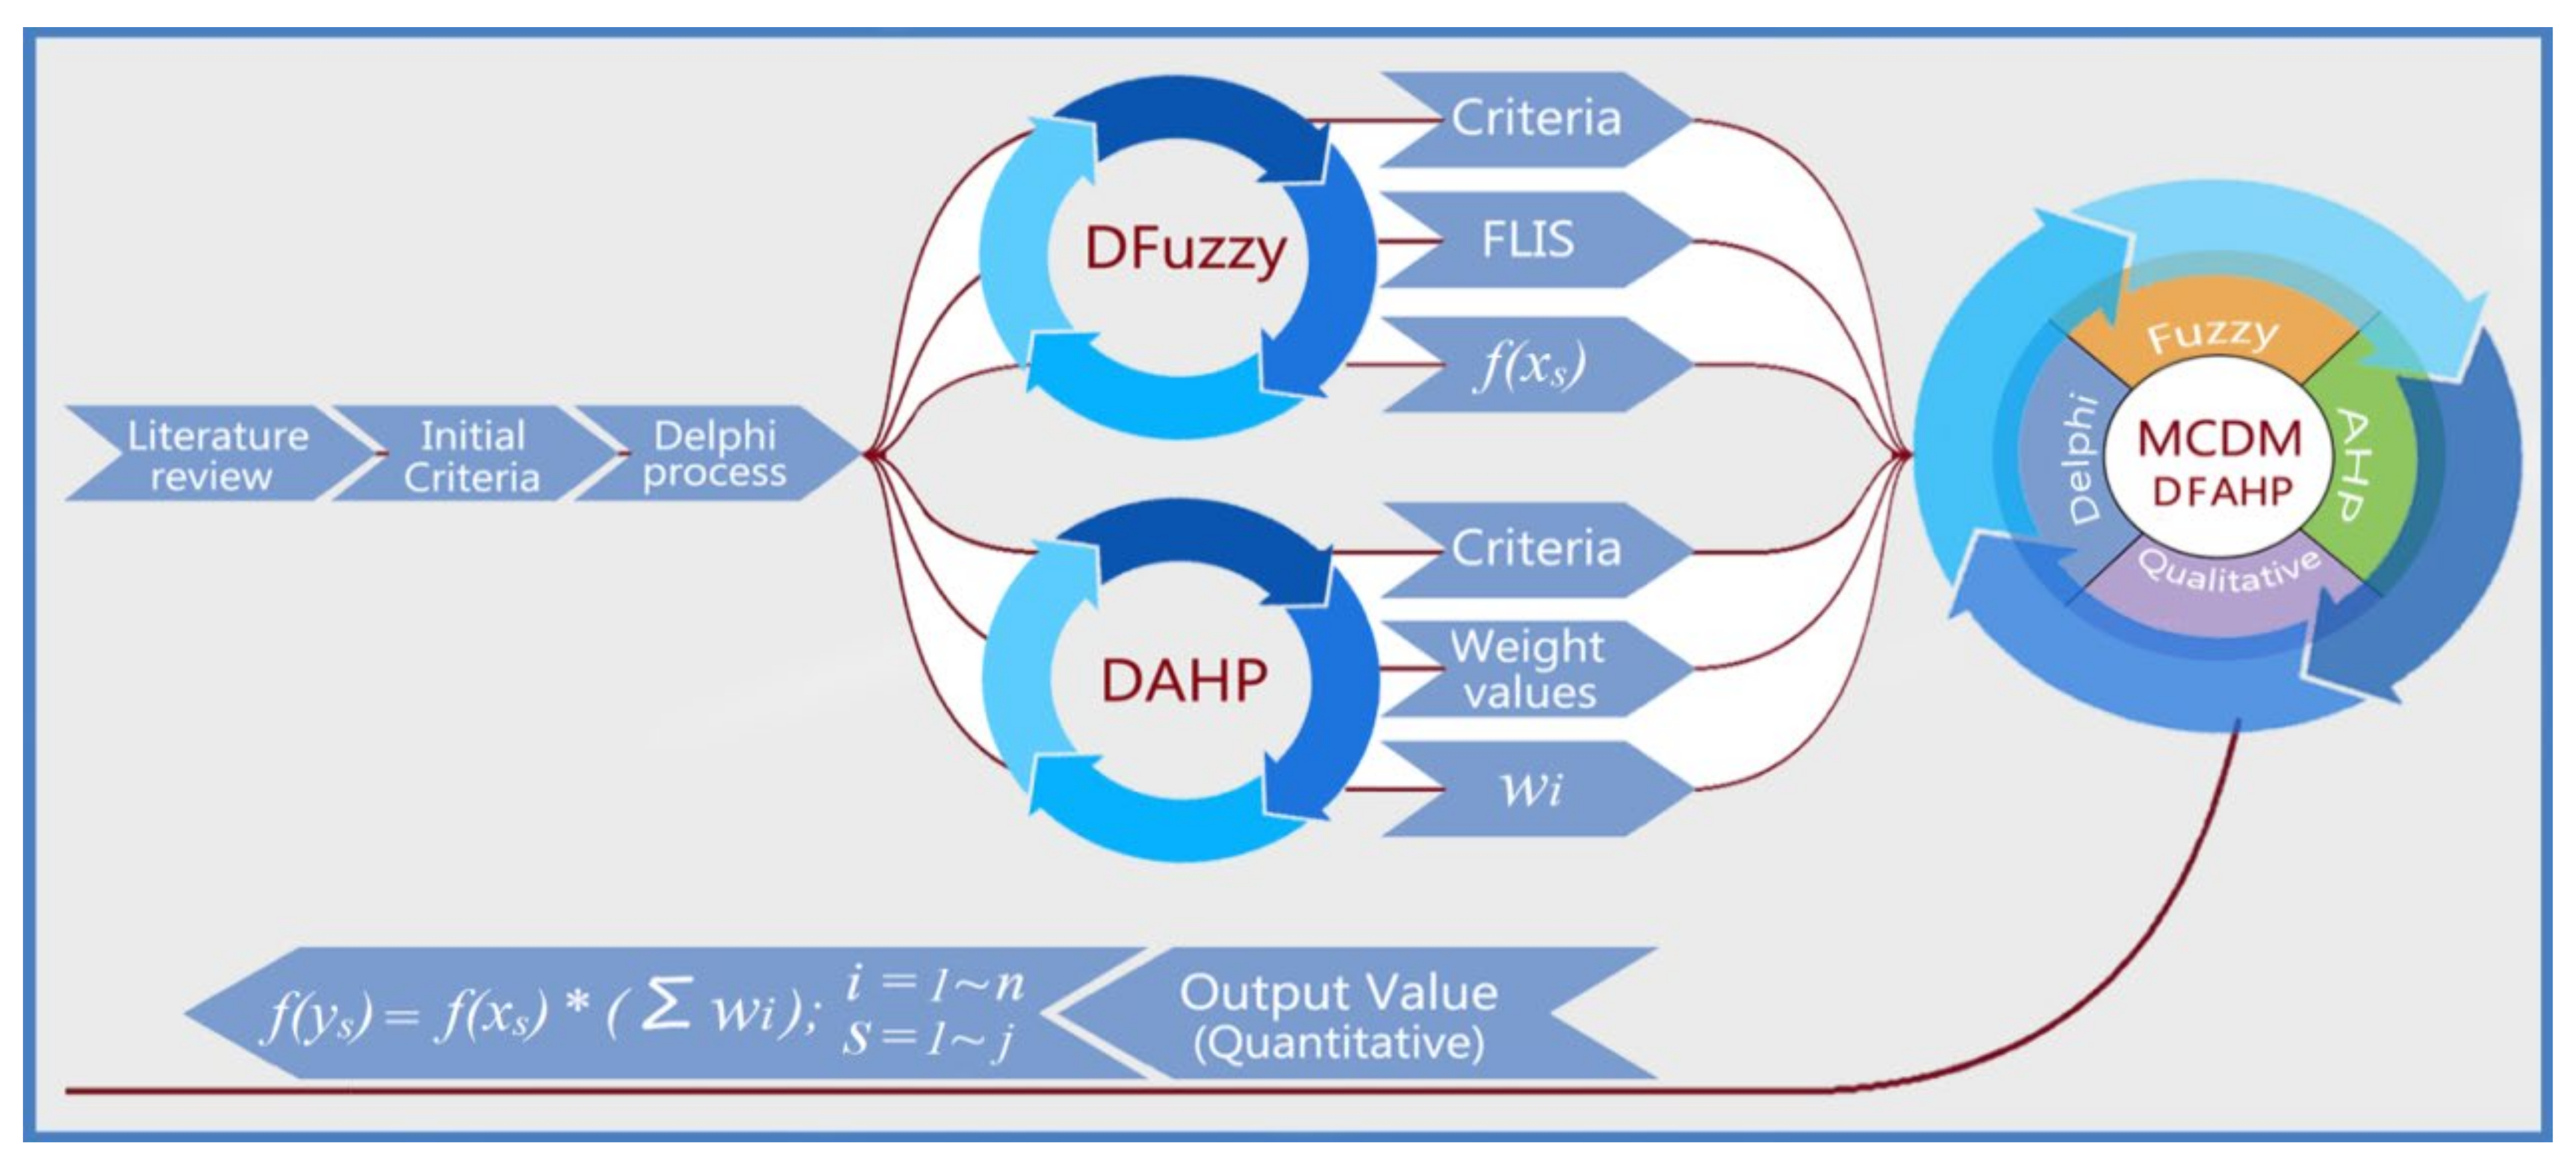
- Development: The DFAHP model was developed by combining the features of the Delphi model (e.g., criteria confirmed suitable for model development by experts), the DFuzzy model (e.g., fuzzy sets, fuzzy scale, suitable membership functions, and the rule base), and the DAHP model (e.g., AHP hierarchy, criteria weights, and computation protocols). The purpose of the DFAHP model was to provide a convenient decision-making analysis;
- (2)
- Application: First, the Delphi–Fuzzy process was employed to analyze practical cases; the assessment combination was confirmed and inputted into the FLIS to acquire a quantitative output algorithm. Subsequently, the Delphi–AHP process was conducted to complete AHP questionnaires and to compute the relative weight of each criterion. Finally, the DFAHP model was applied to compute the quantified assessment value of each criterion: f(ys) = f(xs) × (Σ ωi). The results were to be used as a judgment factor and a reference for decision making.
4. Case Study
4.1. Summary of Case 1 and Case 2
- (1)
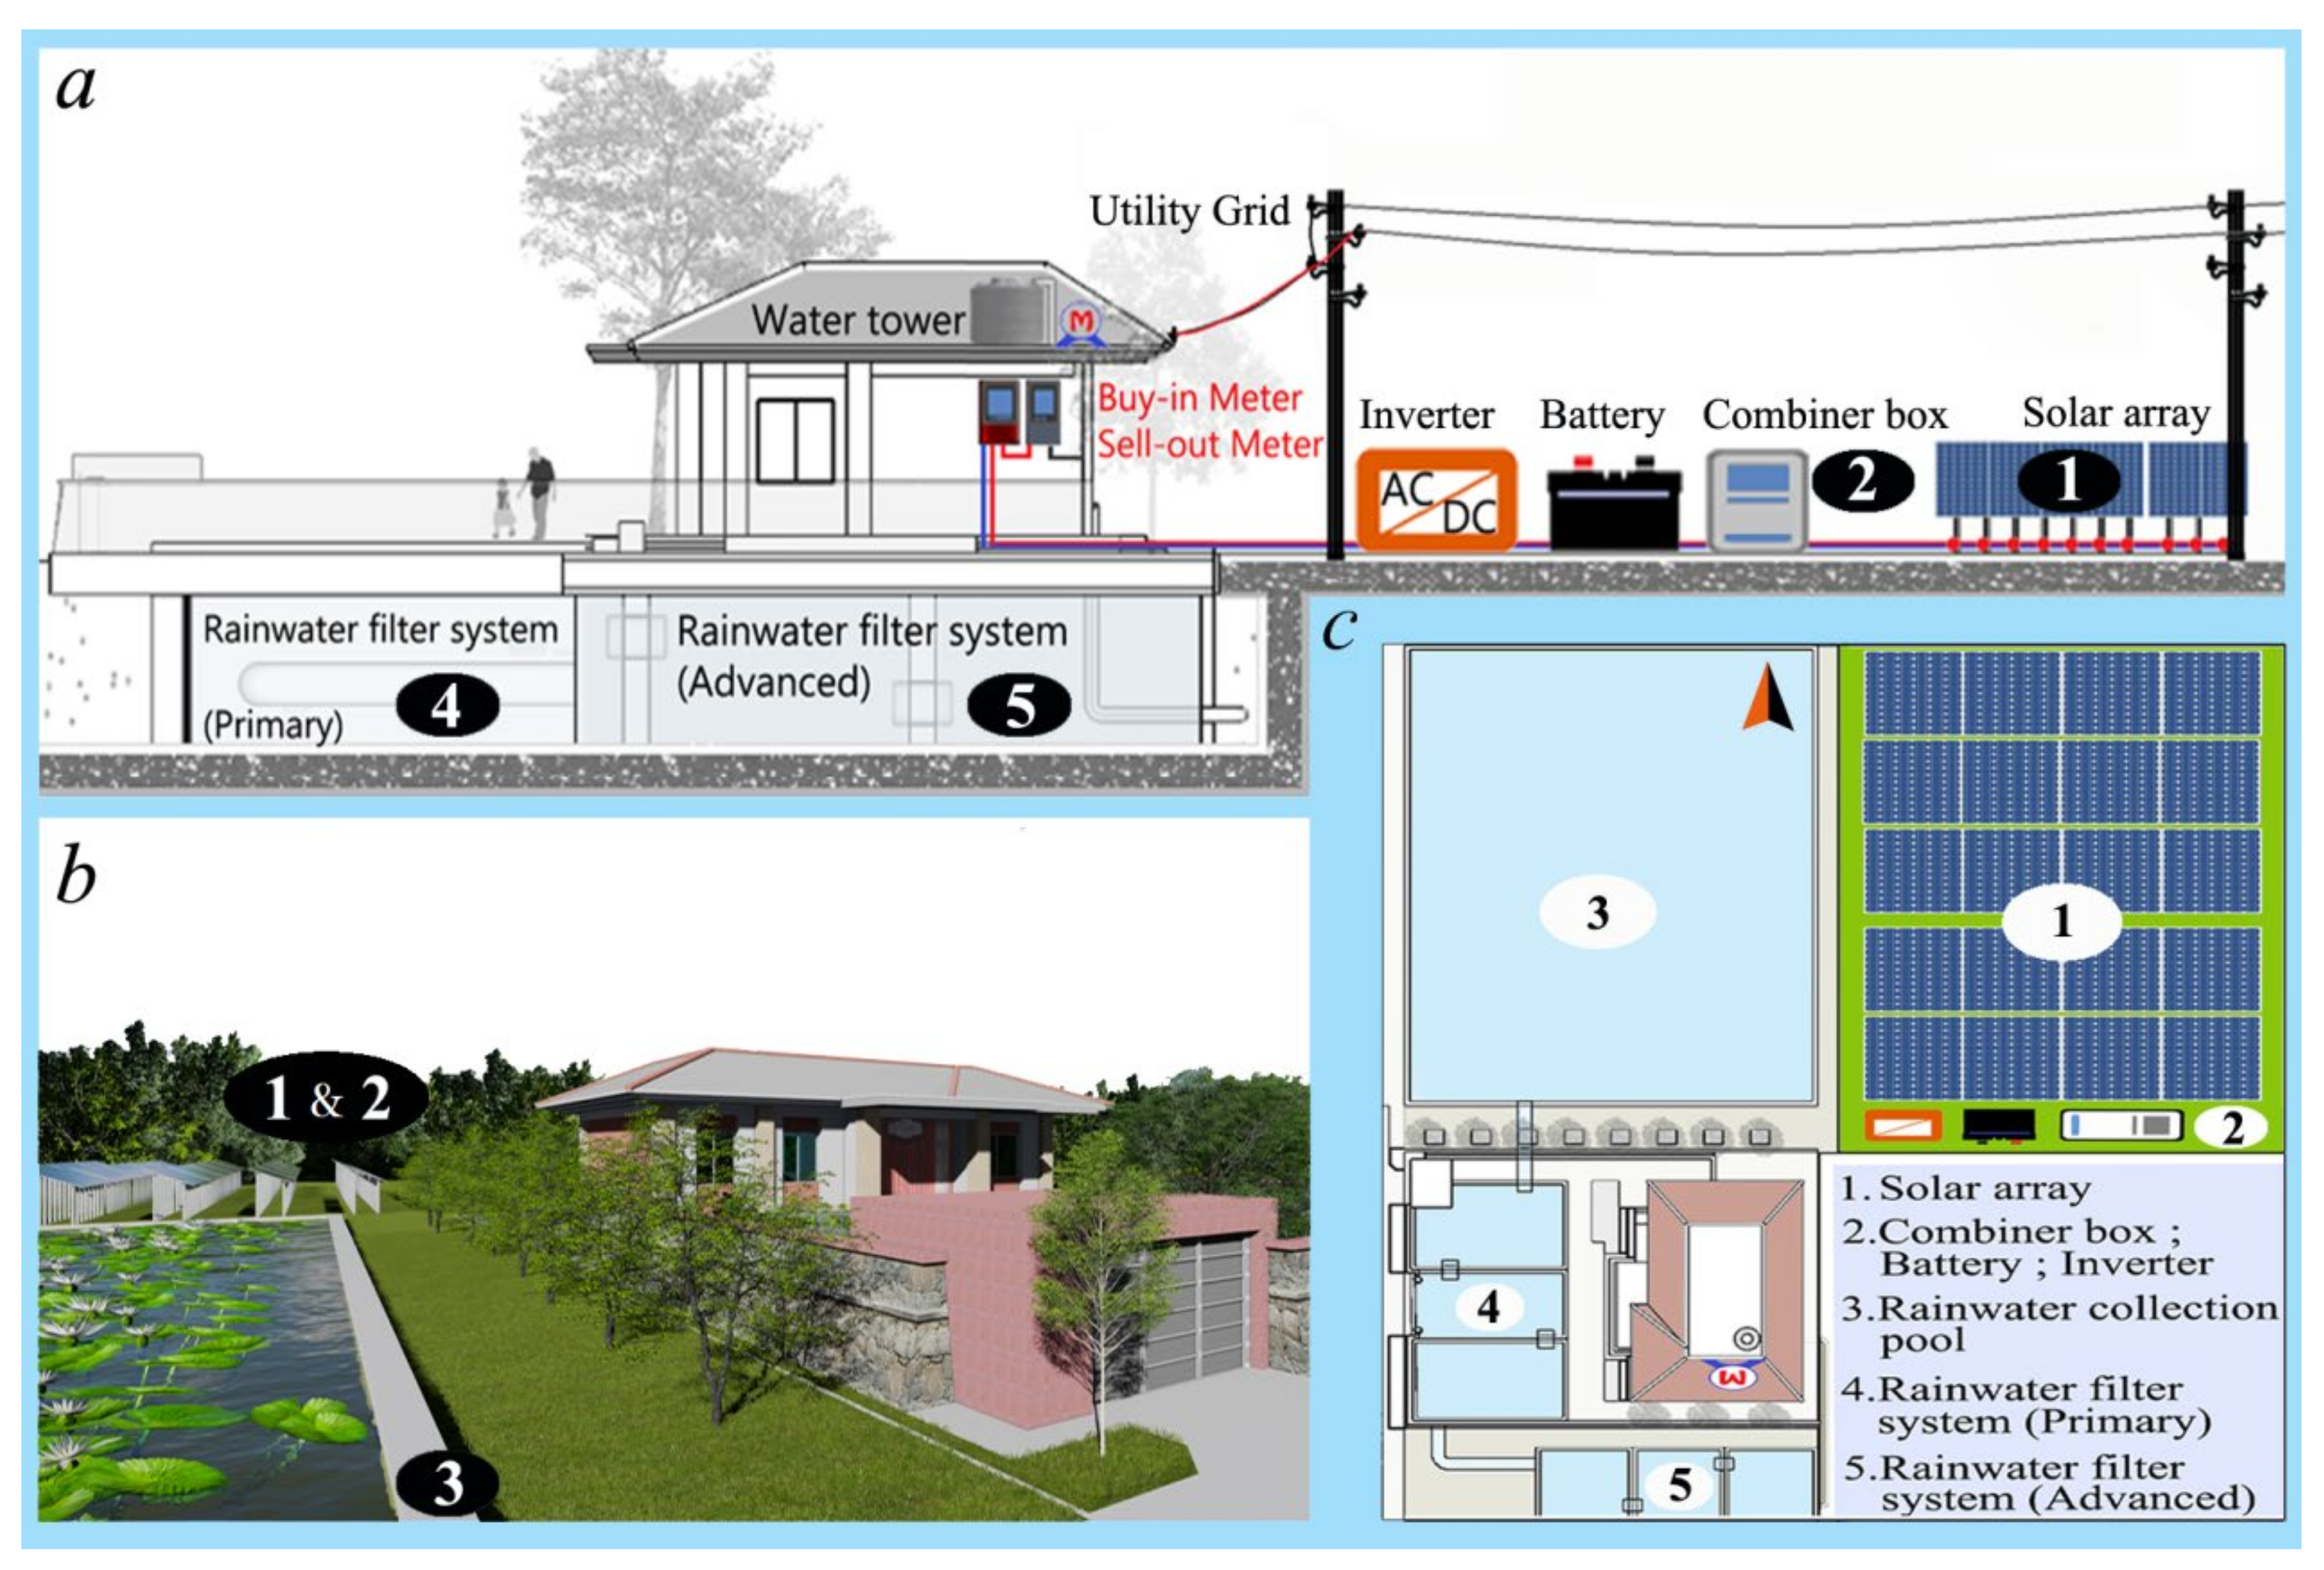
- The total area for the solar home system was 660 m2. Each 10 m2 contained solar panels generating 1 kW. After excluding 60 m2 of the area for facility requirements, the 660 m2 area generated 60 kW. The total electricity output of the solar system was computed using the average annual sunlight hours (1690.2 h), which approximates 4.63 daily sunlight hours. Based on a 65% sunshine efficiency, the daily output of the system was approximately 60 kW × (4.63 h/day × 65%) = 180.6 kWh/day. Therefore, the total monthly output of the system was 5418 kWh/month (180.6 kWh/day × 30 days/month). The average monthly power use of a typical families ranges from 200 to 400 kWh (the range is influenced by seasonal variations). Accordingly, the average monthly surplus energy exceeds 5000 kWh/month. Figure 8c (1) and (2) depict the solar array and relevant equipment.
- (2)
- The total rainwater collection area was approximately 900 m2. The pool depth was 1.8 m. After excluding space for the primary and advanced rainwater filter system and setting the pool depth at 1.5 m for calculation, the effective water storage volume exceeds 1350 m3 (900 m2 × 1.5 m). Figure 8c (3), (4), and (5) depict the infrastructure. On the basis that average water consumption per capita is approximately 250 L, the daily and monthly water consumption of a family of three is 750 L and 22,500 L (22.5 metric tons), respectively. This amounts to an annual water consumption of 270 m3. The average annual rainfall of coastal regions in southern China is 1652.5 mm, which does not include the abundant rainfall brought by unpredicted typhoons. The infrastructure depicted in Figure 8c would reach maximum capacity numerous times each year, with 1000 m3 of surplus rainwater accumulated annually.
4.2. DFAHP Model Quantitative Assessment and Analysis of Cases
- (1)
- Surrounding environment for Case 1 building: The surrounding environment consists of a large public rainwater collection pool, solar water heater, and solar streetlamps. A large area of idle farmland sits next to the residence.
- (2)
- Surrounding environment for the construction simulation of Case 2: The environment consists of a solar home system and rainwater infrastructure installed in an empty space beside the residence in Case 1.
- (3)
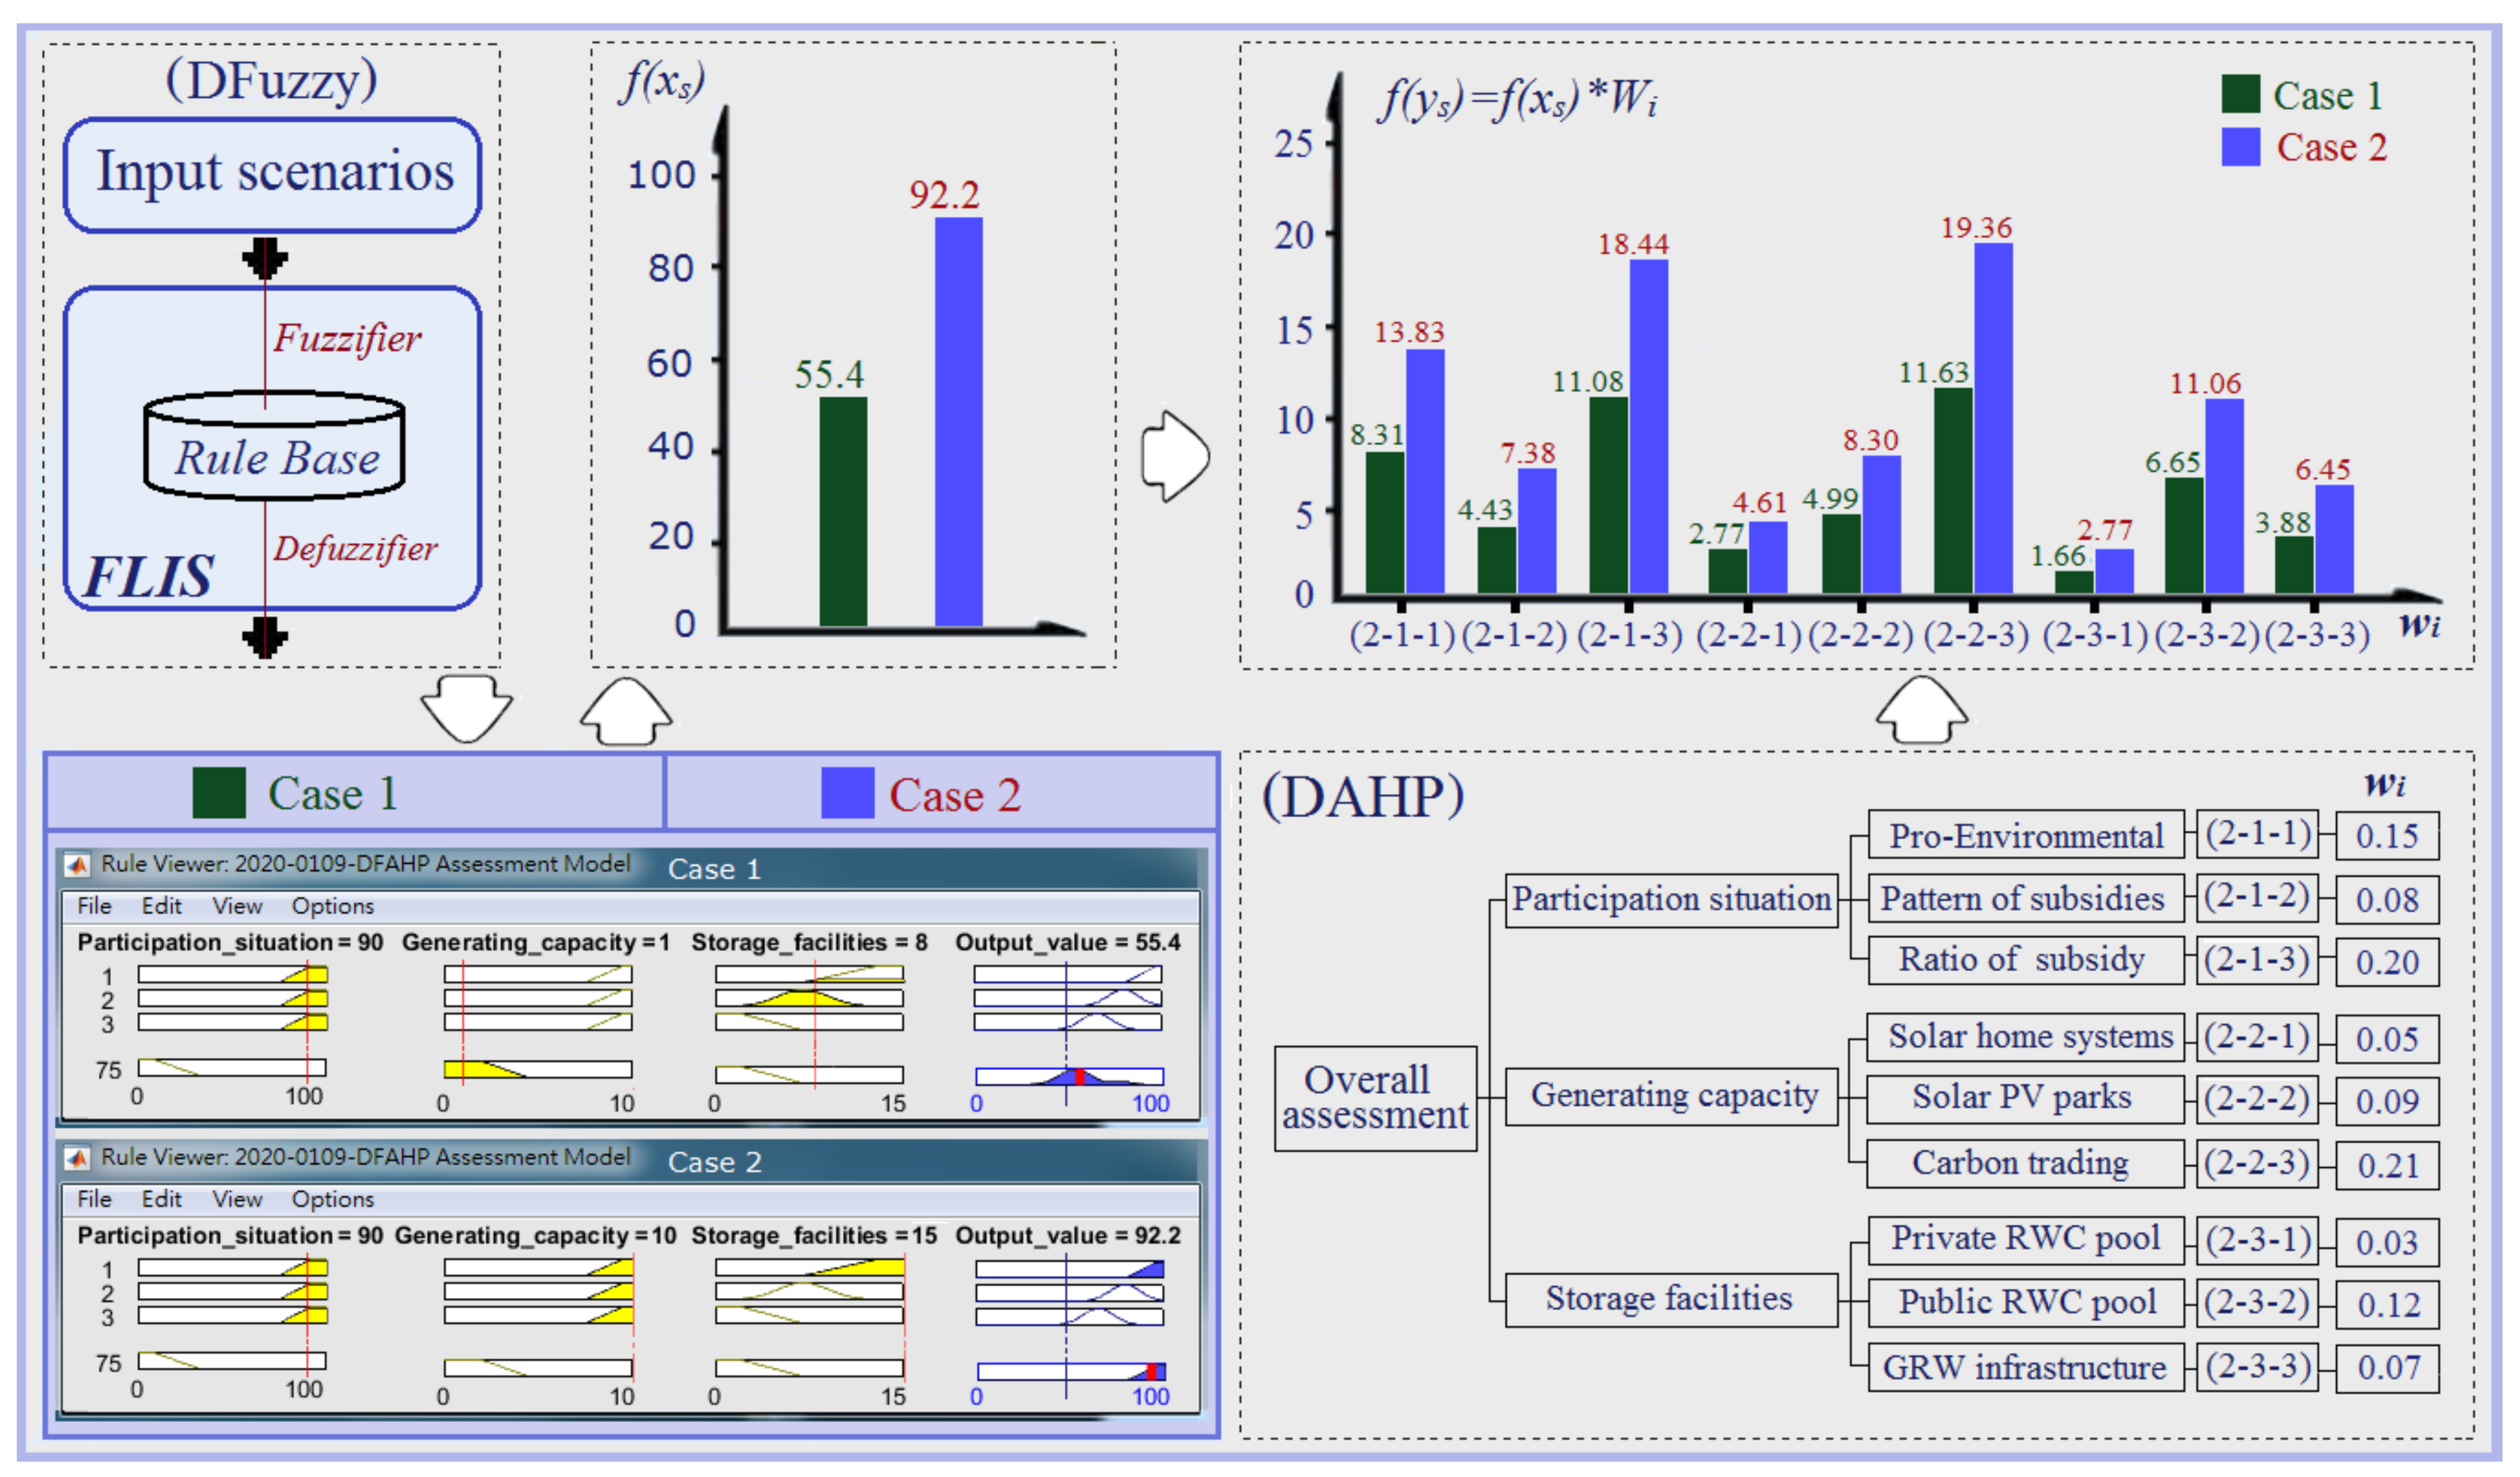
- Using the Delphi process, the assessment combination of Case 1 was set as follows: Participation situation: Very high; Generating capacity: Very little; Storage facilities: Just enough). The assessment combination of Case 2 was set as follows: Participation situation: Very high; Generating capacity: Very much; Storage facilities: Very enough).
- (4)
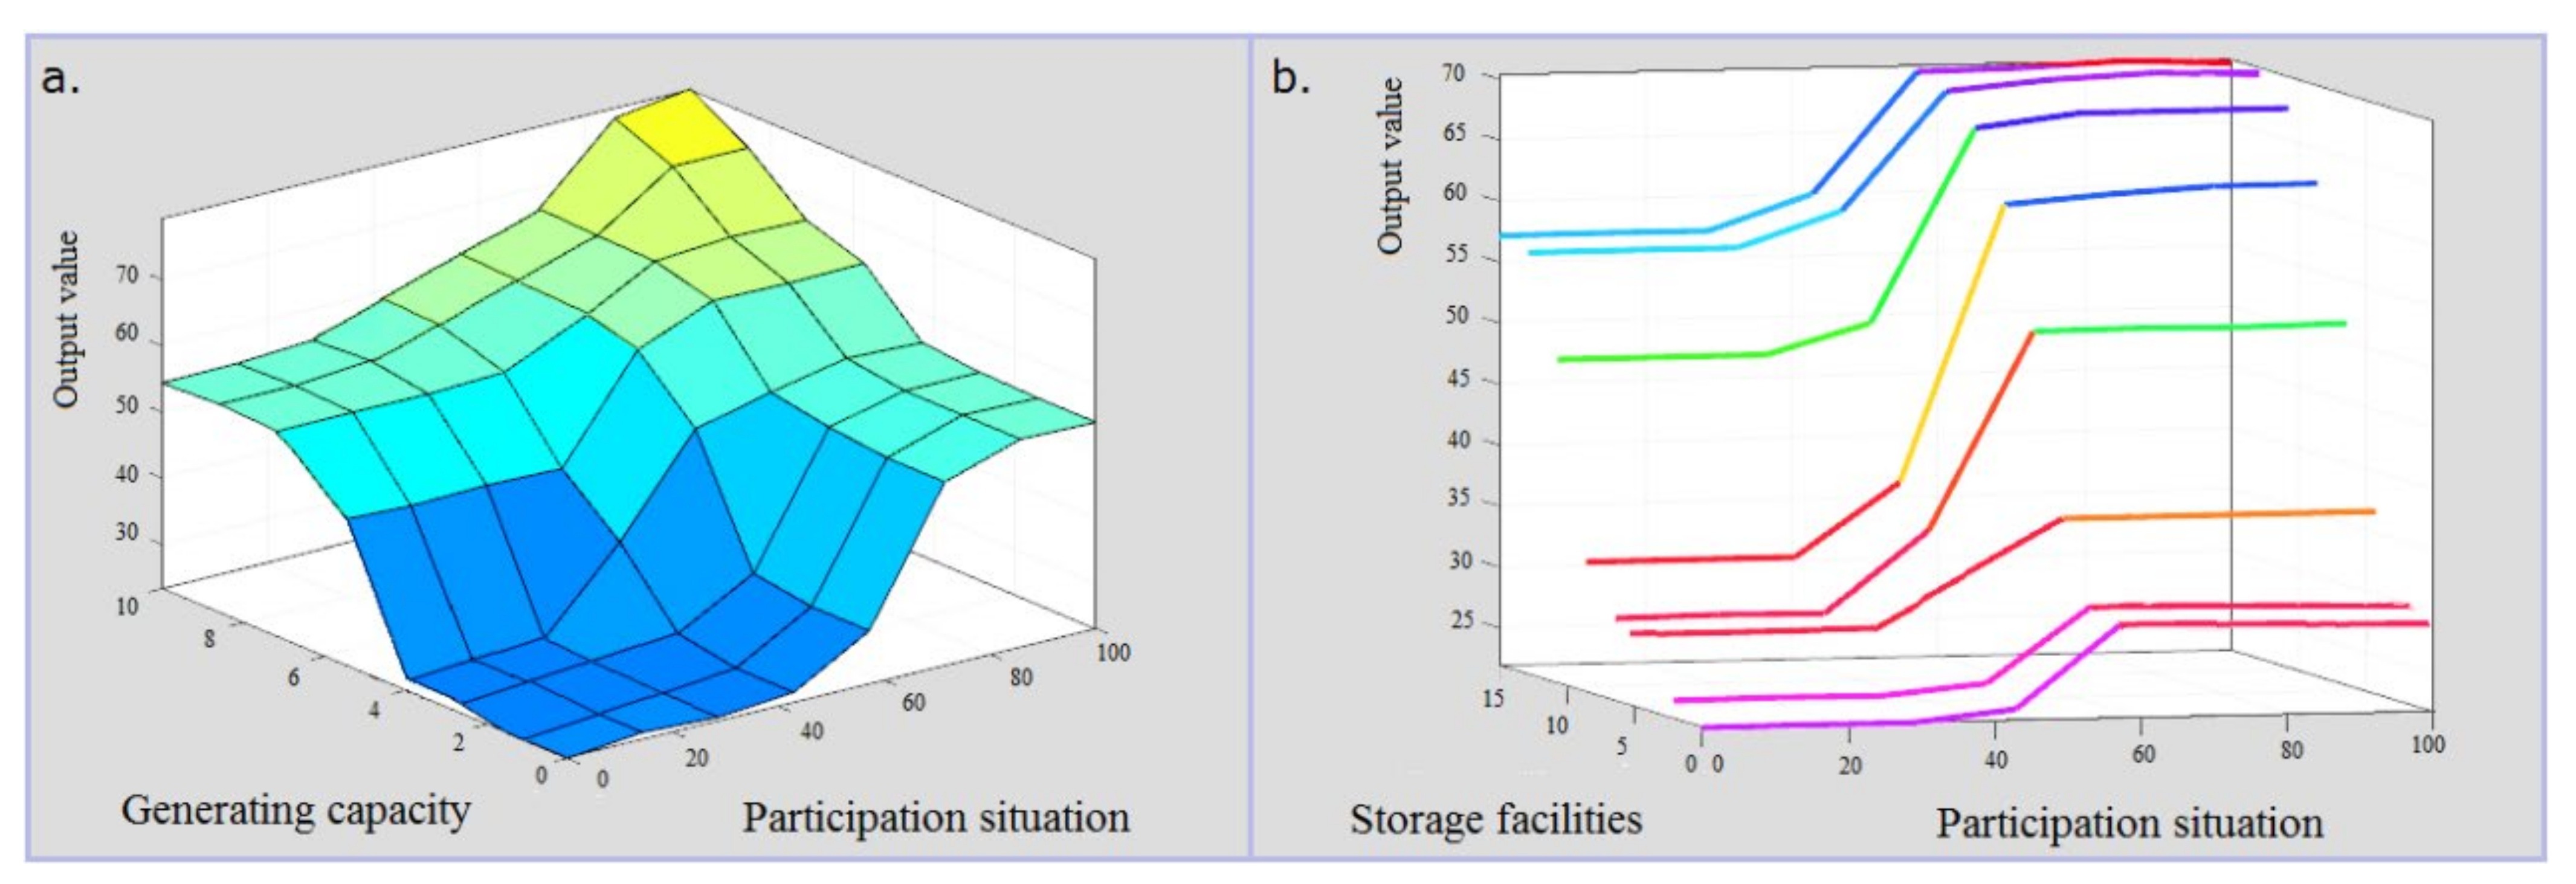
- In the DFAHP model, the overall assessment of the quantified output values of Case 1 and Case 2 were computed using f(xs). Subsequently, f(ys) = f(xs) × Wi was computed to obtain the value relationship of each criterion (Table 10).
- (5)
- Figure 9 displays a comparison of the overall assessments of the quantified output values of the cases.
| Criteria | Scenarios f(xs) | Wi | f(ys) = f(xs) × Wi | |||
|---|---|---|---|---|---|---|
| Case 1 | Case 2 | Case 1 | Case 2 | |||
| Participation situation | Very high | Very high | (2-1-1) | 0.15 | 8.31 | 13.83 |
| (2-1-2) | 0.08 | 4.43 | 7.38 | |||
| (2-1-3) | 0.20 | 11.08 | 18.44 | |||
| Generating capacity | Very little | Very much | (2-2-1) | 0.05 | 2.77 | 4.61 |
| (2-2-2) | 0.09 | 4.99 | 8.30 | |||
| (2-2-3) | 0.21 | 11.63 | 19.36 | |||
| Storage facilities | Just enough | Very enough | (2-3-1) | 0.03 | 1.66 | 2.77 |
| (2-3-2) | 0.12 | 6.65 | 11.06 | |||
| (2-3-3) | 0.07 | 3.88 | 6.45 | |||
| Output value | 55.4 | 92.2 | Total | 1.00 | 55.4 | 92.2 |
5. Conclusions and Suggestions
- (1)
- The model comprises easy-to-understand and easy-to-accept scientific computation functions. It has high degrees of objectivity, fairness, and adaptivity.
- (2)
- According to the case study, every rural household can generate 5000 kWh of surplus electricity monthly and over 1000 m3 of surplus rainwater for distribution. Accordingly, Guangdong Province, which has approximately 105,700 rural households, can generate a considerable amount of regional energy.
- (3)
- The transparency of the model encourages resident participation in public policies, which is conducive to policy implementation.
- (4)
- In addition to serving as a reference for decision making for policy management, the model enables residents to conduct self-evaluations to identify relevant factors that subsidy policies should focus on.
- (1)
- Food crises, a serious concern, has garnered attention from countries around the world and prompted them to strictly monitor land use and stipulate that specific land be used for agriculture. Consequentially, holders of smaller properties and rural residents who do not possess farming capabilities generally rent or retire farmland; thus, these strict regulations have resulted in farmland losing its diverse use value.
- (2)
- Existing studies have focused on sustainable development for urban areas. Sustainable development in spacious rural areas, despite being a field worthy of discussion, is often ignored.
- (3)
- Water and electricity are key factors for crops. In addition, water resources and electricity generation are crucial sustainable energy topics that have garnered global attention. The model proposed in this study can provide positive, practical contributions to energy conservation and carbon emissions throughout the world, enable the flexible use of retired and idle farmland, and promote the implementation of low-carbon lifestyles to develop characteristic rural towns.
- (4)
- Wenquan Township, which is situated on mountainous terrain, receives abundant sunshine and has rich water resources. The region is a prosperous rural area; therefore, it contains idle farmland. Policy goals in Wenquan focus on the development of cultural, tourism, ecological, and agricultural industries. Wenquan is a national-level characteristic township that emphasizes ecological characteristics. Policies that allow for the flexible use of farmland and reward sustainable energy development are conducive to the characteristic development of this ecological township.
- (5)
- The AI-MCDM model established in this study can serve as a reference for formulating new polices and provide support in decision making.
Author Contributions
Funding
Institutional Review Board Statement
Informed Consent Statement
Data Availability Statement
Conflicts of Interest
References
- Hsueh, S.L. Assessing the effectiveness of community-promoted environmental protection policy by using a Delphi-fuzzy method: A case study on solar power and plain afforestation in Taiwan. Renew. Sustain. Energy Rev. 2015, 49, 1286–1295. [Google Scholar] [CrossRef] [Green Version]
- Hsueh, S.L.; Liu, J.; Lin, C. Influence of Environmental Atmosphere on Tourists’ Perceived Value and Willingness to Revisit. J. Environ. Prot. Ecol. 2019, 20 (Special A), 84–91. [Google Scholar]
- IPCC. Special Report: Global Warming of 1.5 °C. IPCC. 2019. Available online: http://www.ipcc.ch/report/sr15/ (accessed on 22 September 2021).
- Leng, G. Keeping global warming within 1.5 °C reduces future risk of yield loss in the United States: A probabilistic modeling approach. Sci. Total Environ. 2018, 644, 52–59. [Google Scholar] [CrossRef] [PubMed]
- Xiao, X.J.; Jiang, K.J. China’s nuclear power under the global 1.5 °C target: Preliminary feasibility study and prospects. Adv. Clim. Chang. Res. 2018, 9, 138–143. [Google Scholar] [CrossRef]
- Lwasa, S.; Buyana, K.; Kasaija, P.; Mutyaba, J. Scenarios for adaptation and mitigation in urban Africa under 1.5 °C global warming. Curr. Opin. Environ. Sustain. 2018, 30, 52–58. [Google Scholar] [CrossRef]
- Gaupp, F.; Hall, J.; Mitchell, D.; Dadson, S. Increasing risks of multiple breadbasket failure under 1.5 and 2 °C global warming. Agric. Syst. 2019, 175, 34–45. [Google Scholar] [CrossRef] [Green Version]
- Singh, R.; Kumar, R. Climate versus demographic controls on water availability across India at 1.5 °C, 2.0 °C and 3.0 °C global warming levels. Glob. Planet. Chang. 2019, 177, 1–9. [Google Scholar] [CrossRef]
- Ma, X.; Zhao, C.; Tao, H.; Zhu, J.; Kundzewicz, Z.W. Projections of actual evapotranspiration under the 1.5 °C and 2.0 °C global warming scenarios in sandy areas in northern China. Sci. Total Environ. 2018, 645, 1496–1508. [Google Scholar] [CrossRef] [PubMed]
- Gao, B.; Ju, X.; Meng, Q.; Cui, Z.; Christie, P.; Chen, X.; Zhang, F. The impact of alternative cropping systems on global warming potential, grain yield and groundwater use. Agric. Ecosyst. Environ. 2015, 203, 46–54. [Google Scholar] [CrossRef]
- Carvalho, K.S.; Wang, S. Characterizing the Indian Ocean sea level changes and potential coastal flooding impacts under global warming. J. Hydrol. 2019, 569, 373–386. [Google Scholar] [CrossRef]
- Carlson, A.E.; Dutton, A.; Long, A.J.; Milne, G.A. PALeo constraints on SEA level rise (PALSEA): Ice-sheet and sea-level responses to past climate warming. Quat. Sci. Rev. 2019, 212, 28–32. [Google Scholar] [CrossRef] [Green Version]
- Koutroulis, A.G. Dryland changes under different levels of global warming. Sci. Total Environ. 2019, 655, 482–511. [Google Scholar] [CrossRef]
- Prăvălie, R. Major perturbations in the Earth’s forest ecosystems. Possible implications for global warming. Earth Sci. Rev. 2018, 185, 544–571. [Google Scholar] [CrossRef]
- Silva, P.S.; Bastos, A.; Libonati, R.; Rodrigues, J.A.; DaCamara, C.C. Impacts of the 1.5 °C global warming target on future burned area in the Brazilian Cerrado. Forest Ecol. Manag. 2019, 446, 193–203. [Google Scholar] [CrossRef]
- Wu, F.; Geng, Y.; Tian, X.; Zhong, S.; Wu, W.; Yu, S.; Xiao, S. Responding climate change: A bibliometric review on urban environmental governance. J. Clean. Prod. 2018, 204, 344–354. [Google Scholar] [CrossRef]
- Han, G.G.; Liu, X.Y.; Song, L.; Han, Z.Y.; Su, Y.; Du, X.Y.; Tsai, M. Estimation of carbon dioxide emissions in China by 2030. Elect. Power Technol. Environ. Protect. 2013, 29, 1–3. [Google Scholar]
- Baike, Baidu, 2018 21st Conference of the Parties. 2019. Available online: https://baike.baidu.com/item/%E7%AC%AC21%E5%B1%8A%E8%81%94%E5%90%88%E5%9B%BD%E6%B0%94%E5%80%99%E5%8F%98%E5%8C%96%E5%A4%A7%E4%BC%9A/18862811?fromtitle=%E5%B7%B4%E9%BB%8E%E6%B0%94%E5%80%99%E5%8F%98%E5%8C%96%E5%A4%A7%E4%BC%9A&fromid=18895877&fr=aladdin (accessed on 22 September 2021).
- China Network Television. 2019 Climate Change Conference President: China Has a Key Effect on Climate Change. 2019. Available online: http://big5.taiwan.cn/xwzx/PoliticsNews/201912/t20191205_12223265.htm (accessed on 22 September 2021).
- Zhang, C.; Cui, C.; Zhang, Y.; Yuan, J.; Luo, Y.; Gang, W. A review of renewable energy assessment methods in green building and green neighborhood rating systems. Energy Build. 2019, 195, 68–81. [Google Scholar] [CrossRef]
- Zhu, F.; Zhong, P.; Cao, Q.; Chen, J.; Sun, Y.; Fu, J. A stochastic multi-criteria decision making framework for robust water resources management under uncertainty. J. Hydrol. 2019, 576, 287–298. [Google Scholar] [CrossRef]
- Long, H.; Lin, B.; Ou, Y.; Chen, Q. Spatio-temporal analysis of driving factors of water resources consumption in China. Sci. Total Environ. 2019, 690, 1321–1330. [Google Scholar] [CrossRef]
- Sun, L.; Pan, B.; Gu, A.; Lu, H.; Wang, W. Energy–water nexus analysis in the Beijing–Tianjin–Hebei region: Case of electricity sector. Renew. Sustain. Energy Rev. 2018, 93, 27–34. [Google Scholar] [CrossRef]
- Omer, A.M. Water resources and freshwater ecosystems in Sudan. Renew. Sustain. Energy Rev. 2008, 12, 2066–2091. [Google Scholar] [CrossRef]
- Hsueh, S.L.; Sun, Y.; Yan, M.R. Conceptualization and Development of a DFuzzy Model for Low-Carbon Ecocieies. Sustainability 2019, 11, 5833. [Google Scholar] [CrossRef] [Green Version]
- Conghua Information Website, Population Scale and Distribution of Guangzhou Province in 2018, Guangzhou Statistics Bureau. 2019. Available online: http://kuaibao.qq.com/s/20190218A0SET600?refer=spider (accessed on 22 September 2021).
- Guangzhou Province Conghua People’s Government 2019. Communique of the Third National Agricultural Census (Conghua; First report). 2018. Available online: http://www.conghua.gov.cn/zwgk/sjfb/tjgb/content/post_3166313.html (accessed on 22 September 2021).
- Climate Change Bulletin, 2019. Average sunshine hours in Guangzhou Province. 2019. Available online: http://www.sohu.com/a/291548398_803681 (accessed on 22 September 2021).
- Guangzhou Province Conghua Meteorological Bureau, 2019 White Paper of the Conghua District Meteorological Public Service. 2019. Available online: http://www.conghua.gov.cn/zgch/fwgk/201903/da31e9081f2142d79e2d671d4b6be4da/files/820db1cbe91448908999ec5c94e3bdb9.pd (accessed on 22 September 2021).
- Taniguchi, K. Future changes in precipitation and water resources for Kanto Region in Japan after application of pseudo global warming method and dynamical downscaling. J. Hydrol. Reg. Stud. 2016, 8, 287–303. [Google Scholar] [CrossRef] [Green Version]
- Kojiri, T.; Hamaguchi, T.; Ode, M. Assessment of global warming impacts on water resources and ecology of a river basin in Japan. J. Hydro-Environ. Res. 2008, 1, 164–175. [Google Scholar] [CrossRef]
- Qi, W.; Liu, J.; Leung, F. A framework to quantify impacts of elevated CO2concentration, global warming and leaf area changes on seasonal variations of water resources on a river basin scale. J. Hydrol. 2019, 570, 508–522. [Google Scholar] [CrossRef]
- Morini, E.; Touchaei, A.G.; Rossi, F.; Cotana, F.; Akbari, H. Evaluation of albedo enhancement to mitigate impacts of urban heat island in Rome (Italy) using WRF meteorological model. Urban Clim. 2018, 24, 551–566. [Google Scholar] [CrossRef]
- Filho, W.L.; Icaza, L.E.; Neht, A.; Klavins, M.; Morgan, E.A. Coping with the impacts of urban heat islands. A literature based study on understanding urban heat vulnerability and the need for resilience in cities in a global climate change context. J. Clean. Prod. 2018, 171, 1140–1149. [Google Scholar] [CrossRef] [Green Version]
- Guilbert, D.; Caluwaerts, S.; Calle, K.; Bossche, N.V.D.; Cnudde, V.; De Kock, T. Impact of the urban heat island on freeze-thaw risk of natural stone in the built environment, a case study in Ghent, Belgium. Sci. Total Environ. 2019, 677, 9–18. [Google Scholar] [CrossRef]
- Li, Y.; Liu, Y.; Long, H.; Cui, W. Community-based rural residential land consolidation and allocation can help to revitalize hollowed villages in traditional agricultural areas of China: Evidence from Dancheng County. Henan Province. Land Use Policy 2014, 39, 188–198. [Google Scholar] [CrossRef]
- Langevin, J.; Harris, C.B.; Reyna, J.L. Assessing the Potential to Reduce, U.S. Building CO2 Emissions 80% by 2050. Joule 2019, 3, 2403–2424. [Google Scholar] [CrossRef] [Green Version]
- Sun, L.; Zhou, K.; Yang, S. Regional difference of household electricity consumption: An empirical study of Jiangsu, China. J. Clean. Prod. 2018, 171, 1415–1428. [Google Scholar] [CrossRef]
- An, J.H.; Bae, S.G.; Choi, J.; Lee, M.G.; Oh, H.S.; Yun, D.Y.; Lee, D.-E.; Park, H.S. Sustainable design model for analysis of relationships among building height, CO2 emissions, and cost of core walls in office buildings in Korea. Build. Environ. 2019, 150, 289–296. [Google Scholar] [CrossRef]
- Huang, P.J.; Huang, S.L.; Marcotullio, P.J. Relationships between CO2 emissions and embodied energy in building construction: A historical analysis of Taipei. Build. Environ. 2019, 155, 360–375. [Google Scholar] [CrossRef]
- Bourdeau, M.; Guo, X.; Nefzaoui, E. Buildings energy consumption generation gap: A post-occupancy assessment in a case study of three higher education buildings. Energy Build. 2018, 159, 600–611. [Google Scholar] [CrossRef] [Green Version]
- Ma, H.; Li, C.; Lai, J.; Yang, F.; Li, Z. Investigation on energy consumption of public buildings in Tianjin. Energy Procedia. 2019, 158, 3427–3432. [Google Scholar] [CrossRef]
- Hong, B.; Lin, B.; Qin, H. Numerical investigation on the coupled effects of building-tree arrangements on fine particulate matter (PM2.5) dispersion in housing blocks. Sustain. Cities Soc. 2017, 34, 358–370. [Google Scholar] [CrossRef]
- Martins, N.R.; Graça, G.C. Impact of PM2.5 in indoor urban environments: A review. Sustain. Cities Soc. 2018, 42, 259–275. [Google Scholar] [CrossRef]
- Sajani, S.Z.; Marchesi, S.; Trentini, A.; Bacco, D.; Zigola, C.; Rovelli, S.; Ricciardelli, I.; Maccone, C.; Lauriola, P.; Cavallo, D.M.; et al. Vertical variation of PM2.5 mass and chemical composition, particle size distribution, NO2, and BTEX at a high rise building. Environ. Pollut. 2018, 235, 339–349. [Google Scholar] [CrossRef]
- Building Carbon Rmissions Constitute One-Third of National Carbon Emissions, Increasing Urgency for Green Building Development. 2018. Available online: http://www.tanpaifang.com/lvsejianzhu/201811/0562431.html (accessed on 22 September 2021).
- Ministry of Housing and Urban-Rural Development, 2019 Building Carbon Emission Calculation Standards. 2019. Available online: http://www.zhaojianzhu.com/guojiaguifan/255199.html (accessed on 22 September 2021).
- Chyxx, 2018 Analysis On the Current Condition and Trend of Building Industry Development in China. 2019. Available online: http://www.chyxx.com/industry/201910/799534.html (accessed on 22 September 2021).
- Robinson, C.; Dilkina, B.; Hubbs, J.; Zhang, W.; Guhathakurta, S.; Brown, M.A.; Pendyala, R.M. Machine learning approaches for estimating commercial building energy consumption. Appl. Energ. 2017, 208, 889–904. [Google Scholar] [CrossRef]
- Shazmin, S.A.A.; Sipan, I.; Sapri, M. Property tax assessment incentives for green building: A review. Renew. Sustain. Energy Rev. 2016, 60, 536–548. [Google Scholar] [CrossRef]
- Kim, M.J. Characteristics and determinants by electricity consumption level of households in Korea. Energy Rep. 2018, 4, 70–76. [Google Scholar] [CrossRef]
- Zhang, Y.; Wang, J.; Hu, F.; Wang, Y. Comparison of evaluation standards for green building in China, Britain, United States. Renew. Sustain. Energy Rev. 2017, 68, 262–271. [Google Scholar] [CrossRef]
- Yin, S.; Li, B.; Xing, Z. The governance mechanism of the building material industry (BMI) in transformation to green BMI: The perspective of green building. Sci. Total Environ. 2019, 677, 19–33. [Google Scholar] [CrossRef]
- Zhang, X.; Dong, Q.; Costa, V.; Wang, X. A hierarchical Bayesian model for decomposing the impacts of human activities and climate change on water resources in China. Sci. Total Environ. 2019, 665, 836–847. [Google Scholar] [CrossRef]
- Shafique, M.; Kim, R.; Rafiq, M. Green roof benefits, opportunities and challenges–A review. Renew. Sustain. Energy Rev. 2018, 90, 757–773. [Google Scholar] [CrossRef]
- Besir, A.B.; Cuce, E. Green roofs and facades: A comprehensive review. Renew. Sustain. Energy Rev. 2018, 82, 915–939. [Google Scholar] [CrossRef]
- Jusselme, M.D.; Pruvost, C.; Motar, E.; Giusti-Miller, S.; Frechault, S.; Alphonse, V.; Bi, C.B.B.; Dajoz, I.; Mora, P. Increasing the ability of a green roof to provide ecosystem services by adding organic matter and earthworms. Appl. Soil Ecol. 2019, 143, 61–69. [Google Scholar] [CrossRef]
- Zhou, S.Y.D.; Zhang, Q.; Neilson, R.; Giles, M.; Li, H.; Yang, X.R.; Su, J.Q.; Zhu, Y.G. Vertical distribution of antibiotic resistance genes in an urban green façade. Environ. Int. 2021, 152, 106502. [Google Scholar] [CrossRef]
- Tomson, M.; Kumar, P.; Barwise, Y.; Perez, P.; Forehead, H.; French, K.; Morawska, L.; Watts, J.F. Green infrastructure for air quality improvement in street canyons. Environ. Int. 2021, 146, 106288. [Google Scholar] [CrossRef]
- Rosas-Flores, J.A.; Zenón-Olvera, E.; Gálvez, D.M. Potential energy saving in urban and rural households of Mexico with solar photovoltaic systems using geographical information system. Renew. Sustain. Energy Rev. 2019, 116, 109412. [Google Scholar] [CrossRef]
- Trindade, A.; Cordeiro, L. Automated formal verification of stand-alone solar photovoltaic systems. Sol. Energy. 2019, 193, 684–691. [Google Scholar] [CrossRef]
- Leite, G.N.P.; Weschenfelder, F.; Araújo, A.M.; Ochoa, Á.A.V.; Kraj, A. An economic analysis of the integration between air-conditioning and solar photovoltaic systems. Energ. Convers. Manage. 2019, 185, 836–849. [Google Scholar] [CrossRef]
- Missoum, A.; Elmir, M.; Belkacem, A.; Nabou, M.; Draoui, B. Numerical Simulation of Heat Transfer through a Double-walled Facade Building in Arid Zone. Energy Procedia. 2013, 36, 834–843. [Google Scholar] [CrossRef] [Green Version]
- Inan, T.; Basaran, T. Experimental and numerical investigation of forced convection in a double skin façade by using nodal network approach for Istanbul. Sol. Energy. 2019, 183, 441–452. [Google Scholar] [CrossRef]
- Lago, T.G.S.; Ismail, K.A.R.; Lino, F.A.M. Ventilated double glass window with reflective film: Modeling and assessment of performance. Sol. Energy. 2019, 185, 72–88. [Google Scholar] [CrossRef]
- González-Julián, E.; Xamán, J.; Moraga, N.O.; Chávez, Y.; Zavala-Guillén, I.; Simá, E. Annual thermal evaluation of a double pane window using glazing available in the Mexican market. Appl. Therm. Eng. 2018, 143, 100–111. [Google Scholar] [CrossRef]
- Xue, P.; Li, Q.; Xie, J.; Zhao, M.; Liu, J. Optimization of window-to-wall ratio with sunshades in China low latitude region considering daylighting and energy saving requirements. Appl. Energ. 2019, 233–234, 62–70. [Google Scholar] [CrossRef]
- Richter, J.L.; Tähkämö, L.; Dalhammar, C. Trade-offs with longer lifetimes? The case of LED lamps considering product development and energy contexts. J. Clean. Prod. 2019, 226, 195–209. [Google Scholar] [CrossRef]
- Gautam, A.; Chamoli, S.; Kumar, A.; Singh, S. A review on technical improvements, economic feasibility and world scenario of solar water heating system. Renew. Sustain. Energy Rev. 2017, 68, 541–562. [Google Scholar] [CrossRef]
- Choi, Y.; Mae, M.; Kim, H.B. Thermal performance improvement method for air-based solar heating systems. Sol. Energy. 2019, 186, 277–290. [Google Scholar] [CrossRef]
- Lu, Y.; Tian, Z.; Peng, P.; Niu, J.; Li, W.; Zhang, H. GMM clustering for heating load patterns in-depth identification and prediction model accuracy improvement of district heating system. Energy Build. 2019, 190, 49–60. [Google Scholar] [CrossRef]
- Risbeck, M.J.; Maravelias, C.T.; Rawlings, J.B.; Turney, R.D. A mixed-integer linear programming model for real-time cost optimization of building heating, ventilation, and air conditioning equipment. Energy Build. 2017, 142, 220–235. [Google Scholar] [CrossRef]
- Heiskanen, E.; Matschoss, K. Understanding the uneven diffusion of building-scale renewable energy systems: A review of household, local and country level factors in diverse European countries. Renew. Sustain. Energy Rev. 2017, 75, 580–591. [Google Scholar] [CrossRef] [Green Version]
- Xiangyang HURDB, 2019 Announcement on Subsidies for Energy Conservation Renovation in Household Buildings. 2019. Available online: http://szjj.xiangyang.gov.cn/zwgk/gkml/gsgg/201912/t20191210_1987096.shtml (accessed on 22 September 2021).
- Sun, C.; Zhang, J.; Guo, Y.; Fu, Q.; Liu, W.; Pan, J.; Huang, Y.; Zou, Z.; Huang, C. Outdoor air pollution in relation to sick building syndrome (SBS) symptoms among residents in Shanghai, China. Energy Build. 2018, 174, 68–76. [Google Scholar] [CrossRef]
- Meng, M.; Wang, L.; Shang, W. Decomposition and forecasting analysis of China’s household electricity consumption using three-dimensional decomposition and hybrid trend extrapolation models. Energy 2018, 165, 143–152. [Google Scholar] [CrossRef]
- Ordos Housing and Urban-Rural Development Bureau, 2019 Public Announcement on Applying for Renovation Items for Existing Household Buildings. 2019. Available online: http://zjj.ordos.gov.cn/tzgg_77006/201904/t20190429_2369438.html (accessed on 22 September 2021).
- Wu, S.; Zheng, X.; You, C.; Wei, C. Household energy consumption in rural China: Historical development, present pattern and policy implication. J. Clean. Prod. 2019, 211, 981–991. [Google Scholar] [CrossRef]
- Niu, S.; Li, Z.; Qiu, X.; Dai, R.; Hong, Z. Measurement of effective energy consumption in China’s rural household sector and policy implication. Energ. Policy. 2019, 128, 553–564. [Google Scholar] [CrossRef]
- Kim, H.; Jung, T.Y. Independent solar photovoltaic with Energy Storage Systems (ESS) for rural electrification in Myanmar. Renew. Sustain. Energy Rev. 2018, 82, 1187–1194. [Google Scholar] [CrossRef]
- China Electric Power News, 2019 Solar Photovoltaic Has Generated 19.1 GW to Aid Poverty! National Energy Administration Director Zhang Jianhua Announces Key Information on the 2020 National Energy Work Conference. 2019. Available online: https://news.solarbe.com/201912/17/318209.html (accessed on 22 September 2021).
- Kurata, M.; Matsui, N.; Ikemoto, Y.; Tsuboi, H. Do determinants of adopting solar home systems differ between households and micro-enterprises? Evidence from rural Bangladesh. Renew. Energ. 2018, 129, 309–316. [Google Scholar] [CrossRef]
- Ryan, A.M.; Spash, C.L.; Measham, T.G. Socio-economic and psychological predictors of domestic greywater and rainwater collection: Evidence from Australia. J. Hydrol. 2009, 379, 164–171. [Google Scholar] [CrossRef]
- Villarreal, E.L.; Dixon, A. Analysis of a rainwater collection system for domestic water supply in Ringdansen, Norrköping, Sweden. Build. Environ. 2005, 40, 1174–1184. [Google Scholar] [CrossRef]
- Şahin, N.İ.; Manioğlu, G. Water conservation through rainwater harvesting using different building forms in different climatic regions. Sustain. Cities Soc. 2019, 44, 367–377. [Google Scholar] [CrossRef]
- Goonetilleke, A.; Liu, A.; Managi, S.; Wilson, C.; Gardner, T.; Bandala, E.R.; Walker, L.; Holden, J.; Wibowo, M.A.; Suripin, S.; et al. Stormwater reuse, a viable option: Fact or fiction? Econ. Anal. Policy. 2017, 56, 14–17. [Google Scholar] [CrossRef] [Green Version]
- Hong, N.; Zhu, P.; Liu, A. Modelling heavy metals build-up on urban road surfaces for effective stormwater reuse strategy implementation. Environ. Pollut. 2017, 231, 821–828. [Google Scholar] [CrossRef]
- Hong, N.; Liu, A.; Zhu, P.; Zhao, X.; Guan, Y.; Yang, M.; Wang, H. Modelling benzene series pollutants (BTEX) build-up loads on urban roads and their human health risks: Implications for stormwater reuse safety. Ecotoxicol. Environ. Saf. 2018, 164, 234–242. [Google Scholar] [CrossRef]
- Coleman, S.; Hurley, S.; Rizzo, D.; Koliba, C.; Zia, A. From the household to watershed: A cross-scale analysis of residential intention to adopt green stormwater infrastructure. Landscape Urban Plan. 2018, 180, 195–206. [Google Scholar] [CrossRef]
- Ashoori, N.; Teixido, M.; Spahr, S.; LeFevre, G.H.; Sedlak, D.L.; Luthy, R.G. Evaluation of pilot-scale biochar-amended woodchip bioreactors to remove nitrate, metals, and trace organic contaminants from urban stormwater runoff. Water Res. 2019, 154, 1–11. [Google Scholar] [CrossRef]
- Zou, B.; Luo, B. Rural household energy consumption characteristics and determinants in China. Energy 2019, 182, 814–823. [Google Scholar] [CrossRef]
- Zhang, G.; Deng, N.; Mou, H.; Zhang, Z.G.; Chen, X. The impact of the policy and behavior of public participation on environmental governance performance: Empirical analysis based on provincial panel data in China. Energ. Policy. 2013, 129, 1347–1354. [Google Scholar] [CrossRef]
- Hsueh, S.L.; Lin, Y.J. Critical Success Factors of the Urban Environmental Quality. Ekoloji 2018, 106, 217–222. [Google Scholar]
- Hsueh, S.L.; Su, F.L. Discussion of environmental education based on the social and cultural characteristics of the community‒an MCDM approach. Appl. Ecol. Env. Res. 2017, 15, 183–196. [Google Scholar] [CrossRef]
- Baumann, M.; Weil, M.; Peters, J.F.; Chibeles-Martins, N.; Moniz, A.B. A review of multi-criteria decision making approaches for evaluating energy storage systems for grid applications. Renew. Sustain. Energy Rev. 2019, 107, 516–534. [Google Scholar] [CrossRef]
- Rosso-Cerón, A.M.; Kafarov, V.; Latorre-Bayona, G.; Quijano-Hurtado, R. A novel hybrid approach based on fuzzy multi-criteria decision-making tools for assessing sustainable alternatives of power generation in San Andrés Island. Renew. Sustain. Energy Rev. 2019, 110, 159–173. [Google Scholar] [CrossRef]
- Khishtandar, S.; Zandieh, M.; Dorri, B. A multi criteria decision making framework for sustainability assessment of bioenergy production technologies with hesitant fuzzy linguistic term sets: The case of Iran. Renew. Sustain. Energy Rev. 2017, 77, 130–1145. [Google Scholar] [CrossRef]
- Simsek, Y.; Watts, D.; Escobar, R. Sustainability evaluation of Concentrated Solar Power (CSP) projects under Clean Development Mechanism (CDM) by using Multi Criteria Decision Method (MCDM). Renew. Sustain. Energy Rev. 2018, 93, 421–438. [Google Scholar] [CrossRef]
- Ferrer-Martí, L.; Ferrer, I.; Sánchez, E.; Garfí, M. A multi-criteria decision support tool for the assessment of household biogas digester programmes in rural areas. A case study in Peru. Renew. Sustain. Energy Rev. 2018, 95, 74–83. [Google Scholar] [CrossRef]
- Balta, M.Ö.; Yenil, H.Ü. Multi criteria decision making methods for urban greenway: The case of Aksaray. Turkey. Land Use Policy 2019, 89, 104224. [Google Scholar] [CrossRef]
- Manupati, V.K.; Ramkumar, M.; Samanta, D. A multi-criteria decision making approach for the urban renewal in Southern India. Sustain. Cities Soc. 2018, 42, 471–481. [Google Scholar] [CrossRef]
- Kokaraki, N.; Hopfe, C.J.; Robinson, E.; Nikolaidou, E. Testing the reliability of deterministic multi-criteria decision-making methods using building performance simulation. Renew. Sustain. Energy Rev. 2019, 12, 991–1007. [Google Scholar] [CrossRef]
- Alyami, S.H.; Rezgui, Y.; Kwan, A. Developing sustainable building assessment scheme for Saudi Arabia: Delphi consultation approach. Renew. Sustain. Energy Rev. 2013, 27, 43–54. [Google Scholar] [CrossRef]
- Dantas, G.A.; Castro, N.J.; Dias, L.; Antunes, C.H.; Zamboni, L. Public policies for smart grids in Brazil. Renew. Sustain. Energy Rev. 2018, 92, 501–512. [Google Scholar] [CrossRef]
- Prasad, R.D.; Bansal, R.C.; Raturi, A. Multi-faceted energy planning: A review. Renew. Sustain. Energy Rev. 2014, 38, 686–699. [Google Scholar] [CrossRef]
- Jahanshahi, A.; Kamali, M.; Khalaj, M.; Khodaparast, Z. Delphi-based prioritization of economic criteria for development of wave and tidal energy technologies. Energy 2019, 167, 819–827. [Google Scholar] [CrossRef]
- Kamaruzzaman, S.N.; Lou, E.C.W.; Wong, P.F.; Edwards, R.; Ghani, M.K. Development of a non-domestic building refurbishment scheme for Malaysia: A Delphi approach. Energy 2019, 167, 804–818. [Google Scholar] [CrossRef] [Green Version]
- Zadeh, L.A. Fuzzy sets. Inf. Control. 1965, 8, 338–353. [Google Scholar] [CrossRef] [Green Version]
- Zadeh, L.A. Fuzzy logic = Computing with words. IEEE Trans. on Fuzzy Syst. 1996, 4, 103–111. [Google Scholar] [CrossRef] [Green Version]
- Liu, G.; Baniyounes, A.; Rasul, M.G.; Amanullah, M.T.O.; Khan, M.M.K. Fuzzy Logic based Environmental Indicator for Sustainability Assessment of Renewable Energy System using Life Cycle Assessment. Procedia Eng. 2012, 49, 35–41. [Google Scholar] [CrossRef] [Green Version]
- Abouelnaga, A.E.; Metwally, A.; Aly, N.; Nagy, M.; Agamy, S. Assessment of nuclear energy sustainability index using fuzzy logic. Nucl. Eng. Des. 2010, 240, 1928–1933. [Google Scholar] [CrossRef]
- Vigneysh, T.; Kumarappan, N. Grid interconnection of renewable energy sources using multifunctional grid-interactive converters: A fuzzy logic based approach. Electr. Pow. Syst. Res. 2017, 151, 359–368. [Google Scholar] [CrossRef]
- Pislaru, M.; Herghiligiu, I.V.; Robu, I.B. Corporate sustainable performance assessment based on fuzzy logic. J. Clean. Prod. 2019, 223, 998–1013. [Google Scholar] [CrossRef]
- Azizkhani, M.; Vakili, A.; Noorollahi, Y.; Naseri, F. Potential survey of photovoltaic power plants using Analytical Hierarchy Process (AHP) method in Iran. Renew. Sustain. Energy Rev. 2017, 75, 1198–1206. [Google Scholar] [CrossRef]
- Ghimire, L.P.; Kim, Y. Ananalysis on barriers to renewable energy development in the context of Nepal using AHP. Renew. Energ. 2018, 129, 446–456. [Google Scholar] [CrossRef]
- Salvia, A.L.; Brandli, L.L.; Filho, W.L.; Kalil, R.M.L. An analysis of the applications of Analytic Hierarchy Process (AHP) for selection of energy efficiency practices in public lighting in a sample of Brazilian cities. Energ. Policy. 2019, 132, 854–864. [Google Scholar] [CrossRef]
- Ocampo-Duque, W.; Ferré-Huguet, N.; Domingo, J.L.; Schuhmacher, M. Assessing water quality in rivers with fuzzy inference systems: A case study. Environ. Int. 2016, 32, 733–742. [Google Scholar] [CrossRef]
- Topuz, E.; Gestel, C.A.M. An approach for environmental risk assessment of engineered nanomaterials using Analytical Hierarchy Process (AHP) and fuzzy inference rules. Environ. Int. 2016, 92–93, 334–347. [Google Scholar] [CrossRef]


| Year | 2000 | 2005 | 2006 | 2007 | 2008 | 2009 | 2010 |
|---|---|---|---|---|---|---|---|
| CO2 Actual emissions | 34.0 | 55.5 | - | 65.3 | - | 72.1 | 83.2 |
| CO2 Predicted emissions | - | - | 59.5 | 64.7 | 69.9 | 75.5 | 81.6 |
| Method | Functions and Features | Support Tool |
|---|---|---|
| Delphi | The Delphi process is employed to conduct qualitative analysis of data collected during the literature review. This is to acquire criteria consistently identified by Delphi experts for use with fuzzy logic and the AHP. | Delphi questionnaire |
| Fuzzy logic | The fuzzy logic theory is applied to establish the fuzzy logic inference system (FLIS). The FLIS is capable of inferencing algorithm functions, evaluating input criteria combinations, computing scientific inference algorithms, and converting outputs into quantified values, namely, f(x). In addition, the FLIS is capable of computing the fuzzy logic of human speech, imprecise input data, and criteria with different units. | MATLAB software |
| AHP | To achieve effective questionnaire investigation information and to compute the relative weights (w) of each criterion, this study designed the paired comparison questionnaire for the AHP through the Delphic process using expert-validated criteria. | Paired comparison questionnaire and AHP equation |
| DFuzzy–DAHP | This study employed the Delphi Fuzzy (DFuzzy) model to compute the overall quantitative proportions of the assessment results. Subsequently, the Delphi AHP (DAHP) model was adopted to compute the quantitative proportion of each criterion to analyze details in the decision-making process and clarify the existing root problems. | f(ys) = f(xs) × (Σ wi); s = 1~j; i = 1~n |
| Concept | Delphi Method | Field Research (Expert Investigation) |
|---|---|---|
| Questionnaire | Delphi expert questionnaire | Field questionnaire |
| Participants | Experts with industrial, public sector, or academic backgrounds with extensive experience in their field. | Experts are generally invited according to researchers’ rigorousness. |
| Investigation method | Anonymous mail, direct interviews, or phone interviews | Mail, direct interviews, or phone interviews that need not be anonymously nor individually conducted. |
| Process | Collecting opinions, compiling and inducting data, and comparing opinions. If the expert opinions are inconsistent, the questionnaire is redesigned. The process is repeated until the experts reach a consensus. | Collecting opinions, compiling and inducting data, and conducting statistical analysis |
| Feature | Qualitative analysis | Qualitative analysis |
| Data characteristics | Independent. Only opinions that researchers have reached a consensus on are collected. | Requires further statistical analysis techniques to understand the independence of the data. |
| Criteria | Range (Fuzzy Sets) | Output Value |
|---|---|---|
| Participation situation | 0–100 (%) (Very high, High, Generally, Low, Very low) | 0–100 Very good ≥ 90 89 ≥ Good ≥ 75 74 ≥ Average ≥ 60 59 ≥ Bad ≥ 45 Very bad ≤ 44 |
| Generating capacity | 0 –10 (Multiple) (Very much, Much, Average, Little, Very little) | |
| Storage facilities | 0–15 (Month) (Very enough, Just enough, Not enough) | |
| Note |
| |
| A/B | Participation Situation | Generating Capacity | Storage Facilities |
|---|---|---|---|
| Participation situation | 1 | 1 1/2 | 1 1/2 |
| Generating capacity | 2/3 | 1 | 2 |
| Storage facilities | 2/3 | 1/2 | 1 |
| Weighting value | 0.42 | 0.35 | 0.22 |
| Remark | C.I. = 0.0268; R.I. = 0.58; C.R. = 0.0462 | ||
| A/B | Pro-Environmental | Pattern of Subsidies | Ratio of Subsidy |
|---|---|---|---|
| Pro-Environmental | 1 | 2 | 4/5 |
| Pattern of subsidies | 1/2 | 1 | 2/5 |
| Ratio of subsidy | 1 1/4 | 2 1/2 | 1 |
| Weighting value | 0.36 | 0.18 | 0.45 |
| Remark | C.I. = 0; R.I. = 0.58; C.R. = 0 | ||
| A/B | Solar Home Systems | Solar PV Parks | Carbon Trading |
|---|---|---|---|
| Solar home systems | 1 | 3/5 | 1/5 |
| Solar PV parks | 1 2/3 | 1 | 1/2 |
| Carbon trading | 5 | 2 | 1 |
| Weighting value | 0.14 | 0.26 | 0.60 |
| Remark | C.I. = 0.0092; R.I. = 0.58; C.R. = 0.0159 | ||
| A/B | Private RWC Pool | Public RWC Pool | GRW Infrastructure |
|---|---|---|---|
| Private RWC pool | 1 | 1/5 | 1/2 |
| Public RWC pool | 5 | 1 | 1 1/2 |
| GRW infrastructure | 2 | 2/3 | 1 |
| Weighting value | 0.13 | 0.55 | 0.31 |
| Remark | C.I. = 0.0146; R.I. = 0.58; C.R. = 0.0252 | ||
| Criteria (Level 1): ωi | Criteria (Level 2): ωi | (Level 1 × 2) ωi | Seq. |
|---|---|---|---|
| Participation situation (1-1): 0.42 | Pro-Environmental (2-1-1): 0.36 | 0.15 | 3 |
| Pattern of subsidies (2-1-2): 0.18 | 0.08 | 6 | |
| Ratio of subsidy (2-1-3): 0.45 | 0.20 | 2 | |
| Generating capacity (1-2): 0.35 | Solar home systems (2-2-1): 0.14 | 0.05 | 8 |
| Solar PV parks (2-2-2): 0.26 | 0.09 | 5 | |
| Carbon trading (2-2-3): 0.60 | 0.21 | 1 | |
| Storage facilities (1-3): 0.22 | Private RWC pool (2-3-1): 0.13 | 0.03 | 9 |
| Public RWC pool (2-3-2): 0.55 | 0.12 | 4 | |
| GRW infrastructure (2-3-3): 0.31 | 0.07 | 7 | |
| Total weighting value | 1.00 | ||
Publisher’s Note: MDPI stays neutral with regard to jurisdictional claims in published maps and institutional affiliations. |
© 2021 by the authors. Licensee MDPI, Basel, Switzerland. This article is an open access article distributed under the terms and conditions of the Creative Commons Attribution (CC BY) license (https://creativecommons.org/licenses/by/4.0/).
Share and Cite
Hsueh, S.-L.; Feng, Y.; Sun, Y.; Jia, R.; Yan, M.-R. Using AI-MCDM Model to Boost Sustainable Energy System Development: A Case Study on Solar Energy and Rainwater Collection in Guangdong Province. Sustainability 2021, 13, 12505. https://doi.org/10.3390/su132212505
Hsueh S-L, Feng Y, Sun Y, Jia R, Yan M-R. Using AI-MCDM Model to Boost Sustainable Energy System Development: A Case Study on Solar Energy and Rainwater Collection in Guangdong Province. Sustainability. 2021; 13(22):12505. https://doi.org/10.3390/su132212505
Chicago/Turabian StyleHsueh, Sung-Lin, Yuan Feng, Yue Sun, Ruqi Jia, and Min-Ren Yan. 2021. "Using AI-MCDM Model to Boost Sustainable Energy System Development: A Case Study on Solar Energy and Rainwater Collection in Guangdong Province" Sustainability 13, no. 22: 12505. https://doi.org/10.3390/su132212505
APA StyleHsueh, S.-L., Feng, Y., Sun, Y., Jia, R., & Yan, M.-R. (2021). Using AI-MCDM Model to Boost Sustainable Energy System Development: A Case Study on Solar Energy and Rainwater Collection in Guangdong Province. Sustainability, 13(22), 12505. https://doi.org/10.3390/su132212505


