Article

Techno-Economic Analysis of the Hybrid Solar PV/H/Fuel Cell Based Supply Scheme for Green Mobile Communication

by
Md. Sanwar Hossain
1,*,
Abdullah G. Alharbi
2,
Khondoker Ziaul Islam
3,* and
Md. Rabiul Islam
4
1
Department of EEE, Bangladesh University of Business and Technology, Dhaka 1216, Bangladesh
2
Department of Electrical Engineering, Faculty of Engineering, Jouf University, Sakaka 42421, Saudi Arabia
3
Discipline of Information Technology, Murdoch University, Murdoch, WA 6150, Australia
4
School of Electrical, Computer and Telecommunications Engineering, University of Wollongong, Sydney, NSW 2522, Australia
*
Authors to whom correspondence should be addressed.
Sustainability 2021, 13(22), 12508; https://doi.org/10.3390/su132212508
Submission received: 21 October 2021 / Revised: 5 November 2021 / Accepted: 9 November 2021 / Published: 12 November 2021

Abstract

:
Hydrogen has received tremendous global attention as an energy carrier and an energy storage system. Hydrogen carrier introduces a power to hydrogen (P2H), and power to hydrogen to power (P2H2P) facility to store the excess energy in renewable energy storage systems, with the facts of large-scale storage capacity, transportability, and multiple utilities. This work examines the techno-economic feasibility of hybrid solar photovoltaic (PV)/hydrogen/fuel cell-powered cellular base stations for developing green mobile communication to decrease environmental degradation and mitigate fossil-fuel crises. Extensive simulation is carried out using a hybrid optimization model for electric rnewables (HOMER) optimization tool to evaluate the optimal size, energy production, total production cost, per unit energy production cost, and emission of carbon footprints subject to different relevant system parameters. In addition, the throughput, and energy efficiency performance of the wireless network is critically evaluated with the help of MATLAB-based Monte-Carlo simulations taking multipath fading, system bandwidth, transmission power, and inter-cell interference (ICI) into consideration. Results show that a more stable and reliable green solution for the telecommunications sector will be the macro cellular basis stations driven by the recommended hybrid supply system. The hybrid supply system has around 17% surplus electricity and 48.1 h backup capacity that increases the system reliability by maintaining a better quality of service (QoS). To end, the outcomes of the suggested system are compared with the other supply scheme and the previously published research work for justifying the validity of the proposed system.

1. Introduction

Over the last decade, the volume of cellular subscribers has grown quickly because of the requirement for ubiquitous connection [1,2]. The significant rise in the number of mobile users and the demand for high speed data require mobile network providers to deploy more base stations (BSs) throughout the world [3]. Base stations are the main consumers of energy in the cellular industry that consume 57% of total energy [4]. The telecommunication industry’s annual worldwide energy usage was 219 TWh in 2007 that amounted to 354 TWh in 2012 [4,5]. It is expected that the worldwide use of energy is may upsurge by around 27 percent within 2017 to 2040, corresponding to 3.743 million tons of oil [6,7]. Moreover, this energy consumption growth is envisioned to negatively affect the environment due to the increase of carbon emissions. In fact, carbon dioxide (CO 2 ) emissions are also anticipated to proliferate by a growth of 6% every year through 2021 [8]. The information and communications technology (ICT) industry is predicted to account for 2–4 percent of the global carbon footprint, and the exponential rise of mobile traffic is projected to increase every year. The urgent need is thus to develop an alternative energy source and to decrease the carbon footprints of communication network systems [9].
Because of the above facts, telecommunication network operators are always striving to discover alternative, environmentally compatible, and economical energy sources. More specifically, the generation of renewable energy (RE) is a dire need for facilitating sustainable development and ensuring a more green future for every country [10,11,12]. The collection of energy from locally available RE sources for example solar, wind, biomass, etc. has therefore been one of the main concerns for academia and researchers [13,14,15,16]. Renewable energy is reusable and readily available from various areas across the world. In addition, an enormous amount of energy may be gathered with the aid of contemporary technologies from renewable energy sources by reducing costs. Based on the expected advantages of renewable sources, cellular BSs powered by locally accessible RE sources are being gradually installed by telecommunications providers. Despite the potential benefits, harvesting power from renewable sources is not viable because of their stochastic tempo-spatial behaviors in a wide ranging operation. As a result, the more diverse option with an appropriate power storage facility is therefore required to strengthen the system’s reliability. Moreover, the techniques and constraints of batteries, hydro pumped, mechanical, and other conventional energy storage technologies have their limitations and challenges [17]. These restrictions underline the necessity for a new energy storage device with a large capacity and longer duration of discharge. The integration of the hydrogen (H) and fuel cell (FC) with renewable energy sources through an intelligent control system is seen as a compelling solution to fulfill the huge power demand. This can also ensure the required sustainability, reliability, and safety. Due to the energy carrier, hydrogen introduces hydrogen power to electricity (P2H2P) technology, which is capable, transportable, and usable to store surplus power into renewable energy storage systems (RESS) [17,18,19]. This innovative P2H2P concept provides sufficient opportunity for the storage and reducing carbon footprints of renewable energy [17,18,19]. Renewable hydrogen is linked to modern energy supply, transportation, industry, and the export of RE.
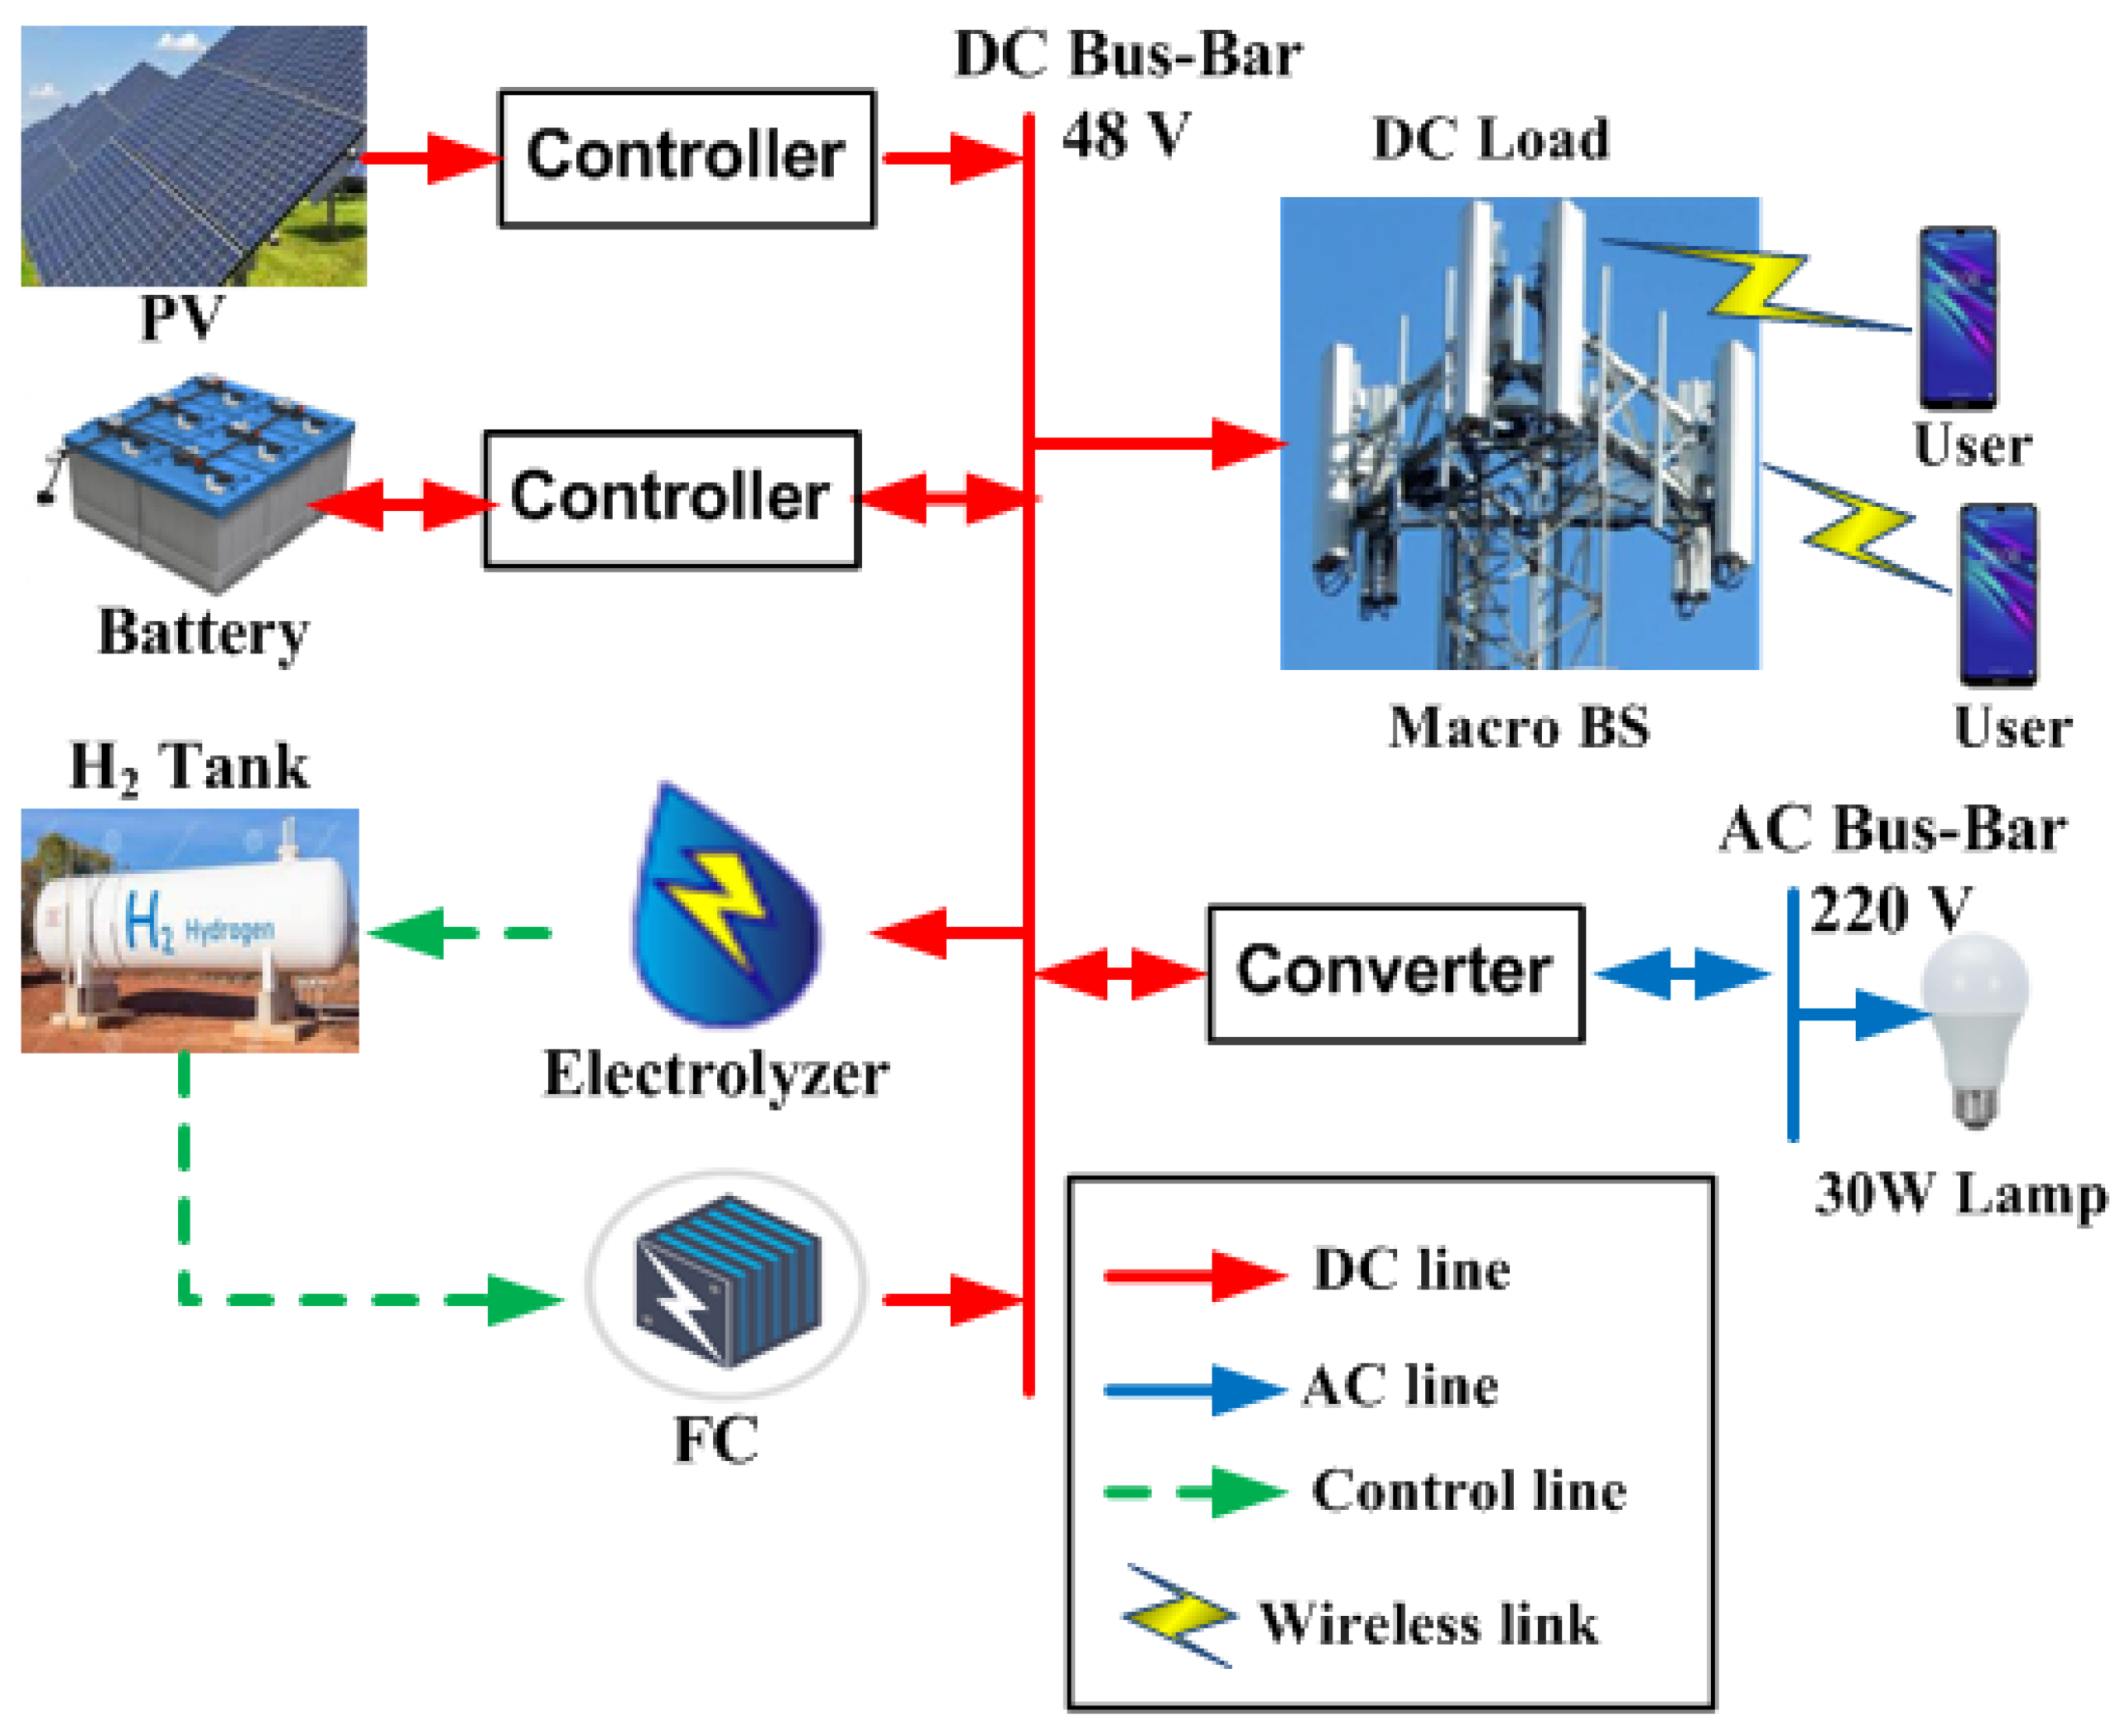
The production and storage of hydrogen are some of the key technologies for storing the extra energy produced from renewable sources [19,20,21]. As major components, the electrolyzer, the hydrogen tank, and the fuel cell system assigned with specific tasks are included in this scheme. The surplus renewable source (i.e., solar) is used in an electrolyzer that generates hydrogen and oxygen by electrolyzing water. The fuel cell uses this hydrogen and creates electricity (typically by absorbing atmospheric oxygen). This hydrogen is stored in the tank and provides backup power when renewable sources fail to fulfill the BS energy demand. Energy storage using hydrogen provides excellent energy performance and is suited to satisfy (seasonal) long term energy storage needs. In contrast, due to the particular geographical requirements and potential environmental consequences, the pumped hydroelectric storage system has a limited possibility for further development in long term storage applications [20]. Besides, due to the uncertain lifespan and rapid degradation (i.e., by loading cycles), environmental sensitivity (e.g., temperature), self discharge, and limited storage capacity (per unit volume and mass), batteries cannot be considered as perfect candidates for long term energy storage solutions [19,20,21]. So, the development of solar photovoltaic (PV) systems along with hydrogen and fuel cell system can diminish the problems addressed earlier.
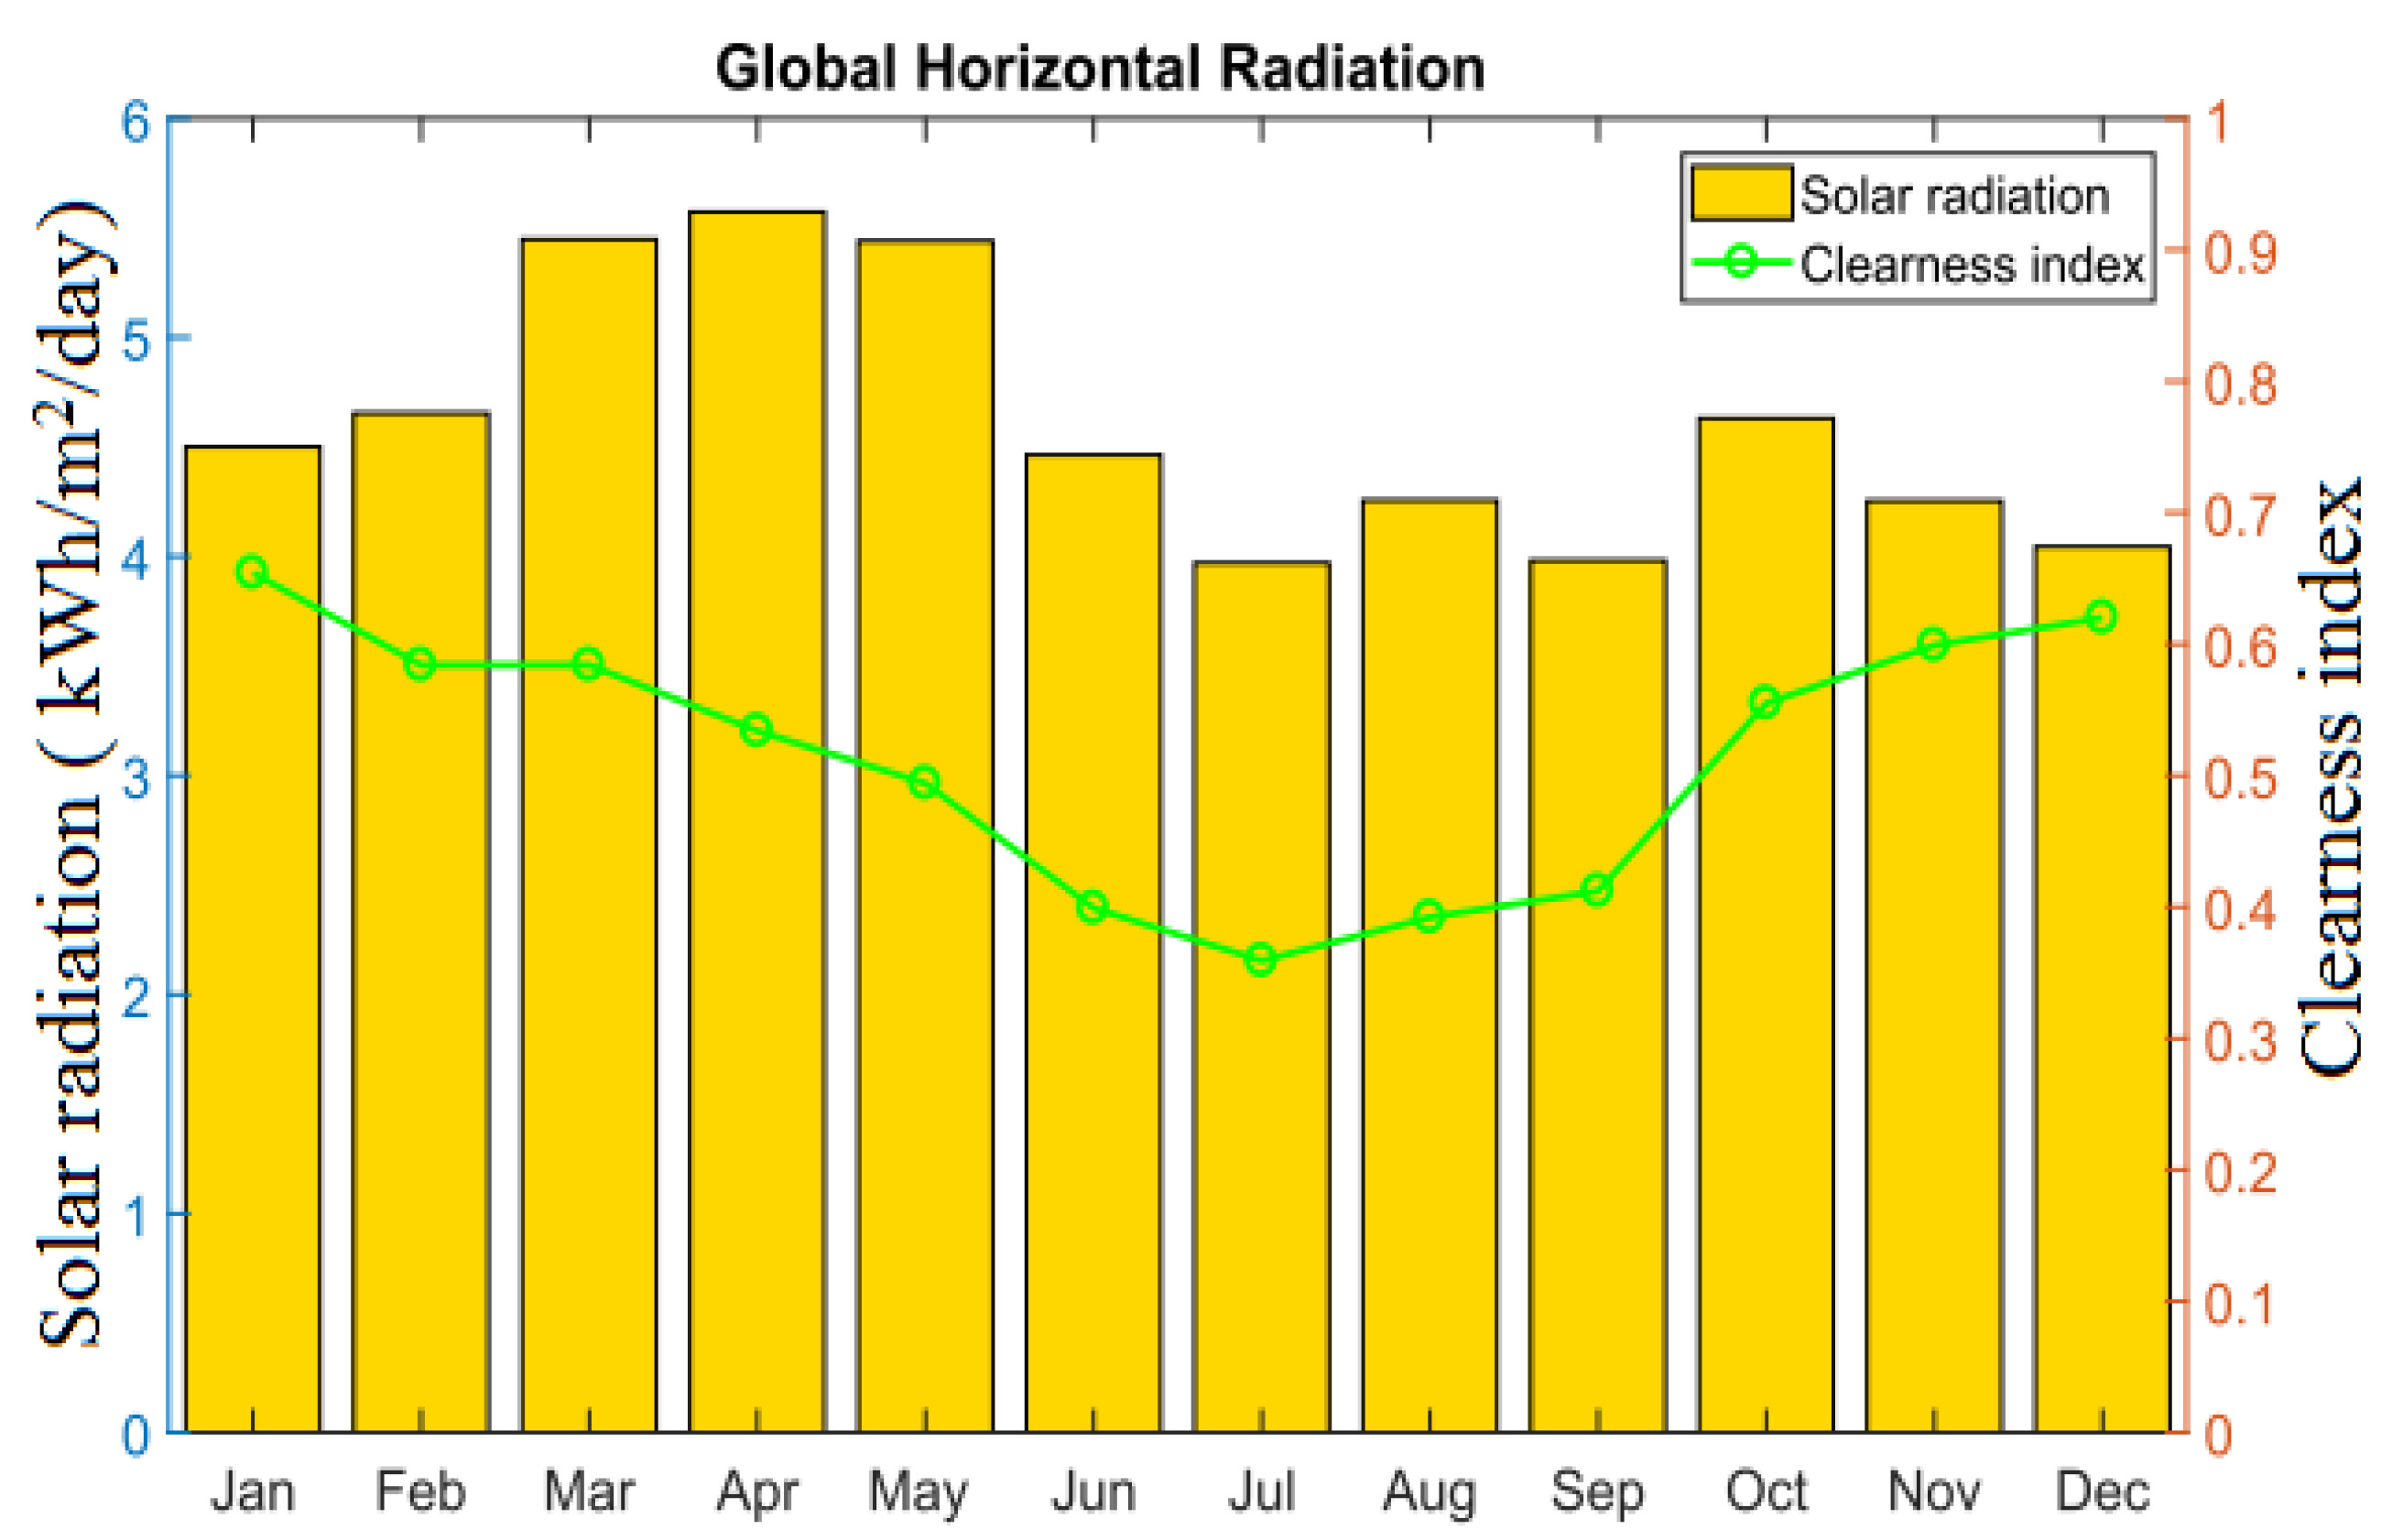
This study is mainly aimed at integrating the solar PV system along with hydrogen and fuel cell system for powering the cellular macro network in Bangladesh, taking into consideration the dynamic profile of traffic and renewable energy sources. A detailed hybrid optimization model for electric rnewables (HOMER) simulation was carried out over 20 years to evaluate the techno-economic feasibility of hydrogen-based renewable energy systems for the storage of surplus energy. In addition, the performance of the wireless network has been assessed using Monte-Carlo simulation. The chosen field of this research is Patenga, which is part of Bangladesh under the division of Chittagong and it’s located between 22 15 14 North, and 91 48 21 East. To the best knowledge of the authors, for the intended green wireless networks, we are the first to do a techno-economic analysis that integrates the hydrogen and fuel cell with the solar PV system. The most significant contributions are summed up as follow:
  • To propose an energy sustainable hybrid-powered (integration of hydrogen and fuel cell with the solar PV system) cellular networks emphasizing long-term reliability through green engineering solutions.
  • To find out the optimum solution of the proposed framework with the help of HOMER optimizer software focusing on the techno-economic feasibility of using hydrogen as an energy storage medium.
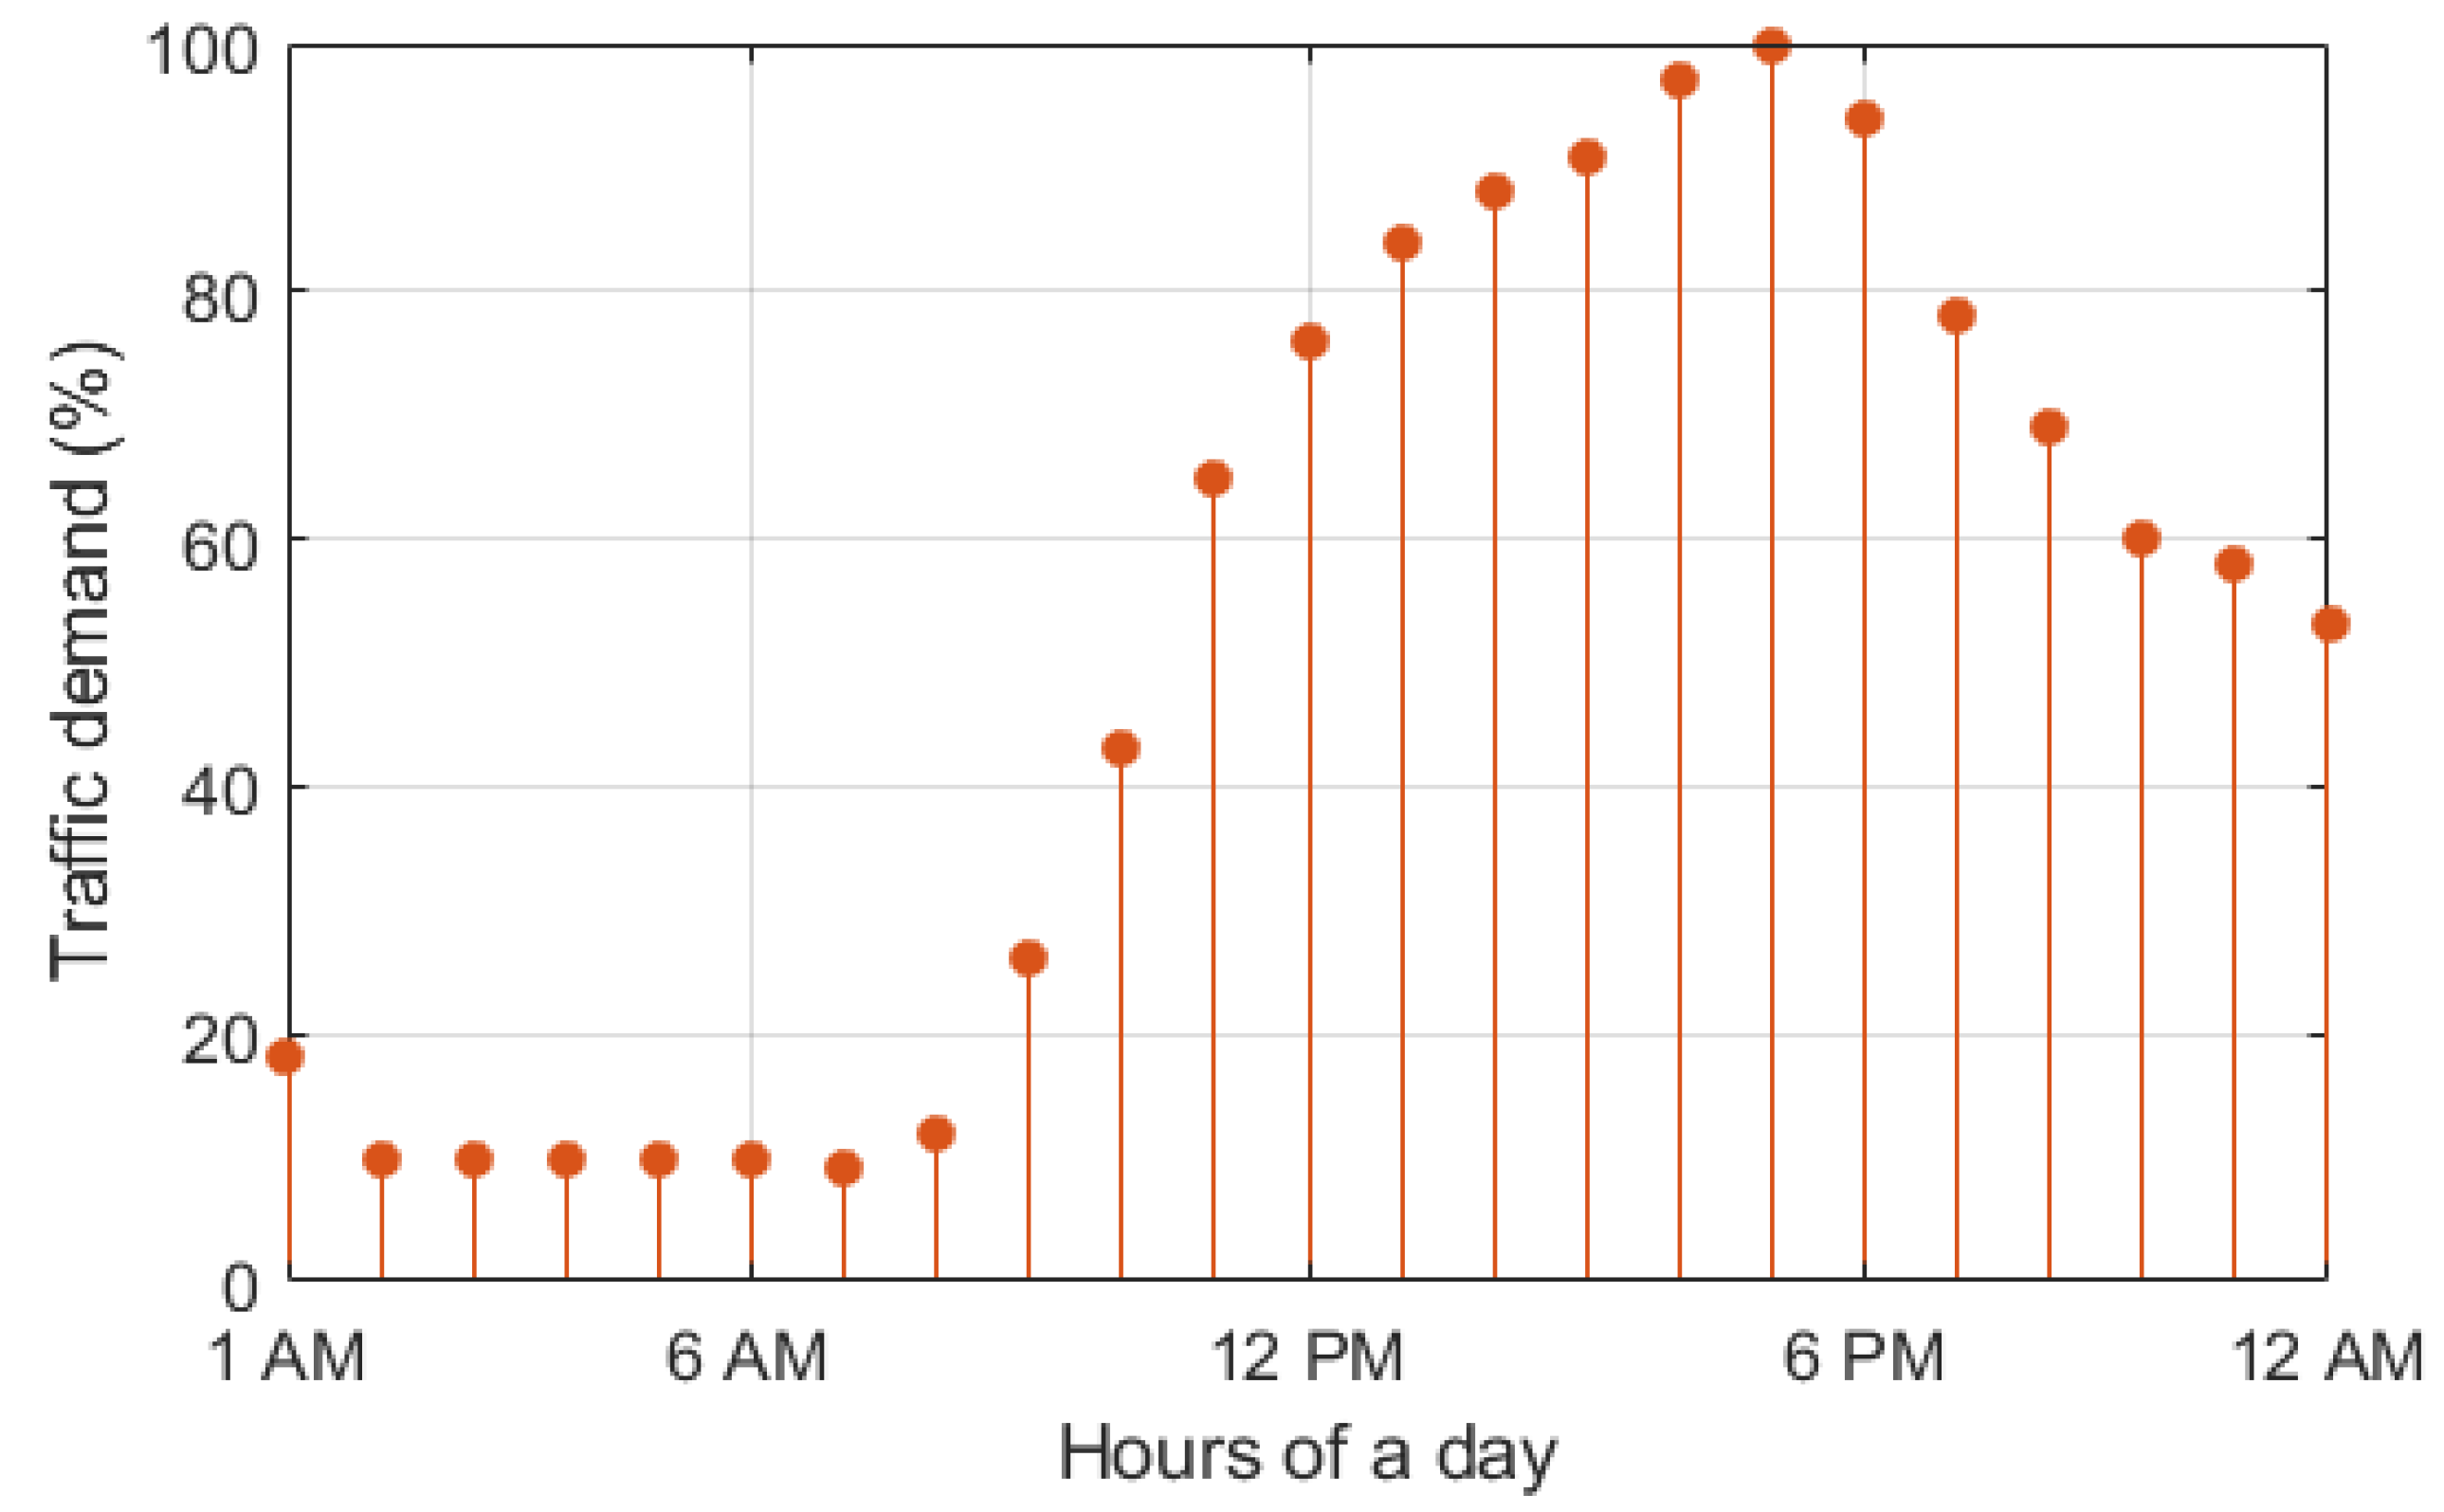
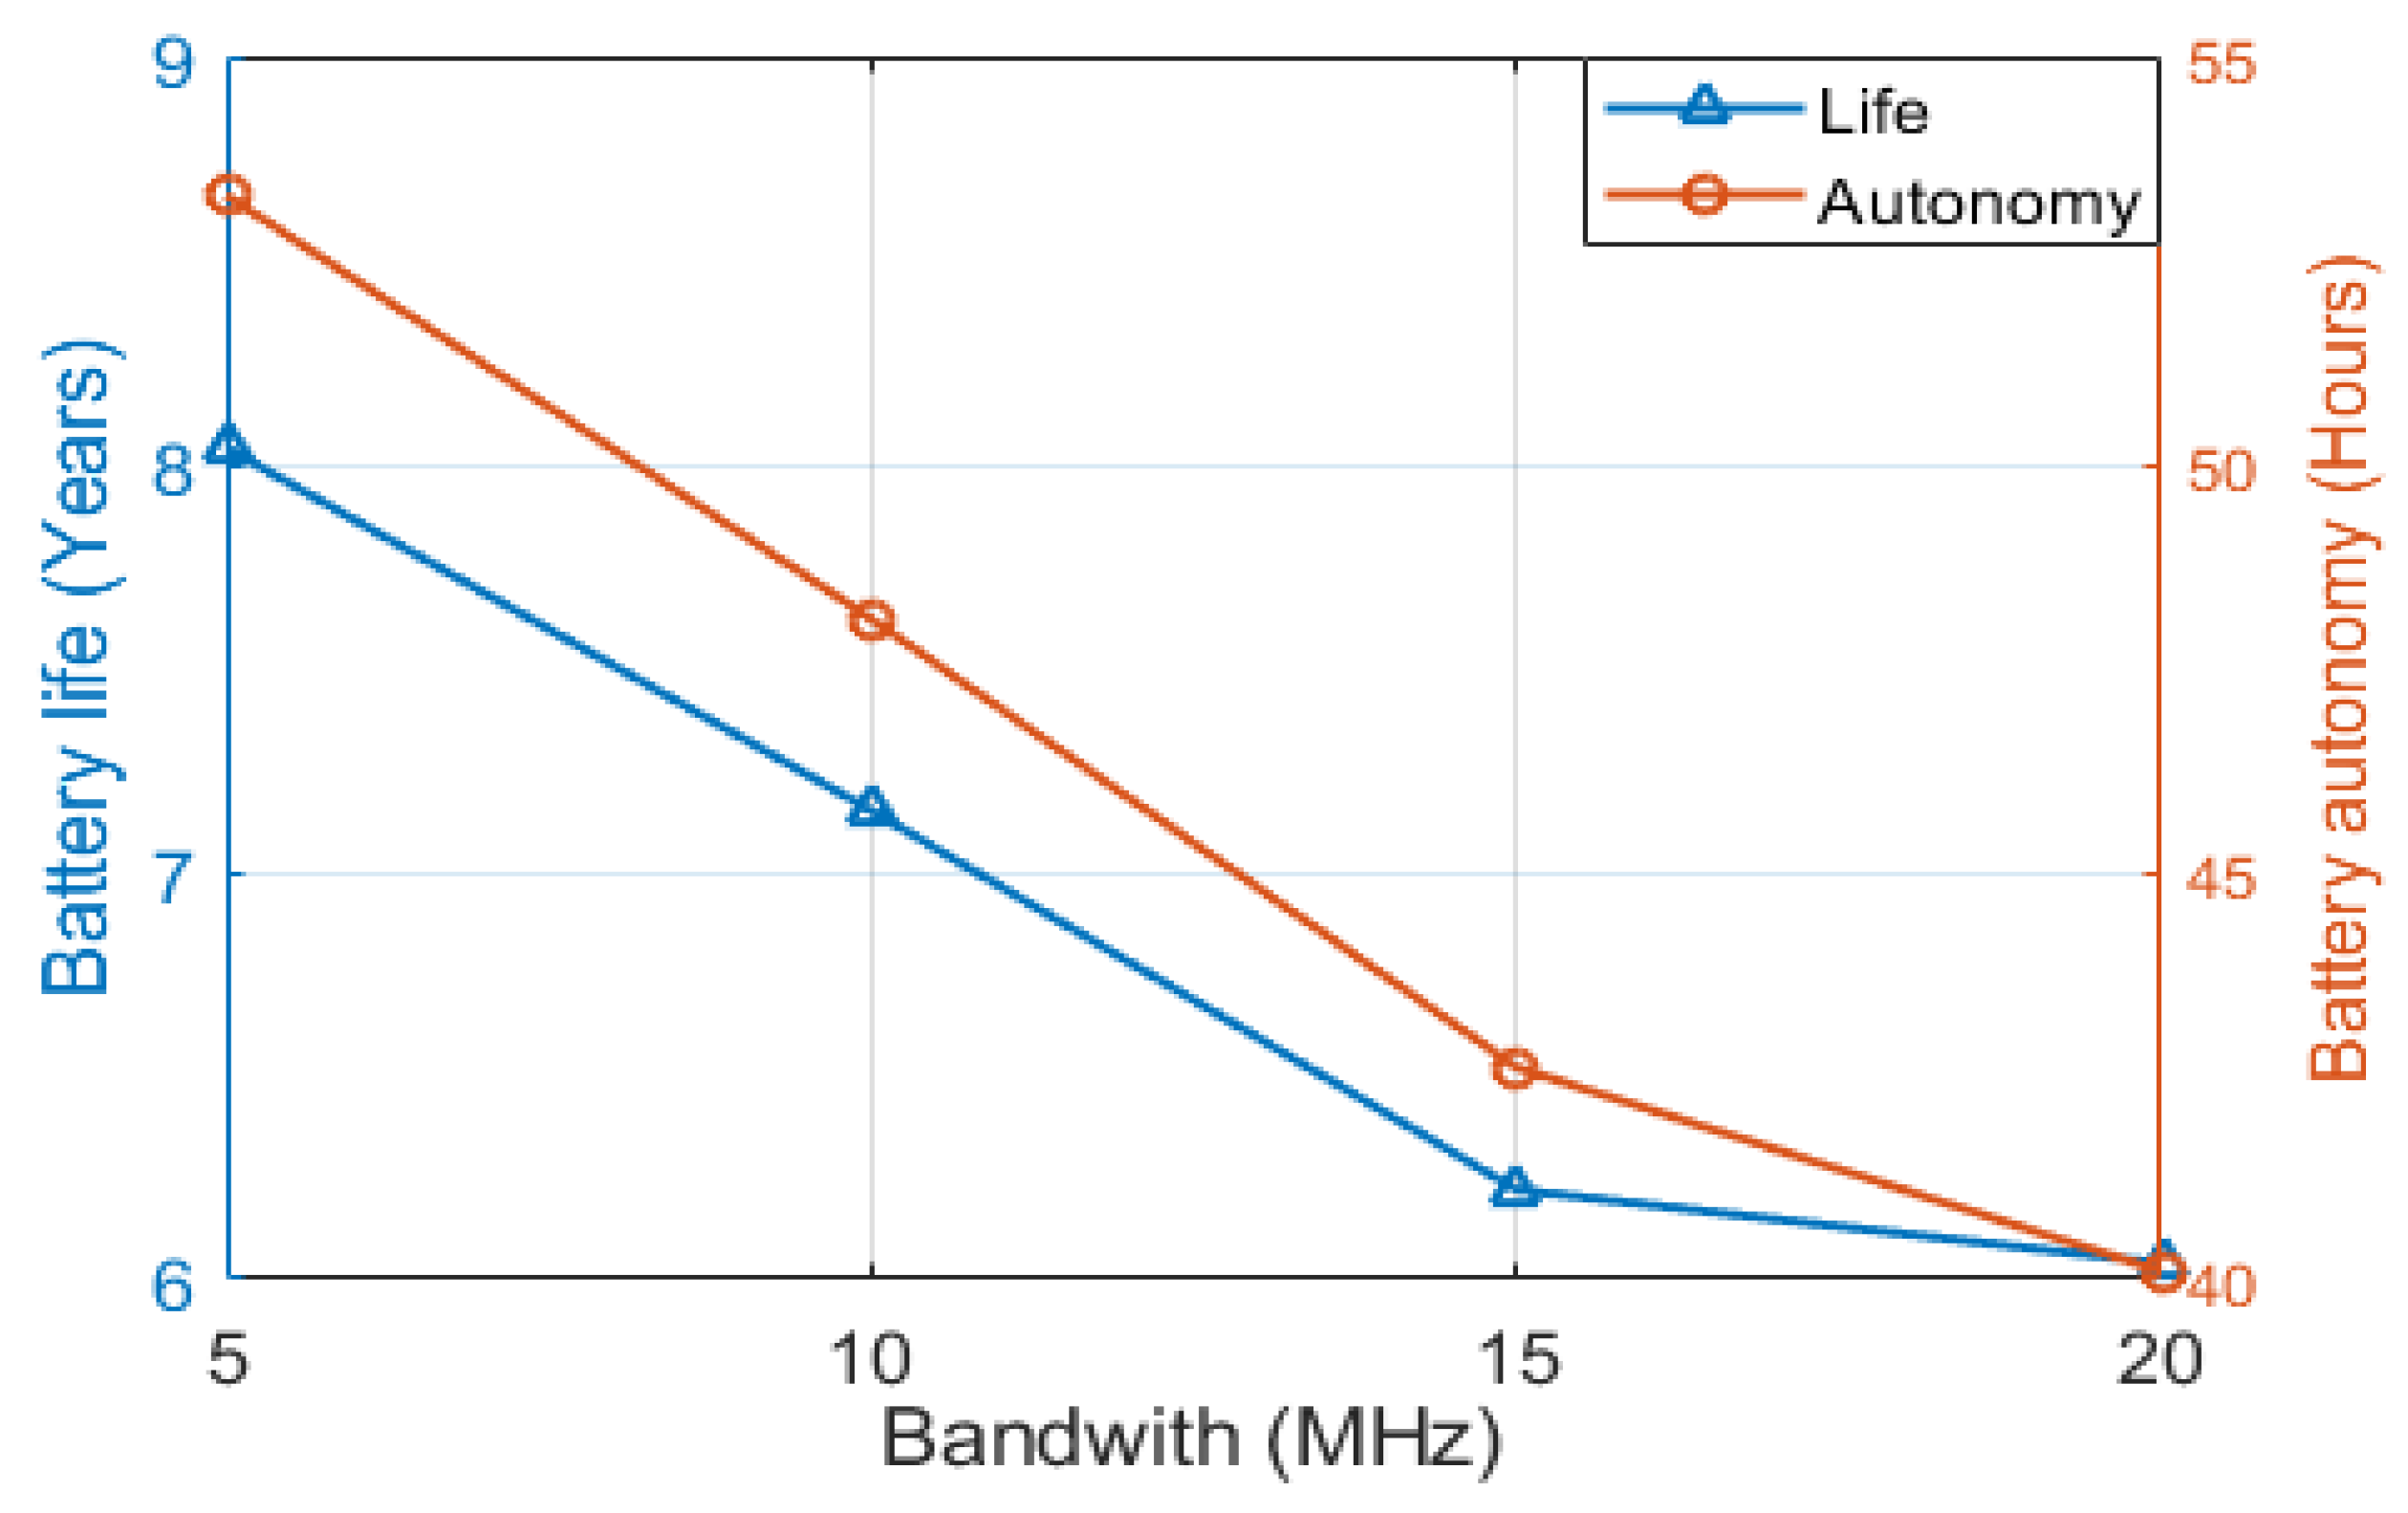
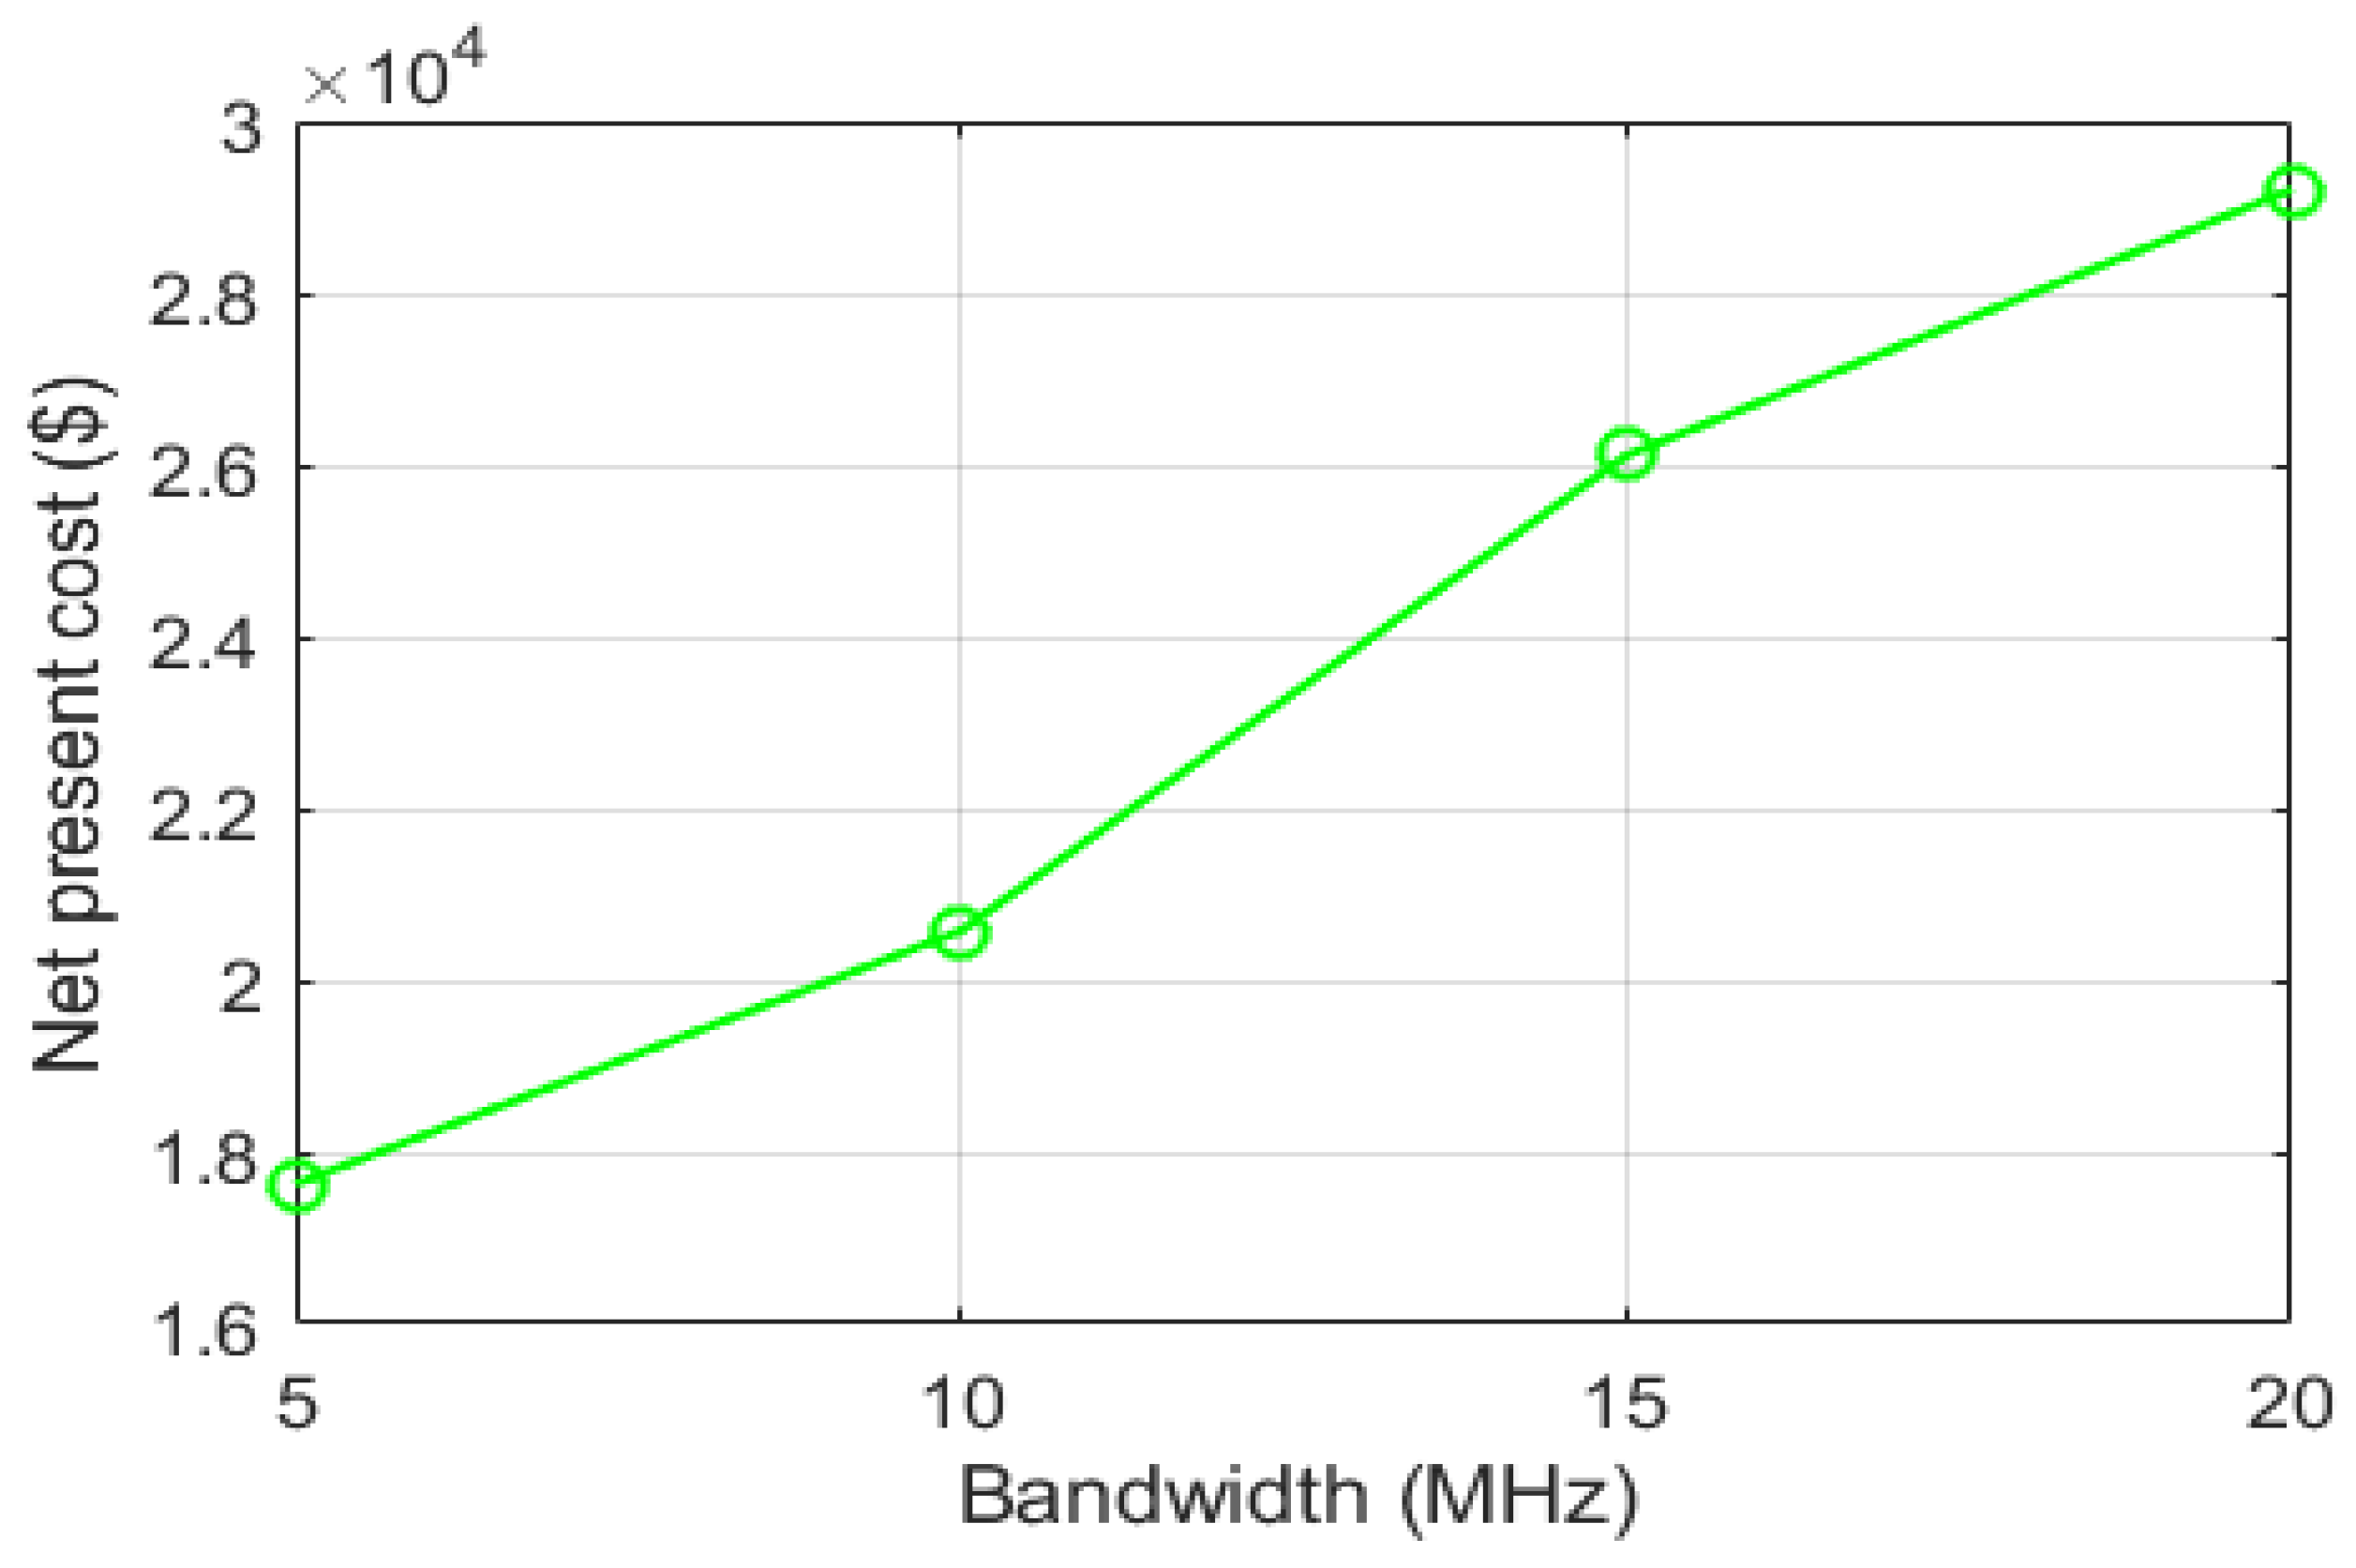
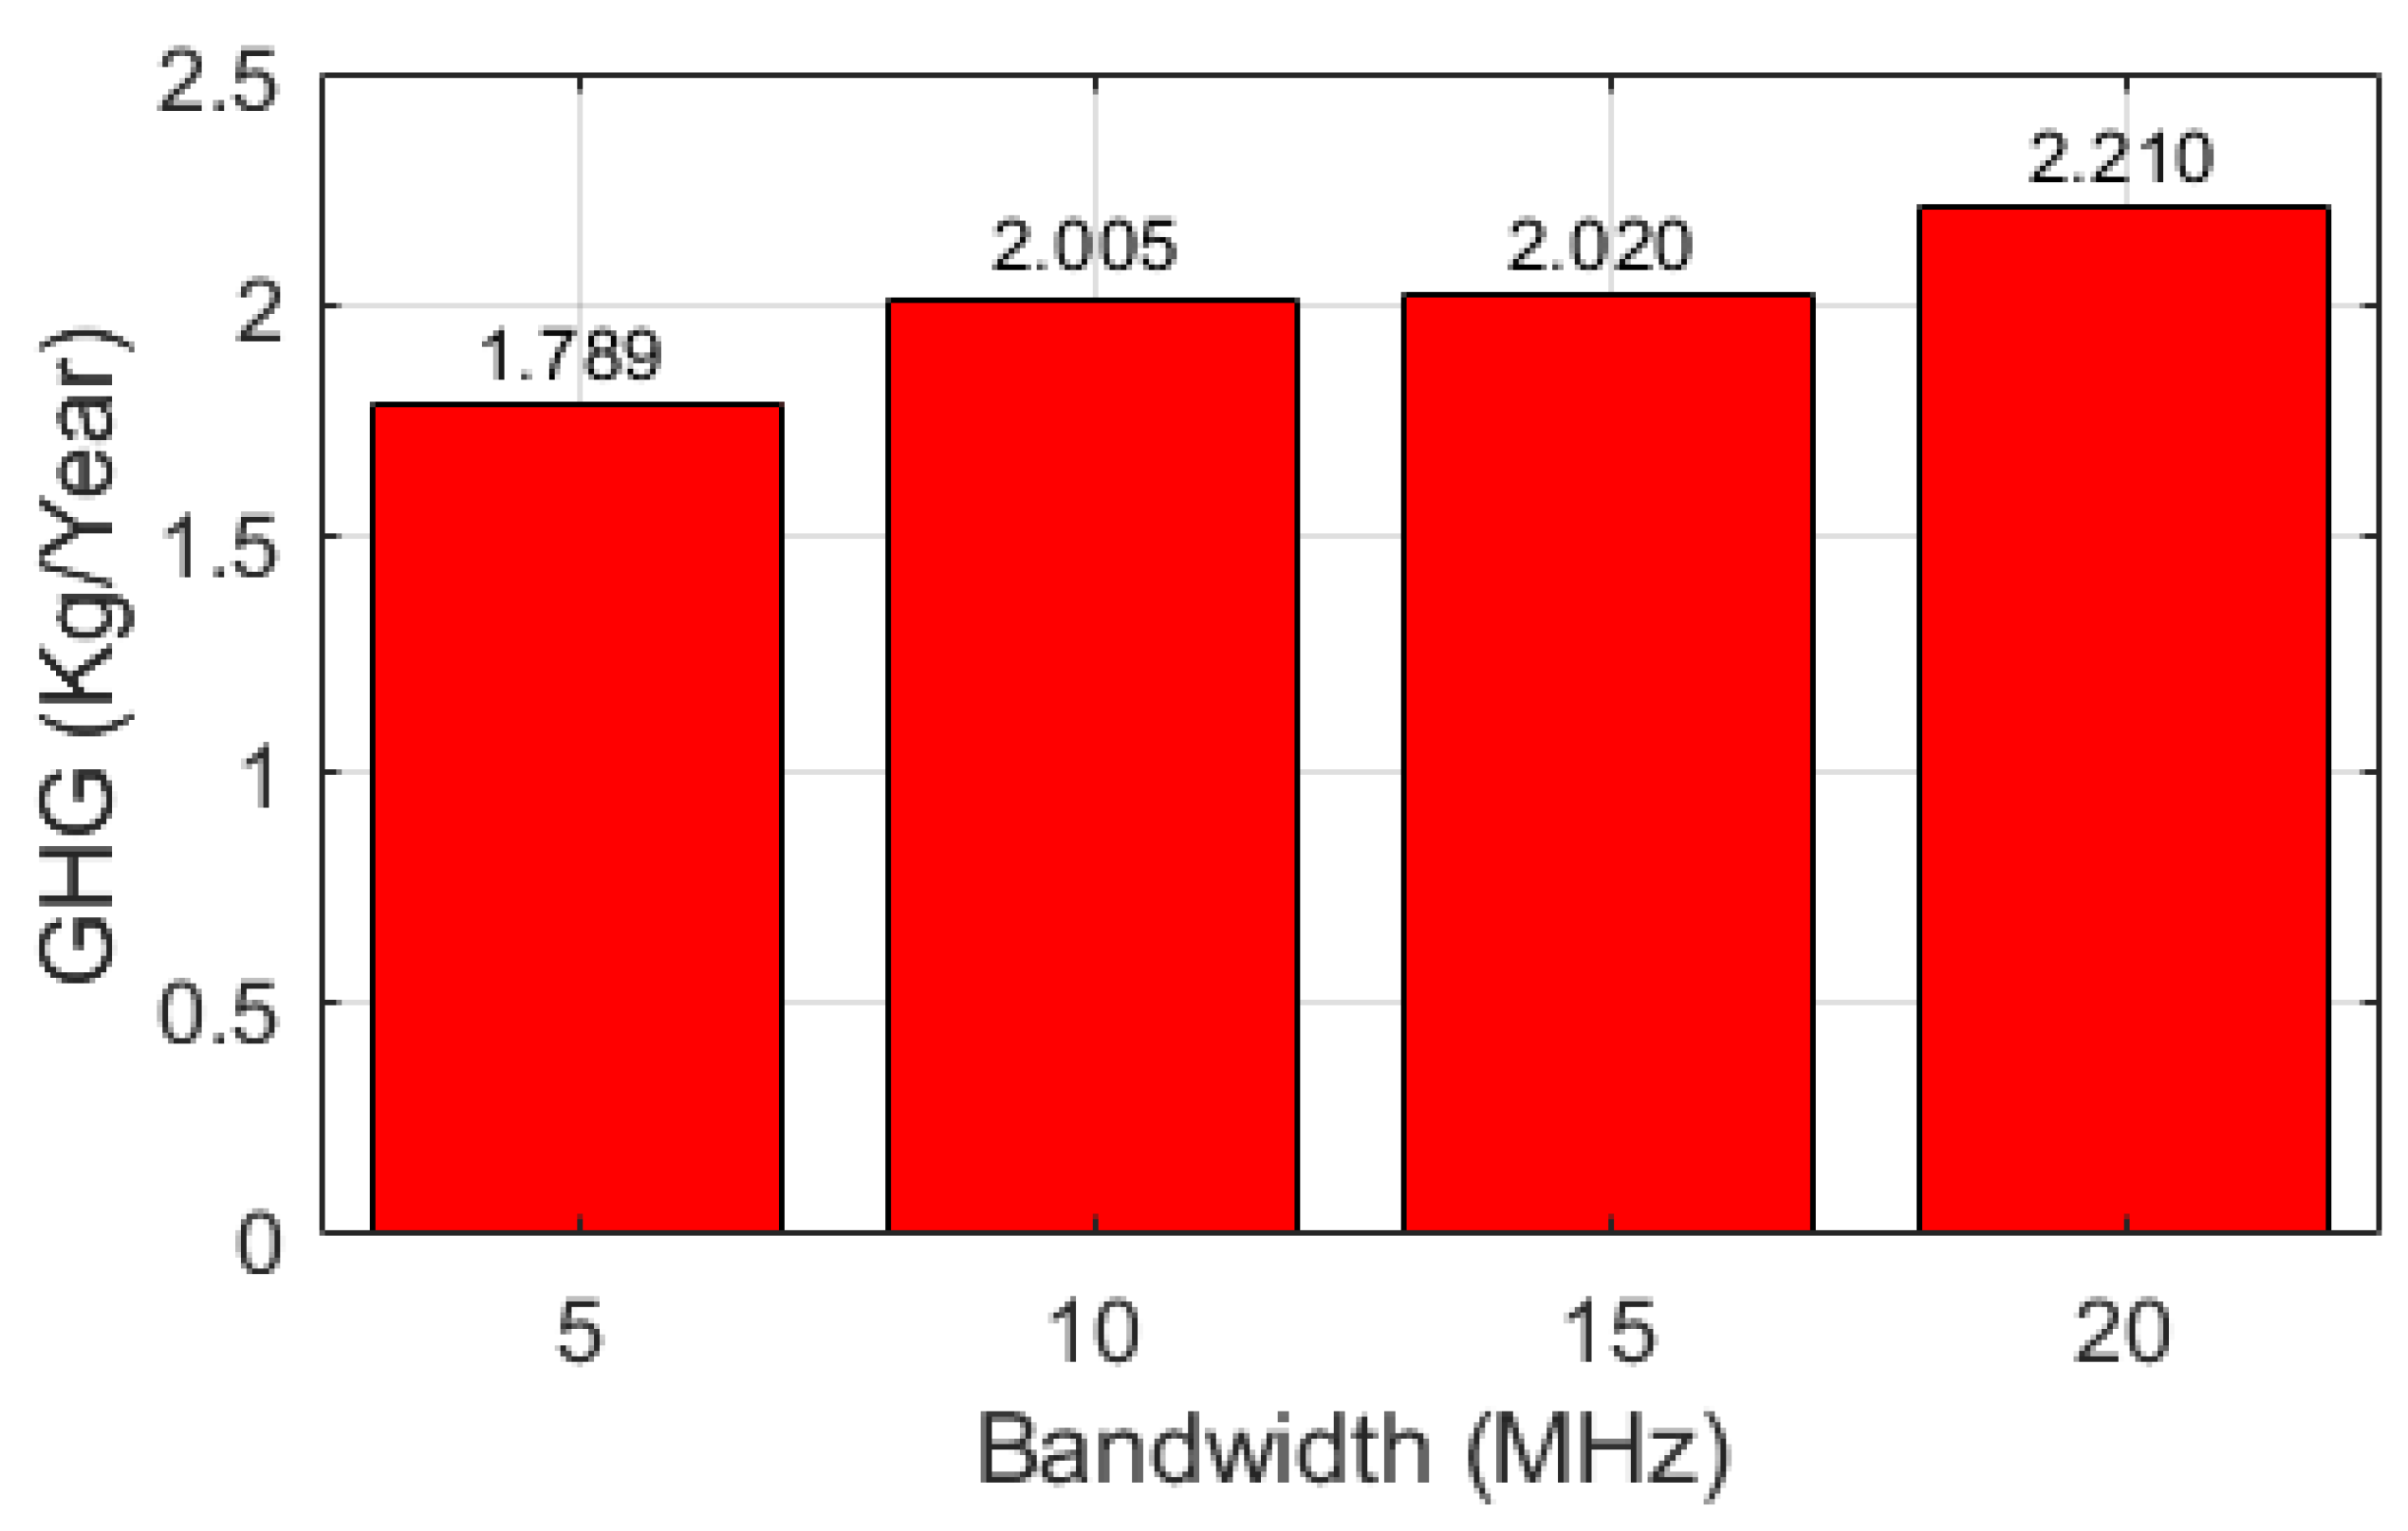
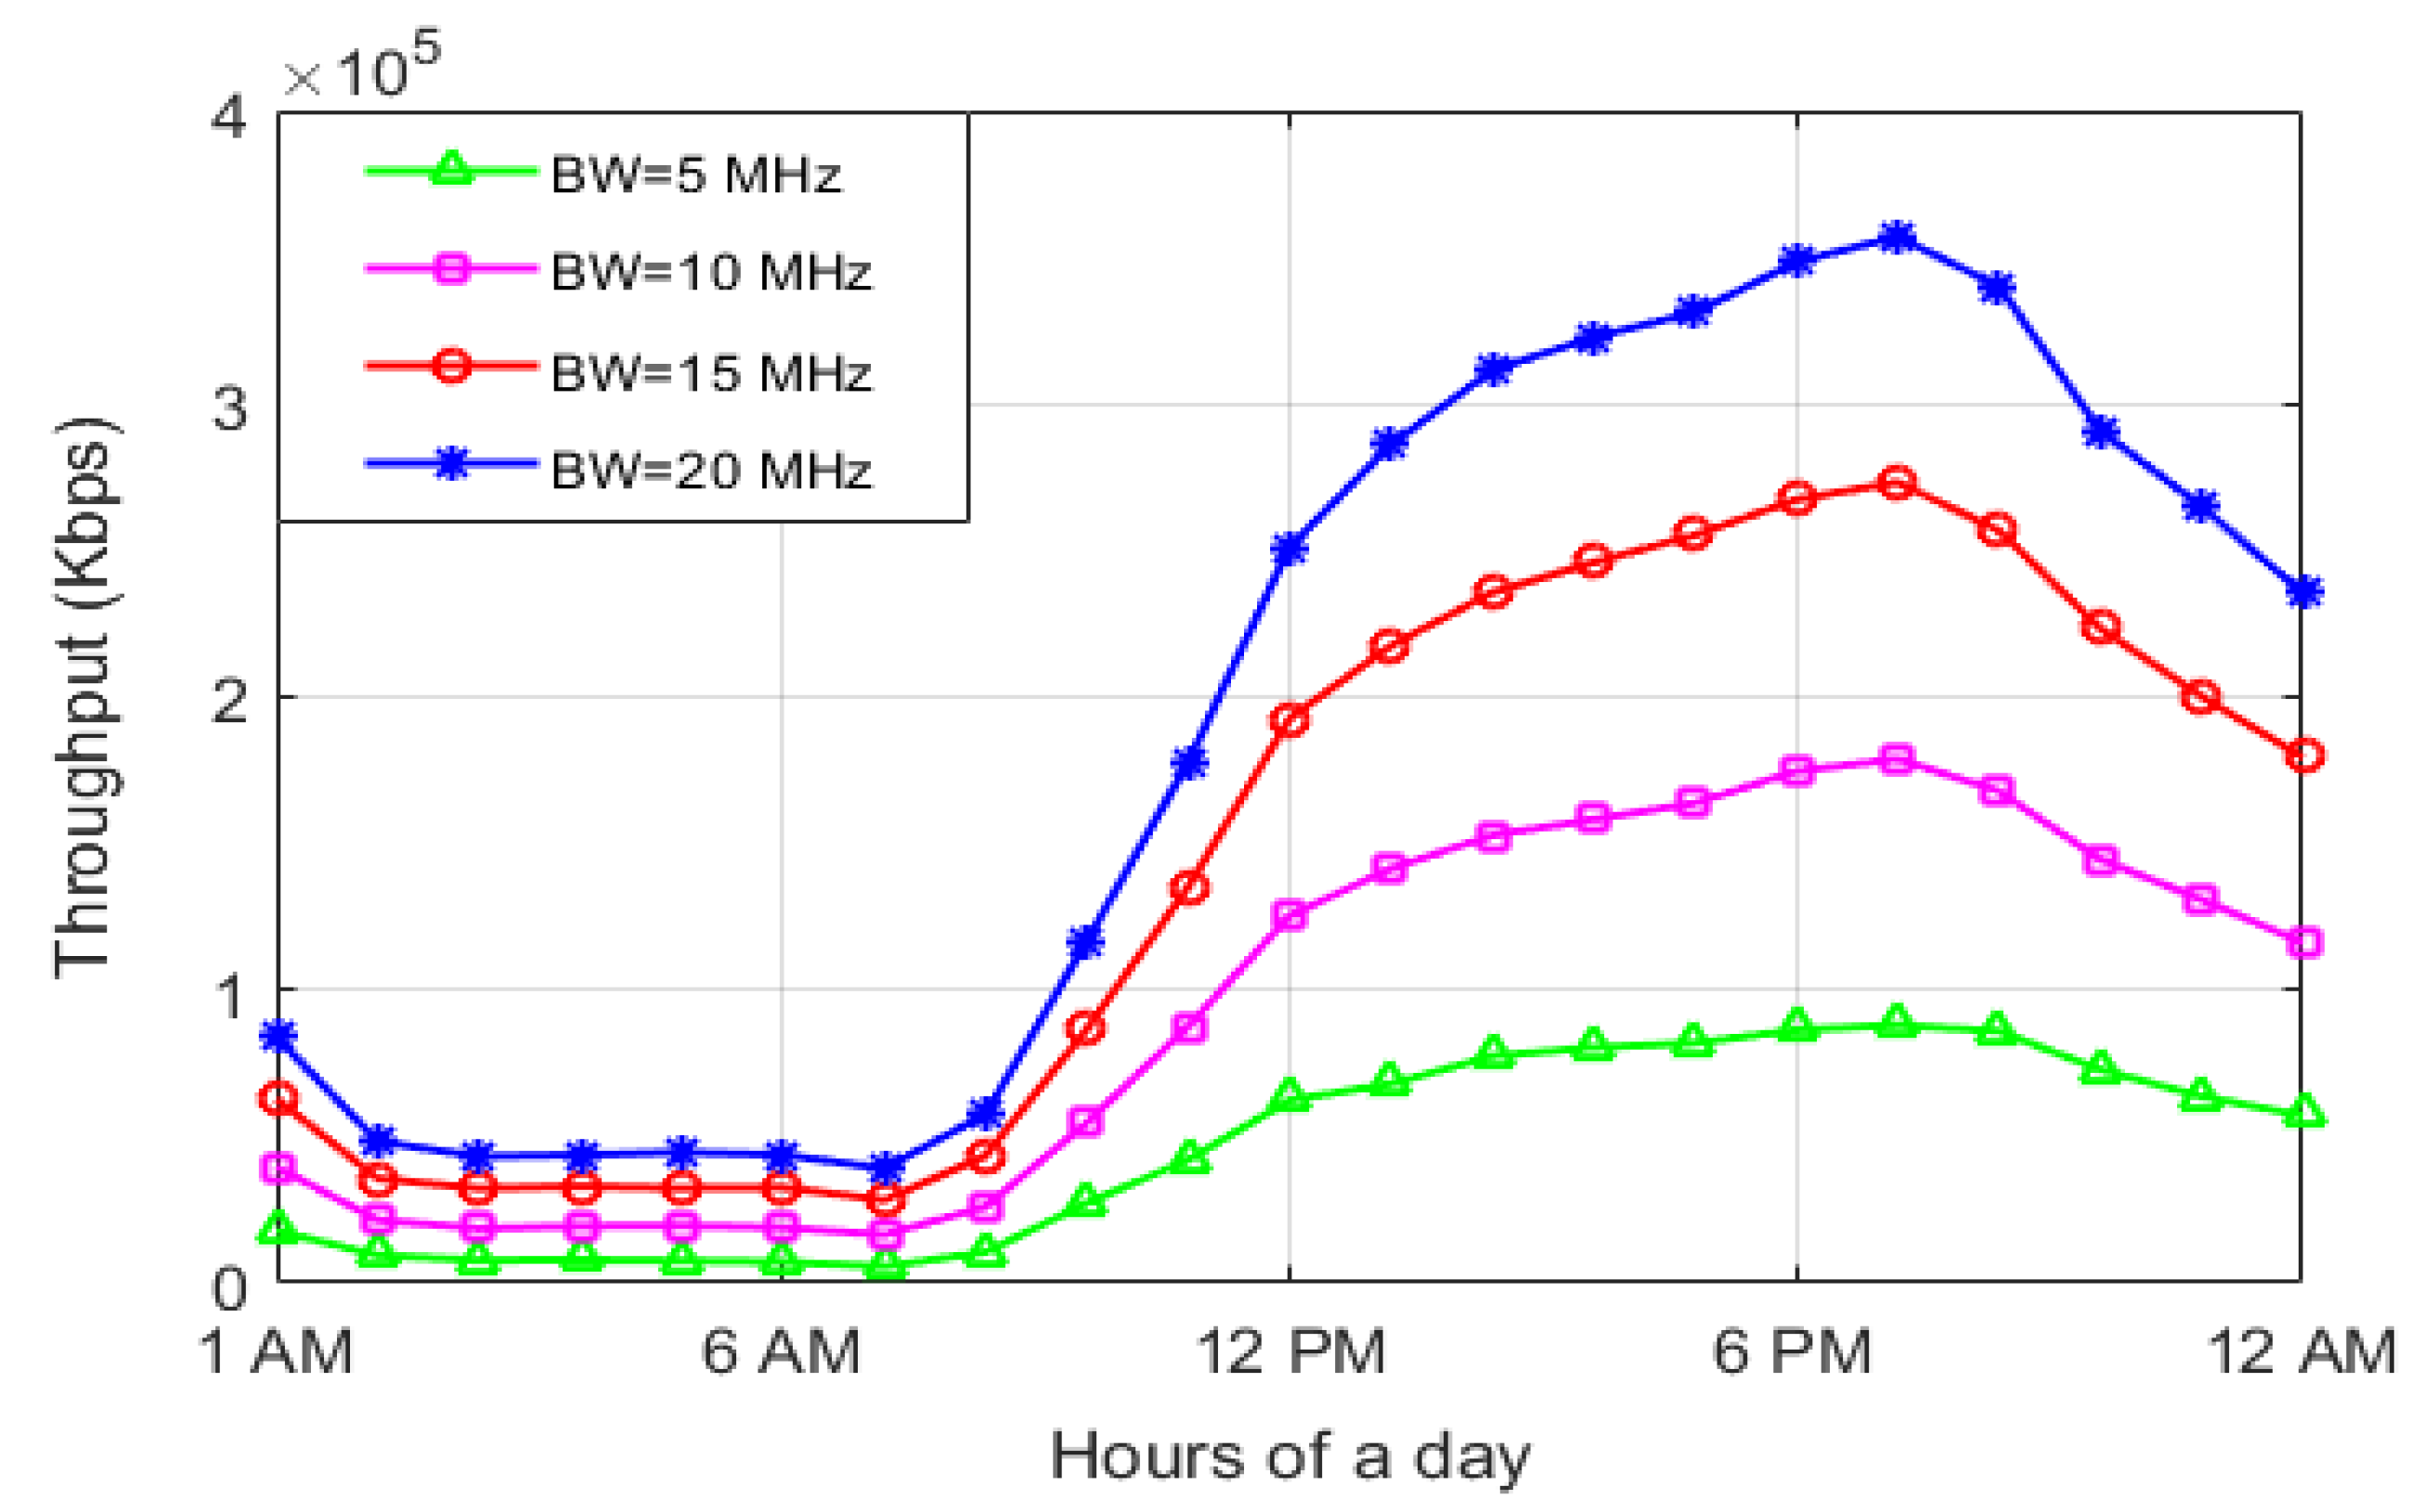
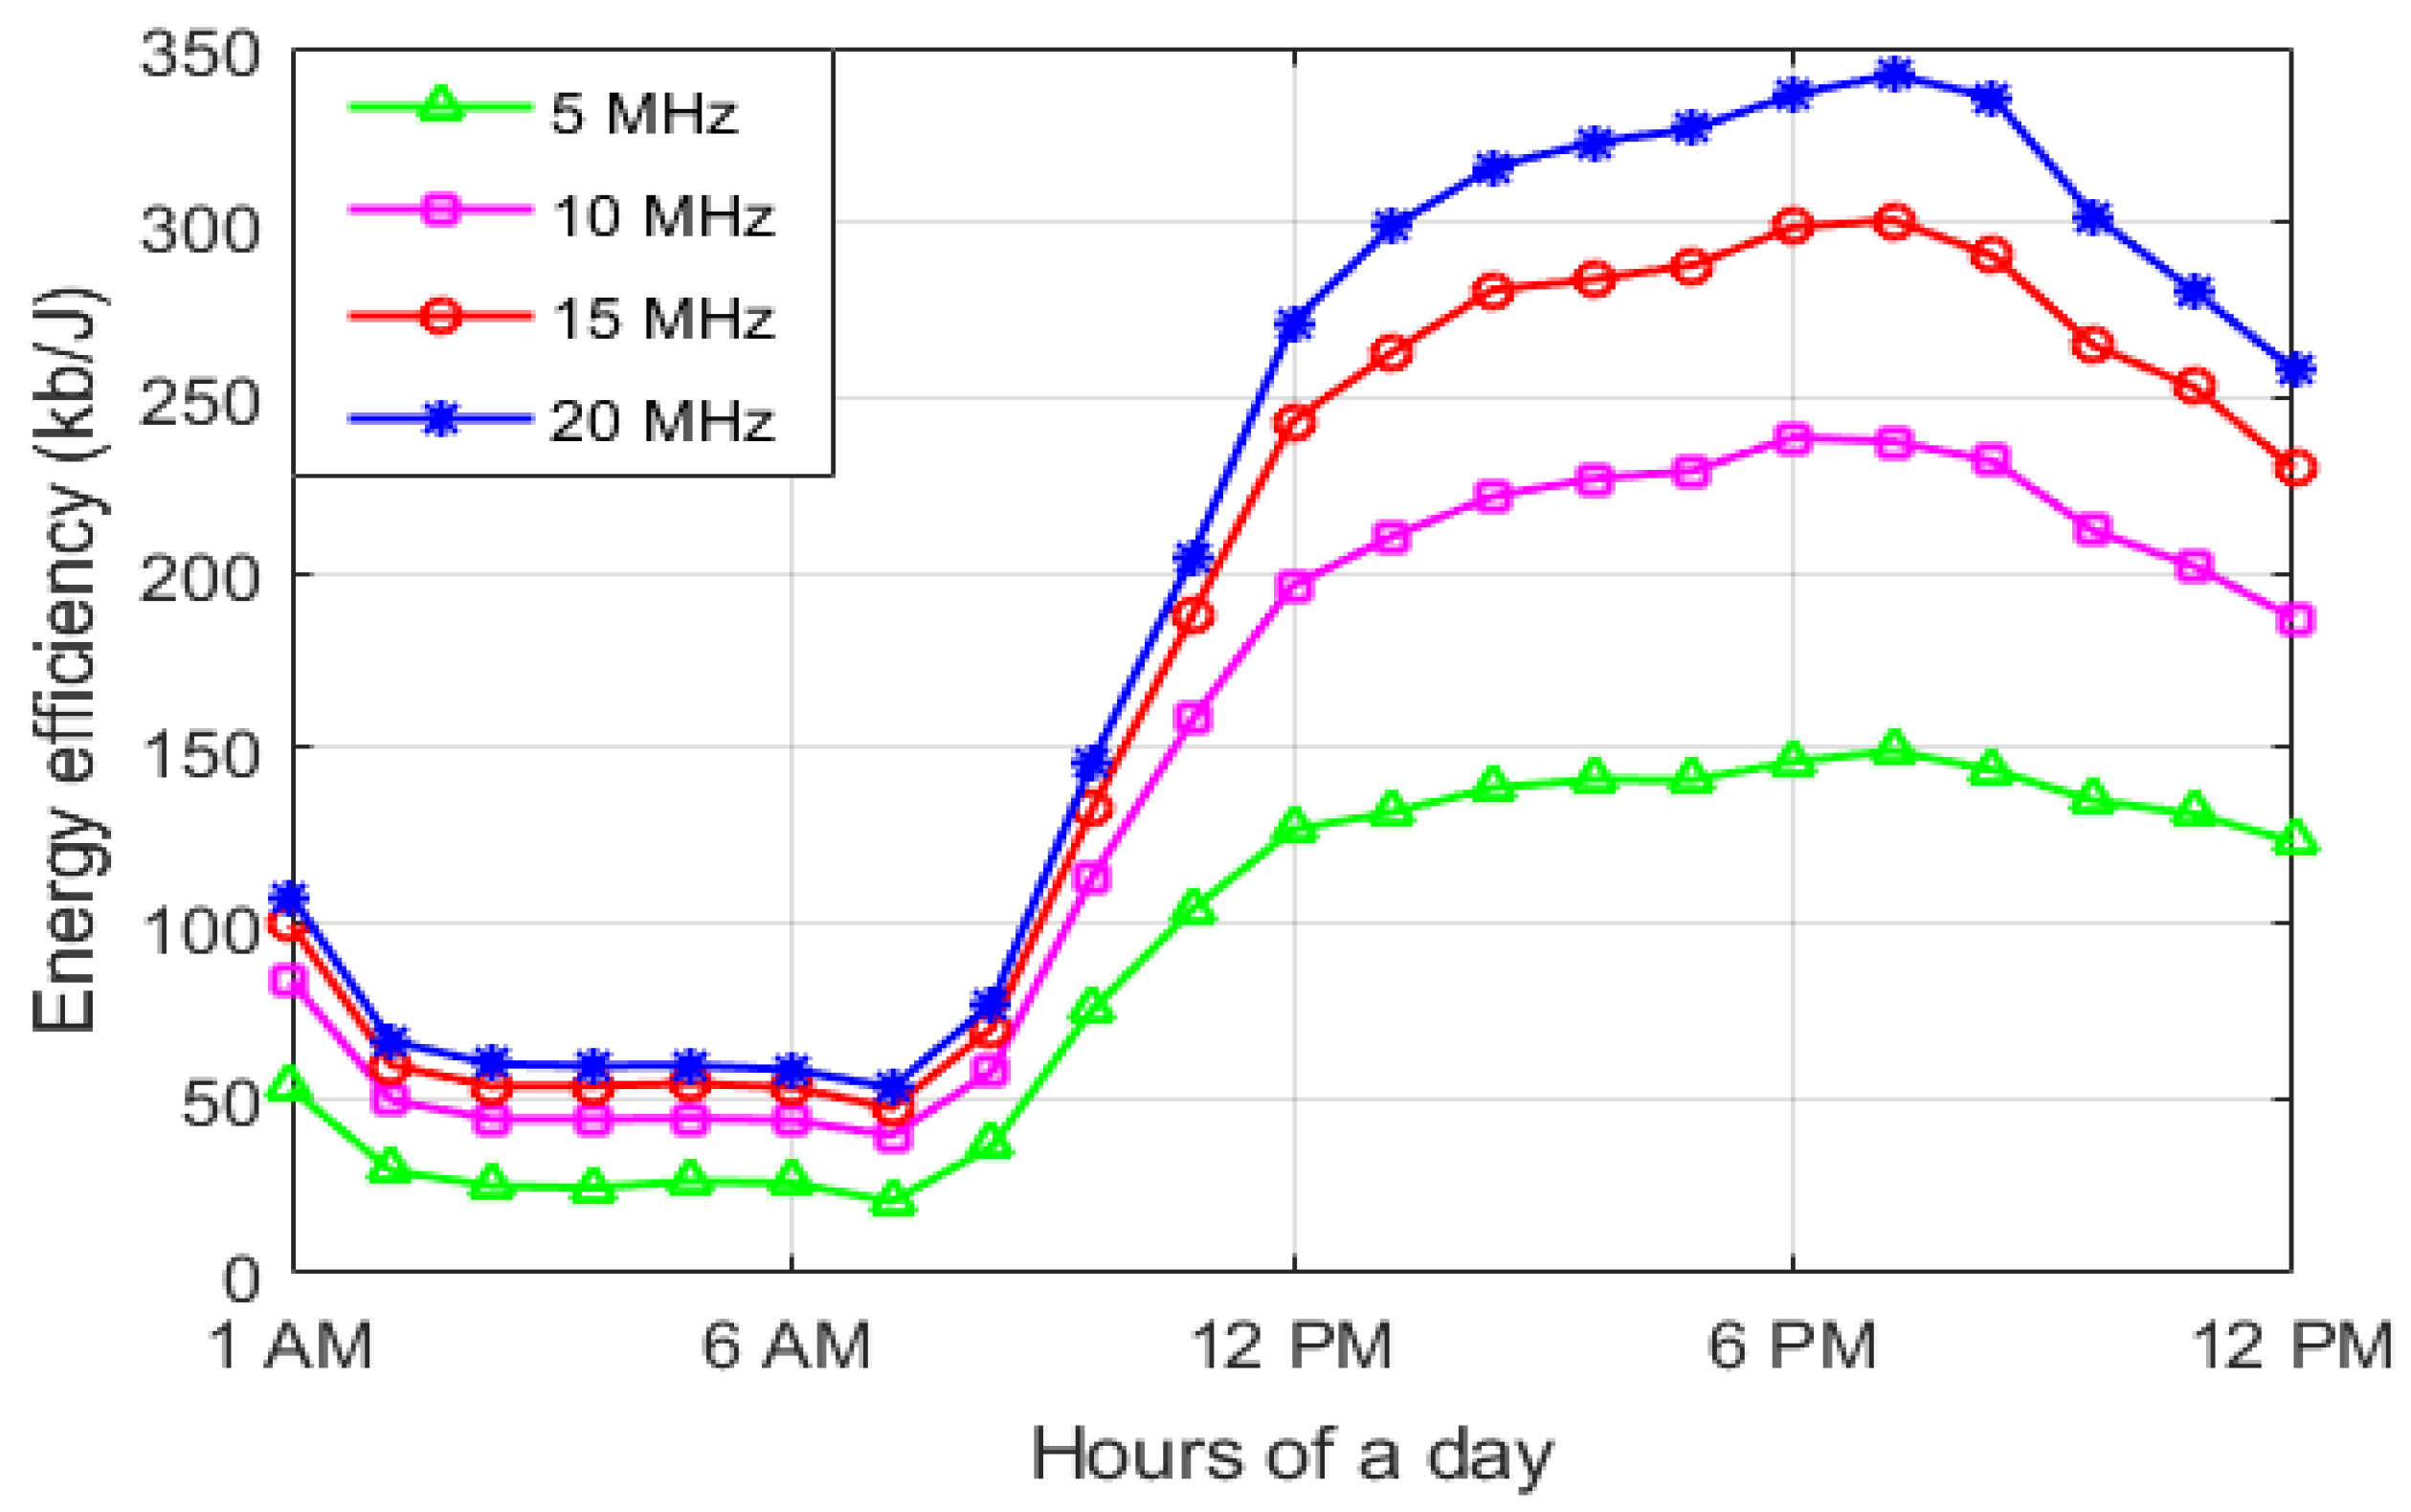
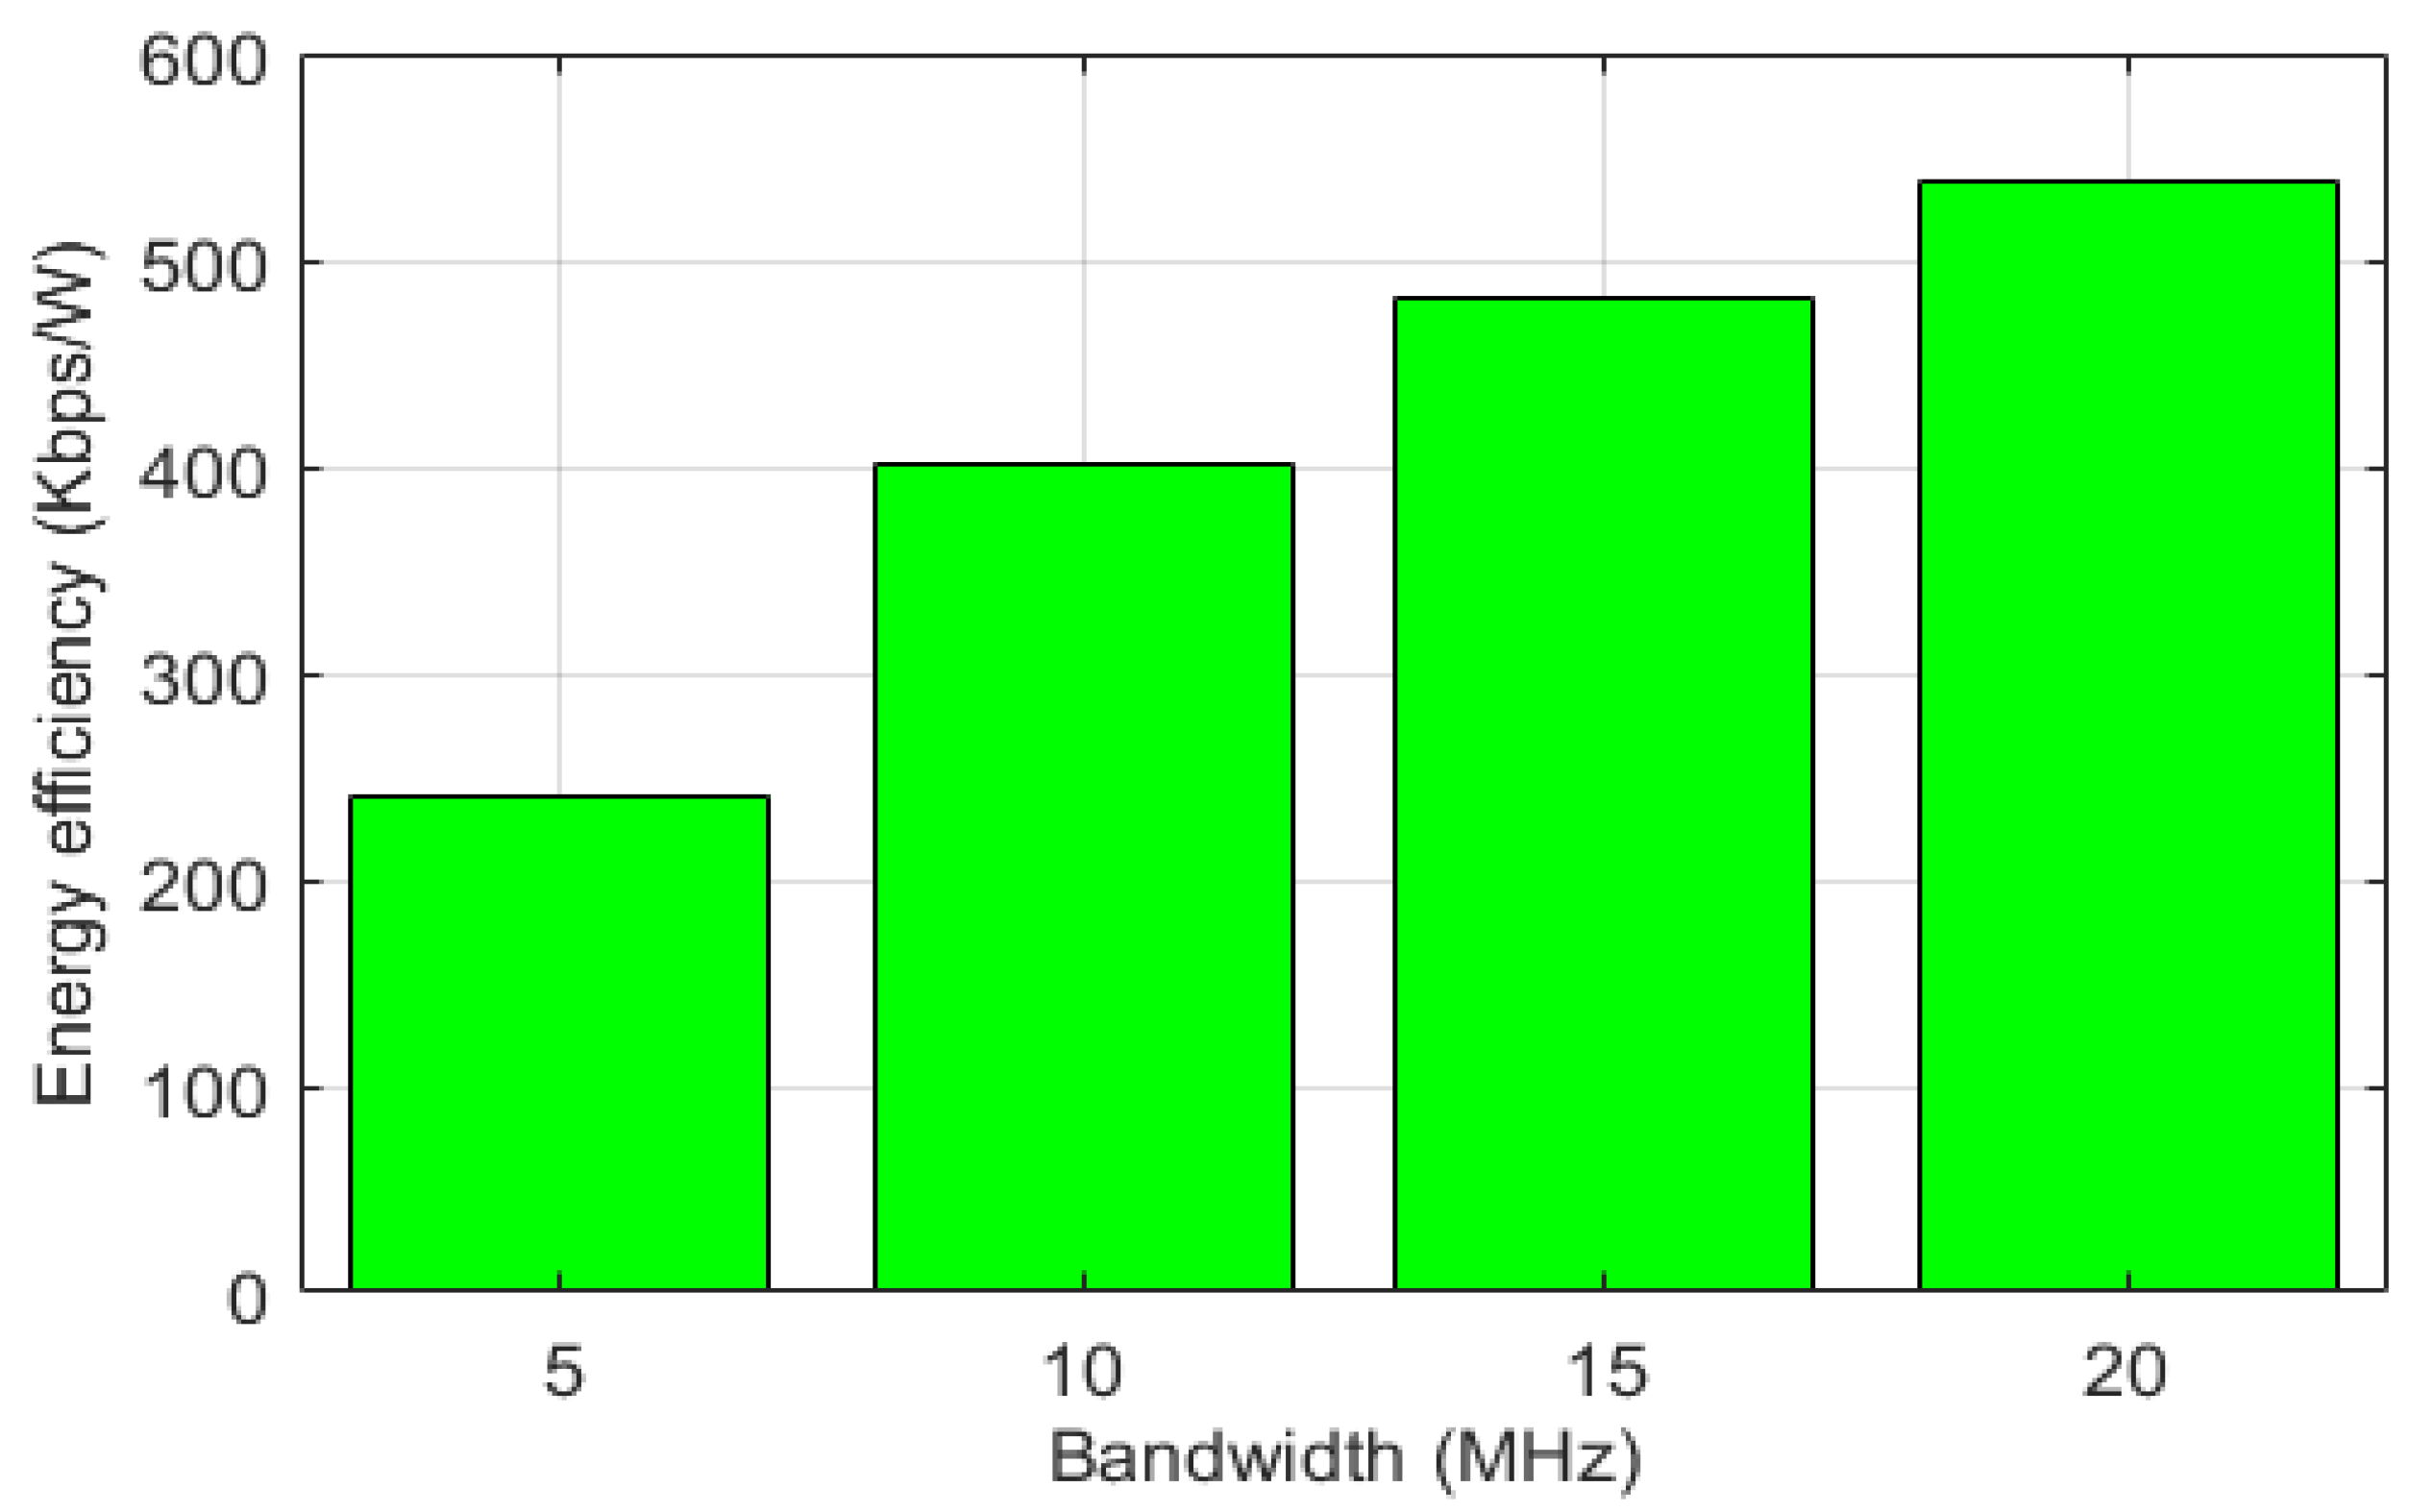
  • To investigate the system performance in terms of surplus electricity, carbon footprints, energy storage system, and cost of electricity varying system bandwidth. Additionally, we examine the performance of the wireless network with reference to energy efficiency, and throughput using MATLAB-based Monte-Carlo simulations considering the dynamic traffic profile.
  • Finally, a comprehensive comparison of system performance will be carried out with that of other power supply solutions and with the previously published research work to validate the effectiveness of the suggested system.
The arrangement of the rest of the article is described below: Section 2 discusses a review of relevant works. The discussion on the solar power model, the energy storage unit, the hydrogen production, and the fuel cell electrical system is presented in Section 3. The same part also presents a load dependent BS power model, the mathematical reliability model, and the method of energy collaboration. In Section 4, cost modeling and optimization problems are presented. Section 5 provides a comprehensive overview of the results and discussion on the proposed system. Section 6 compares the energy, economic, and cleanliness concerns of the proposed system to existing systems to support the validity of the network. This part also discusses the breakeven point for the hybrid supply system to determine economic stability. Finally, Section 7 finishes this study by analyzing the key results and gives the the directions for further research. Symbols and notations used in the following sections are summarized in Table 1.

2. Previous Work

Many research works were carried out to establish an energy efficient, reliable, and sustainable supply system that uses local renewable energy sources. Some of the academics advocate the mixing of multiple renewable or non-renewable energies with renewable sources, whereas others advise the incorporation of electricity grids with renewable or single renewable energies with sufficient storage facilities [13,14,15,22]. For instant, the authors in [23,24] propose a single solar photovoltaic energy based cellular network with an appropriate battery bank addressing important elements of the system. Different performance metrics such as optimal sizing, energy issues, economic issues, and environmental factors, have been rigorously evaluated in these studies including the dynamic nature of solar intensity. The references [25,26] studied the optimum system design and technical criteria set by the HOMER platform for the installation of hybrid solar-PV/diesel generator powered off-grid BSs across the world. The development of a solar PV/wind turbine (WT) powered isolated base station is studied in references [6,27]. A solar PV and biomass gasifier-focused energy supply was introduced in the references [28,29]. In the report [30], the optimization of the hybrid (Solar & Hydro) and diesel generator (DG) powered system for a distant BS was explored. These works offer exclusive methods to harvest energy from renewable energy sources with specific limitations. Firstly, the single RE technique may cause energy deficiency/outage. Secondly, wind power generation needs enough wind speed, which may normally be achieved in coastal locations and offshore islands. Finally, the establishment of the DG leads to the emission of enormous quantities of carbon footprints while biomass generators demand a big quantity of biomass, land, and water generally unavailable in all parts of the globe.
Recently, several investigations were carried out using the hydrogen energy storages system to obtain a better degree of dependability in the renewables system. Significant work has been done on the power to hydrogen to the power system (P2H2P) by concentrating on the technical obstacles to pick adaptive energy storage systems such as charge/discharge time, size, cost, safety & management, and life cycle problems [17,31]. In order to optimize the RE’s utility and to reduce investment costs, reference [32,33,34] evaluated the best schedule of RESS components. These investigations have revealed that an energy management strategy is important for the efficient use and optimization of P2H2P systems. Reference [35] proposed a smart management method for the efficient management of renewable energy resources microgrids by analyzing the various energy storage technologies including hydrogen. The development of a 100% renewable energy standalone microgrid system in West Australia (WA) has received a comprehensive evaluation of the hydrogen battery storage technology for renewable energy [17]. Reference [31] introduces a hybrid battery-hydrogen system for the South Australian (SA) grid, to produce a long-term sustainable renewable-energy storage system. After an in-depth evaluation of the technical criteria and the economic feasibility of the system using the “HOMER-Pro” optimized software, the present article states that the energy storage system based on hydrogen is cheap compared with the solely battery based energy storage system. Australia has already created a hub of power to hydrogen (P2H) to store renewable energy as a zero carbon energy carrier, inspired by the potential benefits of a hydrogen energy storage system [36,37]. Reference [38] has suggested two approaches for efficient integration of renewable into the hydrogen energy system, addressing future problems and potentials of the hydrogen energy system. Authors in [18,39] have examined the importance of the hydrogen carrier and the pathway of hydrogen generation to support a statement of energy and industry globally. The articles [21,33,40] examined the key problems and technology criteria of P2H2P to maximize renewable energy profitability and decrease investment costs. These research investigations have revealed that the energy management approach is based on the most efficient use of P2H2P systems and the greatest RESS performance. The effective design of the supply scheme and the development of contemporary control algorithms is thus essential to integrate the hydrogen in renewable energy sources and provide it to the load/grid.
Despite extensive literature study about the technical, economic, and greenhouse gas (GHG) assessment of the hybrid P2H2P, there is no research available to identify the potentials of the renewable energy-powered cellular base station using hybrid as energy storage. The purpose of this research work is to analyze the techno-economic feasibility and environmental impacts of a 100% RE-based cellular network with hybrid energy storage devices for off-grid areas in Bangladesh. The results of this study will be beneficial for the telecom industry, the authorities in the power sector, and government bodies in the installation of a power supply unit with hydrogen energy storage to supply power to the off-grid base stations and community.

3. System Description

The optimum architecture of the systems and the modeling of the various components of the hybrid supply system are important factors for the development of the economically viable green cellular system. This section concisely describes the principal components of the hybrid system and provides related mathematical modeling. The optimum design improves output power and guarantees the lowest net present costs (NPC) with excellent system reliability. In particular, the hybrid supply system dimensions take account of the tempo-spatial fluctuation of the solar and traffic intensities throughout different network topologies using HOMER optimizing software.

3.1. Network System

This research work examined a long-term cellular macro base station of a two-tier downlink format with a hexagonal shape. Figure 1 illustrates the design of the planned 2/2/2 antenna arrangement. The hybrid solar PV/H/FC system with an energy management unit (EMU), an inverter, and adequate storage devices drive (hydrogen tank and battery bank) connected to the macro BSs. An EMU protects the battery from overload and severe discharge. The BS usually has DC loads along with certain AC loads such as air-conditioning and illumination as auxiliary equipment. In this connection, we examine just a 30 W AC lamp connected to the BS from 6 p.m. to 6 a.m. No refrigeration system is necessary for the remote radio head (RRH) enabled macro base station as an antenna and the baseband unit (BB) are coupled with a fiber-optic connection instead of a coaxial cable [41]. A 2/2/2 long-term evolution (LTE) macro BS running at 20 W (43 dBm) and 40 W is well known (46 dBm). In this work, 20W has been selected as it is often utilized for transmitting power. The phrase 2/2/2 refers to three sectors with two antennas in each sector.

3.2. Base Station Load System

The energy consumption of a typical base station is dynamic and dependent largely on the traffic profile of the BS. The overall power consumption of BS can be expressed by the following equation [41]
P B S = M s e c [ P 1 + Δ p P T X ( χ 1 ) ] , if 0 < χ 1 M s e c P s l e e p , if χ = 0 ,
where P 1 = P 0 + Δ p P T X represent the peak power drawn by the base station, Δ p is the load reliance power slope, and P 0 is the power drawn at idle state, P s l e e p is the power drawn at sleep mode. The symbol χ is the load segment. The key factors and the power consumption of each element of the macrocell with RRH for P T X = 20 W is summarized in Table 2 and Table 3 respectively. The baseband and radio frequency (RF) power consumption for the other transmission bandwidth (BW) is obtained from reference [41]. In addition, the specified area’s dynamic traffic profile is illustrated in Figure 2.

3.3. Power to Hydrogen to Power System

The P2H2P system may be used as a battery-like energy storage device but with hydrogen as an energy carrier functioning as a battery medium. The function of the fuel cell hydrogen system can be separated into three particular phases: (1) the stage of generating hydrogen; (2) the period of storage, and (3) the utilization/application phase. In the phase of hydrogen generation, water is electrolyzed by the use of solar PV power to produce hydrogen using electrical electrolyzers. In the second phase, the hydrogen is stored in steel composite vessels through specific pressure. Hydrogen is then transferred to the fuel cell to produce electricity during the utilization stage. P2H2P systems are characterized as the round trip efficiency ( η ) can be expressed as follows [17]
η R o u n d t i p = η E l e c t r o l y z e r × η F C
There were three major elements in the P2H2P system: the electrolyzer, the storage hydrogen, and the fuel cell. A short description of these major elements are presented in the below subsection.

3.3.1. Electrolysis

An electrolyzer transforms electrical energy into chemical energy that is commonly known as the electro-chemical method for producing hydrogen through the electric method. Electrolysis is the electrical process that divides water into hydrogen and oxygen. Fuel cell systems are used in this process to generate energy by the chemical reaction of hydrogen in the electrolyzer. The use of renewable energy resources via a water electrolysis route can create renewable (green) hydrogen. The following anode and cathode reaction represents the electrolysis method by the following equations [42,43]
A n o d e R e a c t i o n : 2 H 2 O O 2 + 4 H + e
C a t h o d e R e a c t i o n : 4 H + e 2 H 2
There are several problems in electrolyzer use and dimensions, such as production capacity for H 2 , excess availability of energy, and the number of start/stop cycles. The development of electrolysis (electrolyzers) technology has also made P2H systems a viable portal to the hydrogen economy.

3.3.2. Hydrogen Storage

An independent power system needs a load-compatible storage system when the energy produced is not enough. The economic and technological benefit of a hydrogen gas storage system over a battery storage system can be found in the case of a long-term storage system. Several techniques are offered for the storage of hydrogens such as liquefied hydrogen, compressed gas, or materials [42,43]. This study offers physical compressed gas technology (i.e., 350 bar) in durable tanks. It is shown in the literature that hydrogen storage technology is the most developed and economically feasible.

3.3.3. Fuel Cell

One of the most appealing and promising solutions for hydrogen use is fuel cells. An electrolyte membrane placed between two electrodes (anode and cathode) covered with the catalyst is called a fuel cell. Fuel cells are essentially the opposite of electrolysis. In fuel cells, hydrogen becomes mixed with non-combustible oxygen in an electrochemical process and generates power. The anode, cathode, and overall reaction in the fuel cell are shown in Equations (5)–(7) respectively. Figure 3 shows the characteristics of the fuel cell [42,43].
A n o d e R e a c t i o n : 4 H + e 2 H 2
C a t h o d e R e a c t i o n : 2 H 2 O O 2 + 4 H + e
O v e r a l l R e a c t i o n : 2 H 2 O + H 2 H 2 + O 2 + 4 H + e

3.4. Solar PV System

The solar PV system gathers and transforms solar energy into DC electrical energy [44]. To produce more energy, several solar cells are linked in series and/or parallel combinations. The monthly statistic of solar radiation and clearness index of the selected location is prsented in Figure 4. HOMER uses the following formula to determine the energy harvested by the solar PV system [6].
E P V = R P V × P S H × η P V × 365 D a y s / Y e a r
where R P V is the rated size, P S H is the maximum solar hour in an hour comparable to average direct sunlight per day in kWh/m 2 /Day [6].

3.5. Converter System

An electrical device that transforms AC voltage into DC and DC voltage into AC is known as a converter. The size of the inverter can be estimated by the following equation [6]
C i n v = ( L A C η i n v ) × σ s f
where L A C represents the maximum AC load, η i n v represents the efficiency of the inverter, and σ s f represents the safety factor.

3.6. Battery Bank System

The battery bank’s back power depends mostly on the autonomy of the battery bank B A u t . The discharge current (A) versus capacity (Ah) characteristic of the Trojan L16P battery is demonestrated in Figure 5. The duration of the battery bank can supply without outside assistance affects its autonomy and may be estimated as follows [6]
B A u t = N B a t t × V n o m × Q n o m × ( 1 S O C m i n 100 ) × ( 24 H / D a y ) E B S
where V n o m is the nominal voltage of a single battery (V), Q n o m is the nominal capacity of a single battery (Ah), the battery S O C m i n indicates the lower threshold limit of battery discharge [6].
Another major problem that impacts the overall project’s substitution costs is battery lifespan. The battery bank’s lifespan ( L B a t t ) may be measured by the following equation [6]
L B a t t = m i n ( N B a t t × Q L i f e t i m e Q T h r p t , R B a t t , f )
where L B a t t is the lifetime throughput of a single battery (kWh), Q L i f e t i m e is the annual throughput (kWh/year) of the battery, and R B a t t , f is the float life of the battery bank in a year.

3.7. Methodology of the System

Due to the direct influence on overall project costs, the project’s lifespan and yearly interest rate are essential for assessing the economic viability of the project. The lifetime of the BS equipment and the long-standing viability of the proposed system reflect the project period of 20 years in this simulation. The yearly interest rate is 6.75%, which is the interest rate of Bangladesh bank. In the telecom industry, the energy deficit or failure is not desirable. Therefore, both the BS system and the backup system must be supplied with power by adequate sources. Consequently, 10% of power is conserved to ensure a capacity shortfall of zero percent annually and to supply backup power to the BS load at a certain reduction in renewable energy production. Besides, HOMER software provides the optimum criteria through several sets of sizes, cost factors for different components such as solar PV panels, electrolyzer, hydrogen tanks, converters, battery units, and solar resource profiles in the selected region. To meet the BS load requirements and maintain sufficient backup power at the lowest NPC, HOMER optimization software is an effective tool that takes decisions at every step of the simulation. Table 4 provides a summary of technical specifications, and economic parameters employed in this simulation scenario. The architecture for the proposed system in the HOMER platform is illustrated in Figure 6a,b and Figure 7a,b for 5 MHz, 10 MHz, 15 MHz, and 20 MHz, respectively. Figure 8a represents the DC load profile of the macro cellular base station over 24 h. This seasonal DC profile of the macro BS is derived from Equation (1) under 10 MHz system bandwidth. Figure 8b represents the AC load profile (30 W AC lamp) which remains on from 6 p.m. to 6 a.m.

4. Cost Modeling and Optimization

4.1. Cost Modeling

The HOMER optimization software is used in this work to determine the optimal architecture of the solar PV/H/FC hybrid supply system, which fulfills user-specified constraints with the lowest net present costs (NPC) including initial cost capital (CC), cost replacement (RC), cost of operation and maintenance (OMC) and salvage value (SV) throughout the project life cycle. These expenses can be used to assess the economic viability of the suggested model. The net current system cost may be calculated by the following equation [6,26]
N P C = T A C C R F = C C + R C + O M C S V
The acronyms T A C and C R F are the total annualized system cost and capital recovery elements that may be calculated using (13) and (14) respectively [6,26]
T A C = T A C C C + T A C R C + T A C O M C
C R F = i ( 1 + i ) N ( 1 + i ) N 1
where N is the lifetime of the project and i is the annual real interest rate. The costs left at the end of the project are called salvage values that are assessed by [31]
S V = C R C ( C R L C L )
where C R C , C R L , and C L are the replacement cost, remaining lifetime, and a lifetime of the component respectively.
Cost of energy is expressed as the ratio of the total annualized cost (TAC) to the annual energy production ( E G e n ) by the hybrid supply system [37]. COE measures the per unit electricity generation cost ($/kWh) that can be represented as follows [6,26]
C O E = T A C E G e n = N P C × C R F E G e n

4.2. Problem Optimization

The challenges of designing hybrid energy systems is presented as an optimization problem to decrease NPC under different designs and operational limitations. Our primary objective is to minimize the energy deficit by using solar and fuel cell energy as a maximum in combination with a battery bank and hydrogen tank, which will in sequence lower NPC. The objective function of the system may be described as the problem of the design of a hybrid energy system. It is presented as an optimization problem, to minimize NPC subject to different design and operating restrictions. In other words, our main aim is to decrease the energy deficit by utilizing maximum solar and fuel cell energy together with a battery bank, which minimizes NPC in turn. The system’s objective function can be expressed as follows [24,46]
min N P C subject to E P V + E F C > E B S E P V + E F C + E B a t t = E B S + E L o s s E S u r p l u s = E G e n E B S E L o s s E B a t t m i n E B a t t E B a t t m a x
where E L o s s is computed at kWh/year with both converter loss ( C L o s s ) and battery loss ( B L o s s ). The joint contribution of energy from solar panels and fuel cells can surely fulfill BS’s yearly energy needs to provide reliable power as presented in constraint (1). The limitation in constraint (2) assures that the yearly energy generated by the integrated renewable energy sources carries with its related losses and the annual BS consumption. For future usage, the surplus energy is stored in the hydrogen tank and battery bank as stated by the constraint (3). The energy conserved also meets the power reliability limit. The limit constraint (4) means that the battery storage capacity shall neither exceed the limit nor be below the threshold level.

4.3. Reliability Modeling

Annual capacity shortage ( E C S ) is an pointer of reliability and can be represented as the proportion of yearly energy deficiency ( E E D ) to the yearly BS load demand ( E B S ) [24,46].
E C S = E E D E B S
where E B S is expressed in kWh/Year and E E D can be expressed as follows
E E D = E B S E G e n
where E G e n is the generated electricity which can be expressed as [24,46]
E G e n = E P V + E F C
For meeting the base station demand with appropriate backup capacity across the whole project time, an independent system may be built. Surplus energy may be stored if the total generation is exceeded by the demand, which may be expressed by the equation expressed below [24,46]
E S u r p l u s = E G e n E B S C L o s s B L o s s
where C L o s s and B L o s s symbolize the losses related with converter and battery respectively.

4.4. Energy Efficiency Modeling

With the aid of the MATLAB-based Monte-Carlo simulations under different network circumstances, the energy efficiency and throughput performance of the macro cellular network have been investigated. The main parameters for the simulation setup of Monte-Carlo is shown in Table 5. According to Shanon’s theorem on information capacity, overall achievable throughput performance ( R T o t a l ) of the wireless network at t can be represented as [47]
R T o t a l ( t ) = k = 1 U i = 1 N B W × l o g 2 ( 1 + S I N R i , k )
where N and U respectively represent the total number of BSs and user equipment (UE). S I N R i , k is the received signal-to-interference plus-noise-ratio at k t h UE located in i t h base station.
In this article, the ratio of throughput and network power consumption is defined as energy efficiency. At time t the energy efficiency metric can be represented as [47]
η E E = R T o t a l ( t ) P B S ( t )
where P B S ( t ) is the total power consumed in all the BSs at time t and can be calculated by using (1)

5. Results and Discussion

This section critically examines the performance of the suggested network in terms of key factors such as optimum architecture, energy issues, economic concerns, greenhouse gas emissions, and energy efficiency issues. With the aid of the HOMER, the optimum system design and technical criteria of the hybrid supply system are assessed to reduce electricity generating costs and greenhouse gas emissions over the length of 20 years in an off-grid site. In addition, the performance characteristics of the system are compared with those of the other systems to ensure validity.

5.1. Optimal System Architecture

The optimum conditions for off-grid systems under P T X = 20 W are outlined in Table 6. This optimal size of various components is determined considering the average solar intensity (4.59 kWh/m 2 /Day) for the selected areas. As shown, for all network designs, the fuel cell, electrolyzer, converter, and hydrogen tank sizes stay constant and will have a beneficial effect on meeting the BS energy requirement. It is also expected that lower system BW are required to use less solar photovoltaic electricity than the higher ones because of lower power consumption. This is because increased system BW increases the requirement of BS energy. The monthly statistic of hydrogen production by the electrolyzer under 10 MHz bandwidth is shown in Figure 9. The amount of power contributed by solar PV and fuel cell under 10 MHz system bandwidth is shown in Figure 10. The yearly hydrogen tank and battery bank frequency histogram are illustrated in Figure 11 and Figure 12 respectively. The H 2 tank frequency histogram reveals that the autonomy for the hydrogen tank is 56 h, in the form of hydrogen (30 Kg H 2 ) as shown in Figure 11. The battery bank frequency histogram reveals that the battery is in low state of charge (SOC) for around 3% of the year, and has a high state of charge for around 19% of the year. The replacement of the battery bank is therefore very significant during the project.

5.2. Energy Analysis

This sub-section critically evaluates the yearly energy output by the solar PV panels, and fuel cell together with a range of hydrogen-battery energy storage systems based on the optimal design architecture. In addition, the calculation of yearly energy contribution, energy losses, battery throughput, autonomy, and surplus electricity has been done care-fully under a variety of network configurations.

5.2.1. Solar PV Energy

In this article, the nominal current of 8.40 Ampere and power of 250 W is utilized for all network settings of the Sharp ND-250QC solar module (polycrystalline) with a nomi-nal voltage of 29.80 V. The appropriate size of the PV solar panel for various network con-figurations is summarized in Table 6. The capacity of the solar PV panels for 10 MHz bandwidth is 4 kW and it consists of 16 Sharp ND-250QCs modules (4 kW/250 W = 16). Thus the module Sharp ND-250QCs is the right choice. With the average solar radiation for the macro cell BS under 10 MHz bandwidth, the yearly energy output by the solar panel can be computed using (8): E P V = 4 kW × 4.59 × 0.9 × 365 Days/Year = 6031.26 kWh/Year. Additionally, a dual-axis tracking mode of solar PV panels increases the production of the total amount of energy by 43% being 8648 kWh/Year. Similarly, the energy generated for every other setup is determined. The amount of energy generated by the solar PV panels for different system bandwidths is shown in Figure 13. The photovoltaic energy curve is upwards, which means that a greater system BW corresponds to the higher yearly PV panel energy output.

5.2.2. Fuel Energy

For the macro base station under all network configurations, the hybrid solar PV/H/FC system requires a 1 kW size fuel cell and 1 kW electrolyzer. The annual energy generated by the 1 kW fuel cell is 196 kWh/Year. Figure 14 shows the yearly energy generation from the fuel cell under different system bandwidths. In line with our expectation, higher system BW generates more energy to fulfill the increased energy requirement, as illustrated in Figure 14. Figure 15 illustrates the impacts of fuel cell operation hours and hydrogen consumption on the different system bandwidths. However, a larger operation hour of the fuel cell is expected to increase the consumption of hydrogen, which reduces the duration of fuel cell life.

5.2.3. Surplus Energy

The amount of energy generated by the solar PV system can be determined by Equation (8). HOMER determines the fuel cell energy 374 kWh, the battery loss ( B L o s s ) 573 kWh/Year, and converter loss ( C L o s s ) 57 kWh/Year, for the macro base station under 10 MHz system bandwidth with an average solar radiation of 4.59 kWh/m 2 /Day. Annual surplus energy ( E S u r p l u s ) of the system can be determined by using (21): 8648 kWh ( E P V ) + 196 kWh ( E F C ) − 6773 kWh ( E B S + E E l e c . ) − 434 kWh ( B L o s s ) − 5 kWh ( C L o s s ) = 1632 kWh/Year. The yearly surplus energy generated may also be determined for all other types of networks. The yearly surplus energy generations for various bandwidth are presented in Figure 16, which includes an annual energy contribution from the renewables and losses. The higher value of surplus energy means improved system reliability since the suggested system could satisfy the demand for the BS load independently without help from external non-RE sources such as diesel/fossil fuel-based supply systems.

5.2.4. Battery Energy

A total of 16 battery units are needed for the proposed configuration of 10 MHz system bandwidth. The 4 batteries connected in series and 4 connected in parallel to the 48-V DC bus bar. The battery bank can automatically manage the macro BS power around 48.1 h estimated throughout the Equation (10). For P T X = 20 W, and BW = 10 MHz configuration: ( N B a t t = 16) × ( V n o m = 6 V) × ( Q n o m = 360 Ah) × ( B D O D = 0.7) × 24 h)/daily load, E B S = 12.07 kWh = 48.1 h. Where, battery depth of discharge ( B D O D ) = ( 1 S O C m i n 100 ) . The autonomy of the battery bank may also be estimated for all network settings. Figure 17 highlights the yearly autonomy of the battery bank ( B A u t ) for average solar radiation, while a battery bank throughput is shown in Figure 18 for different system bandwidth. Figure 17 describes that, when daily load consumption grows accordingly, B A u t decreases with the system bandwidth. On the other hand, Figure 18 further indicates that battery bank performance is primarily influenced by the demand of BS energy and system bandwidth. However, by increasing the system bandwidth and transmission power level, battery bank throughput can be increased. A greater B A u t and B L i f e are preferable in terms of reliability and cost-effectivity to sustain the BS load demand for a longer period. Inherently, improved B L i f e performance decreases replacement costs as well as total NPC.

5.3. Economic Yield Analysis

In this subsection, the hybrid solar PV/H/FC system is analyzed in terms of money invested, considering the average sunlight of 4.59 kWh/m 2 /Day. The nominal cash flow of the hybrid supply system is shown in Figure 19. An overview of the net present cost and individual cost breakdown that arises over the project lifetime is demonstrated in Figure 20. The cash flow and net present cost summary have been found by simulating the system in HOMER optimization software with a bandwidth of 10 MHz. The total NPC comprises all the categories of cost needed for the duration of the project and decided in the following year: Capital cost $11,918 + Replacement cost $6772 + OMC $3307 − Salvage $1426 = Contracting equivalent of $20,570. The numerical findings show that the initial cost of capital has the greatest value among the various types of costs. Moreover, Figure 20 shows that generating electricity from the renewable energy sources includes a considerable amount of replacement costs because of the battery bank’s reduced life cycle. The negative salvage value of solar photovoltaics, battery, converter, and hydrogen tank indicates that these components will provide a payback after the conclusion of the project.
Table 7 describes the individual project cost breakdown for various system bandwidths. In keeping with our expectations, CC, RC, OMC and NPC have been increasing gradually to meet rising energy demand by increasing the value of system bandwidth.
The quantitative comparison between the actual net cost and the cost of producing energy per unit of the system under various network configurations is highlighted in Figure 21 and Figure 22. The lower bandwidth of the system shows a lesser value of the net present costs. On the other hand, the cost for energy production is higher for the lower BW system since the NPC participation in the off-grid system is greater, as previously stated.

5.4. Carbon Footprints Analysis

The larger carbon footprint of the hydrogen fuel cell may be maintained at a lower price due to technical development. Table 8 shows the primary carbon content of the proposed system for 10MHz system bandwidth. As seen, carbon mono-oxide (CO) is the major contributor to the emission of GHG among the various pollutants. The pollutants and yearly GHG emissions for 10 MHz system bandwidth are reported in Table 8. Solar as an energy source generates null carbon content in a hybrid solar PV/H/FC system where the whole GHG can be generated exclusively by the hydrogen fuel cell system. Lastly, Figure 23 illustrates the influence of toxic-intensive GHG produced by the hydrogen fuel cell, which means that increased FC running time increases carbon footprints, but reliability and QoS are significantly improved.

5.5. Energy Efficiency Analysis

The throughput and energy efficiency parameters of the wireless network under various system bandwidths are presented in Figure 24 and Figure 25 respectively. The throughput and energy efficiency performance of the proposed system is likewise the intensity profile of dynamic traffic in Figure 2. The results were assessed based on the two-tier LTE cellular network with 19 hexagonal base stations. The throughput output shows the number of bits per second sent. On the other side, energy efficiency performance is employed as a ratio between the total throughput and total power requirements of the base station, to assess the number of bits transferred per watt. A system that offers enough throughput and energy efficiency performance is constantly to be developed. In addition, due to the increased energy demand, a better value of the energy efficiency performance of the network is established as shown in Figure 26. Energy efficiency is directly proportional to the network’s throughput performance according to (23). Further, several resource blocks (RBs) are assigned for the BS operation of the higher system bandwidth.

6. Payback Period, Limitation Analysis, and Feasibility Comparison

In this section, the breakeven point of the integrated solar PV/H/FC system is estimated for justifying economic feasibility. In addition, the results of this system are compared with the other supply schemes with a view to guaranteeing the network sustainability, taking into account the technical criteria, economic analysis, energy yield analytics, and greenhouse gas emissions. Finally, the performance parameters of the introduced system are compared with the previously published research work.

6.1. Breakeven Point Calculation

The breakeven point (BP) is the period in which the capital cost of the project is expected to get back by selling the generated energy. The breakeven point is also known as the sample payback period (SPP) and can be calculated as follows [48,49]
B P = C T I C A R
where C T I is the total investment ($) for the hybrid supply system and C A R is the annual return ($) by selling the generated green energy. The annual return of the system is calculated by subtracting the annual operational cost from the annual income. In this work, we have estimated the breakeven point considering the consumption of generated energy at a rate of 
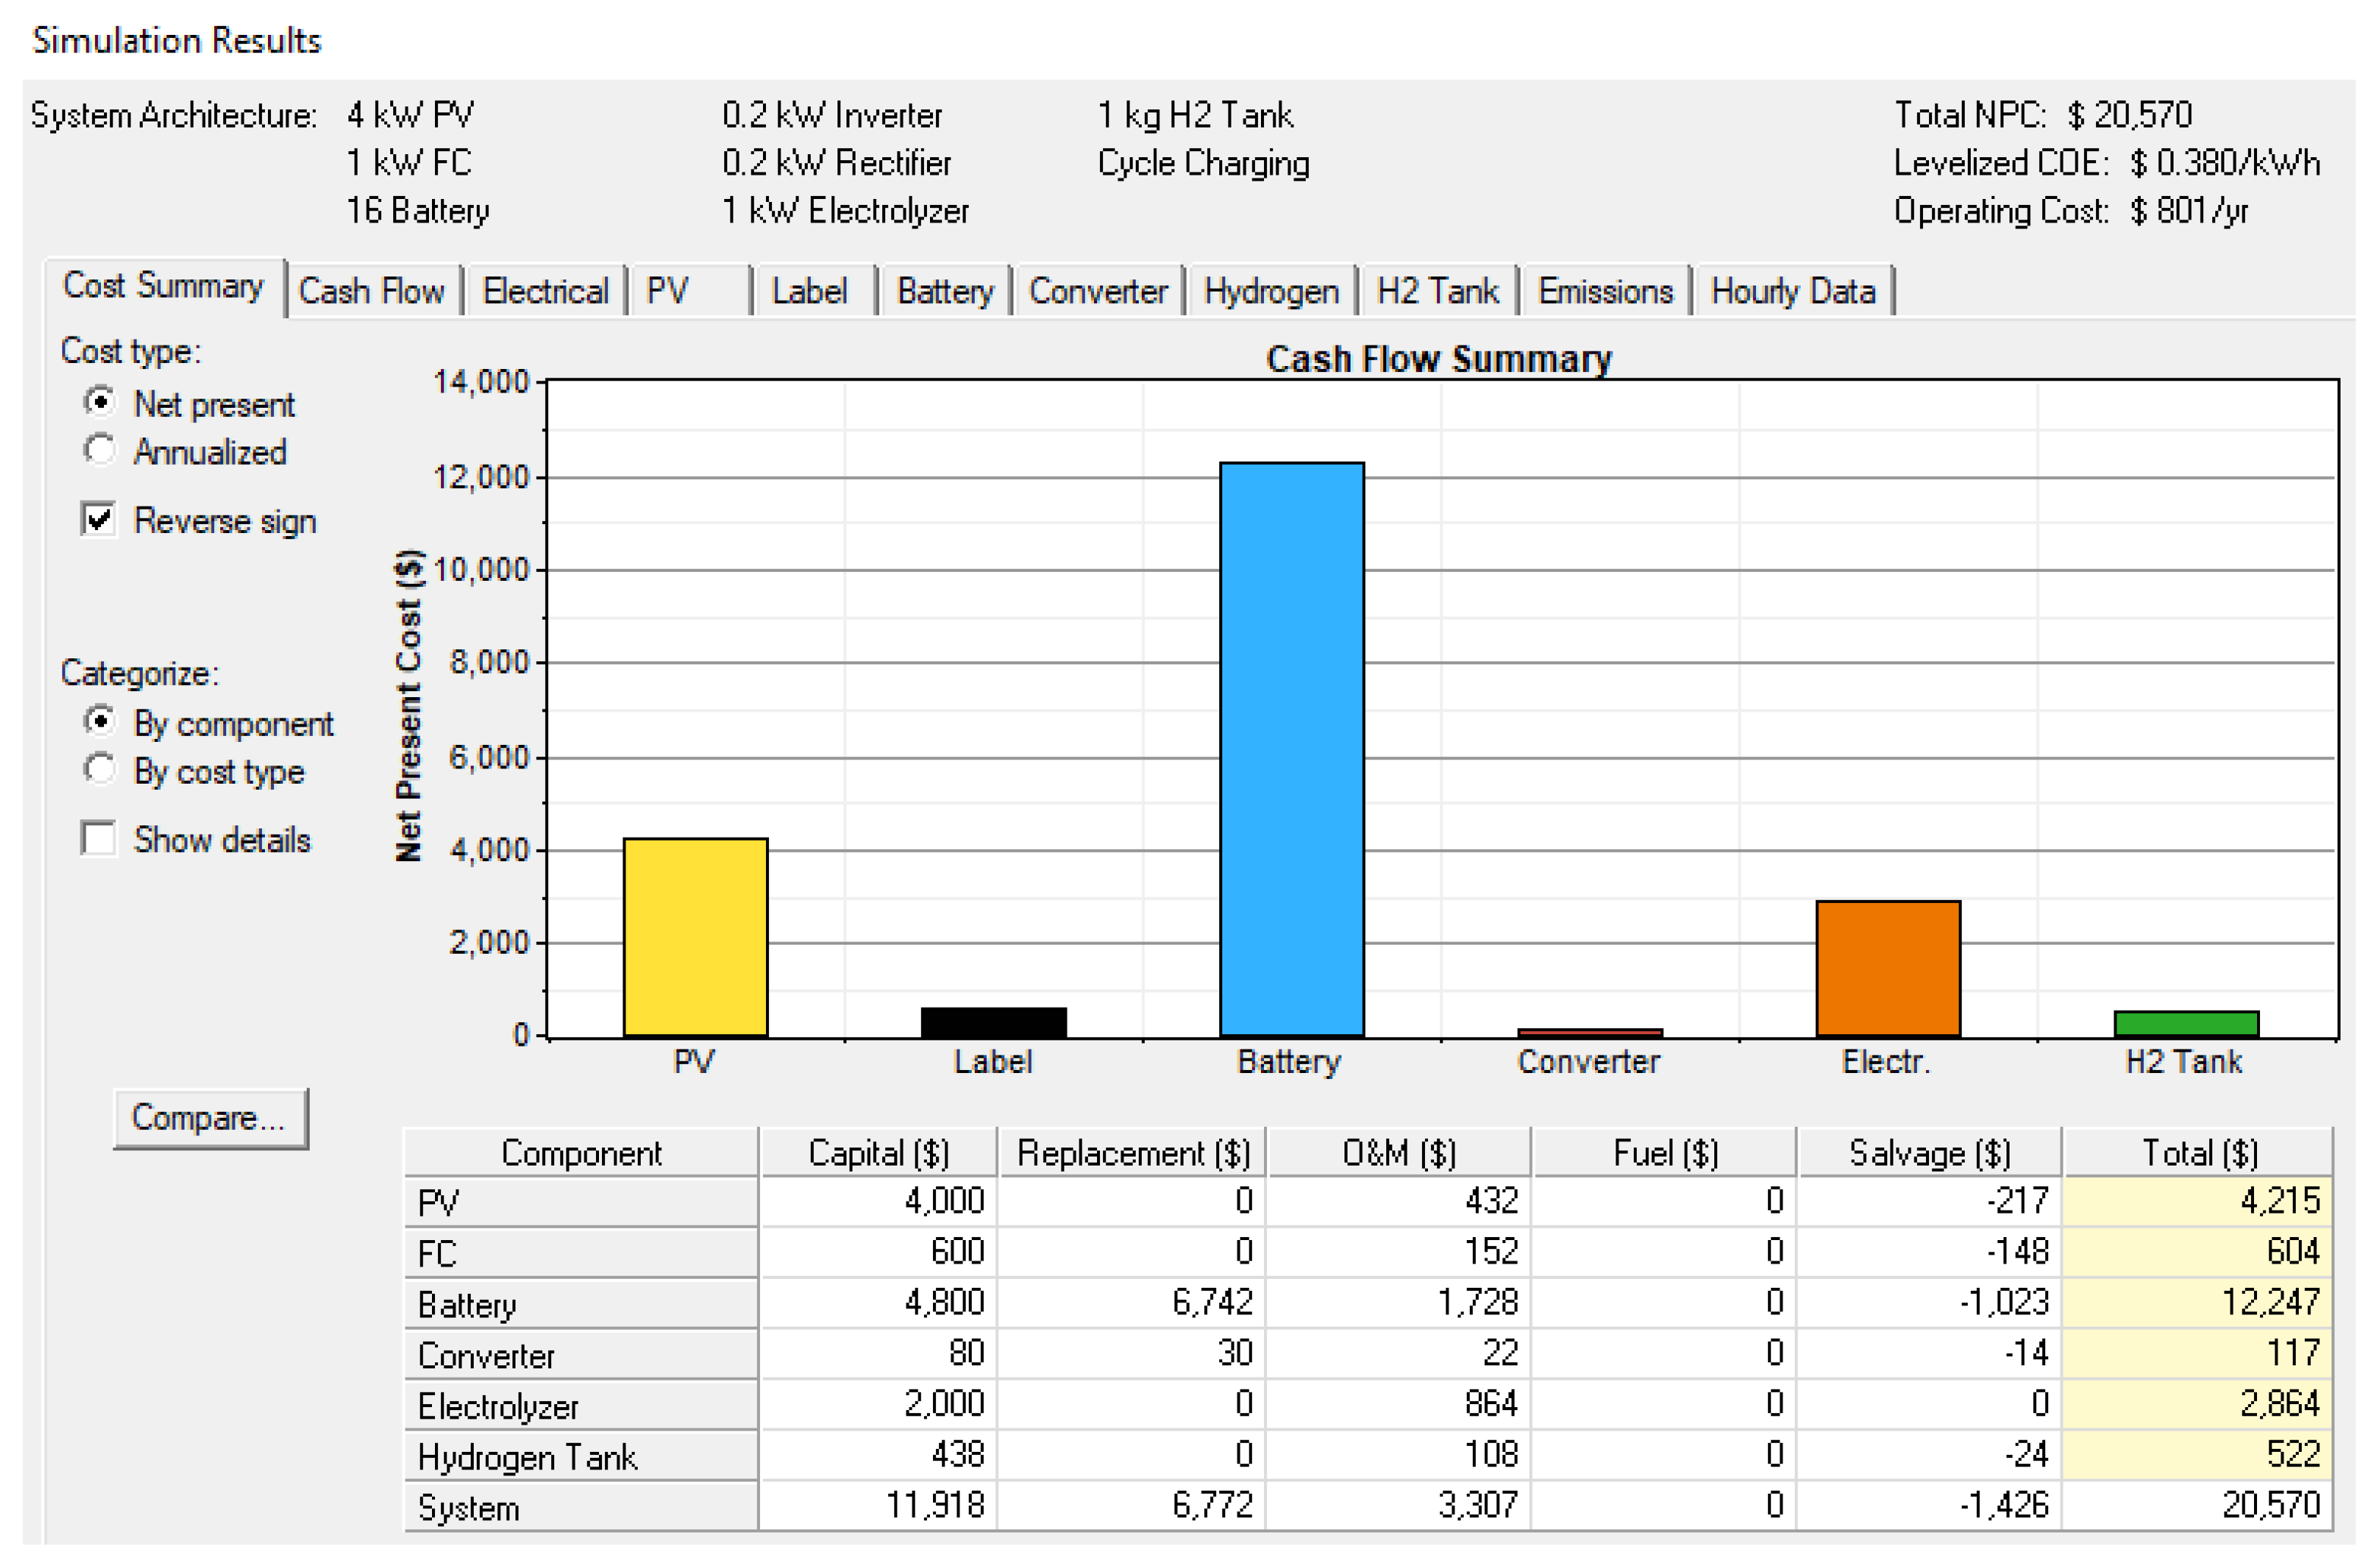
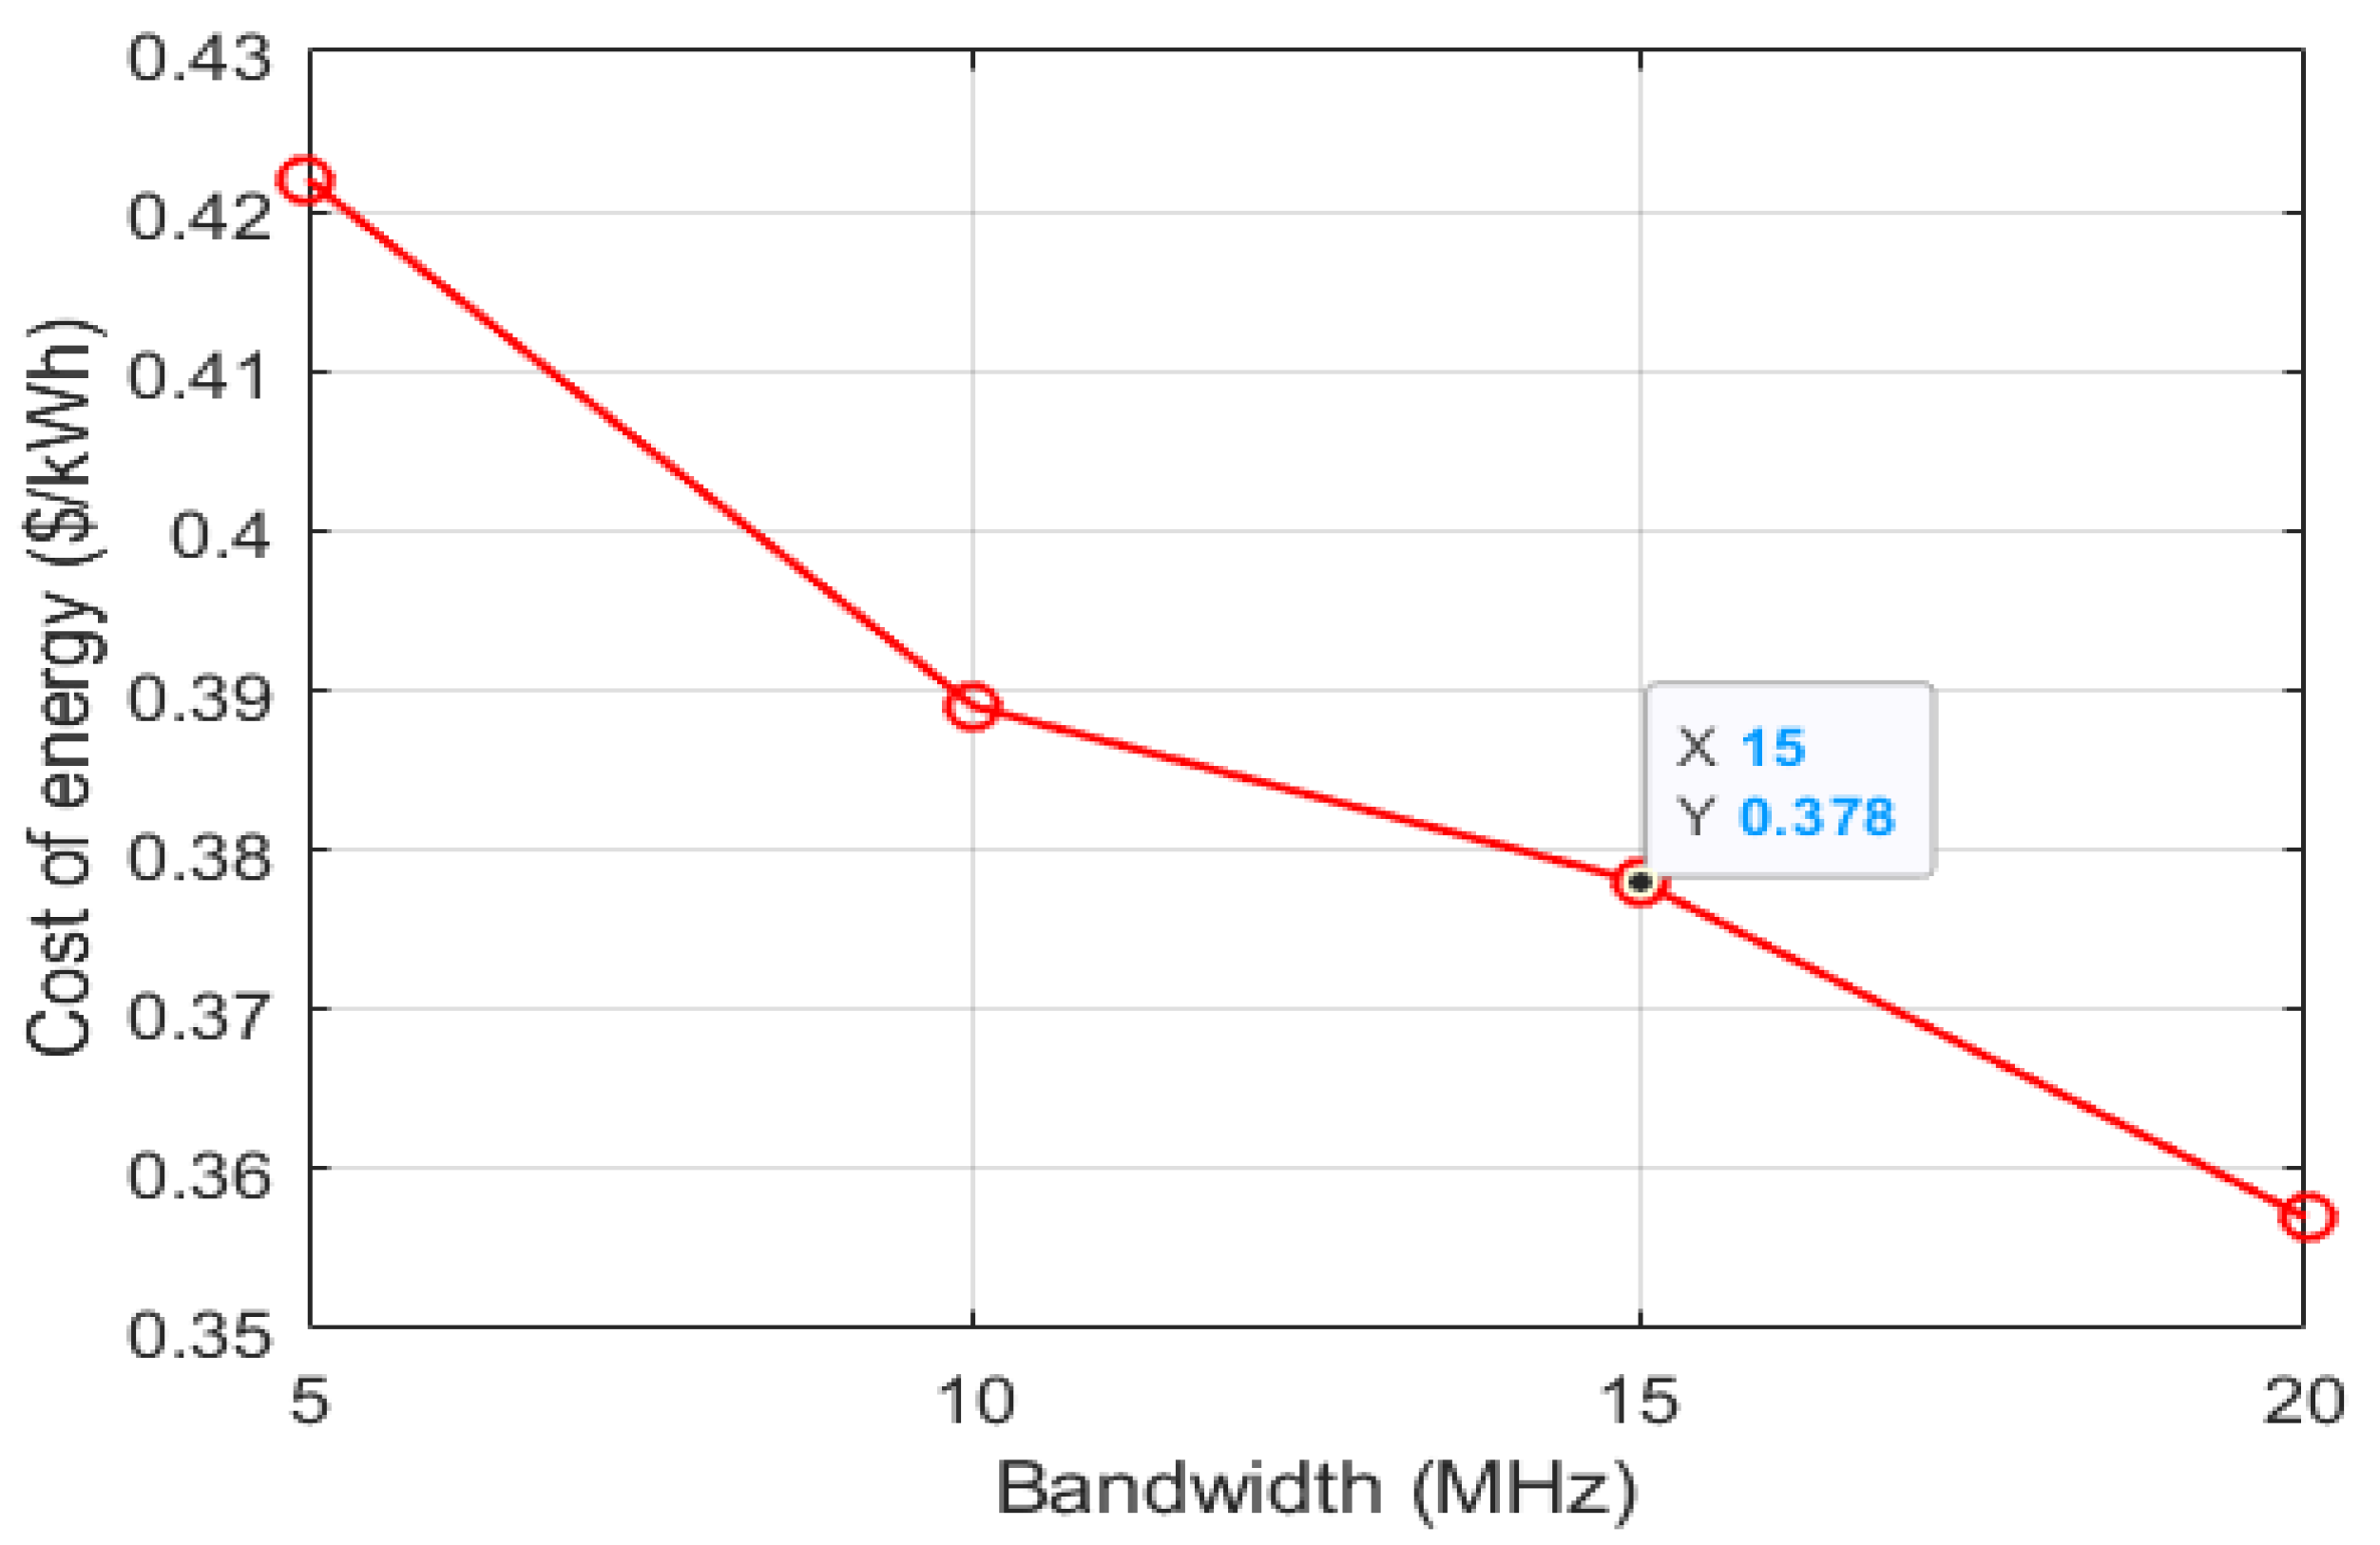
$0.39/kWh, which is higher than the generation cost. The detailed calculations of the payback period under 10 MHz system bandwidth are shown below:
  • Total investment = $20,570
  • Production rate of energy = $0.38/kWh
  • Selling rate of energy = $0.39/kWh
  • Sold energy = 8844 kWh/Year
  • Operation and maintenance cost = $306/Year
  • Replacement cost = $627/Year
  • Thus, annual return = ($0.39/kWh × $8844/Year) − $306 − $627 = $2516.16
According to Equation (24), the breakeven point of the solar PV/H/FC is 8.17 years. Moreover, the increase in the energy rate from $0.39 to $0.41/kWh, increases the return and decreases the breakeven period from 8.17 years to 7.63 years as summarized in Table 9. Table 9 also represents that a higher value of the energy selling rate steps down the breakeven point leading to enhancement in economic feasibility. This implies that the sample payback period is dependent predominantly on the energy selling rate.

6.2. Limitation Analysis

The green cellular network powered by a hybrid solar PV/H/FC system offers many potential benefits, but it is difficult to deploy it. The following list recaps the major difficulties and possible solutions associated with the hybrid solar PV/H/FC powered cellular networks:
  • The installation of the hybrid PV/H/FC solar system requires hydrogen. The use of hydrogen can pose some additional danger at relatively low ignition temperatures since it is an inflammable gas [39]. However, we can overcome the risks associated with hydrogen management by using modern technology, risk evaluation, existing laws, and policies [17].
  • A hybrid solar system PV/H/FC may need the discharge of minimal carbon footprints owing to electrolyzer processing [50]. The greater volume of carbon footprints may be restricted to a smaller value with the progress of contemporary technologies. The fuel cell also indirectly decreases carbon footprints and pressure on the utility grid by enabling the greatest use of locally accessible renewable energy sources.
  • The deployment of a hybrid PV/H/FC solar system requires a sufficient storage system to deliver sufficient backup power in case of a renewable energy shortage or failure. The large-size electrolyzer and hydrogen tank may be integrated with the hybrid solar system PV/H/FC to resolve this issue.

6.3. Feasibility Comparison

It is found that, while the standalone PV and the hybrid PV/WT systems offer better off-grid performance, the first system is not so reliable due to its dependence on a single renewable energy source and the latter solution is not workable because of its poor wind profile at the chosen location.
As we had expected, the stand-alone DG and hybrid PV/DG are inadequate, as enormous volumes of fossil fuel and significant transportation costs in remote locations are needed. The hybrid solar PV/H/FC system is an appealing alternative for the distant off-grid locations in Bangladesh because of the enormous potential of solar PV energy, despite the emission of very little carbon content. In addition, by using hydrogenbased renewable energy storage technology, the proposal indirectly decreases GHG emissions and pressure on the public utility grid. Table 10 highlights the major references to similar projects in other countries, to compare the essential parameter of the proposed system. The renewable-energy based supply system has recently attracted different stakeholders’ attention as a viable approach to build a green cellular network. As a consequence, telecom operators and researchers have intensively examined the collection of energy from locally available renewable energy sources. Inspired by the above possible advantages, Nokia Siemens has already built a green cellular BS in rural parts of Germany using a hybrid solar PV and wind turbine [51]. In addition, Ericsson has deployed off-grid wind power BS for grid energy reduction [52].
The Huawei technology already established a hybrid solar PV/DG system in distant parts of Africa and the Middle East [60]. Most of the author’s nevertheless considered the major issues involved in developing a green cell network utilizing solar photovoltaic and wind turbines together with backup systems (such as battery banks and DG). With the aid of HOMER, they investigated the techno-economic viability by disregarding the dynamic behavior of traffic intensity. To the best of our knowledge, we are the first to establish the techno-economic analysis for green networks which integrate hydrogen fuel cells with solar PV.

7. Conclusions and Directions for Further Research

7.1. Conclusions

The feasibility and efficacy of hydrogen and fuel cell integration with the solar PV system for the operation of the off-grid cellular base station in Bangladesh were investigated in this report. The performance of the renewable energy-based system together with hydrogen energy storage devices has been calculated based on key factors such as (i) optimal architecture of the systems, (ii) energy issue, (iii) economic issue, (iv) carbon footprints issue, and (v) energy efficiency issue. Simulation results indicate that the hydrogen battery hybrid power storage system is an attractive solution for achieving the 100% renewable energy-based off-grid cellular network despite some challenges and difficulties. The suggested system has sufficient surplus energy that can be further used at the nearby base stations or exported to the industry/power sector. Numerical values show that the proposed system can attaint net present cost around $20,570 and the per-unit cost of energy is $0.38. In addition, the NPC increases along with the increase in energy consumption and bandwidth. On the other side, a continual decrease in COE for the increased system BW has been identified, leading simultaneously to reductions in carbon footprints. It is seen that the proposed system has the potential to decrease CO 2 emissions up to 0.388 Kg per year (under 10 MHz system BW). The hydrogen battery energy storage system has autonomous power to support the BS load for enough hours without external retailers. It is also found that the suggested system has a higher wireless performance level which is determined by the throughput and energy efficiency performance criteria. In short, this hybrid system delivers a more sustainable green power with less carbon footprint and has been identified as an attractive long-term, cost-effective option in distant telecommunications BS. The research results are also beneficial in developing a standalone microgrid system with hybrid energy storage for rural areas for power supplies to the community as well as in identifying a route of hydrogen usage for power utilities and government organizations.

7.2. Directions for Further Research

At the current stage of the proposed research, developed hybrid solar PV and fuel cell-focused macro cellular network without energy sharing mechanisms have much room for being improved and extended in several interesting directions. Future extensions of this research work are summarized as below:
  • Developing a prototype system to ensure the effectiveness of the hybrid solar PV/H/FC-based green mobile communication.
  • Developing a generic algorithm and control system for sharing green energy across surrounding BSs and industry/power grid by maximizing the use of renewable energy in heterogeneous cellular networks.
  • Developing a cell zooming technique for running heterogeneous cellular networks based on the amount of green energy generated and the rate of incoming traffic.
  • For enhancing energy efficiency performance, renewable energy cooperation of cloud radio access network (C-RAN) heterogeneous networks paradigm may be examined.
  • For a better compromise between data rate and fairness, an efficient resource and energy scheduling technique can be implemented.

Author Contributions

Conceptualization, M.S.H., K.Z.I. and A.G.A.; methodology, A.G.A. and K.Z.I.; software, M.S.H.; validation, M.S.H. and M.R.I.; formal analysis, M.S.H.; investigation, A.G.A. and M.R.I.; resources, M.S.H.; data curation, A.G.A.; writing—original draft preparation, M.S.H. and A.G.A.; writing—review and edit-ing, K.Z.I. and M.R.I.; visualization, K.Z.I.; supervision, M.R.I.; project administration, M.S.H. and M.R.I.; funding acquisition, A.G.A. All authors have read and agreed to the published version of the manuscript.

Funding

The authors extend their appreciation to the Deputyship for Research & Innovation, Ministry of Education in Saudi Arabia for funding this research work through project number 375213500.

Conflicts of Interest

The authors declare no conflict of interest.

References

  1. Jiang, W.; Han, B.; Habibi, M.A.; Schotten, H.D. The road towards 6G: A comprehensive survey. IEEE Open J. Commun. Soc. 2021, 2, 334–366. [Google Scholar] [CrossRef]
  2. Han, D.; Li, S.; Peng, Y.; Chen, Z. Energy sharing-based energy and user joint allocation method in heterogeneous network. IEEE Access 2020, 8, 37077–37086. [Google Scholar] [CrossRef]
  3. Jahid, A.; Hossain, M.S.; Monju, M.K.H.; Rahman, M.F.; Hossain, M.F. Techno-economic and energy efficiency analysis of optimal power supply solutions for green cellular base stations. IEEE Access 2020, 8, 43776–43795. [Google Scholar] [CrossRef]
  4. Wu, J.; Zhang, Y.; Zukerman, M.; Yung, E.K.N. Energy-efficient base-stations sleep-mode techniques in green cellular networks: A survey. IEEE Commun. Surv. Tutor. 2015, 17, 803–826. [Google Scholar] [CrossRef]
  5. Hossain, M.S.; Jahid, A.; Ziaul Islam, K.; Alsharif, M.H.; Rahman, M.F. Multi-objective optimum design of hybrid renewable energy system for sustainable energy supply to a green cellular networks. Sustainability 2020, 12, 3536. [Google Scholar] [CrossRef]
  6. Alsharif, M.H.; Kim, J. Hybrid off-grid SPV/WTG power system for remote cellular base stations towards green and sustainable cellular networks in South Korea. Energies 2017, 10, 9. [Google Scholar] [CrossRef] [Green Version]
  7. Alsharif, M.H. A solar energy solution for sustainable third generation mobile networks. Energies 2017, 10, 429. [Google Scholar] [CrossRef]
  8. Shakir, M.Z.; Qaraqe, K.A.; Tabassum, H.; Alouini, M.S.; Serpedin, E.; Imran, M.A. Green heterogeneous small-cell networks: Toward reducing the CO2 emissions of mobile communications industry using uplink power adaptation. IEEE Commun. Mag. 2013, 51, 52–61. [Google Scholar] [CrossRef] [Green Version]
  9. Farooq, M.J.; Ghazzai, H.; Kadri, A.; ElSawy, H.; Alouini, M.S. A hybrid energy sharing framework for green cellular networks. IEEE Trans. Commun. 2017, 65, 918–934. [Google Scholar] [CrossRef] [Green Version]
  10. Sambaiah, K.S.; Jayabarathi, T. Optimal allocation of wind and solar based distributed generation in a radial distribution system. Int. J. Renew. Energy Res. 2019, 9, 73–85. [Google Scholar]
  11. Altay, A.; Dursun, B. Determination of hybrid renewable energy systems for project type public library building. Int. J. Renew. Energy Res 2019, 9, 24–31. [Google Scholar]
  12. Kola, S.S. A review on optimal allocation and sizing techniques for DG in distribution systems. Int. J. Renew. Energy Res. (IJRER) 2018, 8, 1236–1256. [Google Scholar]
  13. Ahmed, F.; Naeem, M.; Iqbal, M. ICT and renewable energy: A way forward to the next generation telecom base stations. Telecommun. Syst. 2017, 64, 43–56. [Google Scholar] [CrossRef]
  14. Aziz, A.S.; Tajuddin, M.; Adzman, M. feasibility analysis of PV/wind/battery hybrid power generation: A case study. Int. J. Renew. Energy Res. 2018, 8, 661–671. [Google Scholar]
  15. Nethengwe, N.S.; Uhunamure, S.E.; Tinarwo, D. Potentials of biogas as a source of renewable energy: A case study of South Africa. Int. J. Renew. Energy Res. 2018, 8, 1112–1123. [Google Scholar]
  16. Oh, E.; Krishnamachari, B.; Liu, X.; Niu, Z. Toward dynamic energy-efficient operation of cellular network infrastructure. IEEE Commun. Mag. 2011, 49, 56–61. [Google Scholar] [CrossRef]
  17. Dawood, F.; Shafiullah, G.; Anda, M. Stand-alone microgrid with 100% renewable energy: A case study with hybrid solar PV-battery-hydrogen. Sustainability 2020, 12, 2047. [Google Scholar] [CrossRef] [Green Version]
  18. Staffell, I.; Scamman, D.; Abad, A.V.; Balcombe, P.; Dodds, P.E.; Ekins, P.; Shah, N.; Ward, K.R. The role of hydrogen and fuel cells in the global energy system. Energy Environ. Sci. 2019, 12, 463–491. [Google Scholar] [CrossRef] [Green Version]
  19. Granovskii, M.; Dincer, I.; Rosen, M.A. Greenhouse gas emissions reduction by use of wind and solar energies for hydrogen and electricity production: Economic factors. Int. J. Hydrogen Energy 2007, 32, 927–931. [Google Scholar] [CrossRef]
  20. Natarajan, S.K.; Kamran, F.; Ragavan, N.; Rajesh, R.; Jena, R.K.; Suraparaju, S.K. Analysis of PEM hydrogen fuel cell and solar PV cell hybrid model. Mater. Today Proc. 2019, 17, 246–253. [Google Scholar] [CrossRef]
  21. Khosravi, A.; Koury, R.; Machado, L.; Pabon, J. Energy, exergy and economic analysis of a hybrid renewable energy with hydrogen storage system. Energy 2018, 148, 1087–1102. [Google Scholar] [CrossRef]
  22. Jahid, A.; Monju, K.H.; Hossain, S.; Hossain, F. Hybrid power supply solutions for off-grid green wireless networks. Int. J. Green Energy 2019, 16, 12–33. [Google Scholar] [CrossRef]
  23. Chamola, V.; Sikdar, B. Solar powered cellular base stations: Current scenario, issues and proposed solutions. IEEE Commun. Mag. 2016, 54, 108–114. [Google Scholar] [CrossRef]
  24. Alsharif, M.H. Techno-economic evaluation of a stand-alone power system based on solar power/batteries for global system for mobile communications base stations. Energies 2017, 10, 392. [Google Scholar] [CrossRef] [Green Version]
  25. Jahid, A.; Islam, M.S.; Hossain, M.S.; Hossain, M.E.; Monju, M.K.H.; Hossain, M.F. Toward energy efficiency aware renewable energy management in green cellular networks with joint coordination. IEEE Access 2019, 7, 75782–75797. [Google Scholar] [CrossRef]
  26. Alsharif, M.H.; Nordin, R.; Ismail, M. Energy optimisation of hybrid off-grid system for remote telecommunication base station deployment in Malaysia. Eurasip J. Wirel. Commun. Netw. 2015, 2015, 64. [Google Scholar] [CrossRef] [Green Version]
  27. Singh, S.; Singh, M.; Kaushik, S.C. A review on optimization techniques for sizing of solar-wind hybrid energy systems. Int. J. Green Energy 2016, 13, 1564–1578. [Google Scholar] [CrossRef]
  28. Hossain, M.S.; Rahman, M.F. Hybrid solar PV/Biomass powered energy efficient remote cellular base stations. Int. J. Renew. Energy Res. (IJRER) 2020, 10, 329–342. [Google Scholar]
  29. Hossain, M.S.; Jahid, A.; Islam, K.Z.; Rahman, M.F. Solar PV and biomass resources-based sustainable energy supply for off-grid cellular base stations. IEEE Access 2020, 8, 53817–53840. [Google Scholar] [CrossRef]
  30. Anayochukwu, A.V.; Ndubueze, N.A. Potentials of optimized hybrid system in powering off-grid macro base transmitter station site. Int. J. Renew. Energy Res. (IJRER) 2013, 3, 861–871. [Google Scholar]
  31. Kharel, S.; Shabani, B. Hydrogen as a long-term large-scale energy storage solution to support renewables. Energies 2018, 11, 2825. [Google Scholar] [CrossRef] [Green Version]
  32. Sachs, J.; Sawodny, O. Multi-objective three stage design optimization for island microgrids. Appl. Energy 2016, 165, 789–800. [Google Scholar] [CrossRef]
  33. Dawoud, S.M.; Lin, X.; Okba, M.I. Hybrid renewable microgrid optimization techniques: A review. Renew. Sustain. Energy Rev. 2018, 82, 2039–2052. [Google Scholar] [CrossRef]
  34. Chen, J.; Yang, P.; Peng, J.; Huang, Y.; Chen, Y.; Zeng, Z. An improved multi-timescale coordinated control strategy for stand-alone microgrid with hybrid energy storage system. Energies 2018, 11, 2150. [Google Scholar] [CrossRef] [Green Version]
  35. Petrollese, M.; Valverde, L.; Cocco, D.; Cau, G.; Guerra, J. Real-time integration of optimal generation scheduling with MPC for the energy management of a renewable hydrogen-based microgrid. Appl. Energy 2016, 166, 96–106. [Google Scholar] [CrossRef]
  36. Commonwealth of Australia. Hydrogen for Australia’s Future; Hydrogen Strategy Group: Canberra, Australia, 2018. Available online: https://www.chiefscientist.gov.au/sites/default/files/HydrogenCOAGWhitePaper_WEB.pdf (accessed on 30 June 2021).
  37. Green Hydrogen Electrolysers to Be Built in Regional Australia with Government Backing. 2018. Available online: https://www.abc.net.au/news/2021-05-05/100-million-in-federal-grants-for-green-hydrogen/100117192 (accessed on 30 June 2021).
  38. Eriksson, E.; Gray, E.M. Optimization and integration of hybrid renewable energy hydrogen fuel cell energy systems—A critical review. Appl. Energy 2017, 202, 348–364. [Google Scholar] [CrossRef]
  39. Dawood, F.; Anda, M.; Shafiullah, G. Hydrogen production for energy: An overview. Int. J. Hydrogen Energy 2020, 45, 3847–3869. [Google Scholar] [CrossRef]
  40. Vivas, F.; De las Heras, A.; Segura, F.; Andújar, J. A review of energy management strategies for renewable hybrid energy systems with hydrogen backup. Renew. Sustain. Energy Rev. 2018, 82, 126–155. [Google Scholar] [CrossRef]
  41. Auer, G. et al. How much energy is needed to run a wireless network? IEEE Wirel. Commun. 2011, 18, 40–49. [Google Scholar] [CrossRef]
  42. Karakoulidis, K.; Mavridis, K.; Bandekas, D.; Adoniadis, P.; Potolias, C.; Vordos, N. Techno-economic analysis of a stand-alone hybrid photovoltaic-diesel–battery-fuel cell power system. Renew. Energy 2011, 36, 2238–2244. [Google Scholar] [CrossRef]
  43. Khadem, T.; Billah, S.B.; Barua, S.; Hossain, M.S. Homer based hydrogen fuel cell system design for irrigation in bangladesh. In Proceedings of the 2017 4th International Conference on Advances in Electrical Engineering (ICAEE), Dhaka, Bangladesh, 28–30 September 2017; pp. 445–449. [Google Scholar]
  44. Panchenko, V. Photovoltaic solar modules for autonomous heat and power supply. In Proceedings of the IOP Conference Series: Earth and Environmental Science, Moscow, Russia, 17 May 2019; Volume 317, p. 012002. [Google Scholar] [CrossRef]
  45. Hossain, M.S.; Ziaul Islam, K.; Jahid, A.; Rahman, K.M.; Ahmed, S.; Alsharif, M.H. Renewable energy-aware sustainable cellular networks with load balancing and energy-sharing technique. Sustainability 2020, 12, 9340. [Google Scholar] [CrossRef]
  46. Hossain, M.S.; Jahid, A.; Islam, K.Z.; Alsharif, M.H.; Rahman, K.M.; Rahman, M.F.; Hossain, M.F. Towards energy efficient load balancing for sustainable green wireless networks under optimal power supply. IEEE Access 2020, 8, 200635–200654. [Google Scholar] [CrossRef]
  47. Jahid, A.; Monju, M.K.H.; Hossain, M.E.; Hossain, M.F. Renewable energy assisted cost aware sustainable off-grid base stations with energy cooperation. IEEE Access 2018, 6, 60900–60920. [Google Scholar] [CrossRef]
  48. Singh, K.; Sooch, S.S. Comparative study of economics of different models of family size biogas plants for state of Punjab, India. Energy Convers. Manag. 2004, 45, 1329–1341. [Google Scholar] [CrossRef]
  49. Ahammad, S.; Khan, A.H.; Nur, T.E.; Ghose, S. A hybrid of 30 KW Solar PV and 30 KW Biomass System for rural electrification in Bangladesh. In Proceedings of the 2015 3rd International Conference on Green Energy and Technology (ICGET), Dhaka, Bangladesh, 11 September 2015; pp. 1–5. [Google Scholar] [CrossRef]
  50. Grimm, A.; de Jong, W.A.; Kramer, G.J. Renewable hydrogen production: A techno-economic comparison of photoelectrochemical cells and photovoltaic-electrolysis. Int. J. Hydrogen Energy 2020, 45, 22545–22555. [Google Scholar] [CrossRef]
  51. E-Plus, Nokia Siemens Networks Build Germany First Off-Grid Base Station. Available online: http://www.nokiasiemensnetworks.com (accessed on 30 October 2021).
  52. Sustainable Energy Use in Mobile Communications. White Paper. Ericsson Inc., 2007. Available online: https://www.techonline.com/electrical-engineers/education-training/tech-papers/4136182/Sustainable-Energy-Use-in-MobileCommunications (accessed on 30 October 2021).
  53. Margaret Amutha, W.; Rajini, V. Techno-economic evaluation of various hybrid power systems for rural telecom. Renew. Sustain. Energy Rev. 2015, 43, 553–561. [Google Scholar] [CrossRef]
  54. Asif, R.M.; Khanzada, F. Cellular base station powered by hybrid energy options. Int. J. Comput. Appl. 2015, 115, 35–39. [Google Scholar] [CrossRef]
  55. Alsharif, M.H.; Nordin, R.; Ismail, M. Green wireless network optimisation strategies within smart grid environments for Long Term Evolution (LTE) cellular networks in Malaysia. Renew. Energy 2016, 85, 157–170. [Google Scholar] [CrossRef]
  56. Alsharif, M.H.; Kim, J.; Kim, J.H. Energy optimization strategies for eco-friendly cellular base stations. Energies 2018, 11, 1500. [Google Scholar] [CrossRef] [Green Version]
  57. Olatomiwa, L.; Mekhilef, S.; Huda, A.N.; Sanusi, K. Techno-economic analysis of hybrid PV–diesel–battery and PV–wind–diesel–battery power systems for mobile BTS: The way forward for rural development. Energy Sci. Eng. 2015, 3, 271–285. [Google Scholar] [CrossRef]
  58. Martínez-Díaz, M.; Villafafila-Robles, R.; Montesinos-Miracle, D.; Sudriá-Andreu, A. Study of optimization design criteria for stand-alone hybrid renewable power systems. Int. Conf. Renew. Energies Power Qual. 2013, 1, 1266–1270. [Google Scholar] [CrossRef]
  59. Moury, S.; Nazim Khandoker, M.; Haider, S.M. Feasibility study of solar PV arrays in grid connected cellular BTS sites. In Proceedings of the 2012 International Conference on Advances in Power Conversion and Energy Technologies (APCET), Mylavaram, India, 2–4 August 2012; pp. 1–5. [Google Scholar] [CrossRef]
  60. Huawei. Mobile Networks Go Green. Available online: http://www.huawei.com/en/abouthuawei/publications/communicaite/hw-082734.htm (accessed on 30 October 2021).
Figure 1. Architecture of the hybrid solar PV/H/FC model.
Sustainability 13 12508 g001
Figure 2. Dynamic profile over a day.
Sustainability 13 12508 g002
Figure 3. Efficiency curve of the fuel cell.
Sustainability 13 12508 g003
Figure 4. Solar radiation profile and clearness index of the selected location.
Sustainability 13 12508 g004
Figure 5. Characteristic of Trojan L16P battery.
Sustainability 13 12508 g005
Figure 6. Layout of the proposed hybrid solar PV/H/FC system in HOMER platform.
Sustainability 13 12508 g006
Figure 7. Layout of the proposed hybrid solar PV/H/FC system in HOMER platform.
Sustainability 13 12508 g007
Figure 8. Load profile of the proposed hybrid solar PV/H/FC system over a day.
Sustainability 13 12508 g008
Figure 9. Monthly average hydrogen production.
Sustainability 13 12508 g009
Figure 10. Monthly average power contribution under 10 MHz system BW.
Sustainability 13 12508 g010
Figure 11. Frequency histogram for hydrogen tank.
Sustainability 13 12508 g011
Figure 12. Frequency histogram for battery stage of charge.
Sustainability 13 12508 g012
Figure 13. Energy generated by the Solar PV.
Sustainability 13 12508 g013
Figure 14. Energy generated by the fuel cell.
Sustainability 13 12508 g014
Figure 15. Operation hours and hydrogen consumption for different system BW.
Sustainability 13 12508 g015
Figure 16. Individual energy breakdown for the different system BW.
Sustainability 13 12508 g016
Figure 17. Battery bank autonomy and life for different system BW.
Sustainability 13 12508 g017
Figure 18. Battery bank throughput and losses for different system BW.
Sustainability 13 12508 g018
Figure 19. Nominal cash flow summary for the hybrid solar PV/H/FC.
Sustainability 13 12508 g019
Figure 20. Net present cost and individual cost breakdown of the system for 10 MHz system BW.
Sustainability 13 12508 g020
Figure 21. Net present cost under different system BW.
Sustainability 13 12508 g021
Figure 22. COE under different system BW.
Sustainability 13 12508 g022
Figure 23. GHG under different system BW.
Sustainability 13 12508 g023
Figure 24. Throughput performance over a day for different BW.
Sustainability 13 12508 g024
Figure 25. Energy efficiency vs. BW for a single day.
Sustainability 13 12508 g025
Figure 26. Energy efficiency under 10 MHz system BW.
Sustainability 13 12508 g026
Table 1. Summary of the notations and symbols.
NotationsMeaningNotationsMeaning
BBBasebandRERenewable energy
BSBase stationWTWind turbine
BWBandwidthCO 2 Carbon dioxide
COECost of energy E S u r p l u s Surplus energy
DGDiesel generator H 2 Hydrogen
FCFuel cell P B S BS power
GHGGreenhouse gasP2HPower to hydrogen
NPCNet present costP2H2PPower to hydrogen to power
PVPhotovoltaic R T o t a l Throughput
QoSQuality of service χ BS traffic load
Table 2. Base station key parameters [41].
BS Type N TRX P TX (W) P 0 (W) Δ P P sleep (W)
Macro with RRH620842.856
Table 3. Individual power consumption at peak load under 10 MHz system BW [41].
ComponentsParametersValues
BS P T X (W)20
Feeder loss σ f e e d (dB)0
PABack-off (dB)8
Max PA out (dBm)51
PA efficiency η P A (%)31.1
Total PA, P P A (W)64.4
RF P T x (W)6.8
P R x (W)6.1
Total RF, P R F (W)12.9
BBRadio (inner Rx/Tx) (W)10.8
Turbo code (outer Rx/Tx)8.8
Processors (W)10
Total BB, P B B (W)29.6
DC-DC σ D C (%)7.5
Cooling σ c o o l (%)0
Mains Supply σ M S (%)9
Sectors 3
Antennas 2
Total power (W) 754.8
Table 4. Major system components and specifications for HOMER simulation [6,7,45].
ComponentsConstraintsRate
ResourcesSolar radiation4.69 kWh/m 2 /Day
Interest rate6.75%
Operational lifetime25 Years
Derating factor90%
Solar PVSystem tracking2-Axis
Initial cost$1000/kW
Replacement cost$1000/kW
OMC/Year$10/Year
Operational lifetime40,000 H
Fuel CellInitial cost$600/kW
Replacement cost$600/kW
OMC/Year$0.080/Hour
Operational lifetime20 Years
ElectrolyzerInitial cost$2000/kW
Replacement cost$2000/kW
OMC/Year$80/Year
Operational lifetime25 Years
H 2 TankInitial cost$438/kW
Replacement cost$438/kW
OMC/Year$10/Year
Round trip efficiency85%
B S O C m i n 30%
V n o m 6 V
Battery Q n o m 360 Ah
Lifetime throughput1075 kWh
Initial cost$300/Unit
Replacement cost$300/Unit
OMC/Year$10/Year
Efficiency90%
Operational lifetime15 Years
InverterInitial cost$400/kW
Replacement cost$400/kW
OMC/Year$10/Year
Table 5. Key parameters for MATLAB based Monte-Carlo simulation setup [47].
ParametersValue
Resource block (RB) bandwidth180 kHz
System bandwidth, BW5, 10, 15, 20 MHz
Carrier frequency, f c 2 GHz
Duplex modeFFD
Cell radius1km
BS Transmission power43 dBm
Noise power density−174 dBm/Hz
Number of sectors3
Number of antennas2
Reference distance, d 0 100 m
Path loss exponent, α 3.574
Shadow fading, X σ 8 dB
Access techniqueOFDMA
Traffic modelRandomly distributed
Table 6. Optimal system architecture for different system BW.
BWPVFCElectrolyzerBatteryConverter H 2 Tank
(MHz)(kW)(kW)(kW)(Units)(kW)(Kg)
5311160.21
10411160.21
15511240.21
20611240.21
Table 7. Cost breakdown of the proposed system for different system BW.
BWCCRCOMCSV
(MHz)($)($)($)($)
510,918454631401018
1011,918677433071425
1515,31873734273854
2016,31810,35343921858
Table 8. Pollutants for 10 MHz system bandwidth.
PollutantsEmissions (Kg/Year)
Carbon dioxide−0.388
Carbon monoxide0.247
Unburned hydrocarbons0.0274
Particulate matter0.0186
Sulfur dioxide0
Nitrogen oxides2.2
Table 9. Sample payback of the proposed system.
Energy RateInvestmenReturnBreakeven Point
($/kWh)($)($/Year)(Years)
0.3920,5702516.168.17
0.4020,5702604.607.89
0.4120,5702693.047.63
Table 10. Comparison of our system with some other suggested systems.
Reference [53]HOMERThe integration of solar PV with the wind turbine and the combined utilization of solar PV/WT/Fuel cell might be a realistic alternative for powering the cellular BSs at reduced net present costs. In the case of global system for mobile communications (GSM), the hybrid PV/WT/FC System has an NPC of $75,515, 2 kW PV, 3 kW WT and 2 kW FC, which is also the most economically viable configuration in this field. The hybrid supply system delivers 3926 kWh of extra energy each year, which is stored within the battery bank and used in case of scarcity and/or renewable electricity shortages.
Reference [54]HOMERThe hybrid solar PV/DG system with €0.839/kWh is the cost-effective solution for GSM base stations, including 5 kW PV, 1 kW WT, 16 battery units, and 3 kW DG. To ensure the power supply continuity, this hybrid system may create extra electricity of 3792.9 kWh each year.
Reference [55]HOMERThe combined use of solar PV and wind turbine systems for rural cellular base stations, with 2 kW of PV, 1 kW WT, 3 battery units, 1 kW of the electric grid, and an annual savings of up to 39 percent, is the most economical solution. However, for the LTE base station in off-grid locations, the stand-alone solar PV system provides up to 43% annual operating expense (OPEX) savings with 2 kW PV, 4 battery units, and 1 kW DG for backup power.
Reference [56]HOMERPowering the cellular network may be achieved via hybrid solar PV/WT and standalone solar PV systems. The stand-alone solar photovoltaic system is a viable alternative for establishing a green cellular network with a 9 kW PV and 64 batteries with an NPC of $ 30,366 in terms of cost, sustainability, and GHG problems. If the diesel generator system is exchanged with a hybrid solar PV/WT and solar PV supply, it is possible to achieve savings of up to 56.99 percent and 56.13 percent respectively.
Reference [57]HOMERIntegrated solar PV/DG system is the most cost-effective GSM BS configuration with $69,811 NPC, $0.409/kWh of energy, 10 kW of PV, 64 battery units, and a 5.5 kW DG. The result of sensitivity means that the hybrid system may avoid GHG emissions by 1.4 tons per year in comparison with the stand-alone DG system.
Reference [58]HOMERThe hybrid solar PV/DG system for the GSM BSs offers a cost of energy of €0.436/kWh, an NPC of €88,463, a PV with 2.5 kW, 12 battery and a DG of 2 kW is the most cheaply possible configuration.
Reference [59]HOMERThe solar PV/battery system with small size DG provides a cost of $1.657/kWh for off-grid GSM BSs to be powered will be the most economical configuration; it consists of 5 kW PV, 16 batteries with 2 simultaneous cables, and 4 kW DG. In this approach, the major power is provided by the solar PV/battery bank while the DG supplies the supporting power.
[Proposed]HOMER MATLABThe main contribution of the proposed article is to introduce a hybrid solar PV/H/FC-powered green cellular network along with a sufficient battery bank. The optimal criteria of the proposed system are 4 kW PV, 1 kW FC, 1 kW electrolyzer, 16 units of batteries, and $0.308/kWh under 10 MHz system bandwidth. The optimal system architecture, economic feasibility, and GHG emissions of this work have been examined using HOMER optimization software. On the other hand, the key parameters of the wireless network (throughput, and energy efficiency) have been evaluated with the help of MATLAB-based Monte Carlo simulations.
Publisher’s Note: MDPI stays neutral with regard to jurisdictional claims in published maps and institutional affiliations.

