Article

Characterization and Cause Analysis of Shallow Groundwater Hydrochemistry in the Plains of Henan Province, China

1
Hebei Center for Ecological and Environmental Geology Research, School of Water Resources and Environment, Hebei GEO University, Shijiazhuang 050031, China
2
Hebei Province Key Laboratory of Sustained Utilization & Development of Water Resources, Shijiazhuang 050031, China
3
Hebei Province Collaborative Innovation Center for Sustainable Utilization of Water Resources and Optimization of Industrial Structure, Shijiazhuang 050031, China
4
Mineral Exploration Institute Co. of Zhejiang Province, Hangzhou 310013, China
5
Land and Resources Exploration Center of Hebei Geological and Mineral Bureau, Shijiazhuang 050031, China
*
Author to whom correspondence should be addressed.
Sustainability 2021, 13(22), 12586; https://doi.org/10.3390/su132212586
Submission received: 11 October 2021 / Revised: 27 October 2021 / Accepted: 9 November 2021 / Published: 15 November 2021

Abstract

:
With the development of the human population and society, groundwater environmental problems have become an important factor limiting global socioeconomic development, and the study of groundwater hydrochemical characteristics and pollution is a current hot issue. In this study, data regarding shallow groundwater quality in 76 instances were used to evaluate the quality of shallow groundwater in the plains of Henan Province, China, by using a combination of subjective and objective assignments, mathematical statistics, Piper trilinear diagram, Gibbs diagram, ion ratio analysis, and other methods to study the hydrochemical characteristics of groundwater and its formation mechanism. The results showed that the groundwater quality in most areas of Henan Plain is in good condition, and the proportion of samples with excellent grades and good grades is as high as 43.42% and 35.53%. The range of poor and extremely poor water quality is small, and only five samples are judged as poor and extremely poor grades, mainly distributed in Jiaozuo City, Xinxiang City, Zhoukou City, and Puyang City. The groundwater anionic hydrochemistry is mainly of the HCO3 type, accounting for 61.84% of the samples and locally transformed downstream to HCO3·SO4, HCO3·SO4·Cl, HCO3·Cl·SO4, and Cl·SO4·HCO3. Cations are predominantly of the Ca/Mg and Ca–Mg/Mg–Ca type, and gradually transformed to the Na–Ca/Ca–Na and Na–Mg/Mg–Na type along the runoff direction. Water–rock interactions and anthropogenic factors dominate the hydrochemistry evolution, with major geochemical processes involving the precipitation of calcite and dolomite as well as the weathering dissolution of rock salt and fluorite. Human activity is an important factor affecting the distribution of NO3–N and Fe3+. It is recommended that groundwater be continuously monitored to provide scientific data for sustainable groundwater quality management and that appropriate measures be developed to prevent further degradation of the groundwater environment.

1. Introduction

Groundwater is an important source of fresh water for human survival, with about one-third of the world’s population drinking from groundwater and about 40% of food production also relying on groundwater [1,2]. However, as modernization accelerates around the world, increasingly intense agricultural, industrial, and human activities pose a great threat to groundwater ecology [3]. According to statistics, globally, about 80% of the population do not have access to safe drinking water sources, and approximately 2 million to 12 million people die each year from diseases related to water pollution [4,5]. Likewise, groundwater quality problems limit regional economic development. In 2011, agricultural losses due to water pollution in the Yangtze River Delta basin of China amounted to CNY 13.09 billion, and losses in Shanghai alone reached CNY 3.55 billion [6]. Groundwater resource management has become a major concern in most countries around the world, and its quantity and quality have a direct impact on human health and the sustainable development of society [7].
Considering the importance of groundwater pollution, scholars in various countries are focusing on this issue. Guo et al. analyzed the groundwater hydrochemical characteristics and hydrogeochemical processes in Datong City and identified five geochemical zones, suggesting that precipitation dissolution of calcite and dolomite, ion exchange and evaporation, NaHCO3 leaching in saline sites, and the influence of artificial activities jointly dominate the hydrogeochemical characteristics of these zones [8]. Jeevanandam et al. analyzed 47 well water samples from the Ponnaiyar River basin and concluded that most of the groundwater in the region is unsuitable for irrigation and far from meeting drinking water standards, with the most serious contamination threat coming from nitrate ions from sewage discharge and fertilizer application [9]. In addition, heavy metal pollution is of great concern due to its potential impact on human health. Oateng et al. noted that leachate from landfills can cause considerable heavy metal contamination of groundwater [10]. Groundwater pollution is also impacted by climate change. The decline in precipitation will change the agricultural production mode, thereby reducing river flow and aquifer recharge, finally affecting the quality of groundwater [11]. At the same time, in arid and semi-arid areas, leachate from dry latrines may also be an important source of nitrate contamination [12]. Thus, the impact on groundwater quality comes from multiple sources, which are mainly controlled by a combination of water–rock interactions, human activities, and climatic factors [13].
Analysis of hydrochemical characteristics can effectively and qualitatively reflect the groundwater quality of an area and its pollution causes; commonly used analysis methods include mathematical and statistical analysis, Gibbs diagram analysis, Piper trilinear plot analysis, and ion ratio relationship analysis [14,15]. Mathematical statistics can analyze the characteristics of hydrochemistry parameters and explore the spatial variability of groundwater. Gibbs diagrams can analyze the formation pathways of groundwater hydrochemistry and reveal the ionic origins of water bodies. Piper plots can visually reflect the hydrochemistry composition of water bodies and its change characteristics [16,17,18]. The use of these methods provides a strong theoretical basis for investigating the causes of regional groundwater quality. Compared with groundwater water chemistry characterization, the groundwater quality index (WQI) represents groundwater quality in the form of numerical values, which can visually and quantitatively reflect the groundwater quality of a region. By assigning weights for each test index, multiplying them with the quantified values of each index, and finally summing them, the quality is graded according to the values calculated for each sample [19]. At present, the way to determine the relative weights of evaluation indexes is mostly based on the subjective and objective assignment methods. The subjective assignment method [20,21,22,23,24,25] is simple and covers a wide range, but because it does not consider data variability, the water quality evaluation results are often oriented to the subjective ideations of decision-makers, and different decision-makers place different emphases on the same indicators [26,27,28,29,30]. Although the objective assignment method [31,32] has a strict mathematical meaning, it tends to ignore the decision-makers’ emphases on different attributes, and sometimes the results are contrary to the importance of the actual attributes. Different assignment methods play a decisive role in the groundwater quality assessment results. Henan Province, as the third-most populous province in China, only has 41.371 billion cubic meters of total multi-year average water resources, with uneven distribution of water resources and serious water quality pollution [33,34]. As in other regions, groundwater is the most important source of drinking water in Henan Province. Unfortunately, previous studies on water resources in the region have focused on groundwater resource renewal studies, sustainable mining assessments, or risk assessments of individual sources of pollution [35,36,37] and have not yet undertaken a comprehensive and systematic assessment of groundwater quality. In view of this, the present study was conducted based on sampling data of shallow groundwater in the plains of Henan Province, using the entropy weight method with combined subjective assignment to determine the groundwater quality index, as well as mathematical statistics, Piper trilinear diagram, Gibbs diagram, correlation analysis, and ion ratio analysis to analyze its hydrochemical characteristics and formation mechanism and explore its pollution sources, in order to provide some scientific basis for the development, management and protection of shallow groundwater resources.

2. Data and Research Methodology
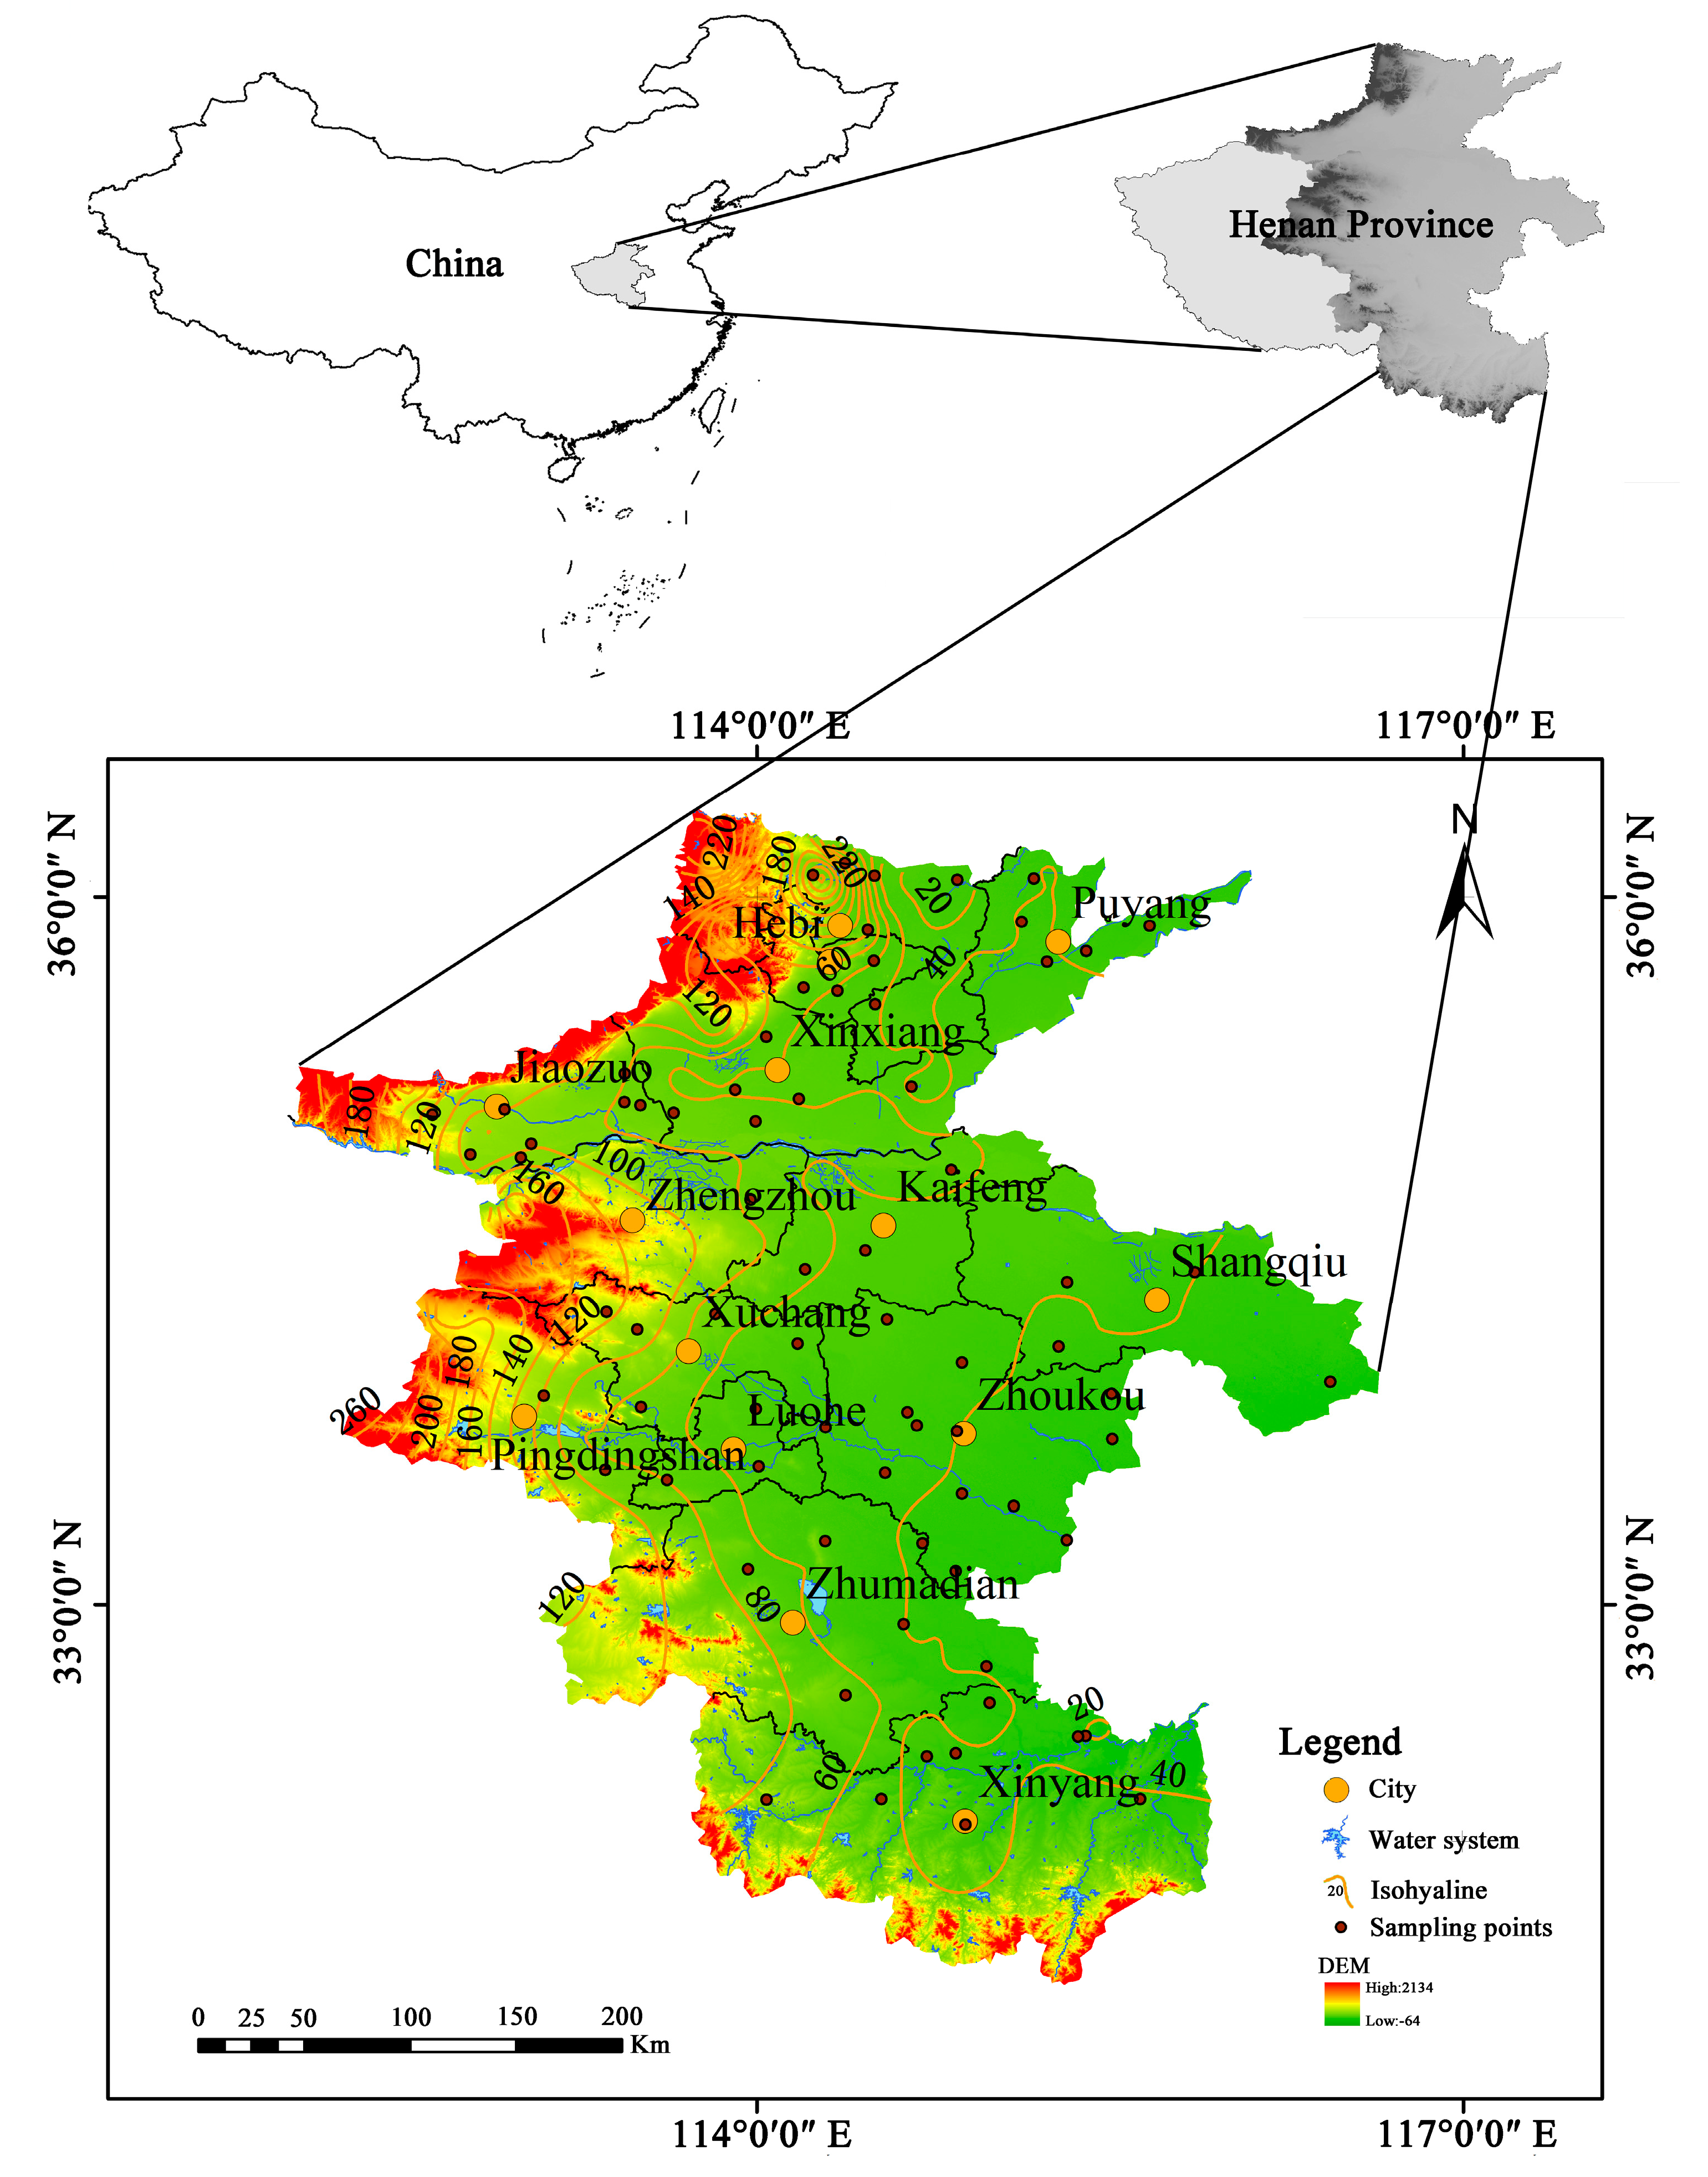
2.1. Data Sampling

Henan Province is located in the central part of China, with coordinates between ~31°23′–36°22′ N and ~110°21′–116°39′ E. It has a total area of 167,000 km2 and is an important comprehensive transportation hub and center of human, logistics, and information flow in China. It has a continental monsoon climate with a transition from the north subtropical zone to the warm temperate zone, with remarkable climatic features, an average temperature of ~12–16 ℃, and an average annual rainfall of ~532.5–138.6 mm, mostly concentrated in the months of June to August [38]. Groundwater has become the main source of water supply in Henan Province owing to year-on-year increasing exploitation [39]. In this study, a total of 76 sets of shallow groundwater samples were collected in the plains of Henan Province, with a sampling depth of less than 50 m and a relatively uniform distribution of sampling points (Figure 1). The samples were tested for K+, Na+, Ca2+, Mg2+, Fe3+, Cl, SO42−, HCO3, F, NO3–N, Mn, As, total hardness (TH), total dissolved solid (TDS), and pH. The detection limits for Mn and As were 0.001 mg/L. During data processing, samples with values less than the detection values for these two indicators were treated as 0.001 mg/L.

2.2. Research Methodology

After the completion of sample testing and analysis, the entropy weight method combined with the subjective assignment method was used to determine the relative weights of the evaluation indexes and to continue the traditional water quality index (WQI) method to classify the groundwater classes in the study area. The characteristics of the hydrochemistry parameters were analyzed by mathematical statistics to explore the spatial variability of groundwater chemical ions in the study area. The formation pathways of groundwater hydrochemistry were analyzed using a Gibbs diagram to reveal the ionic origins of the water bodies. The Piper trilinear diagram was used to analyze the hydrochemical composition of the water bodies in the study area and their distribution characteristics. Correlation analysis and ion ratio relationship analysis were conducted to reveal the main hydrochemical processes of groundwater quality assessment. The relative weights of the evaluation indicators were determined as follows:
The sample data were standardized according to (Equation (1)).
y i , j = x i , j x j , m i n x j , m a x x j , m i n
where x ij is the concentration value for sample i of the jth chemical indicator, x j , max is the maximum value of the concentration of the jth chemical indicator, and x j , max is the maximum value of the concentration of the jth chemical indicator.
The weight of the ith sample was calculated under the jth chemical indicator after standardization:
P i , j = y i , j i = 1 n y i , j
where n is the number of samples.
The information entropy (Equation (3)), information utility value (Equation (4)), and entropy weight (Equation (5)) were calculated for each chemical indicator [40]:
e i , j = 1 l n ( n ) i = 1 n p i , j l n ( p i , j )
d j = 1 e i , j
w j = d j d j
The average of the calculated entropy weights and subjective assigned weights was used as the final indicator weight for this evaluation to calculate the quality rating of each chemical indicator in each sample by Equation (6) and the groundwater quality index (GWQI) by Equation (7), where the subjective assigned weights were calculated according to the relative importance of the indicators provided in the literature [26,27] as follows:
q i , j = C i , j S j × 100
G W Q I i = j = 1 m w j q i , j
where   C i , j is the concentration of sample i of chemical indicator j, and S j is the WHO-recommended limit value for chemical indicator j.

3. Water Chemistry Component Characteristics

3.1. Statistical Characteristics of Groups

To assess the data characteristics of hydrochemical indicators in the study area, the minimum, maximum, and mean values of each chemical indicator for the 76 groups of tested samples and the coefficient of variation were calculated and analyzed in comparison with World Health Organization’s (WHO) guidelines for drinking-water quality (Table 1), which state that if an indicator exceeds the limit value, it is detrimental to human health [41]. Moreover, the groundwater chemical indicator concentrations in the study area were interpolated using the ordinary kriging method (Figure 2), and the concentrations of each indicator were classified into 10 classes using the geometric partitioning method to determine more significant differences.
Table 1 and Figure 2 show that the concentrations of Fe3+ and Mn in the samples ranged from 0.010 to 6.130 mg/L and from 0.001 to 2.060 mg/L, with mean values of 0.493 and 0.182 mg/L, respectively, and both mean values were higher than the WHO-recommended limits. The coefficients of variation of Fe3+ and Mn were 2.062 and 1.797, respectively, which were relatively larger than those of the other chemical indicators, and Fe3+ and Mn had a large uneven distribution of concentrations, which also indicates that these two chemical indicators are sensitive to environmental changes. The pH in the samples varied between 7.000 and 8.300, with a mean value of 7.423 and a coefficient of variation of 0.040, and the dispersion of the concentration distribution was small, indicating that the shallow groundwater in the study area was overall weakly alkaline, which meets WHO drinking water standards. The TDS in the samples varied between 333.090 and 1764.690 mg/L, with a mean value of 779.659 mg/L and a variation coefficient of 0.422, indicating a moderate degree of dispersion, whereby the WHO standard is 1000 mg/L; 27.63% of the samples exceeded the recommended limit. Total groundwater hardness is the sum of all metal ions except alkali metals, and the TDS in the tested samples varied between 25.000 and 1057.500 mg/L, with a mean value of 436.901 mg/L and a coefficient of variation of 0.464. The degree of dispersion was similar to that of TDS, with 28.94% of the samples exceeding the WHO-recommended limit value. The maximum concentration of arsenic in the samples was up to 0.062 mg/L, whereas the WHO-recommended limit was 0.010 mg/L; therefore, the maximum value far exceeded the recommended limit. Statistically, approximately 6.48% of the samples exceeded the limit for As, and the coefficient of variation for this indicator was 2.534, with a concentration of areas in the study area where As levels exceeded the limit. Nitrate nitrogen varied between 0.005 and 69.320 mg/L, with a relatively small mean value of 7.689 and a coefficient of variation of 1.797. The WHO-recommended limit value for fluoride is 1.5 mg/L, and 17.11% of the samples collected in this study area exceeded the recommended value. The average anion concentrations were HCO3 > SO42− > Cl, with HCO3 concentrations being significantly higher than those of the other two indicators. The mean values of all three concentrations were lower than the WHO-recommended limits, and the coefficient of variation was not significantly different, varying between 0.333 and 0.784. Furthermore, 26.32%, 9.21%, and 5.26% of the sample data exceeded the recommended limits for these three indicators, respectively. The average concentration of cations was Na+ > Ca2+ > Mg2+ > K+, similar to that of anions, and the average values of all three concentrations were also below the WHO-recommended limits. The coefficient of variation of K+ was as high as 2.696, which was quite different from that of the other three cations. In terms of spatial distribution, Na+, Mg2+, Cl, SO42−, HCO3, F, TDS, and pH concentrations were similarly distributed, with a gradual increase from the southwest to the northeast. K+ was more abnormally distributed relative to the other cations, with high concentrations of K+ in almost every city except Xinyang City, Hebi City, and Anyang City, with a patchy distribution, especially in Pingdingshan City. The concentration of TH was higher in the northwestern part of the study area, with a decreasing trend from the northwest to the southeast, and the smallest concentration of 25.000 mg/L in the southeastern part of Xinyang City. The high concentration of Fe3+ was mainly distributed in Jiaozuo City, Xinxiang City, Puyang City, and the northwestern part of Zhoukou City, with obvious variability in distribution. The distribution of Mn and Fe3+ was basically similar, but the overall concentration was significantly lower than that of Fe3+. In contrast, the distribution of As was opposite to that of NO3–N, and only a certain amount of As was present in central Xinxiang City, southeastern Anyang City, and southwestern Kaifeng City.

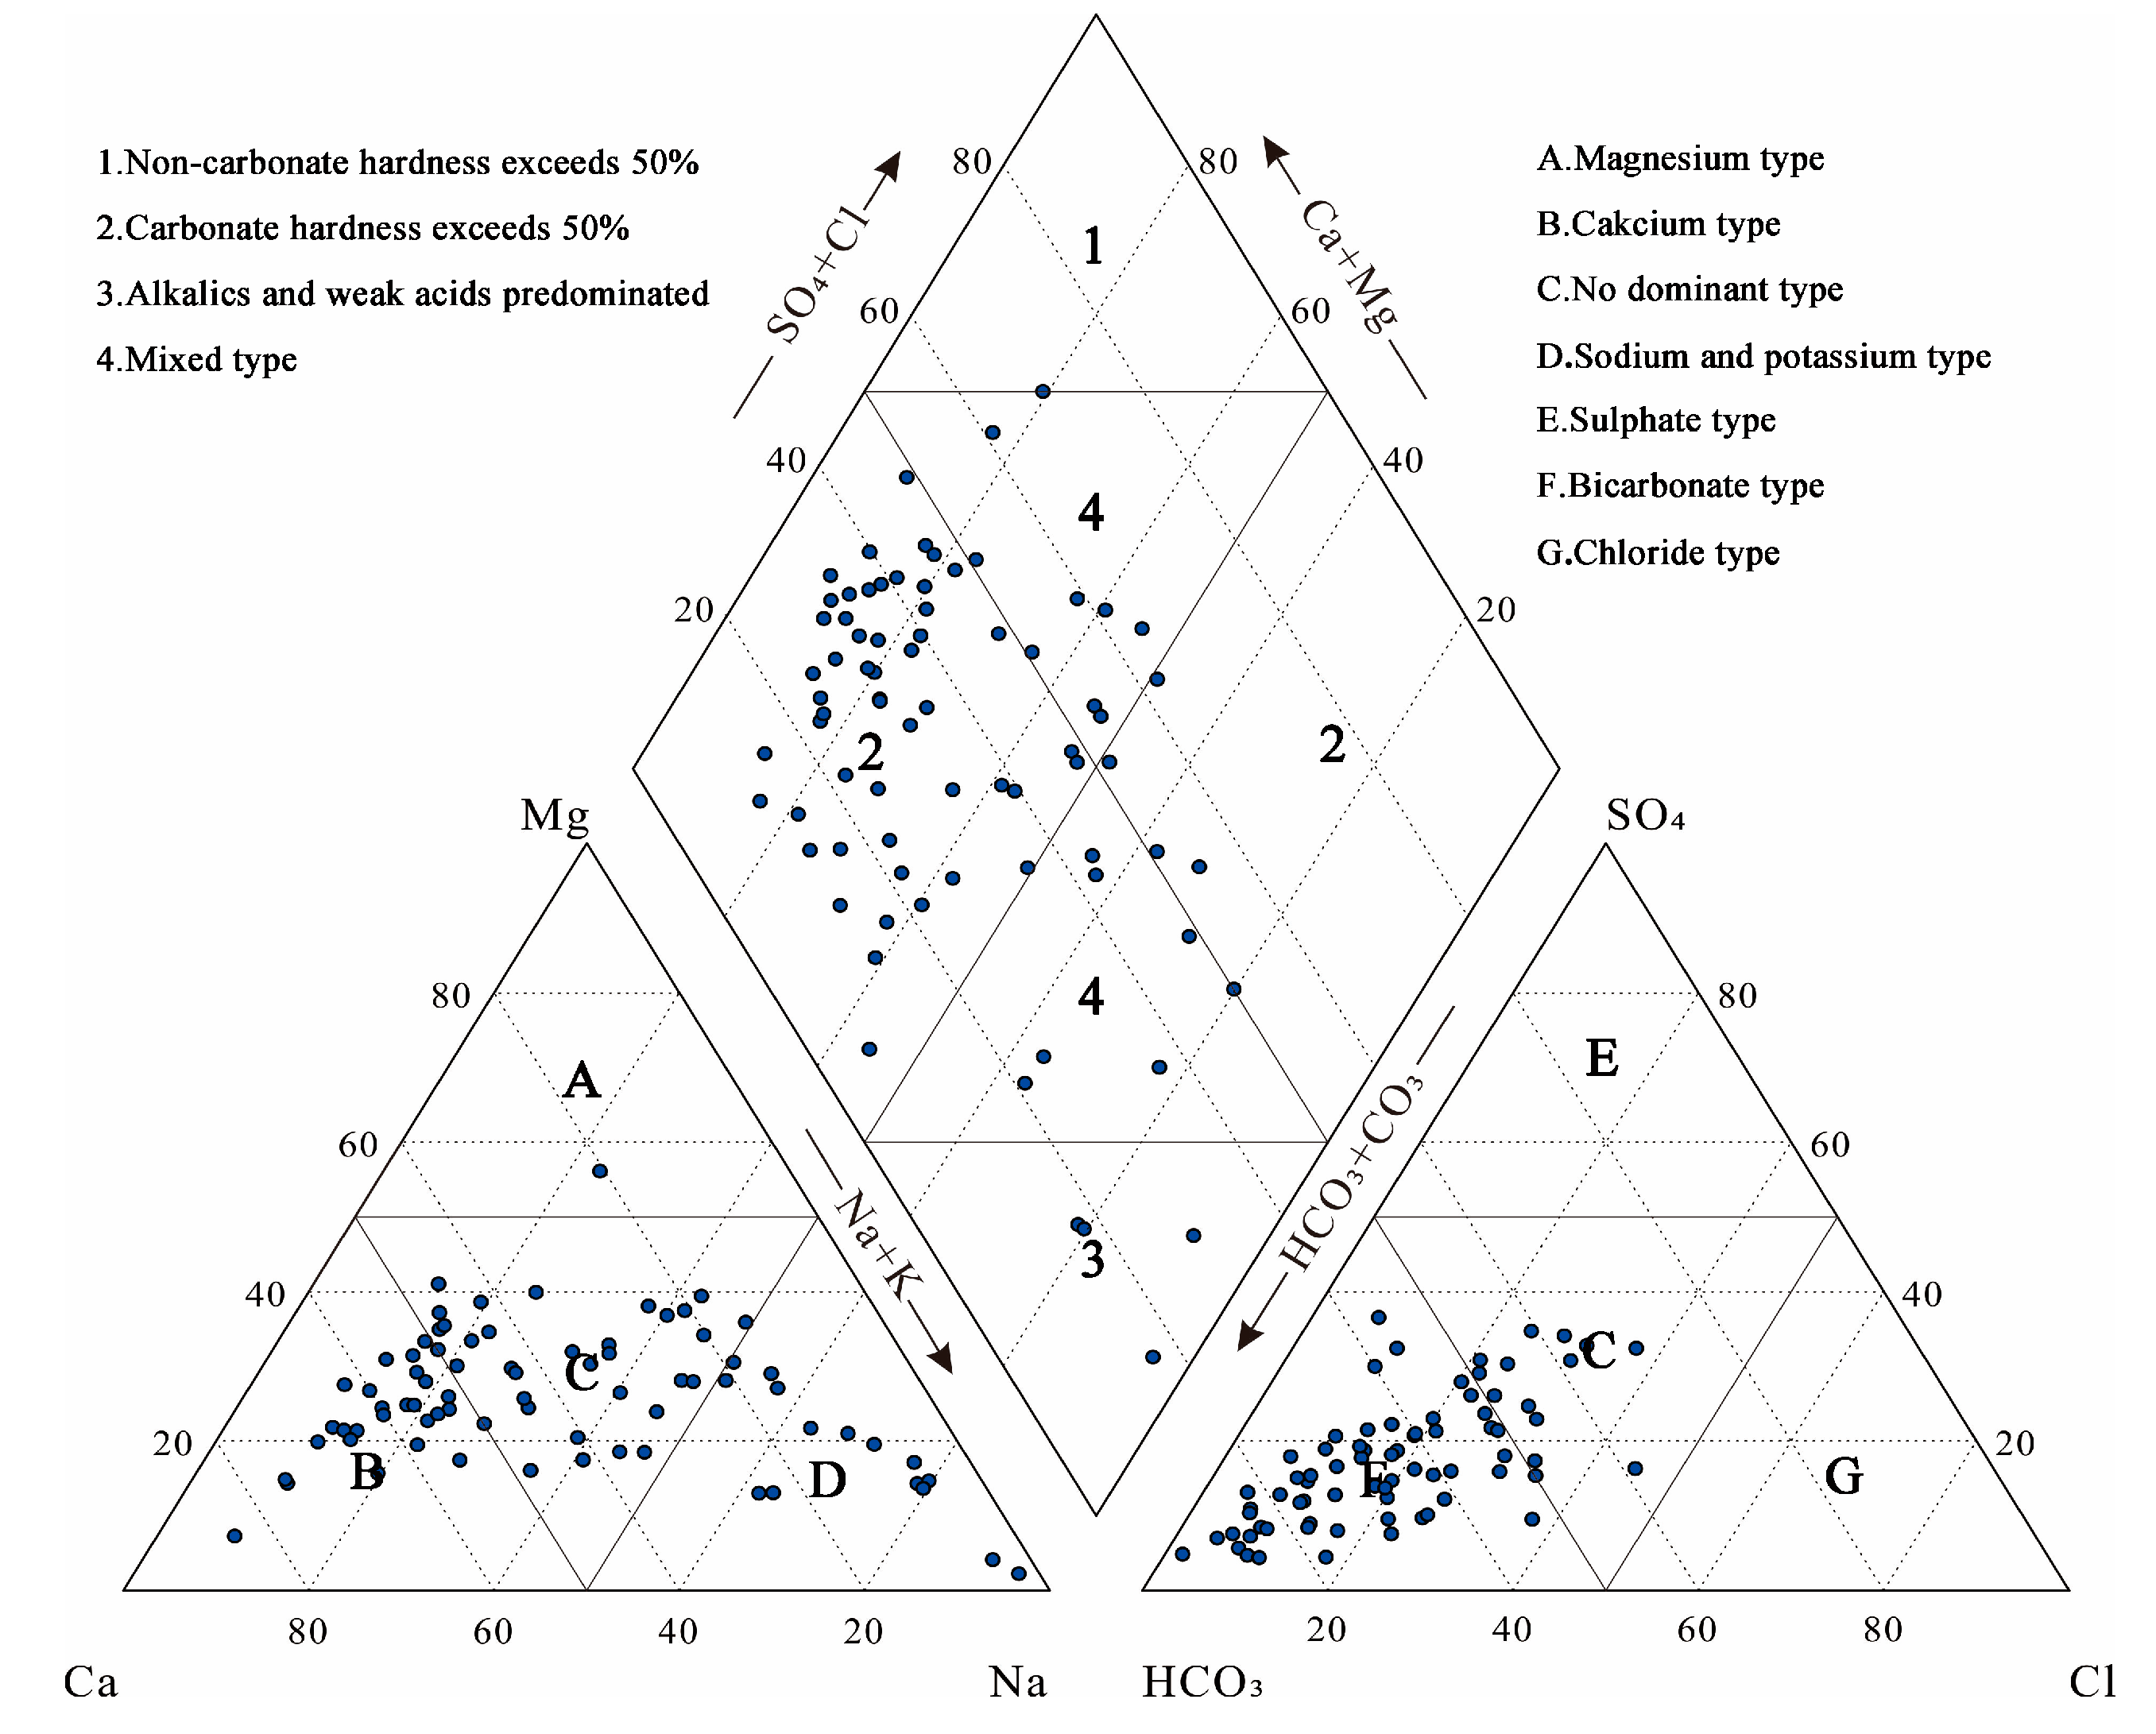
3.2. Distribution of Hydrochemistry Types

From the Piper trilinear diagram of the groundwater chemistry in Figure 3, it can be seen that most of the samples had the hydrochemistry type of HCO3, accounting for approximately 61.84% of the total samples; 32.89% of the samples had the hydrochemistry types of HCO3–Cl and HCO3–SO4, and they are mainly located in the central and northern part of the study area. Moreover, a small number of samples had the hydrochemistry type of a mixture of three anions and were mainly located in the central part of Xinxiang City and southwest of Hebi City, showing a trend of conversion from the HCO3 type to the HCO3–SO4 type, HCO3–SO4–Cl type, HCO3–Cl–SO4, and Cl–SO4–HCO3 type. From the cationic point of view, the hydrochemistry types were dominated by the Ca/Na, Ca–Mg/Mg–Ca, and Na–Mg/Mg–Na types. The sample distribution of these water chemistry types had a certain zonation, as shown by the predominance of the Ca/Mg- and Ca–Mg/Mg–Ca-type water in the pre-mountain sloping plain, where As toward the central plain area, the Na+ content gradually increased, and the water chemistry type began to change to the Na–Ca/Ca–Na type, Na–Mg/Mg–Na type, and finally to the Na type, which predominated in the eastern low plain area. As shown by the prismatic diagram in Figure 3, the groundwater types were overall predominated by alkaline earth metals and weak acids.

3.3. Groundwater Quality Assessment Results

The relative weights of the indicators calculated according to the entropy weighting method and the literature [26,27] are shown in Table 2, where the missing items are in analogous values, and their average values were taken to calculate the water quality index according to Equations (6) and (7). The calculated water quality index for each sample was interpolated according to the inverse distance weighting method and graded according to Table 3 to obtain the distribution of the water quality index for the whole study area (Figure 4).
According to the numerical calculation and interpolation results of each groundwater sample, there were 33 samples with excellent grade, accounting for 43.42%; 27 samples with good grade, accounting for 35.53%; 11 samples with moderate grade, accounting for 14.47%; and fewer samples with poor and very poor grade of 3 and 2, respectively. The areas with excellent water quality in the study area were mainly distributed in Xinyang City, Zhumadian City, most of Xuchang City, central and northeastern Pingdingshan City, central Anyang City, and southeastern Shangqiu City, with a small distribution in other cities. The areas with good water quality occupied most of the entire study area. The area with moderate water quality was mainly distributed in the central and northeastern part of the study area, namely Kaifeng City, Xinxiang City, and Puyang City, and had a certain area distribution in Jiaozuo City. The area of poor and very poor water quality in the study area was small, mainly distributed in Jiaozuo City, Xinxiang City, Zhoukou City, and Puyang City, in a patchy distribution.

4. Cause Analysis of Groundwater Hydrochemistry

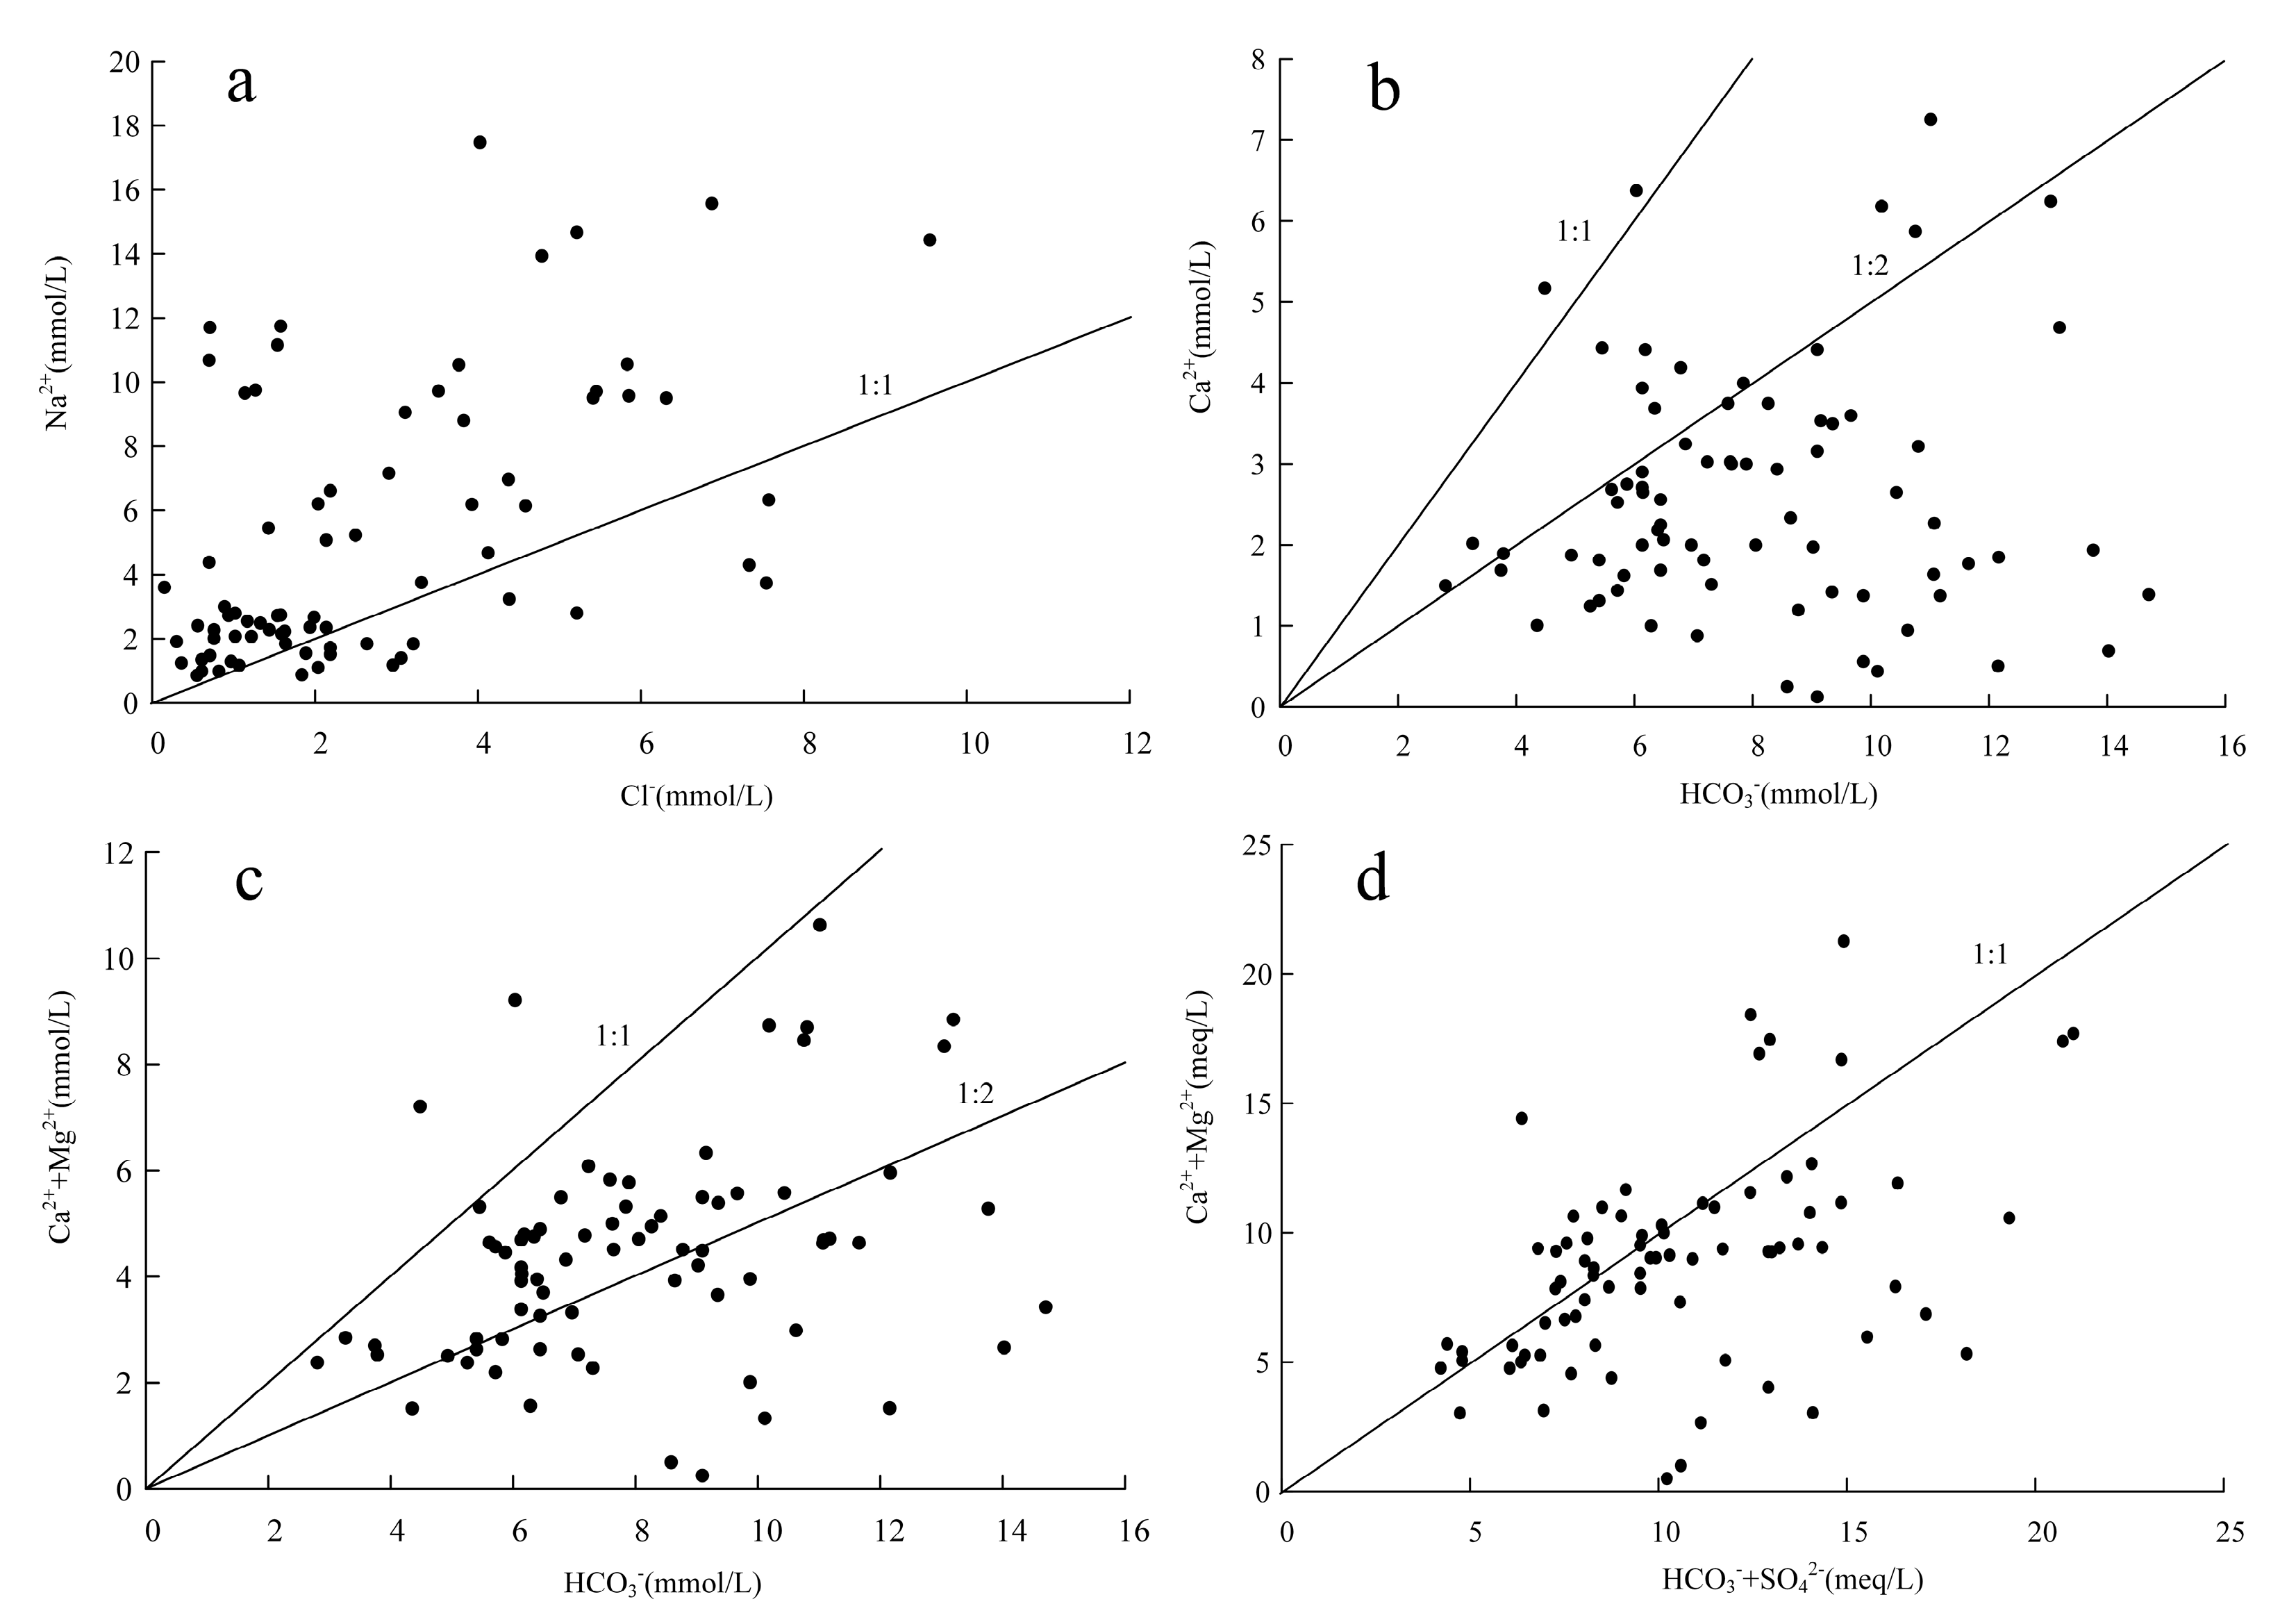
4.1. Ionic Change Pattern

The evolutionary process of hydrochemistry is related to groundwater runoff conditions and to the burial depth of the groundwater table [42]. Along the direction of groundwater runoff, the concentration of major groundwater anions and cations will generally increase as the groundwater runoff path grows and is subject to more persistent water-rock interactions. Moreover, the shallower the groundwater burial depth is, the larger the proportion of Cl and SO42− that will be affected by evaporation concentration, and these will even become the dominant ions. In this study, two typical profiles were selected, and Stiff diagrams were drawn to investigate the water chemistry change pattern according to the groundwater flow direction and burial depth distribution. The locations of the two water chemistry profiles are shown in Figure 5, and the corresponding Stiff diagrams are shown in Figure 6. P1 is the profile along the burial depth of groundwater level from shallow to deep, from JC004→JC028→JC072→JC091; P2 is the profile along the direction of groundwater runoff, from JC012→JC046→JC069→JC029. From P1 in Figure 7, it can be seen that the anion content in groundwater increased with the burial depth from shallow to deep, and the HCO3 content increased significantly, indicating that the effect of evaporation and concentration on HCO3 gradually decreased. The content of Cl and SO42− did not decrease, but increased slightly, which is obviously not in accordance with the change in water chemistry with the burial depth of groundwater under natural conditions, and it is presumed that the content of Cl and SO42− is influenced by stronger human activities. As shown by P2, along the direction of groundwater runoff, Na+ showed an upward trend in general, but at the middle and lower reaches, it initially decreased and then increased; Ca2+ had the same overall trend as Na+, but at the middle and lower reaches, there was an opposite trend to Na+, which might be due to the cation exchange adsorption of Na+ and Ca2+ in this region; furthermore, the change inMg2+ content was basically the same, with no obvious rise and fall characteristics, which may be influenced by the use of magnesium fertilizer in agricultural production activities. It is obvious that the changes in groundwater chemistry in the study area do not fully conform to the natural laws, and to some extent, may also be influenced by stronger human production activities.

4.2. Analysis of Ion Sources

Correlation analysis between ions can, to some extent, reveal the causal relationship between ions [43]. To explore the source of ions, correlation analysis was performed on the chemical indicators corresponding to the 76 samples (Table 4). It can be seen that Na+ has a moderate positive correlation with Cl, SO42−, F, and HCO3, indicating that Na+ may have the same material source as all these anions. Na+ in the study area shows a positive correlation with Cl, which may be related to the dissolution of rock salt (NaCl) (Equation (8)). The evolutionary relationship of the groundwater phase can be inferred from the proportional relationship between ions, and as shown in Figure 7a, the scatter of Na+ and Cl was basically distributed on a 1:1 straight line, but most of it lay above the straight line. The amount of scattered Na+ located above the straight line was larger than that of Cl, indicating that the source of Na+ is not only from the dissolution of rock salt but also may be related to the weathering dissolution of albite (Equation (9)) and the presence of mannite (Na2SO4) in the inclusion zone (Equation (10)), and may also be related to the occurrence of cation exchange adsorption of Mg2+ and Ca2+. Na+, SO42−, and HCO3 show a stronger positive correlation, corroborating part of the above speculation. A small portion of the scatter lies below the 1:1 straight line, and this extra Cl may come from anthropogenic pollution. Na+ is positively correlated with F, but F is negatively correlated with Ca2+, suggesting that the formation of F is related to the dissolved precipitation of fluorescent stone (CaF2) (Equation (11)).
NaCl→Na+ + Cl
4NaAlSi3O8 + 4CO2 + 22H2O = Al4(Si4O10) + 8H4SiO4 + 4Na+ + 4HCO3
Na2SO4→2Na+ + SO42−
CaF2→Ca2+ + 2F
Ca2+, Mg2+, and HCO3- are generally derived from dissolved carbonates and, therefore, are correlated. However, Mg2+ correlates much more strongly with SO42− than Ca2+ with SO42−, which may be related to the use of Mg fertilizer in agricultural production in the study area. The chemical reaction equations of calcite and dolomite reflect the ratio between dissolved ions (Equations (12) and (13)).
CaCO3 + CO2 + H2O→Ca2+ + 2HCO3
CaMg(CO3)2 + 2CO2 + 2H2O→Mg2+ + Ca2+ + 4HCO3
The above chemical reaction equation shows that the ionic ratio of Ca2+, Mg2+, and Ca2+ to HCO3 from the dissolution of calcite and dolomite is between the 1:1 and 1:2 straight lines, and its magnitude depends on the amount of CO2 involved in the reaction. As displayed in Figure 7b, a small portion of the scatter lay above the 1:1 straight line, indicating that a small portion of the Ca2+ in the groundwater may have come from the dissolution of dolomite or anorthite; there was also a portion of the scatter between the 1:1 and 1:2 straight lines, and this portion of the Ca2+ may have come from the dissolution of calcite. Most of the scatter lay below the 1:2 straight line, and the decrease in Ca2+ in the groundwater confirms that the increase in Na+ in Figure 7a may be related to cation exchange sorption. As shown in Figure 7c, a small sector of the scatter lay above the 1:1 straight line, which is similar to the distribution in Figure 7b, indicating the presence of other sources of Ca2+ and Mg2+ in a small portion of groundwater in the study area; a significant portion of the scatter lay between the 1:1 and 1:2 straight lines, indicating that dissolution of dolomite is an important source of Ca2+ and Mg2+ in groundwater in the study area. Figure 7d shows the ionic ratio between Ca2+ + Mg2+, and HCO3 + SO42−, with most of the scatter located along the 1:1 straight line, and a small portion of the scatter located above the straight line, presumably due to excess Mg2+, which confirms the above point about magnesium fertilizer use. A significant portion of the scatter lies below the straight line, further suggesting that the reduction in Ca2+ may be caused by cation exchange.
Nitrate pollution generally results from the heavy use of nitrogen fertilizers, large discharge of domestic and industrial effluents, accumulation of solid wastes and animal manure, and the potent role of human activities in the distribution of nitrate [44]. For this reason, in this study, to investigate the main sources of nitrate pollution in the study area, the distribution of construction land in the study area was spatially overlaid with the distribution of nitrate nitrogen concentration (Figure 8). As shown in Figure 8, nitrate nitrogen was basically distributed at higher concentrations in places where construction land was more concentrated, and nitrate nitrogen content was lower in areas where construction land was sparser, such as the southern part of Xinyang City. The migration of Fe and Mn ions in groundwater is generally controlled by the composition of the water-bearing medium, runoff conditions, nature of the overlying soils, acid and alkaline conditions, and reducing environment [45], and because the properties of Fe and Mn are very similar, they often coexist in groundwater. The distribution of Fe and Mn concentrations in the study area was generally similar, except in Puyang City, Pingdingshan City, Xinxiang City, and the border between Zhoukou and Kaifeng City. These regions all had a high concentration of Fe3+, presumably due to industrial wastewater discharge; therefore, the total number of industrial sources in each city of the study area was counted in this study (Figure 9), and the top three cities in the order of the number of industrial sources were Jiaozuo City > Zhengzhou City > Puyang City > (Kaifeng City + Zhoukou City). Thus, it is clear that the regions with high Fe3+ concentration in the study area all had a considerable number of industrial pollution sources. Although the number of industrial pollution sources in Pingdingshan City was relatively small, the city of Wugang, which is known as the "capital of iron and steel," has a large amount of Fe3+ in the wastewater produced by iron and steel making. Arsenic in groundwater generally originates from the release of sediments produced by the weathering of rocks and can also arise from the discharge of industrial wastewater. The strongest correlation of As with Fe3+ and the most similar distribution with HCO3 in the study area indicate that the strong reducing environment limits the formation of iron oxides and indirectly attenuates the adsorption of iron oxide on As, leading to the elevated As content [46].

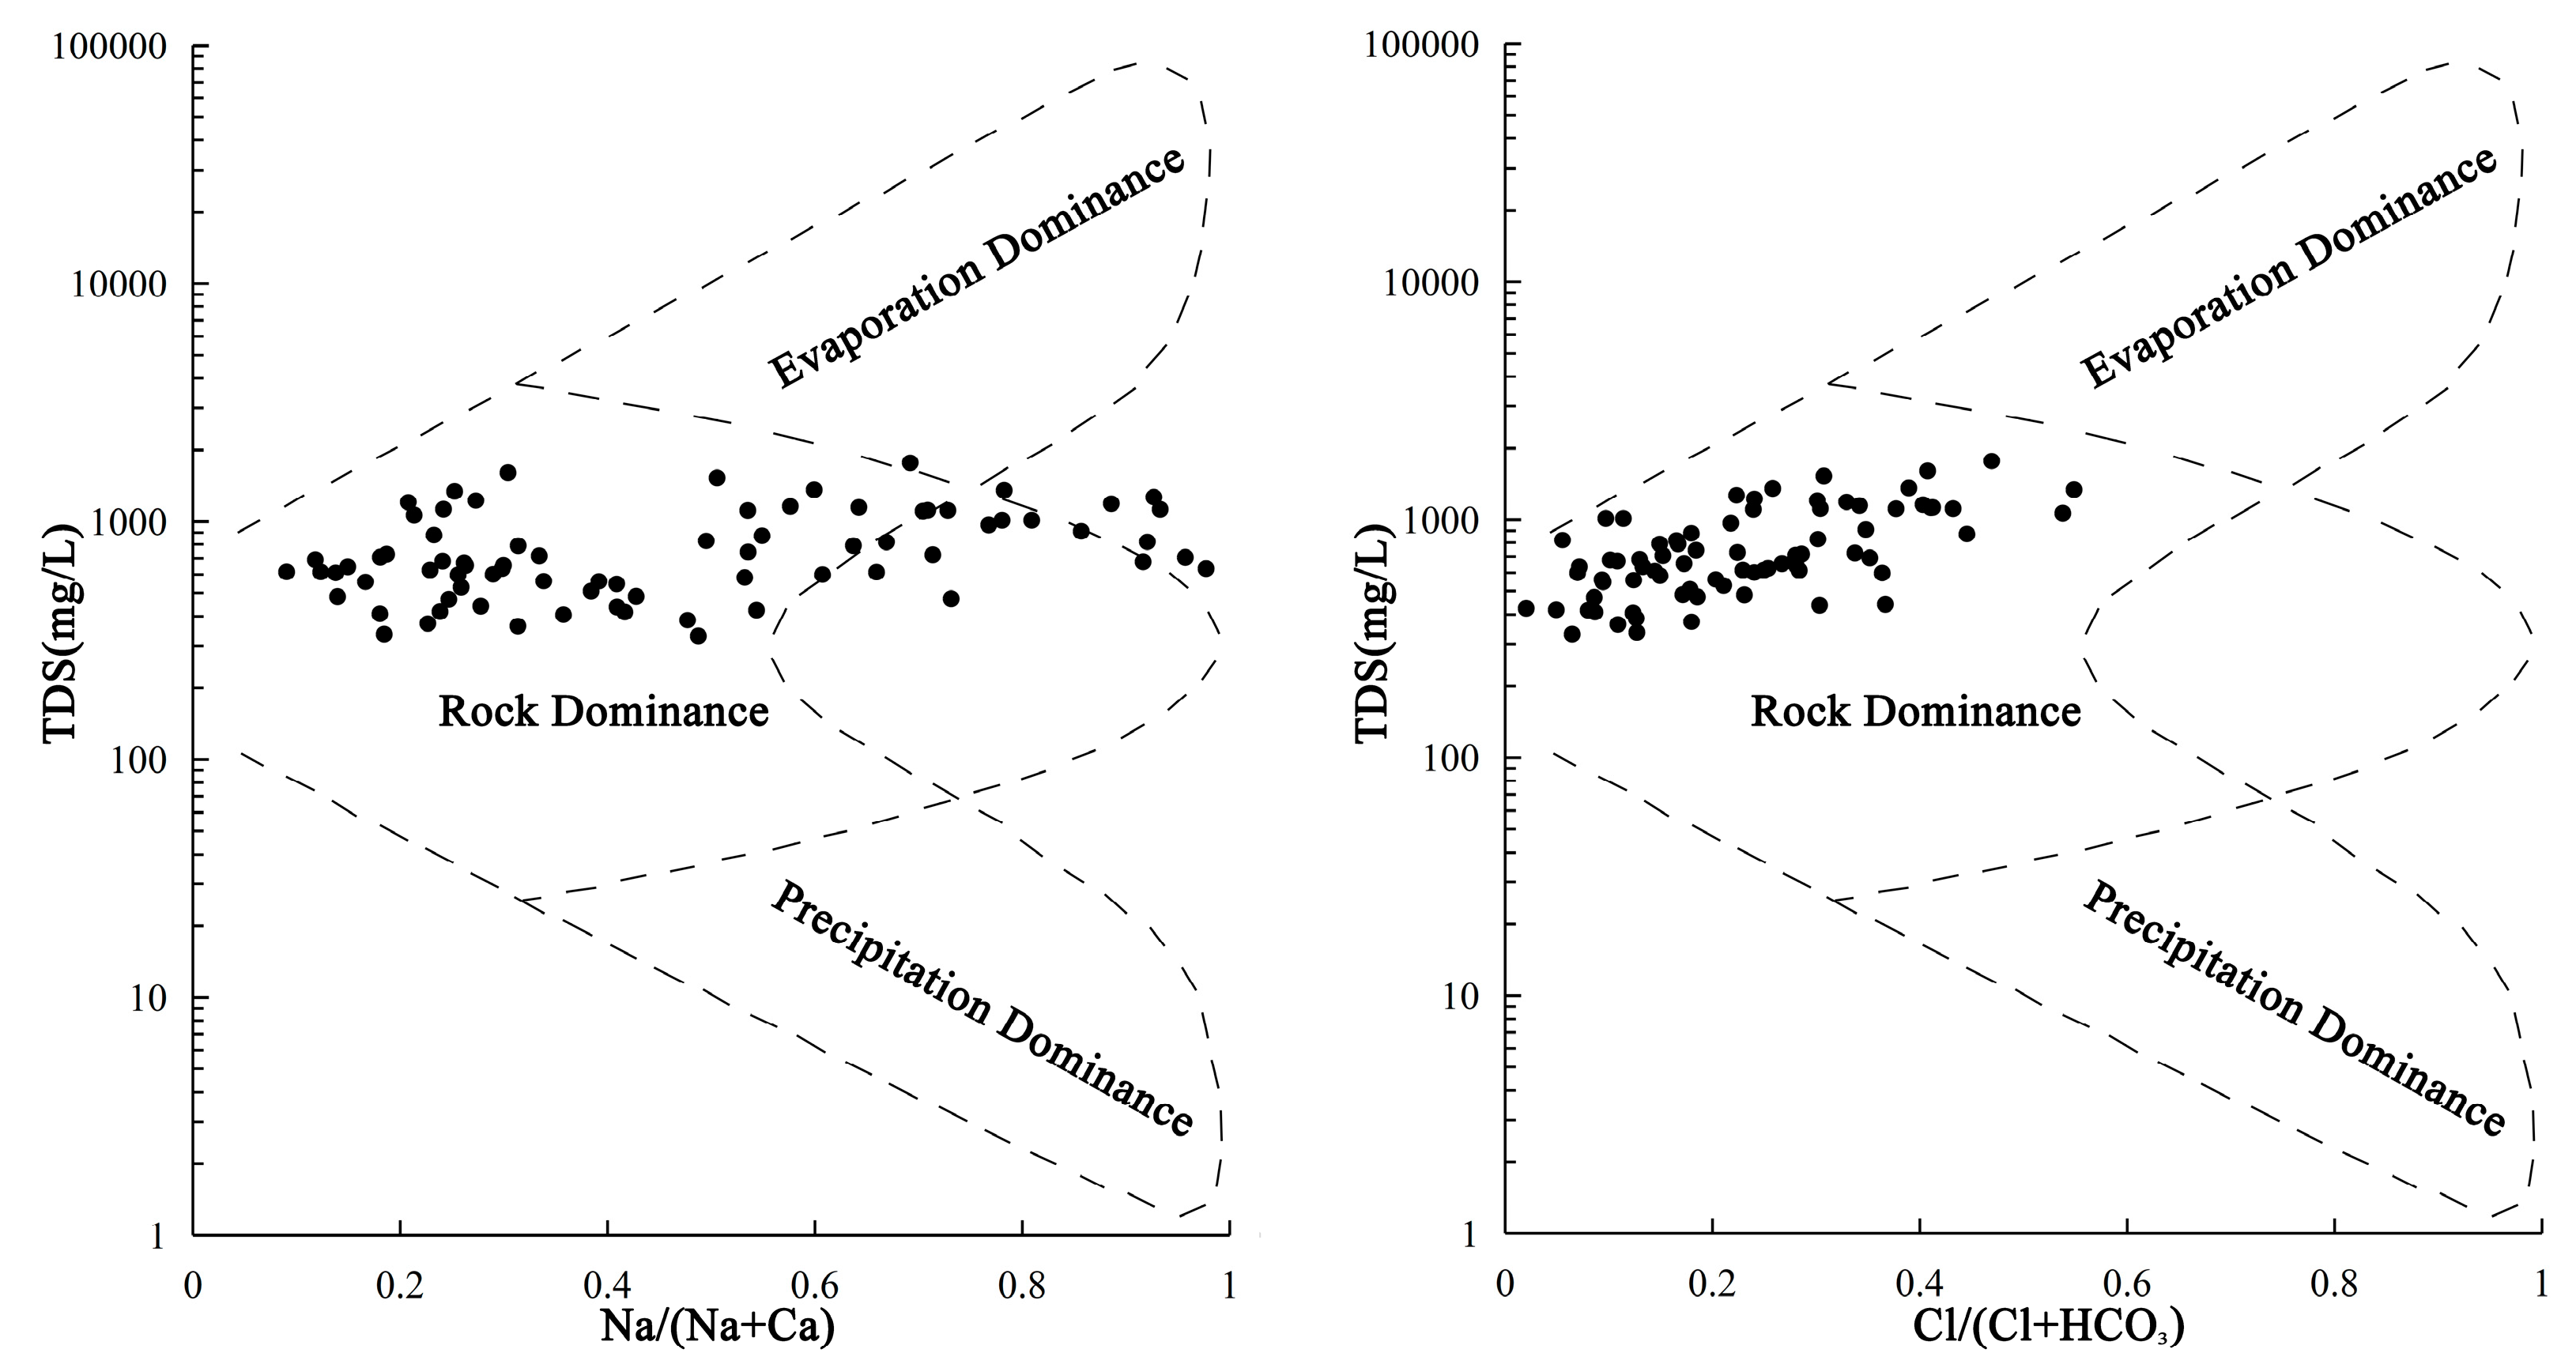
4.3. Mechanisms of Hydrochemical Formation

The Gibbs diagram allows the classification of factors affecting the chemical composition of natural water into evaporative concentration, water–rock interaction, and atmospheric precipitation [47]. According to the Gibbs diagram (Figure 10), most of the groundwater samples in the study area were located in the water–rock interaction region, and very few samples were located in the evaporative concentration region. The relationship between TDS and Na/(Na + Ca) shows that as the value of Na/(Na + Ca) increased, TDS did not change much, further indicating the presence of cation exchange adsorption during groundwater runoff. The trend in the distribution of the samples shows that the value of Cl/(Cl + HCO3) tended to increase with increasing TDS but remained within the range of water–rock interaction, which also indicates the presence of evaporative concentration of the shallow groundwater chemistry components in the study area with less influence. Given that the main formation mechanism of groundwater chemistry in the study area is water–rock interaction, and the main expression of water–rock interaction is the dissolution and precipitation of minerals, this study determined the water–rock interaction state of groundwater in the study area by calculating the saturation index of each sample relative to calcite, dolomite, fluorite, and rock salt. Figure 11 shows the relationship between the saturation index of groundwater samples relative to each mineral and TDS.
As shown in Figure 11, the saturation indices of groundwater samples relative to calcite and dolomite in the study area were mostly greater than 0, except for very few that were less than 0. The saturation indices ranged from −0.34 to 1.42 and from −0.79 to 2.61, respectively, indicating that precipitation of calcite and dolomite occurs in most areas of the study area. The saturation index scatter of groundwater samples relative to fluorite and rock salt all fell below the SI = 0 axis between −0.25 and −3.71 and from −8.03 to −5.6, respectively, suggesting that weathering dissolution of rock salt and fluorite occurs in groundwater in the study area. With the increase in TDS, each saturation index scatter showed an increasing trend, and the trend of fluorescent stone change was especially obvious, implying that rock weathering dissolution is an important factor affecting TDS in the study area.

5. Discussions

After assessing the groundwater quality in the study area and analyzing the water chemistry distribution characteristics, change patterns, ion sources, and formation mechanisms, it can be found that the overall water quality in the study area is good, and the areas with poor water quality are mainly distributed locally in Jiaozuo City, Xinxiang City, Zhoukou City, and Puyang City. Most regions with poor water quality have the characteristics of concentrated emission of pollution sources, strong human activities, or long runoff paths. From the perspective of anions, the hydrochemical type in the study area is mainly HCO3 type, and the ion content increases gradually along the runoff path. This is because HCO3 is mainly derived from the dissolution of carbonate rocks, the material source is sufficient, and this process is further enhanced by the dissolution of CO2 produced by microbial respiration or in the air with atmospheric rainfall or river runoff [48]. Cl and SO42− in local groundwater are dominant ions, which are closely related to the weathering and dissolution of rock salt and mirabilite and may also be related to the pollution caused by human activities. From the perspective of cations, the distribution of hydrochemical types has a certain degree of zonation such that the Ca/Mg type and Ca–Mg/Mg–Ca type are dominant in the piedmont sloping plain, and its formation mechanism is related to the weathering and dissolution of calcite and dolomite. In the eastern plain area, the hydrochemical type began to change into the Na–Ca/Ca–Na type, Na–Mg/Mg–Na type, and finally changed into the Na type, indicating that a strong ion exchange occurred in the process of groundwater runoff, which was verified by the distribution of Ca2+ and Na+ in concentration, and these conclusions are similar to the early research results in the region [49,50]. The long history of human activities in Henan Province has made great changes in the hydrochemistry of the region, which is mainly divided into intuitive and indirect effects. It is more intuitive that K+, NO3–N, and Fe3+ have abnormally high concentrations in some cities due to the use of fertilizers and sewage discharge, or the extensive use of dry toilets due to climatic influences. The indirect effect does not directly change the component content, but affects the hydrodynamic field through irrigation, mining, and other ways, thus affecting the evaporation concentration or water–rock interaction and resulting in some component concentration anomalies. Therefore, the traditional Gibbs graph cannot meet the research on the formation mechanism of groundwater chemistry under the influence of human beings, and some studies have shown that the Gibbs graph oversimplifies the interpretation of the aquifer system and ignores important processes in defining groundwater geochemistry [51]. A variety of methods are needed to have a more comprehensive understanding of groundwater chemical field changes.

6. Conclusions

Shallow groundwater is an important source of freshwater in Henan Province, China. In this study, we assessed the quality of shallow groundwater in the plain area of Henan Province based on a combination of subjective and objective empowerment and analyzed the groundwater hydrochemical characteristics and formation mechanisms, the following conclusions can be drawn:
(1)
A combination of the entropy weighting and subjective assignment methods was used to determine the relative weights of each evaluation index not only reflecting the data characteristics of the evaluation index itself but also to some extent combining the subjective judgment of the importance of the evaluation index. According to the results of groundwater quality assessment, the water quality in most areas of the study area is above medium to good, and the water quality is poor in areas with long runoff paths or strong human activities, mainly distributed locally in Jiaozuo City, Xinxiang City, Zhoukou City, and Puyang City, in a patchy distribution.
(2)
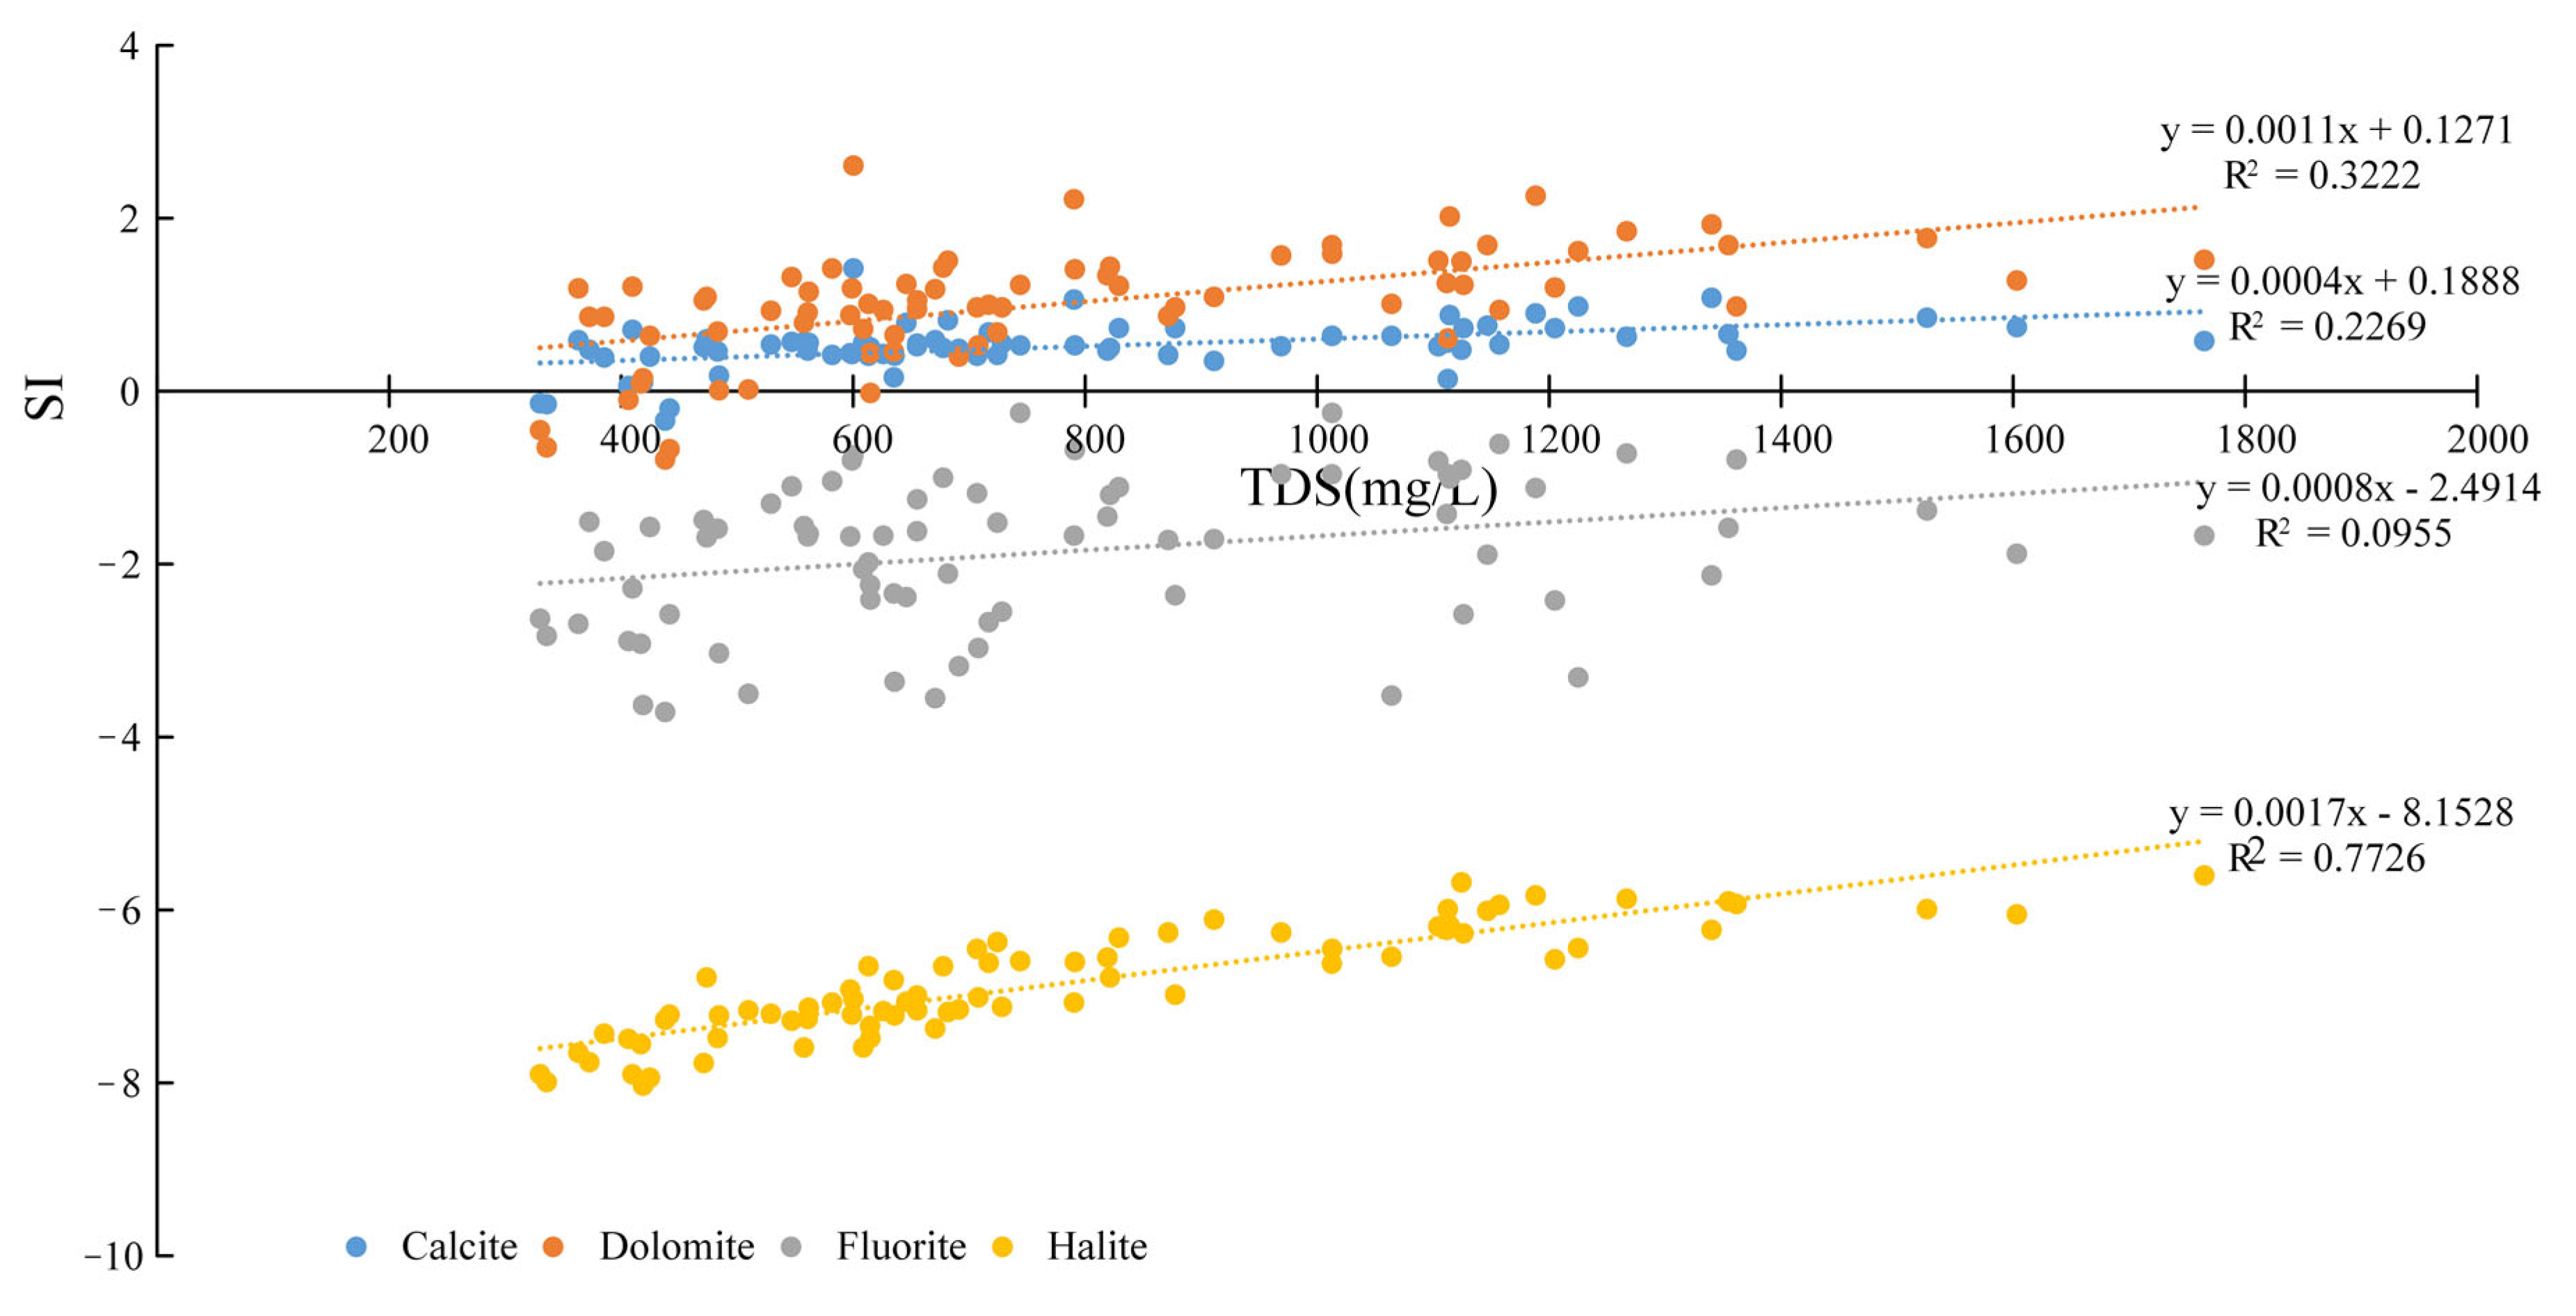
The predominance of HCO3 type anions in the groundwater types in the study area indicates that carbonate dissolution plays a dominant role in regulating hydrochemistry. The presence of ions dominated by Cl and SO42− in local areas indicates that the weathering dissolution of rock salt and mannite as well as human activities also influence the hydrochemistry components simultaneously. From the perspective of cations, the distribution of hydrochemistry types has a certain zonation, and the precipitation of calcite and dolomite, the weathering dissolution of rock salt and fluorite, and the cation exchange and adsorption are the main factors affecting the hydrochemistry distribution of cations.
(3)
Human activities can directly or indirectly affect changes in the chemical components of groundwater. For example, inappropriate behaviors such as overuse of fertilizers, industrial and agricultural wastewater discharge, manure accumulation, groundwater over-exploitation, and unreasonable irrigation can lead to the abnormal distribution of certain ions and deteriorate the pristine groundwater environment. Therefore, it is necessary to continuously monitor groundwater to provide scientific data for sustainable groundwater quality management and to develop corresponding measures to prevent further degradation of the groundwater environment.

Author Contributions

Conceptualization, B.Y. and J.S.; methodology, H.S.; software, Y.L. and J.C.; validation, B.Y. and J.S.; formal analysis, J.C.; investigation, Y.L.; resources, Y.W.; data curation, Y.L.; writing—original draft preparation, J.S. and B.Y.; writing—review and editing, B.Y.; visualization, H.S.; supervision, Y.W.; project administration, Y.W.; funding acquisition, B.Y.; All authors have read and agreed to the published version of the manuscript.

Funding

National Natural Science Youth Fund Project (42002251); China Post-doctoral Science Fund (2018M631874); Scientific Research Projects of the Higher University in Hebei (ZD2019082), Youth Foundation of Hebei Province Department (QN2017026); Natural Science Funds Project in Hebei Province (D2018403040 and D2020403022 and E2021403001); and Hebei Key Laboratory of Geological Resources and Environmental Monitoring and Protection Fund (JCYKT201901).

Institutional Review Board Statement

Not applicable.

Informed Consent Statement

Not applicable.

Data Availability Statement

Not applicable.

Conflicts of Interest

The authors declare that they have no known competing financial interests or personal relationships that could influence the work reported herein.

References

  1. Al-Hanbali, A.; Kondoh, A. Groundwater vulnerability assessment and evaluation of human activity impact (HAI) within the Dead Sea groundwater basin, Jordan. Hydrogeol. J. 2008, 16, 499–510. [Google Scholar] [CrossRef]
  2. Li, P.; He, S.; Yang, N.; Xiang, G. Groundwater quality assessment for domestic and agricultural purposes in Yan’an City, northwest China: Implications to sustainable groundwater quality management on the Loess Plateau. Environ. Earth Sci. 2018, 77, 775. [Google Scholar] [CrossRef]
  3. Lee, S.; Kim, J.; Lee, G.; Hong, J.; Bae, J.H.; Lim, K.J. Prediction of Aquatic Ecosystem Health Indices through Machine Learning Models Using the WGAN-Based Data Augmentation Method. Sustainability 2021, 13, 10435. [Google Scholar] [CrossRef]
  4. Gleick, P.H. Dirty-Water: Estimated Deaths from Water-Related Diseases 2000–2020; Pacific Institute for Studies in Development, Environment, and Security: Oakland, CA, USA, 2002; pp. 1–12.
  5. Schwarzenbach, R.P.; Egli, T.; Hofstetter, T.B.; Von Gunten, U.; Wehrli, B. Global water pollution and human health. Annu. Rev. Environ. Resour. 2010, 35, 109–136. [Google Scholar] [CrossRef]
  6. Saraswat, C.; Kumar, P.; Dasgupta, R.; Avtar, R.; Bhalani, P. Sustainability assessment of the groundwater quality in the Western India to achieve urban water security. Appl. Water Sci. 2019, 9, 73. [Google Scholar] [CrossRef] [Green Version]
  7. Zhang, W.; Liu, Y.; Jiang, L.; Wang, J.; Wu, W.; Bi, J. Evaluating the economic loss induced by water pollution based on multi-regional CGE model: A case study of Yangtze River Delta Basin. China Environ. Sci. 2016, 36, 2849–2856. [Google Scholar]
  8. Guo, H.; Wang, Y. Geochemical characteristics of shallow groundwater in Datong basin, northwestern China. J. Geochem. Explor. 2005, 87, 109–120. [Google Scholar] [CrossRef]
  9. Jeevanandam, M.; Kannan, R.; Srinivasalu, S.; Rammohan, V. Hydrogeochemistry and Groundwater Quality Assessment of Lower Part of the Ponnaiyar River Basin, Cuddalore District, South India. Environ. Monit. Assess. 2006, 132, 263–274. [Google Scholar] [CrossRef] [PubMed]
  10. Oateng, T.K.; Opoku, F.; Akoto, O. Heavy metal contamination assessment of groundwater quality: A case study of Oti landfill site, Kumasi. Appl. Water Sci. 2019, 9, 33. [Google Scholar] [CrossRef] [Green Version]
  11. Khalaj, M.; Kholghi, M.; Saghafian, B.; Bazrafshan, J. Impact of climate variation and human activities on groundwater quality in northwest of Iran. J. Water Supply Res. Technol. 2019, 68, 121–135. [Google Scholar] [CrossRef]
  12. McGill, B.M.; Altchenko, Y.; Hamilton, S.K.; Kenabatho, P.K.; Sylvester, S.R.; Villholth, K.G. Complex interactions between climate change, sanitation, and groundwater quality: A case study from Ramotswa, Botswana. Hydrogeol. J. 2019, 27, 997–1015. [Google Scholar] [CrossRef] [Green Version]
  13. Bouderbala, A.; Gharbi, B.Y. Hydrogeochemical characterization and groundwater quality assessment in the intensive agricultural zone of the Upper Cheliff plain, Algeria. Environ. Earth Sci. 2017, 76, 744. [Google Scholar] [CrossRef]
  14. Lin, Y.; Zou, S.; Wang, J.; Li, J. Hrdrochemical characteristics and water quality assessment of Emei Mountain basalt groundwater. Yangtze River 2021, 52, 20–24. [Google Scholar]
  15. Maerhubai, Y.; Ma, L.; Jilili, A.; Zhang, W. Hydrochemical characteristics and their influence on rivers in the Western part of the Tianshan Mountains, Xinjiang, China. Arid Zone Res. 2021, 38, 600–609. [Google Scholar]
  16. Cui, Y.; Liu, J.; Gao, Z.; Cai, W. Hydrochemical Characteristics and Water Quality Evaluation of Groundwater in Huixian County. Water Sav. Irrig. 2021, 5, 96–102. [Google Scholar]
  17. Boateng, T.K.; Opoku, F.; Acquaah, S.O.; Akoto, O. Groundwater quality assessment using statistical approach and water quality index in Ejisu-Juaben Municipality, Ghana. Environ. Earth Sci. 2016, 75, 489. [Google Scholar] [CrossRef]
  18. Kong, L.; Wang, Z.; Wang, B. An analysis of the hydro-chemical characteristics and causes of drinking water source of concentrated deep groundwater in Fuyang City. China Rural Water Hydropower 2020, 3, 78–82. [Google Scholar]
  19. Lumb, A.; Sharma, T.C.; Bibeault, J.F. A review of genesis and evolution of water quality index (WQI) and some future directions. Water Qual. Expo. Health 2011, 3, 11–24. [Google Scholar] [CrossRef]
  20. Verma, P.; Singh, P.K.; Sinha, R.R.; Tiwari, A.K. Assessment of groundwater quality status by using water quality index (WQI) and geographic information system (GIS) approaches: A case study of the Bokaro district, India. Appl. Water Sci. 2020, 10, 27. [Google Scholar] [CrossRef] [Green Version]
  21. Şener, Ş.; Şener, E.; Davraz, A. Evaluation of water quality using water quality index (WQI) method and GIS in Aksu River (SW-Turkey). Sci. Total Environ. 2017, 584, 131–144. [Google Scholar] [CrossRef]
  22. Shil, S.; Singh, U.K.; Mehta, P. Water quality assessment of a tropical river using water quality index (WQI), multivariate statistical techniques and GIS. Appl. Water Sci. 2019, 9, 168. [Google Scholar] [CrossRef] [Green Version]
  23. Liu, Q.; Tian, Y.; Liu, Y.; Xu, D.; Liu, J.; Jiang, Y. Characteristics of two comprehensive assessment methods for water quality based on different evaluation criteria and their applications in aquatic environment management. Acta Ecol. Sin. 2019, 39, 7538–7546. [Google Scholar]
  24. Ma, H.; Xiao, Y.; Yan, F. Evaluation Method and Application of Modified CCME WQI Based on Fuzzy Variable Set Theory. Water Resour. Power 2018, 36, 35–38. [Google Scholar]
  25. Bun, S.; Sek, S.; Oeurng, C.; Fujii, M.; Ham, P.; Painmanakul, P. A Survey of Household Water Use and Groundwater Quality Index Assessment in a Rural Community of Cambodia. Sustainability 2021, 13, 10071. [Google Scholar] [CrossRef]
  26. Liu, F.; Zhao, Z.; Yang, L.; Ma, Y.; Li, B.; Gong, L.; Liu, H. Phreatic water quality assessment and associated hydrogeochemical processes in an Irrigated Region along the Upper Yellow River, Northwestern China. Water 2020, 12, 463. [Google Scholar] [CrossRef] [Green Version]
  27. Chaurasia, A.K.; Pandey, H.K.; Tiwari, S.K.; Prakash, R.; Pandey, P.; Ram, A. Groundwater quality assessment using water quality index (WQI) in parts of Varanasi district, Uttar Pradesh, India. J. Geol. Soc. India 2018, 92, 76–82. [Google Scholar] [CrossRef]
  28. Deep, A.; Gupta, V.; Bisht, L.; Kumar, R. Application of WQI for water quality assessment of high-altitude snow-fed sacred Lake Hemkund, Garhwal Himalaya. Sustain. Water Resour. Manag. 2020, 6, 89. [Google Scholar] [CrossRef]
  29. Jehan, S.; Ullah, I.; Khan, S.; Muhammad, S.; Khattak, S.A.; Khan, T. Evaluation of the Swat River, Northern Pakistan, water quality using multivariate statistical techniques and water quality index (WQI) model. Environ. Sci. Pollut. Res. 2020, 27, 38545–38558. [Google Scholar] [CrossRef]
  30. Deepa, S.; Venkateswaran, S. Appraisal of groundwater quality in upper Manimuktha sub basin, Vellar river, Tamil Nadu, India by using Water Quality Index (WQI) and multivariate statistical techniques. Modeling Earth Syst. Environ. 2018, 4, 1165–1180. [Google Scholar] [CrossRef]
  31. Zou, Z.; Yi, Y.; Sun, J. Entropy method for determination of weight of evaluating indicators in fuzzy synthetic evaluation for water quality assessment. J. Environ. Sci. 2006, 18, 1020–1023. [Google Scholar] [CrossRef]
  32. Sun, Y.; Liang, X.; Xiao, C. Assessing the influence of land use on groundwater pollution based on coefficient of variation weight method: A case study of Shuangliao City. Environ. Sci. Pollut. Res. 2019, 26, 34964–34976. [Google Scholar] [CrossRef]
  33. Guo, W.; Zuo, Q.; Ma, J. Spatial and temporal change analysis of harmony development among population-water resources-economics in Henan. China. Resour. Sci. 2015, 37, 2251–2260. [Google Scholar]
  34. Chen, P. Analysis of Water Consumption of Water Resources in Henan Province Based on Cloud Model. J. Shantou Univ. 2021, 36, 41–49. [Google Scholar]
  35. Shi, X.; Dong, W.; Li, M.; Zhang, Y. Evaluation of groundwater renewability in the Henan Plains, China. Geochem. J. 2012, 46, 107–115. [Google Scholar] [CrossRef] [Green Version]
  36. Luo, Y.; Wei, X.; Du, J.L.; Jin, M.G. The GIS-based function evaluation and regional planning of shallow groundwater in Henan Province. China Rural Water Hydropower 2007, 9, 36–40. [Google Scholar]
  37. Ma, Y.G.; Cheng, J.P.; Jiao, F.; Duo, K.X.; Rong, Z.; Li, M.; Wang, W.H. Distribution, sources, and potential risk of polycyclic aromatic hydrocarbons (PAHs) in drinking water resources from Henan Province in middle of China. Environ. Monit. Assess. 2008, 146, 127–138. [Google Scholar] [CrossRef] [PubMed]
  38. Li, D. Construction of Early Waring Index System of Water Resources Security in Henan Province; Henan University: Kaifeng, China, 2019. [Google Scholar]
  39. Du, Q.; Song, Q. Study on overexploitation of groundwater in Henan Province and control measures. Water Resour. Dev. Manag. 2021, 1, 33–37. [Google Scholar]
  40. Wang, G.; Shang, L.; Liu, X.; Tang, L.; Cheng, Q. Study on causes of poisoning and asphyxiation in roadway opening by AHP-entropy weight method. China Saf. Sci. J. 2021, 31, 187–192. [Google Scholar]
  41. World Health Organization. Guidelines for Drinking-Water Quality, 4th ed.; World Health Organization: Geneva, Switzerland, 2011. [Google Scholar]
  42. Li, S.; Yu, B.; Chen, F.; Wang, Y. Analysis of hydrochemical and isotopic characteristics in Pishan river oasis zone. J. Arid Land Resour. Environ. 2021, 35, 116–122. [Google Scholar]
  43. Meng, Q. Hydrochemical characteristics and controlling factors of the shallow groundwater in the midstream and downstream areas of Shiyang river basin. J. Arid Land Resour. Environ. 2021, 35, 80–87. [Google Scholar]
  44. Han, C.; Gao, Z.; Liu, J. Chemical Characteristics of Groundwater and Health Risk Assessment of Nitrate in Tancheng Area. Earth Environ. 2021, 49, 436–446. [Google Scholar]
  45. Lei, W.; Tang, C.; Jiang, L. Discussion on Iron and Manganese Transport and Concentrate in Underground Water. Jiangxi Sci. 2006, 1, 80–82. [Google Scholar]
  46. Jiang, J.; Xian, H.; Li, Q.; Tao, H.; Jiang, Y. Groundwater geochemistry and its implications for arsenic mobilization in Kuitun river basin, Xinjiang. Environ. Chem. 2021, 40, 1775–1786. [Google Scholar]
  47. Gibbs, R.J. Mechanisms controlling world water chemistry. Science 1970, 170, 1088–1090. [Google Scholar] [CrossRef]
  48. Eslami, F.; Yaghmaeian, K.; Mohammadi, A.; Salari, M.; Faraji, M. An integrated evaluation of groundwater quality using drinking water quality indices and hydrochemical characteristics: A case study in Jiroft, Iran. Environ. Earth Sci. 2019, 78, 314. [Google Scholar] [CrossRef]
  49. Zhang, Y.; Dong, W.H.; Li, M.Z.; Zheng, Z.X.; Shi, X.F.; Guo, Z.X. Study on distribution characteristics of TDS and hydrochemical type of shallow groundwater in Henan Plain. J. China Hydrol. 2011, 31, 79–83. [Google Scholar]
  50. Hu, B.; Liu, X.; Wang, N.; Jiang, X. Analysis of groundwater quality in the shallow aquifers of the east plain in Henan. Ground Water 2021, 43, 33–36. [Google Scholar]
  51. Marandi, A.; Shand, P. Groundwater chemistry and the Gibbs Diagram. Appl. Geochem. 2018, 97, 209–212. [Google Scholar] [CrossRef]
Figure 1. Distribution of groundwater sampling points in the study area.
Sustainability 13 12586 g001
Figure 2. Distribution of indicator concentrations (a) K+; (b) Na+; (c) Ca2+; (d) Mg2+; (e) Fe3+; (f) Cl; (g) SO42−; (h) HCO3; (i) F; (j) NO3-N; (k) Mn; (l) As; (m) TH; (n) TDS; (o) pH.
Sustainability 13 12586 g002aSustainability 13 12586 g002b
Figure 3. Piper diagram of shallow groundwater in the study area.
Sustainability 13 12586 g003
Figure 4. GWQI classification results.
Sustainability 13 12586 g004
Figure 5. Shallow groundwater hydrochemical profile.
Sustainability 13 12586 g005
Figure 6. Changes in water chemistry in the profile.
Sustainability 13 12586 g006
Figure 7. Ionic ratio relationship diagram (a) Na+/Cl; (b) Ca2+/HCO3; (c) Ca2++Mg2+/HCO3; (d) Ca2++Mg2+/HCO3+SO42−.
Sustainability 13 12586 g007
Figure 8. Distribution of NO3–N and construction land (Source: Resource and Environment Science and Data Center).
Sustainability 13 12586 g008
Figure 9. Number of industrial sources of pollution in the study area by municipality.
Sustainability 13 12586 g009
Figure 10. Gibbs diagram of hydrochemistry in the study area.
Sustainability 13 12586 g010
Figure 11. Scatter plot of saturation index with TDS.
Sustainability 13 12586 g011
Table 1. Summary of test results from groundwater samples. Reprinted from Ref. [41].
Evaluation IndicatorsMinimum ValueMaximum ValueAverage ValueCoefficient of VariationWHO Limit Values
K+ (mg/L)0.2205.7702.8032.69612
Na+ (mg/L)19.690402.000118.2340.826200
Ca2+ (mg/L)5.01029.180103.0860.589200
Mg2+ (mg/L)3.040131.58043.6660.555150
Fe3+ (mg/L)0.0106.1300.4932.0620.3
Cl (mg/L)5.320338.90094.2460.784250
SO42− (mg/L)14.410476.460119.3930.786250
HCO3 (mg/L)17.860896.990489.1960.333600
F (mg/L)0.0403.5000.7481.0431.5
NO3–N (mg/L)0.00569.3207.6891.79150
Mn (mg/L)0.0012.0600.1821.7970.1
As (mg/L)0.0010.0620.0042.5340.01
TH (mg/L)25.0001057.500436.9010.464500
TDS (mg/L)33.0901764.690779.6590.4221000
pH7.0008.3007.4230.0406.5–8.5
Table 2. Relative weights of evaluation indicators.
Evaluation IndicatorsEntropy MethodLiterature [26]Literature [27]Average Value
K+0.03570.04550.14900.0767
Na+0.05360.09090.04830.0643
Ca2+0.03570.04550.01940.0335
Mg2+0.03570.04550.01830.0332
Fe3+0.07140.13640.12340.1104
Cl0.07140.04550.03280.0499
SO42−0.08930.04550.03660.0571
HCO30.05360.04550.01410.0377
F0.08930.09090.05520.0785
NO3–N0.08930.09090.11670.0990
Mn0.07140.09090.10130.0879
As0.08930.09090.21840.1329
TH0.07140.04550.01290.0433
TDS0.07140.04550.02740.0481
pH0.07140.04550.02620.0477
Table 3. GWQI grading criteria.
GWQI Index<5050–100100–200200–300>300
GradeExcellentGoodModeratePoorVery poor
Table 4. Correlation between ions.
K+Na+Ca2+Mg2+Fe3+ClSO42−HCO3FNO3–NMnAsTHTDSpH
K+1
Na+0.371
Ca2+−0.17−0.231
Mg2+0.180.330.171
Fe3+0.250.17−0.080.161
Cl0.150.330.290.420.011
SO42−0.310.420.150.430.060.541
HCO30.160.470.000.420.260.230.241
F0.160.44−0.390.190.160.090.170.381
NO3–N−0.07−0.270.45−0.05−0.330.130.08−0.28−0.381
Mn0.040.140.060.230.430.080.050.270.14−0.301
As0.290.28−0.130.260.500.060.120.320.27−0.370.371
TH−0.010.020.660.510.050.490.340.24−0.160.290.130.051
TDS0.260.510.230.490.110.660.620.510.210.030.130.180.481
pH0.280.30−0.400.020.08−0.010.130.120.45−0.28−0.050.19−0.270.081
Publisher’s Note: MDPI stays neutral with regard to jurisdictional claims in published maps and institutional affiliations.

