Article

Enhancement of Multi-Class Structural Defect Recognition Using Generative Adversarial Network

1
Center for AI Technology in Construction, Hanyang University ERICA, 55, Hanyangdaehak-ro, Sangnok-gu, Ansan 15588, Korea
2
School of Architecture and Architectural Engineering, Hanyang University ERICA, 55, Hanyangdaehak-ro, Sangnok-gu, Ansan 15588, Korea
3
ICT Convergence Research Division, Korea Expressway Corporation Research Institute, 24 Dongtansunhwan-daero 17-gil, Dongtan-myeon, Hwaseong 18489, Korea
4
Division of Smart Convergence Engineering, Hanyang University ERICA, 55, Hanyangdaehak-ro, Sangnok-gu, Ansan 15588, Korea
*
Author to whom correspondence should be addressed.
Sustainability 2021, 13(22), 12682; https://doi.org/10.3390/su132212682
Submission received: 14 October 2021 / Revised: 12 November 2021 / Accepted: 14 November 2021 / Published: 16 November 2021

Abstract

:
Recently, in the building and infrastructure fields, studies on defect detection methods using deep learning have been widely implemented. For robust automatic recognition of defects in buildings, a sufficiently large training dataset is required for the target defects. However, it is challenging to collect sufficient data from degrading building structures. To address the data shortage and imbalance problem, in this study, a data augmentation method was developed using a generative adversarial network (GAN). To confirm the effect of data augmentation in the defect dataset of old structures, two scenarios were compared and experiments were conducted. As a result, in the models that applied the GAN-based data augmentation experimentally, the average performance increased by approximately 0.16 compared to the model trained using a small dataset. Based on the results of the experiments, the GAN-based data augmentation strategy is expected to be a reliable alternative to complement defect datasets with an unbalanced number of objects.

1. Introduction

The demand for the development of efficient inspection methods of old building structures using automatic technology has increased, because the traditional inspection approach is time-consuming and costly. For this reason, in the building and infrastructure fields, many studies have explored vision-based approaches to detect damage in structures for more efficient diagnosis and maintenance [1,2]. In recent years, approaches using deep learning and image processing techniques have been applied in visual data processing tasks to detect defects in building structures, such as cracks [3,4,5,6,7], delamination [8], rebar exposure [9], and corrosion [10]. Previous studies have demonstrated that structural defects can be automatically recognized by analyzing visual data. However, these studies have only focused on single damage identification and detection; thus, they have limitations for application in multi-damage recognition. In the real world, the degrading buildings and infrastructures expose diverse defects on the superficial structures.
To address these challenges, multi-class damage recognition models, which can simultaneously handle multiple damages, have been investigated using deep learning methods. Dong [11] proposed a deep learning-based multiple defect detection method for tunnel lining damage involving crack and spalling damage. Wang [12] found several defects, such as cracks, spalling, and efflorescence, in a historic masonry structure using convolutional neural networks (CNNs) based on still images. However, the number of specific defect types accounted for most of the damage. This data imbalance problem could lead the deep learning model to overfit specific defects in the training stage. Moreover, in low-data regimes, such as structural defects in the real world, collecting extensive datasets is a challenge. Thus, it is difficult to deal with various types of defects, while improving the performance of deep learning-based models, because of the underdetermined parameters of imbalanced datasets [13]. Consequently, the results lead to overfitting on the training set and poor generalization on the test set [14]. To generalize the damage recognition model and its high performance, it is necessary to overcome the data imbalance problem and establish a large dataset of various defects in the building and infrastructure fields. To address these limitations, this study used data augmentation strategies with a generative adversarial network (GAN) in the building and infrastructure domains and explored the effects of the GAN-based data augmentation method on defect recognition tasks with various deep CNNs (DCNNs). By implementing experiments using several deep learning models, this study verified that the proposed approach is satisfactory for improving the defect recognition model compared to the model-trained raw dataset.
The remainder of this paper is organized as follows. Section 2 describes previous studies related to structural defect recognition using deep learning methods and data augmentation methods for improving neural network models. Section 3 explains the data collection and preparation with the data augmentation method using geometric transformation and the GAN. Experiments and results are presented in Section 4 and Section 5. Finally, Section 6 includes the discussion and conclusions.

2. Literature Review

2.1. Structural Defect Recognition Using Deep Convolutional Neural Networks

Recently, deep learning-based image recognition research has been conducted in the broad domain. In the building and infrastructure fields, several researchers have tried to apply the deep learning approach to replace traditional image processing tasks with automatic defect detection using deep learning methods. For instance, Yang [6] implemented a deep convo-fully CNN (FCN) to detect cracks at the pixel level. Maeda [4] developed a new large-scale dataset for road-damage detection and classification. Hoang [15] proposed an asphalt pavement crack detection model. Deep learning in the building and infrastructure fields has mostly focused on deep learning-based crack detection, because it is a representative defect of the performance index [16]. However, in the real world, not only crack damage but also various defects are exposed simultaneously in the structures, and these damages, as a complex cause, degrade the performance of the structure. Accordingly, in practice, a system that simultaneously analyzes both cracks and various other types of damage is required. Cha [3] proposed a deep learning model that can simultaneously detect corrosion, paint peeling, and cracks occurring in bridges. Lee [17] proposed a multi-class defect detection model for delamination, cracks, peeled paint, and water-leakage defects, focusing on residential buildings.
Previous studies have experimentally demonstrated that deep learning models can effectively recognize multiple classes. However, it has been argued that a robustness model should be developed to recognize various classes accurately, and enormous datasets are needed. In particular, Lee [17] emphasized the importance of constructing a sufficiently balanced dataset between classes to obtain the required model performance.
However, establishing well-balanced datasets is difficult because collecting defect data is challenging, and the distribution of damage exposed in the facade of a structure is significantly concentrated on cracks [12]. Consequently, the quantity of data between defect types has an unbalanced distribution. This imbalanced dataset leads the model in training phases into overfitting to the training dataset and poor generalization on the test set because of the underdetermined parameters of deficient data [18]. Therefore, research on data distribution and data amplification for robust performance of deep learning-based models is required.

2.2. Data Augmentation for Improvement of Deep Convolutional Neural Network Performance

Data augmentation is significant for teaching the network the desired invariance and robustness properties and to enhance the quality and quantity of datasets for better deep learning models [19]. Previous studies demonstrated that the augmented synthetic dataset led to deep learning model robustness in the training process [20,21,22]. For instance, Hauberg [20] developed a statistical model of the transformations to learn augmentation schemes from training data and demonstrated that this approach is more beneficial than relying on manual specifications. Krizhevesky [21] proposed a geometric data augmentation approach using image reflections and Gaussian noise to prevent overfitting. Using these image transformations can reduce the error rate. Chandran [22] adopted a data augmentation method, which includes brightness, contrast saturation, blur, noise, and rotation of the images, to expand the dataset for an investigation on railway fasteners. Although several augmentation methods were applied to the prepared dataset, the quantity of data of the entire training set was dependent on the raw dataset. Moreover, Engstrom et al. [23] indicated that random transformation (i.e., rotation and translation) could reduce the model performance owing to misclassification when dealing with digit datasets. These traditional approaches, such as geometric transformations including rotation, scaling, cropping, and horizontal or vertical flipping, do not completely resolve the fundamental problem of data shortages and data imbalance distributions.
To overcome these issues, many researchers have proposed data augmentation strategies using GANs. Since GANs were introduced by Goodfellow et al. [24], many refined models have been developed, such as the CycleGAN [25], DCGAN [26], and conditional GAN [27]. The application of GANs in a deep learning approach has been implemented in several domains such as medical images [28], fashion [29], and emotion recognition [25]. Data augmentation using GANs has been effectively performed in a low-data target domain by generating synthetic images [18,30]. Additional synthetic images in the training dataset are beneficial for increasing the variety of datasets and improving the performance. Lee et al. [31] proposed a Wasserstein GAN (WGAN) to solve the data imbalance problem in predicting aquatic ecosystem health indices. Zhu et al. [25] used a GAN to deal with imbalanced datasets in facial expression recognition. The synthetic images generated by the GAN method can be applied to deep learning models to overcome the data shortage and imbalance problems in various fields.
Inspired by previous research, this study adopted a GAN to enhance the structural defect recognition model. Data augmentation combined with both the GAN and geometric transformation methods could provide an alternative solution to by-path the challenges faced and the difficulty in collecting numerous datasets in the building and infrastructure fields.

3. Methodology

3.1. Dataset Collection of Concrete Damage Images

In this study, a concrete surface damage dataset was established by collecting five data categories, including one intact surface image and four representative superficial defects: crack, delamination, leakage, and rebar exposure. The 4032 × 3024 resolution images were obtained through the investigation of defects in deteriorated concrete structures using a digital camera. The number of image data was established from the total of 1954 images containing concrete damage, and the training and validation datasets were respectively divided at a ratio of 1430 to 355 (80% of the total dataset) in the preprocessing stage. The remaining 196 images (10%) were used to test the proposed model. The size of the raw images was 4032 × 3024 pixels, but the images were resized to small scales (224 × 224) to fit the proposed model. To prepare the training dataset, the dataset was classified into the following categories: crack (477), rebar exposure (242), delamination (507), leakage (188), and non-damage (371) images. The compositions of the validation and test datasets are presented in Table 1.
Approximately 2000 images are insufficient for training a DCNN and achieve excellent performance in the damage classification task. For better performance and more robust models, larger and various datasets are required [21], but it is difficult to obtain specific damages such as rebar exposure and leakages compared to cracks and delamination. Data imbalance makes it difficult to improve the performance because of the underdetermined parameters [14]. To address this limitation, data augmentation strategies are essential for enhancing the fine-tuning of deep networks [19].

3.2. Data Augmentation Using Geometric Transformation

To overcome these issues, many researchers have proposed data-augmentation strategies for efficient network training. Krizhevesky [21] proposed image translations and horizontal and vertical reflections to prevent overfitting. The use of these image transformations can reduce the error rate. Another approach, proposed by Hauberg [20], is to develop a statistical model of the transformations to learn augmentation schemes from training data, and it was demonstrated that this approach is more beneficial than relying on manual specification. Therefore, this study adopted data augmentation strategies to prevent overfitting during the training process. This approach enables the improvement of training accuracy without additional training data through image transformations such as horizontal/vertical reflection, random brightness, rotation, zoom, and cropping within a defined range [21].

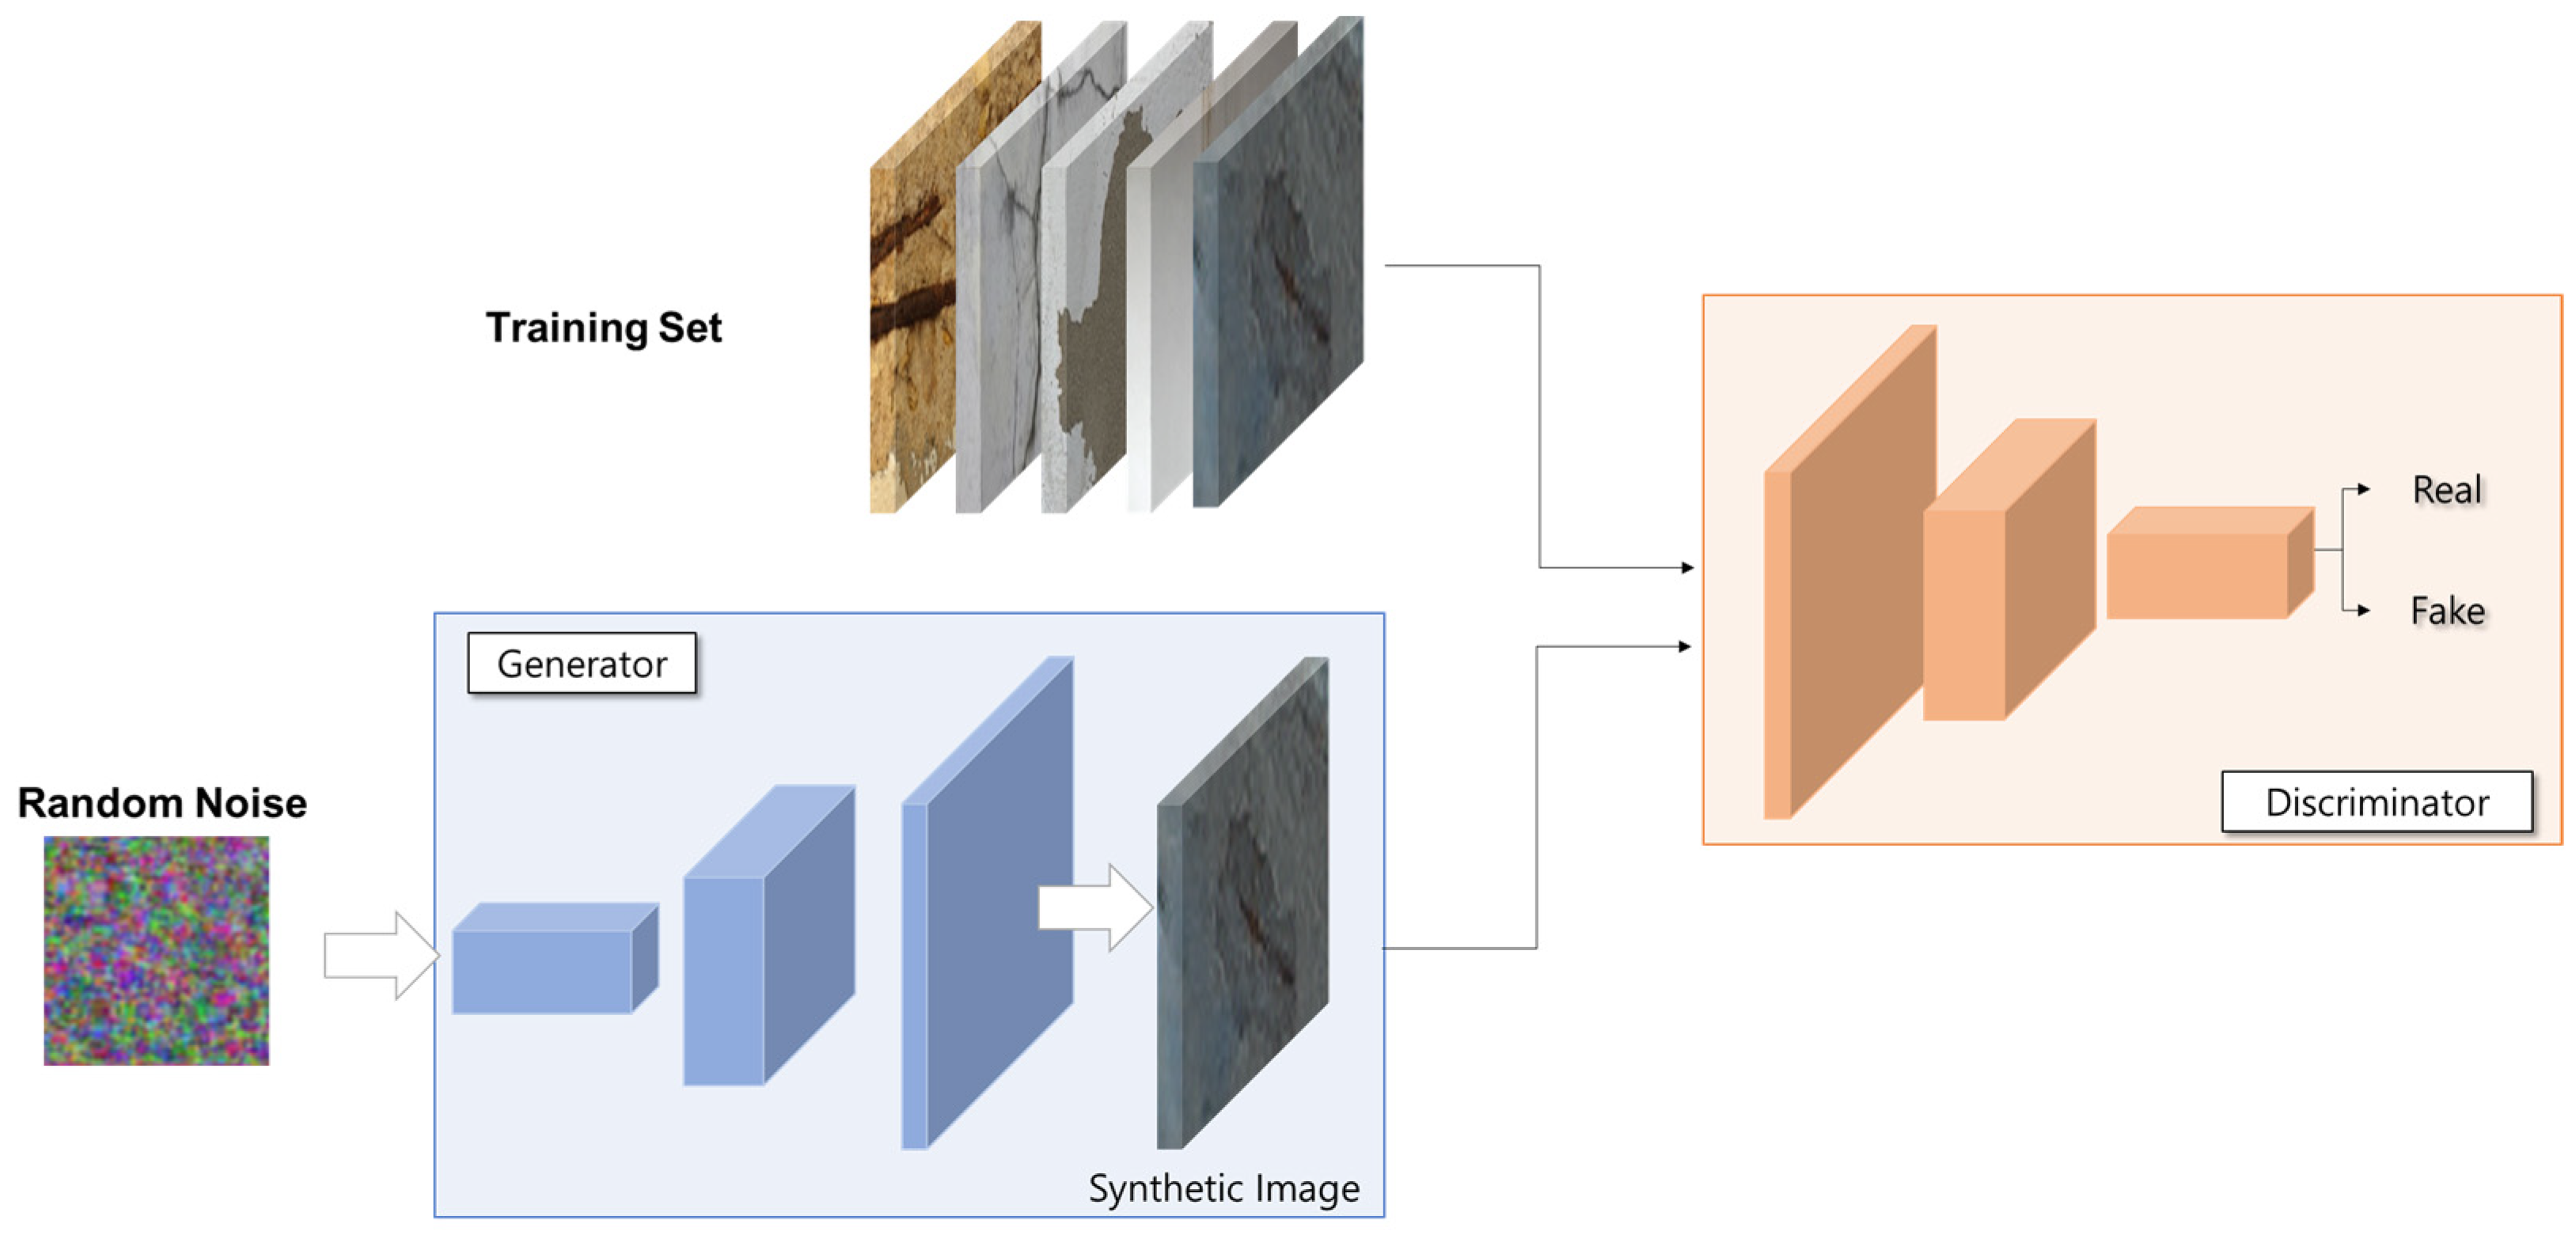
3.3. Data Augmentation Using Generative Adversarial Network

Although several augmentation methods were applied to the prepared dataset, the quantity of data of the entire training set was dependent on the raw dataset. In other words, when the specific raw dataset is insufficient compared to the other datasets, the data imbalance remains. In particular, both the rebar exposure and leakage damage classes have data imbalance problems because their quantity of data is lower than that of cracks or delamination. To solve this problem, this study employed a data augmentation strategy using a GAN [24]. Recently, a GAN has become commercially available to effectively train even low-data target domains by generating synthetic images [14,30]. Figure 1 shows a conceptual schematic of a GAN for generating synthetic concrete damage images.
Additional synthetic images in the training dataset are beneficial for increasing the variety of datasets and improving the performance. Gao [30] applied a GAN for infrastructural image data augmentation, and the results demonstrated the effectiveness and robustness of the proposed methods. Moreover, facial image generation [26,32] and the medical field [33] have adopted GANs to enable effective experimental implementation under the conditions of a low-data regime and limited computational power. The synthetic images generated by the GAN method can be applied to train an image classification model to recognize the damages derived from exposure to various environments. Figure 2 presents images generated by GAN training corresponding to rebar exposure and leakage.

3.4. Establishment of the Concrete Damage Image Dataset

To establish the concrete damage dataset, data augmentation strategies using both geometric transformation and GAN were applied to train the DCNN models. Consequently, the training and validation datasets were expanded to 100,000 images with 20,000 images of damage in each class. Approximately 200 test datasets in which damage appeared, which were not used for the training and validation stages, were prepared to evaluate the accuracy of the trained model. However, the number of test datasets was insufficient to estimate the performance between the architectures proposed in this study. The test dataset also adopted data augmentation strategies to evaluate the model performance sensitively. For test data augmentation, only horizontal flipping with random cropping was applied, because the test images must be set in an equivalent form to the real environment. The established concrete dataset is presented in Table 2.

4. Experiments

DCNN-based image analysis models have been developed and proposed in several domains. However, the proposed models are intended to deal with specific problems defined by researchers. Therefore, to address concrete damage image recognition, it is necessary to perform fine-tuning of the DCNN model using concrete damage images. Therefore, this study carried out several examinations to identify which models have the appropriate structures to extract features from complex and complicated concrete damages. Accordingly, based on the established concrete damage dataset, this study examined a representative deep neural network for selecting the most suitable architecture to address concrete damage images. The examination was carried out using several architectures, namely, AlexNet [21], VGG16 [34], Inception-V3 [35], ResNet50 [36], and MobileNetV2 [37]. These models have already been verified by providing high performance for large-scale image analysis [38]. In addition, they can provide a framework for stable learning in concrete damage recognition. Thus, according to the results of the experiments, the most suitable model was adopted for developing a concrete damage recognition model as a backbone network. The following section explains the experimental procedure and interpretation of the test results.

4.1. Experimental Settings

In this study, experiments were implemented using the Keras platform on a workstation with a GPU (GeForce GTX 1080Ti) and a CPU (Intel Core i9-7980XE CPU, 2.60 GHz × 18). To identify optimal architectures on the concrete damage dataset, an examination was conducted using AlexNet, VGG16, ReNet50, InceptionV3, and MobilenetV2, as proposed in the literature. For the training process, the concrete damage images were resized to 224 × 224 pixels. A common issue in DCNN training is that hyperparameters are quite sensitive; thus, the network was trained using the Adam Optimizer [39] with a learning rate of 0.0001, and its performance was evaluated with a test set and other raw images. As a first scenario, the experiment was performed with the raw dataset excluding data augmentation using a 224 × 224 image size. The second scenario was implemented with a dataset using data augmentation strategies. A loss function was employed as a criterion to evaluate the distance between the predicted and true values. The loss function in this experiment used the cross-entropy (CE) loss function.
C r o s s - E n t r o p y   L o s s   F u n c t i o n = i = 0 n i = 0 n y i , j l o g ( p i , j )
where y i , j denotes the true value y i , j [ 0 , 1 ] , and p i , j indicates the probabilities for each class set predicted by the proposed model.

4.2. Experimental Metrics

Accuracy was used as the metric to measure the performance of the model across all predictions, and it was defined as the ratio of the number of correct answers to the entire test dataset. Herein, the accuracy calculated only the true positive in each class with the total test dataset as the denominator.
A c c u r a c y = i = 1 k t p i t p + t n + f p + f n
Here t p denotes the true positive (correctly recognized in the targeted defect class), t n means correctly classified in the non-targeted class, f p means mistakenly classified in the targeted defect class, and f n denotes the false negative (erroneously spotted in the defect class). In other words, it is an indicator that evaluates the number of correctly predicted classes comprising the entire actual class. However, accuracy is not a preferred performance measure for classifiers, especially when dealing with imbalanced validation data. A more suitable way to evaluate the performance of a classifier is to provide the precision, recall, and F1-Score. The equations are as follows:
P r e c i s i o n = i = 1 k t p i i = 1 k ( t p i + f p i )
R e c a l l = i = 1 k t p i i = 1 k ( t p i + f n i )
F 1 - S c o r e = 2 · P r e c i s i o n · R e c a l l P r e c i s i o n + R e c a l l
Therefore, in this study, five metrics were used to evaluate the performance of the models: loss, accuracy, precision, recall, and F1-Score. The first two metrics were used to monitor the performance of the experimental architectures during the training and validation processes, and the other three metrics were used to evaluate the performance of a trained model using a test dataset with loss and accuracy metrics.

5. Results

5.1. Scenario 1: Experiments with a Small Dataset

In the first scenario, the experiment was conducted using a raw dataset. The dataset was prepared with approximately 2000 image data, established as described in Section 3.1. To monitor the progress of learning, loss and accuracy curves were generated during the training stage. Figure 3 shows the loss and accuracy monitored during the training stage (500 epochs).
The loss function was used as an indicator to measure the learning state when training a neural network. Accordingly, to monitor the status of the training implementation, the trend of the graph of the loss function was confirmed through the loss curve. As shown in Figure 3, the loss value was gradually reduced and optimized as the training progressed. Simultaneously, the accuracy increased as the learning process progressed. This means that the models in the training stage were optimized sharply in the training dataset. Consequently, the 224 × 224 image datasets provided stable optimization during the training stage.
However, the deep learning model needs to maintain good performance even with unseen data, that is, data that are not used for learning. Thus, this experiment monitored the model performance using a validation set that was different from the training dataset. Monitoring the learning process is useful for examining whether the model is overfitting or improving model accuracy while learning data. Figure 4 shows the loss and accuracy graphs for the validation stage.
As shown in Figure 4, by monitoring the loss value for each epoch using validation data, it was observed that the loss value did not decrease or increase after 50 epochs. This is a form of the overfitting problem, which means that the weight value learned in the training process can recognize the patterns from the training set, but is limited for recognizing the validation images representing various spatial damage forms. In addition, the accuracy in the validation stage cannot break through the ceiling of the model performance. This means that the model parameters are overfitted in the training dataset; thus, it is difficult to generalize the model performance when unexpected datasets are applied to the overtrained models.
To evaluate the performance of the experimental models quantitatively, the accuracy of each one was compared using a test dataset. Figure 5 shows the confusion matrix for the VGG16 model. In the confusion matrix, the right column shows the number of real images corresponding to the actual target class, and the bottom row shows the number of classes predicted using the trained VGG16 model. Here, the number specified in the dark blue box with a diagonal line indicates the quantity of data accurately predicted by the model. In other words, the sum of the data specified on the diagonal line represents the number of correct predictions of the model. These results indicate that VGG16 accurately predicted 157 of 196 data points, a performance with 0.8010 accuracy. Table 3 summarizes the results of evaluating the performance of the trained model using the test dataset.
Consequently, the results demonstrate that the VGG16 architecture exhibits the best performance. However, as described above, there are some limitations in dealing with the concrete dataset and evaluating the model performance because of insufficient data. For example, this could cause overfitting of the model during the training and validation stages. To overcome this problem, this study adopted data augmentation strategies, and a second scenario for exploring the optimal architecture was implemented. The following section describes the experiments conducted using the augmented dataset.

5.2. Scenario 2: Experiments with Data Augmentation

In the second scenario, an experiment was performed by applying a data augmentation strategy using a GAN. Thus, the DCNN model adopted data augmentation strategies and provided a more robust learning state than when learning in the low-data regime during the training and validation processes.
As shown in Figure 6, the learning process in Scenario 2 stably decreased the loss value to the optimization level in both the training and validation stages with performance improvement. The results demonstrate that the data augmentation strategies used in this experiment enable the provision of stable learning environments in the training and validation stages with performance improvement. Figure 7 shows the experimental results for Scenario 2. Compared to the experiments in Scenario 1, all the CNN models increased the accuracy at the same training epochs. The experimental results (scenario 2) evaluated by using the augmented test dataset are presented in Figure 8.
As presented in Table 4, the accuracy of all models trained in Scenario 2 was improved compared to that achieved in Scenario 1. The average accuracy of each model in Scenario 1 was 0.7959; meanwhile, in the case of Scenario 2, the average accuracy was 0.9607. Consequently, it is demonstrated that the accuracy of the model trained using the data augmented dataset is increased by approximately 0.16 compared to the models trained using the raw dataset.

6. Discussion and Conclusions

The purpose of this study is to solve the problem of data shortage by using a GAN with geometric data augmentation and to demonstrate experimentally that GAN-based data augmentation contributes to the improvement of the structural damage recognition model. The model presented in this study was designed with the target of four types of damage that are mainly exposed in deteriorated structures. In contrast to previous studies, this study presented selective GAN-based data augmentation approaches to solve the imbalance of specific defects such as leakage and rebar exposure, which are relatively low in frequency. As a result, the data imbalance can be solved by generating a synthetic image using the GAN data augmentation technique. It was experimentally proved that this approach can be an alternative to acquire data of defect types in the construction field that are difficult to obtain efficiently.
For this experiment, approximately 2000 pieces of raw data (non-damage, 412; crack, 530; rebar exposure, 268; delamination, 563; and leakage, 208) were collected from an actual damaged building, and the dataset was classified into five categories. Subsequently, the experiments were implemented using two approaches. The first scenario was implemented using a raw dataset, and five models, AlexNet, VGG16, Resnet50, InceptionV4, and MobileNet, were used as DCNN models. In the second scenario, the experiment was conducted using an amplified dataset as the training data based on the same five models. The data augmentation method, geometric transformation, and GAN method were applied. In particular, the GAN method was applied to rebar exposure and leakage data to prevent data imbalance problems.
The experimental results confirmed that both scenarios were optimized well in the data learning stage, but the performance did not improve by more than a certain amount in Scenario 1 in the validation stage. Meanwhile, in Scenario 2, the performance was improved to the same level as the graph shown in the training stage, and the average accuracy improved by approximately 0.16 in the performance evaluation with the test data.
This study proposes a method to solve the data shortage problem in the building and infrastructure fields, and experimentally demonstrates that the proposed method contributes to an improvement in performance of the deep learning model. The GAN-based data augmentation approach proposed in this study contributes to solving the problems of a small dataset and data distribution imbalance in a multi-class dataset. Synthetic images generated through the GAN cannot completely replace real-world data, but they can be effectively applied to prevent performance degradation due to data imbalance conditions.
However, a limitation of this study is the lack of diversity in the models used in the experiments. Recently, the improvement in model performance has been actively explored using various techniques such as attention networks and knowledge distillation, but this study focused on providing the effect of data augmentation using five representative CNN-based models. As this study did not explore every presented model and its scope was limited to solving the image classification problem, the obtained results have limitations for representing an absolute solution to the defect detection problem. At present, various augmentation techniques for solving the object detection problem are being studied. In future works, the GAN-based selective object augmentation method in the training stage could be applied to improve the performance of the defect detection model in practical fields. Nonetheless, the experiments implemented in this study demonstrated that the GAN-based data augmentation strategy can be a reliable alternative to complement defect datasets with an unbalanced number of objects. In addition, the model trained using augmented data can be extended to pre-trained models as backbone networks on object detection models for the building and infrastructure domains.

Author Contributions

Conceptualization, H.S.; methodology, H.S., Y.A.; writing—original draft preparation, H.S; writing—review and editing, S.L.; data curation, H.G., visualization, H.S.; supervision, S.T.; project administration, M.S.; funding acquisition, M.S., S.L. All authors have read and agreed to the published version of the manuscript.

Funding

This work is supported by the Korea Agency for Infrastructure Technology Advancement (KAIA) grant funded by the Ministry of Land, Infrastructure and Transport (Grant 21CTAP-C163951-01).

Institutional Review Board Statement

Not applicable.

Informed Consent Statement

Not applicable.

Data Availability Statement

The data presented in this study are available on request from the corresponding author.

Conflicts of Interest

The authors declare no conflict of interest.

References

  1. Liang, X. Image-based post-disaster inspection of reinforced concrete bridge systems using deep learning with Bayesian optimization. Comput.-Aided Civ. Infrastruct. Eng. 2019, 34, 415–430. [Google Scholar] [CrossRef]
  2. Lin, Y.Z.; Nie, Z.H.; Ma, H.W. Structural Damage Detection with Automatic Feature-Extraction through Deep Learning. Comput.-Aided Civ. Infrastruct. Eng. 2017, 32, 1025–1046. [Google Scholar] [CrossRef]
  3. Cha, Y.J.; Choi, W.; Suh, G.; Mahmoudkhani, S.; Büyüköztürk, O. Autonomous Structural Visual Inspection Using Region-Based Deep Learning for Detecting Multiple Damage Types. Comput.-Aided Civ. Infrastruct. Eng. 2018, 33, 731–747. [Google Scholar] [CrossRef]
  4. Maeda, H.; Sekimoto, Y.; Seto, T.; Kashiyama, T.; Omata, H. Road Damage Detection and Classification Using Deep Neural Networks with Smartphone Images. Comput.-Aided Civ. Infrastruct. Eng. 2018, 33, 1127–1141. [Google Scholar] [CrossRef]
  5. Sharma, M.; Anotaipaiboon, W.; Chaiyasarn, K. Concrete crack detection using the integration of convolutional neural network and support vector machine. Sci. Technol. Asia 2018, 23, 19–28. [Google Scholar]
  6. Yang, X.; Li, H.; Yu, Y.; Luo, X.; Huang, T.; Yang, X. Automatic Pixel-Level Crack Detection and Measurement Using Fully Convolutional Network. Comput.-Aided Civ. Infrastruct. Eng. 2018, 33, 1090–1109. [Google Scholar] [CrossRef]
  7. Zhang, A.; Wang, K.C.P.; Li, B.; Yang, E.; Dai, X.; Peng, Y.; Fei, Y.; Liu, Y.; Li, J.Q.; Chen, C. Automated Pixel-Level Pavement Crack Detection on 3D Asphalt Surfaces Using a Deep-Learning Network. Comput.-Aided Civ. Infrastruct. Eng. 2017, 32, 805–819. [Google Scholar] [CrossRef]
  8. Liu, Z.; Zhong, X.; Dong, T.; He, C.; Wu, B. Delamination detection in composite plates by synthesizing time-reversed Lamb waves and a modified damage imaging algorithm based on RAPID. Struct. Control Health Monit. 2017, 24, 1–17. [Google Scholar] [CrossRef]
  9. Dinh, K.; Gucunski, N.; Duong, T.H. An algorithm for automatic localization and detection of rebars from GPR data of concrete bridge decks. Autom. Constr. 2018, 89, 292–298. [Google Scholar] [CrossRef]
  10. Atha, D.J.; Jahanshahi, M.R. Evaluation of deep learning approaches based on convolutional neural networks for corrosion detection. Struct. Health Monit. 2018, 17, 1110–1128. [Google Scholar] [CrossRef]
  11. Dong, Y.; Wang, J.; Wang, Z.; Zhang, X.; Gao, Y.; Sui, Q.; Jiang, P. A Deep-Learning-Based Multiple Defect Detection Method for Tunnel Lining Damages. IEEE Access 2019, 7, 182643–182657. [Google Scholar] [CrossRef]
  12. Wang, N.; Zhao, Q.; Li, S.; Zhao, X.; Zhao, P. Damage Classification for Masonry Historic Structures Using Convolutional Neural Networks Based on Still Images. Comput.-Aided Civ. Infrastruct. Eng. 2018, 33, 1073–1089. [Google Scholar] [CrossRef]
  13. Deng, J.; Lu, Y.; Lee, V.C.S. Concrete crack detection with handwriting script interferences using faster region-based convolutional neural network. Comput.-Aided Civ. Infrastruct. Eng. 2020, 35, 373–388. [Google Scholar] [CrossRef]
  14. Antoniou, A.; Storkey, A.; Edwards, H. Data augmentation generative adversarial networks. arXiv 2017, arXiv:1711.04340. [Google Scholar]
  15. Nhat-Duc, H.; Nguyen, Q.L.; Tran, V.D. Automatic recognition of asphalt pavement cracks using metaheuristic optimized edge detection algorithms and convolution neural network. Autom. Constr. 2018, 94, 203–213. [Google Scholar] [CrossRef]
  16. Lee, J.; Ahn, Y.; Lee, S. Post-Handover Defect Risk Profile of Residential Buildings Using Loss Distribution Approach. J. Manag. Eng. 2020, 36, 04020021. [Google Scholar] [CrossRef]
  17. Lee, K.; Hong, G.; Sael, L.; Lee, S.; Kim, H.Y. MultiDefectNet: Multi-Class Defect Detection of Building Façade Based on Deep Convolutional Neural Network. Sustainability 2020, 12, 9785. [Google Scholar] [CrossRef]
  18. Antoniou, A.; Storkey, A.; Edwards, H. Augmenting image classifiers using data augmentation generative adversarial networks. In Proceedings of the 27th International Conference on Artificial Neural Networks, Rhodes, Greece, 4–7 October 2018; pp. 594–603. [Google Scholar]
  19. Shorten, C.; Khoshgoftaar, T.M. A survey on Image Data Augmentation for Deep Learning. J. Big Data 2019, 6, 60. [Google Scholar] [CrossRef]
  20. Hauberg, S.; Freifeld, O.; Lindbo Larsen, A.B.; Fisher, J.W.; Hansen, L.K. Dreaming more data: Class-dependent distributions over diffeomorphisms for learned data augmentation. In Proceedings of the 19th International Conference on Artificial Intelligence and Statistics, AISTATS 2016, Cadiz, Spain, 9–11 May 2016; Volume 41, pp. 342–350. [Google Scholar]
  21. Krizhevsky, A.; Sutskever, I.; Hinton, G.E. ImageNet classification with deep convolutional neural networks. Commun. ACM 2017, 60, 84–90. [Google Scholar] [CrossRef]
  22. Chandran, P.; Asber, J.; Thiery, F.; Odelius, J.; Rantatalo, M. An Investigation of Railway Fastener Detection Using Image Processing and Augmented Deep Learning. Sustainability 2021, 13, 12051. [Google Scholar] [CrossRef]
  23. Engstrom, L.; Tran, B.; Tsipras, D.; Schmidt, L.; Madry, A. A rotation and a translation suffice: Fooling cnns with simple transformations. In Proceedings of the International Conference on Learning Representations, ICLR 2019, New Orleans, LA, USA, 6–9 May 2019. [Google Scholar]
  24. Goodfellow, I.; Pouget-Abadie, J.; Mirza, M.; Xu, B.; Warde-Farley, D.; Ozair, S.; Courville, A.; Bengio, Y. Generative adversarial nets. In Advances in Neural Information Processing Systems 27; MIT Press: Cambridge, MA, USA, 2014. [Google Scholar]
  25. Zhu, J.Y.; Park, T.; Isola, P.; Efros, A.A. Unpaired image-to-image translation using cycle-consistent adversarial networks. In Proceedings of the IEEE International Conference on Computer Vision 2017, Venice, Italy, 22–29 October 2017; pp. 2242–2251. [Google Scholar]
  26. Radford, A.; Metz, L.; Chintala, S. Unsupervised representation learning with deep convolutional generative adversarial networks. In Proceedings of the 4th International Conference on Learning Representations, ICLR 2016—Conference Track Proceedings 2016, San Juan, Puerto Rico, 2–4 May 2016; pp. 1–16. [Google Scholar]
  27. Gauthier, J. Conditional generative adversarial nets for convolutional face generation. Cl. Proj. Stanf. CS231N Convolutional Neural Netw. Vis. Recognit. Winter Semester 2014, 2014, 2. [Google Scholar]
  28. Frid-Adar, M.; Klang, E.; Amitai, M.; Goldberger, J.; Greenspan, H. Synthetic data augmentation using GAN for improved liver lesion classification. In Proceedings of the International Symposium on Biomedical Imaging 2018, Washington, DC, USA, 4–7 April 2018; pp. 289–293. [Google Scholar]
  29. Kim, T.; Cha, M.; Kim, H.; Lee, J.K.; Kim, J. Learning to discover cross-domain relations with generative adversarial networks. In Proceedings of the 34th International Conference on Machine Learning, ICML 2017, Sydney, Australia, 6–11 August 2017; Volume 4, pp. 2941–2949. [Google Scholar]
  30. Gao, Y.; Kong, B.; Mosalam, K.M. Deep leaf-bootstrapping generative adversarial network for structural image data augmentation. Comput.-Aided Civ. Infrastruct. Eng. 2019, 34, 755–773. [Google Scholar] [CrossRef]
  31. Lee, S.; Kim, J.; Lee, G.; Hong, J.; Bae, J.H.; Lim, K.J. Prediction of Aquatic Ecosystem Health Indices through Machine Learning Models Using the WGAN-Based Data Augmentation Method. Sustainability 2021, 13, 10435. [Google Scholar] [CrossRef]
  32. Ledig, C.; Theis, L.; Huszár, F.; Caballero, J.; Cunningham, A.; Acosta, A.; Aitken, A.; Tejani, A.; Totz, J.; Wang, Z. Photo-realistic single image super-resolution using a generative adversarial network. In Proceedings of the IEEE Conference on Computer Vision and Pattern Recognition, Honolulu, HI, USA, 21–26 July 2017; pp. 4681–4690. [Google Scholar]
  33. Kitchen, A.; Seah, J. Deep Generative Adversarial Neural Networks for Realistic Prostate Lesion MRI Synthesis. arXiv 2017, arXiv:1708.00129. [Google Scholar]
  34. Simonyan, K.; Zisserman, A. Very deep convolutional networks for large-scale image recognition. arXiv 2014, arXiv:1409.1556. [Google Scholar]
  35. Szegedy, C.; Vanhoucke, V.; Ioffe, S.; Shlens, J.; Wojna, Z. Rethinking the inception architecture for computer vision. In Proceedings of the 2016 IEEE Conference on Computer Vision and Pattern Recognition (CVPR), Las Vegas, NV, USA, 27–30 June 2016; pp. 2818–2826. [Google Scholar]
  36. He, K.; Zhang, X.; Ren, S.; Sun, J. Deep residual learning for image recognition. In Proceedings of the IEEE Conference on Computer Vision and Pattern Recognition (CVPR), Las Vegas, NV, USA, 27–30 June 2016; pp. 770–778. [Google Scholar]
  37. Sandler, M.; Howard, A.; Zhu, M.; Zhmoginov, A.; Chen, L.C. MobileNetV2: Inverted residuals and linear bottlenecks. In Proceedings of the IEEE Computer Society Conference on Computer Vision and Pattern Recognition, Salt Lake City, UT, USA, 18–23 June 2018; pp. 4510–4520. [Google Scholar]
  38. Rawat, W.; Wang, Z. Deep Convolutional Neural Networks for Image Classification: A Comprehensive Review. Neural Comput. 2017, 29, 2352–2449. [Google Scholar] [CrossRef] [PubMed]
  39. Kingma, D.P.; Ba, J.L. Adam: A method for stochastic optimization. In Proceedings of the 3rd International Conference on Learning Representations, ICLR 2015—Conference Track Proceedings, San Diego, CA, USA, 7–9 May 2015; pp. 1–15. [Google Scholar]
Figure 1. Conceptual schematic process of generative adversarial network (GAN).
Sustainability 13 12682 g001
Figure 2. Example of synthetic images generated using GAN.
Sustainability 13 12682 g002
Figure 3. Loss and accuracy graphs for the training stage (Scenario 1).
Sustainability 13 12682 g003
Figure 4. Loss and accuracy graphs for the validation stage (Scenario 1).
Sustainability 13 12682 g004
Figure 5. Confusion matrix of the experimented model (VGG16).
Sustainability 13 12682 g005
Figure 6. Loss and accuracy graphs for the training stage (Scenario 2).
Sustainability 13 12682 g006
Figure 7. Loss and accuracy graphs for the validation stage (Scenario 2).
Sustainability 13 12682 g007
Figure 8. Confusion matrix of the experimented model using data augmentation (VGG16).
Sustainability 13 12682 g008
Table 1. Distribution of raw datasets.
CategoryC0C1C2C3C4Total
Raw Dataset4125302685632081954
Train2973821944061511430
Val74954810137355
Test4153265620196
C0: Non-damage, C1: Crack, C2: Rebar exposure, C3: Delamination, C4: Leakage.
Table 2. Number of concrete damage images using data augmentation.
CategoryC0C1C2C3C4Total
Raw Dataset4125302685632081954
Train Dataset2973821944061511430
Val Dataset74954810137355
Test Dataset4153265620196
Train Dataset _DA16,00016,00016,00016,00016,00080,000
Val Dataset _DA4000400040004000400020,000
Test Dataset _DA2368298814363036109210,920
C0: Non-Damage, C1: Crack, C2: Rebar exposure, C3: Delamination, C4: Leakage; DA: Data Augmentation including GAN.
Table 3. Results of the experiments (Scenario 1: no data augmentation).
ModelsLossAccuracyPrecisionRecallF1-Score
AlexNet0.87780.84690.84680.84180.8443
VGG161.55670.85710.86970.85060.8600
ResNet501.33340.75000.75610.74490.7504
InceptionV30.74650.83670.84840.83160.8398
MobileNetV21.29940.68880.69610.67860.6871
Average1.16270.79590.80090.79080.7957
Table 4. Results of the experiments (Scenario 2: Data augmentation).
ModelsLossAccuracyPrecisionRecallF1-Score
AlexNet+DA0.41990.92350.94290.91840.9300
VGG16+DA0.15620.97550.97040.97040.9704
ResNet50+DA0.19240.96050.96030.96080.9608
InceptionV3+DA0.10170.97560.97710.97500.9760
MobileNetV2+DA0.11940.96850.96980.96800.9686
Average0.19720.96070.96510.95950.9621
Publisher’s Note: MDPI stays neutral with regard to jurisdictional claims in published maps and institutional affiliations.

