Article

The Relationship between the Conception of Nature and Environmental Valuation

1
Graduate School of Agricultural Science, Tohoku University, Sendai 9808572, Japan
2
Former Student of Faculty of Agriculture, Tohoku University, Sendai 9808572, Japan
*
Author to whom correspondence should be addressed.
Sustainability 2021, 13(22), 12683; https://doi.org/10.3390/su132212683
Submission received: 28 September 2021 / Revised: 14 November 2021 / Accepted: 15 November 2021 / Published: 16 November 2021

Abstract

:
As individuals’ relationships with nature become more diverse, so do their conceptions of nature. In this study, the image of nature and derived feelings are defined as the conception of nature. This study aimed to identify the conceptions of nature held by individuals and their influence on environmental valuation. The number of respondents who imagined natural forests when they heard the word “nature” was the highest (58%), followed by those who imagined Satoyama (31%). The factor analysis extracted five feelings toward the image of nature: care, oneness, aversion, mystery, and restorativeness. These feelings differed depending on the image of nature conjured up by individuals. Respondents who imagined natural forests and Satoyama had a higher sense of care, causing higher willingness-to-pay for forest conservation. These results revealed that the image of nature differed from person to person, contrary to previous studies where nature was regarded as predominantly represented by vegetation. Feelings for the image of nature also differed. It can be concluded that an individuals’ conception of nature influences their environmental valuation.

1. Introduction

1.1. Background

Individuals’ conceptions of nature may become more diverse due to globalization and the concentration of the population in urban areas. However, the focus is rarely on an individual’s conception of nature. What images of nature do individuals have in their minds? What feelings do they have toward those images of nature? It is expected that each person’s conception of nature will influence their values. The Intergovernmental Science Policy Platform on Biodiversity and Ecosystem Services proposed “Nature Contributions to People” as an alternative concept to ecosystem services [1]. It requires a value assessment from a pluralistic perspective on the relationship between humans and nature, but it was pointed out that studies covering cultural backgrounds and various worldviews are insufficient [2]. Clarifying the relationship between individuals’ conceptions of nature and environmental valuation will provide insight into environmental psychology and economics.
This study aimed to identify the conceptions of nature held by individuals and their influence on environmental valuation. First, people’s image of nature and their corresponding feelings toward it were clarified. This was defined as conceptions of nature. Second, the effects of the conception of nature on environmental valuation were explored. The research target was Japanese individuals. Several previous studies on the conception of nature by Japanese ethnic groups have been conducted. Rapid economic growth in Japan has shifted people’s lives from rural to urban areas. It is assumed that lifestyle changes make individuals’ conceptions of nature more diverse. The willingness-to-pay (WTP) for forest conservation in Japan was used as a target to clarify environmental valuation.

1.2. Literature Review

There are many studies on the psychological connection between nature and humans. For example, the Connectedness to Nature Scale (CNS) [3], the Nature Relatedness Scale (NRS) [4], and other original environmental scales have been developed to clarify this connection. Using the CNS, it has been suggested that the connection to nature influences ecological behavior and subjective well-being [3]. Additionally, a study clarified the relationship between environmental concerns and behavior using NRS [5]. Emotional affinity toward nature (EAN) was developed as a dispositional variable that describes the extent to which a person has an emotional connection to the natural environment [6,7]. The relationship between EAN and nature-protective behavior has been previously reported [6]. Shibata [8] identified feelings toward nature in Japan and developed a new scale for assessing feelings toward nature, including connectedness. He demonstrated these feelings consisted of five components: restorativeness, oneness, mystery, care, and aversion.
However, it has been highlighted that most environmental psychology studies tend to investigate nature without first defining it [9]. All of the above studies were completed through a questionnaire survey, but the type of nature was not specified in the questionnaire. Ulrich [10] stated that Americans and Europeans classify a qualified environment as “natural” when it contains extensive vegetation or water, with few buildings or cars. Shibata [8] assumed nature to be “predominantly vegetation”, based on Ulrich’s study. As there is no single image of “nature” that people think of, each respondent may have a different image. Even if it is just nature, such as “predominantly vegetation”, the type of vegetation (artificial or natural) and the structure of vegetation (grassland or forest) may differ from respondent to respondent. Different types of images of nature may lead to different psychological responses, such as feelings and awareness of nature. Affect is closely related to cognition and behavior [11], and positive affect is also known to influence social behavior [12]. If the psychological responses to the image of nature are different, people’s valuations and behaviors toward nature may also vary. Therefore, for more accurate research on environmental psychology and economics, it is necessary to clarify the relationship between an individuals’ image of nature and psychological responses and their effects on valuations.
In Japan, 41% of forests are artificial and 97% of artificial forests are coniferous forests, such as cedar and cypress [13]. Coniferous forests face various problems such as low domestic lumber prices due to increased imports, decreased forestry workers, and insufficient maintenance. Additionally, the deterioration of the forest environment affects suburban and urban areas as the risk of disaster damage increases due to the weakening of the ground structure and the number of pollinosis patients increases. The forest environmental tax and the forest environment transfer tax were introduced in 2019. They are expected to serve as financial resource for implementing improvements and human resource development. This study estimates WTP under the scenario of conversion of artificial forests to mixed forests.
There are many studies on environmental valuation and WTP for forests: an evaluation of public interest functions of the forest such as preventing disaster, serving as water resources, and preserving the living environment [14], a survey of WTP for biodiversity enhancement in planted forests [15]; a survey on WTP for Satoyama management [16]; a survey on WTP for recreation in a proximate urban forest [17]; a study that indicated that WTP is higher when residences are closer to the forest and surrounded by broadleaf forest than coniferous [18]; a study of the relationship between the New Environmental Paradigm model and WTP for forest ecosystem services [19]; an analysis of perceptions of landscape value of naturally dead and artificially felled trees [20]; and a study of the role of emotions on WTP for mountain landscape features [21]. However, based on the literature review, no studies have addressed the impact of the conception of nature on WTP.

1.3. The Definition of a Conception of Nature

In previous academic studies, the concept of nature has rarely been defined. A famous Japanese essayist, Torahiko Terada [22], stated that the conception of nature is about how one sees and reacts to nature. Oyamada et al. [23] stated that it is that which determines what situations are perceived as nature. Hayashi [24] regarded it as people’s ideas toward nature. In this study, the concept of nature was defined based on these interpretations. The conception of nature is defined as including the image of nature and derived feelings, leading to valuation decisions. It is not about people’s likes or dislikes toward nature, but rather about how they think of it. It was hypothesized that environmental assessment would vary depending on individuals’ conceptions of nature.
There are many studies on the conception of nature of the specific ethnic groups, for example, a study on biosphere reserves of ethnic groups with different religions [25], and a comparative study of nature values between Westerners and Central Asians [26]. The Japanese ethnic group’s conception of nature is often discussed [27,28,29]. Mostly, the focus is on the differences between Japanese and Western conceptions of nature. The Japanese consider nature an object of coexistence rather than something to be used and conquered for human gain. There have been studies on “the way Japanese think about nature” [30] and the study of relationships between pro-environmental behaviors and general values in Japan [29]. However, due to recent globalization and changes in lifestyles, the conception of nature held by groups may change among individuals. Many people who lived in rural areas in the past are now concentrated in urban areas and have fewer opportunities to interact with nature. Developing natural images depends on past individual experiences of contact with nature [31]. As individuals’ relationships with nature have become more diverse than ever before, their image of nature may vary. The individual feelings regarding these images may also vary.
Next, two important factors when discussing the Japanese conception of nature are explained.

1.3.1. Mountain Worship

In Japan, mountain worship has existed since ancient times. It was influenced by Chinese Buddhism, Taoism, and Shintoism. Mountains have been considered mysterious places for Shugendo (ascetic practices) [32], and believers have entered the mountains only in practice [33]. However, the European mountaineering boom occurred in the 18th century. Western alpinism was aimed at the conquest and first ascent of mountains. Western mountaineering was brought to Japan in the late Edo period, and it was not until the Meiji period that it became popular [34]. Even today, mountain god worship events are held throughout Japan [35]. According to a 1993 survey on the Japanese conception of nature (conducted by the Institute of Nuclear Safety Systems, Inc., Institute of Social Research, Mihama-cho, Mikata-gun, Fukui, Japan), 73% of respondents answered “yes” to the question, “When you enter a deep forest, do you feel a spiritual feeling?” [24]. A survey of the Japanese National Character (The Institute of Statistical Mathematics, 1953–2013) is conducted every five years, and there is a question about the Japanese conception of nature. Among the responses, “In order to be happy, man must follow nature”, “must make use of” and “must conquer”, the “conquer” answers increased until 1968. However, the trend reversed in 1973, and in 2013, 48% of respondents chose “follow”, 41% chose “make use” and 6% chose “conquer”.

1.3.2. Satoyama

Satoyama is defined as “a landscape with mosaics composed of various types of ecosystems, including secondary woodlands, irrigation ponds, rice paddies, pastures, and grasslands with human settlements” [36]. Okada [37] details the transition of the Satoyama in Japan. In the past, Satoyama was used as an agricultural land and forest in residential areas. Still, with the energy revolution after World War II and the increase in the number of people leaving farming, Satoyama lost its productivity and became less used. However, in the 1980s, the need to conserve Satoyama emerged for its flood prevention function, recreational value, and biodiversity conservation. It is now regarded as important for the protection of forestry, agriculture, and the environment. Hori et al. [38] stated that the original landscape of the Japanese people is “Satoyama”, a landscape with streams, green rice paddies, and mountains. The direct relationship between animation films and the conception of nature has not been studied, but it presumably has some influence. Typical examples are Studio Ghibli’s works such as “My Neighbor Totoro”, “Pom Poko”, and “Only Yesterday”. Studio Ghibli’s works are well known for their strong sense of coexistence with nature [39]. The Satoyama depicted in these works is the original landscape of the Japanese people.

2. Research Methodology

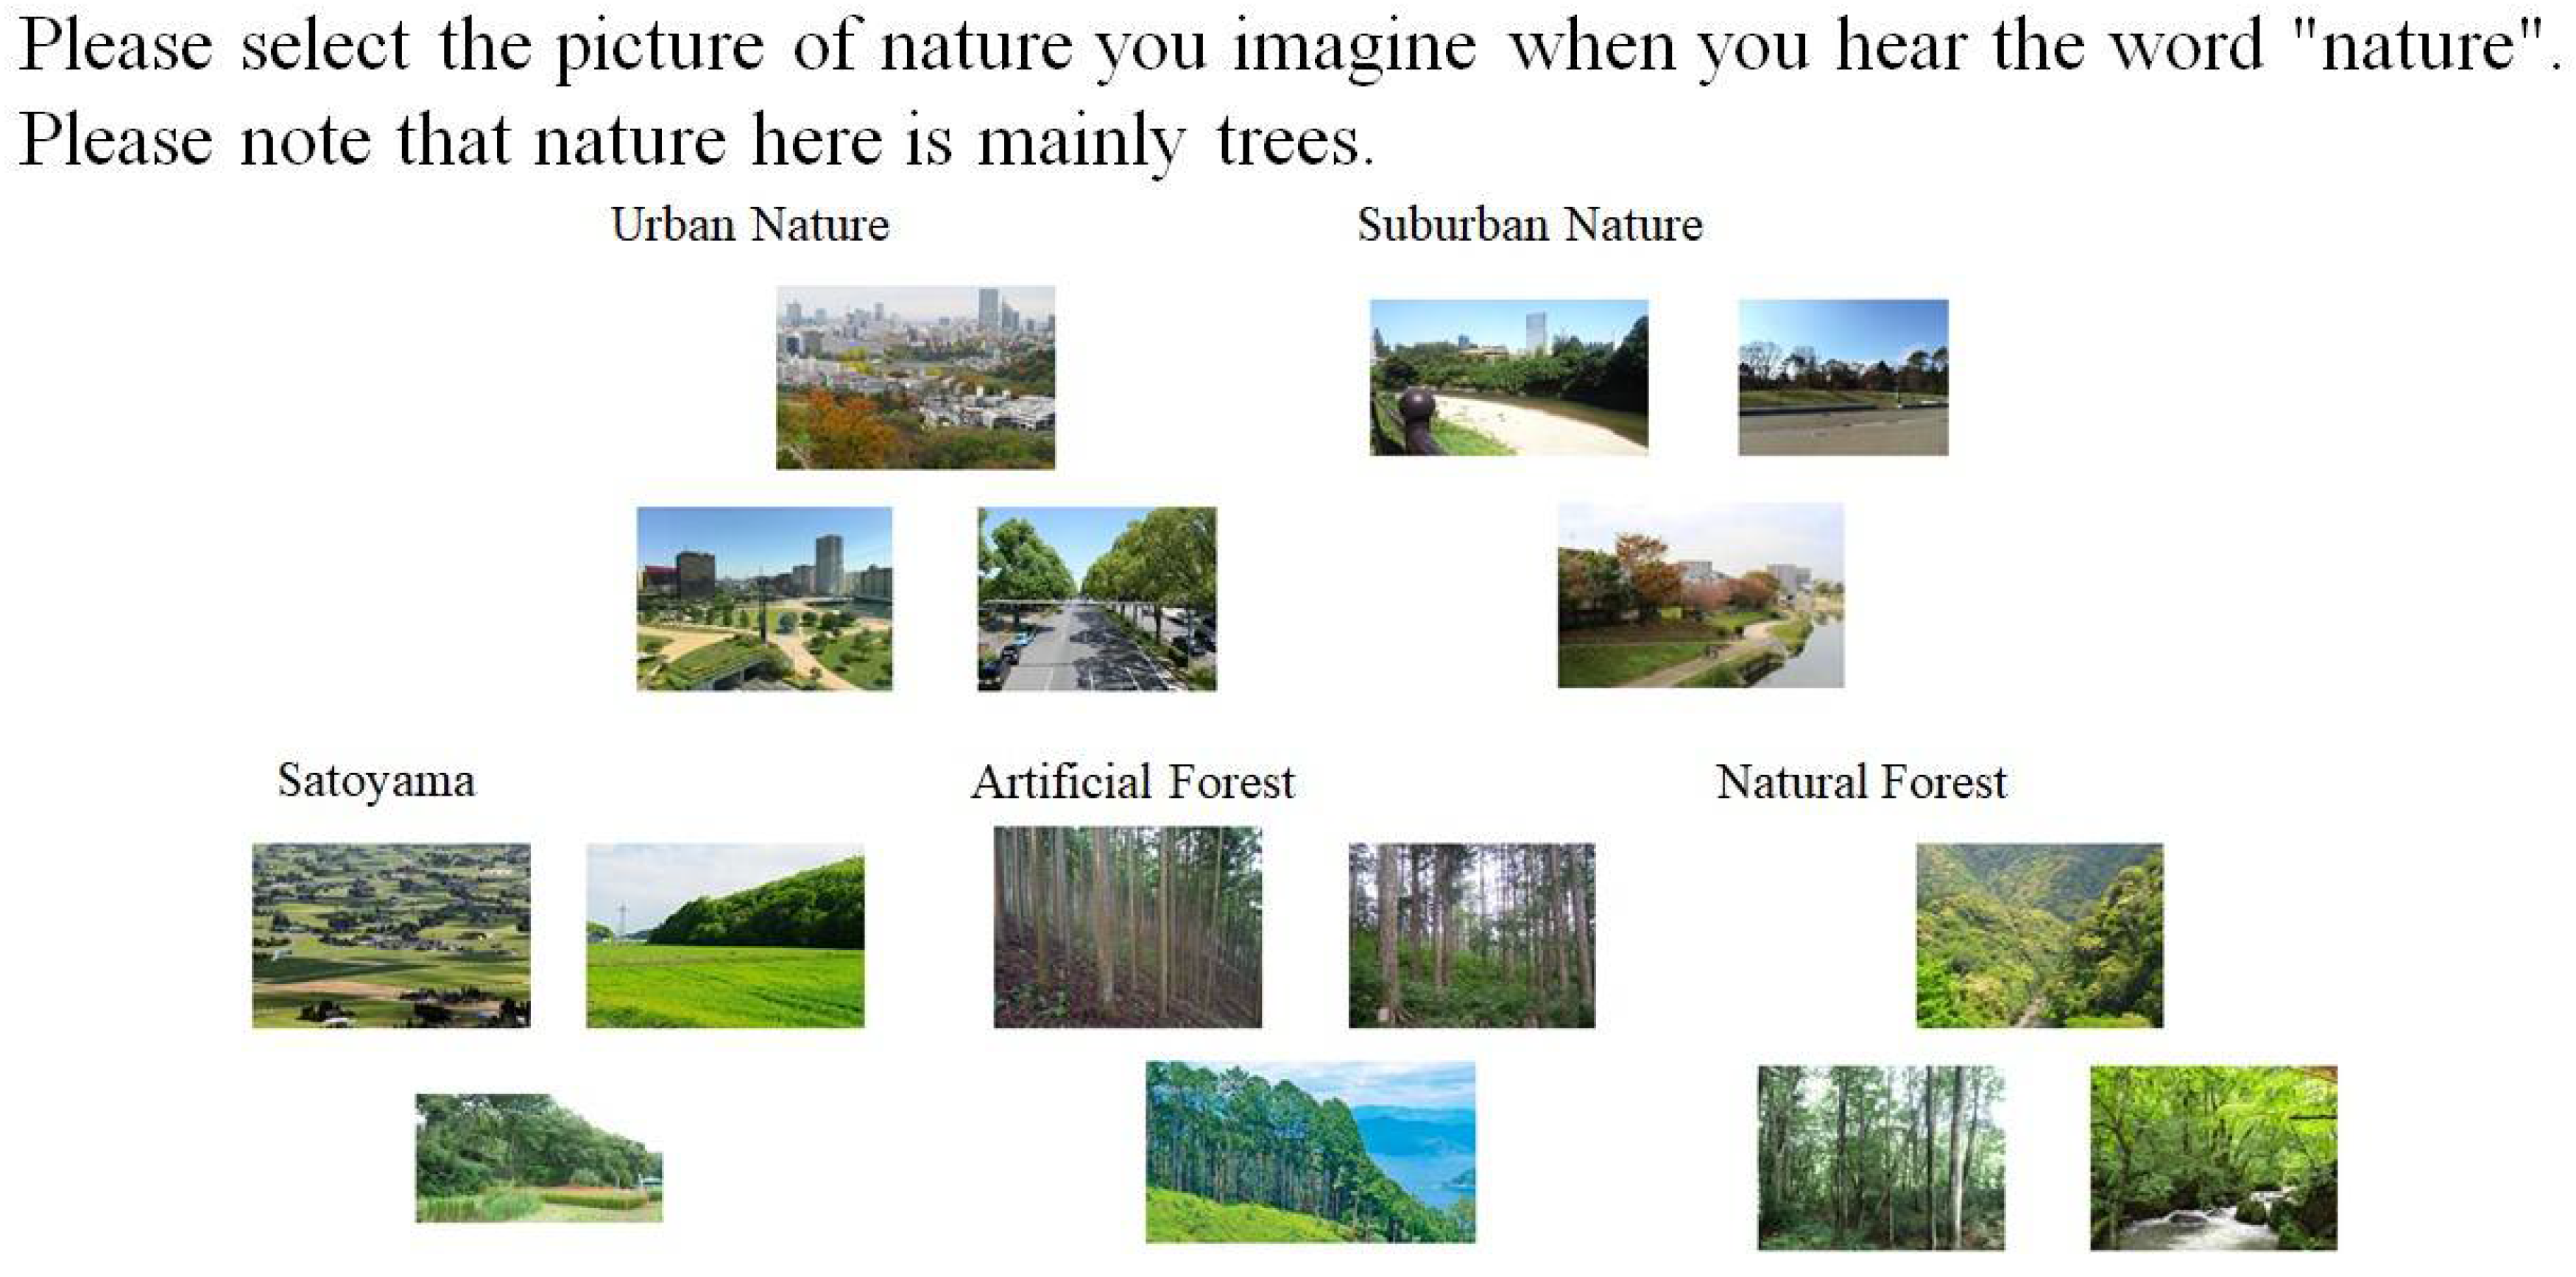
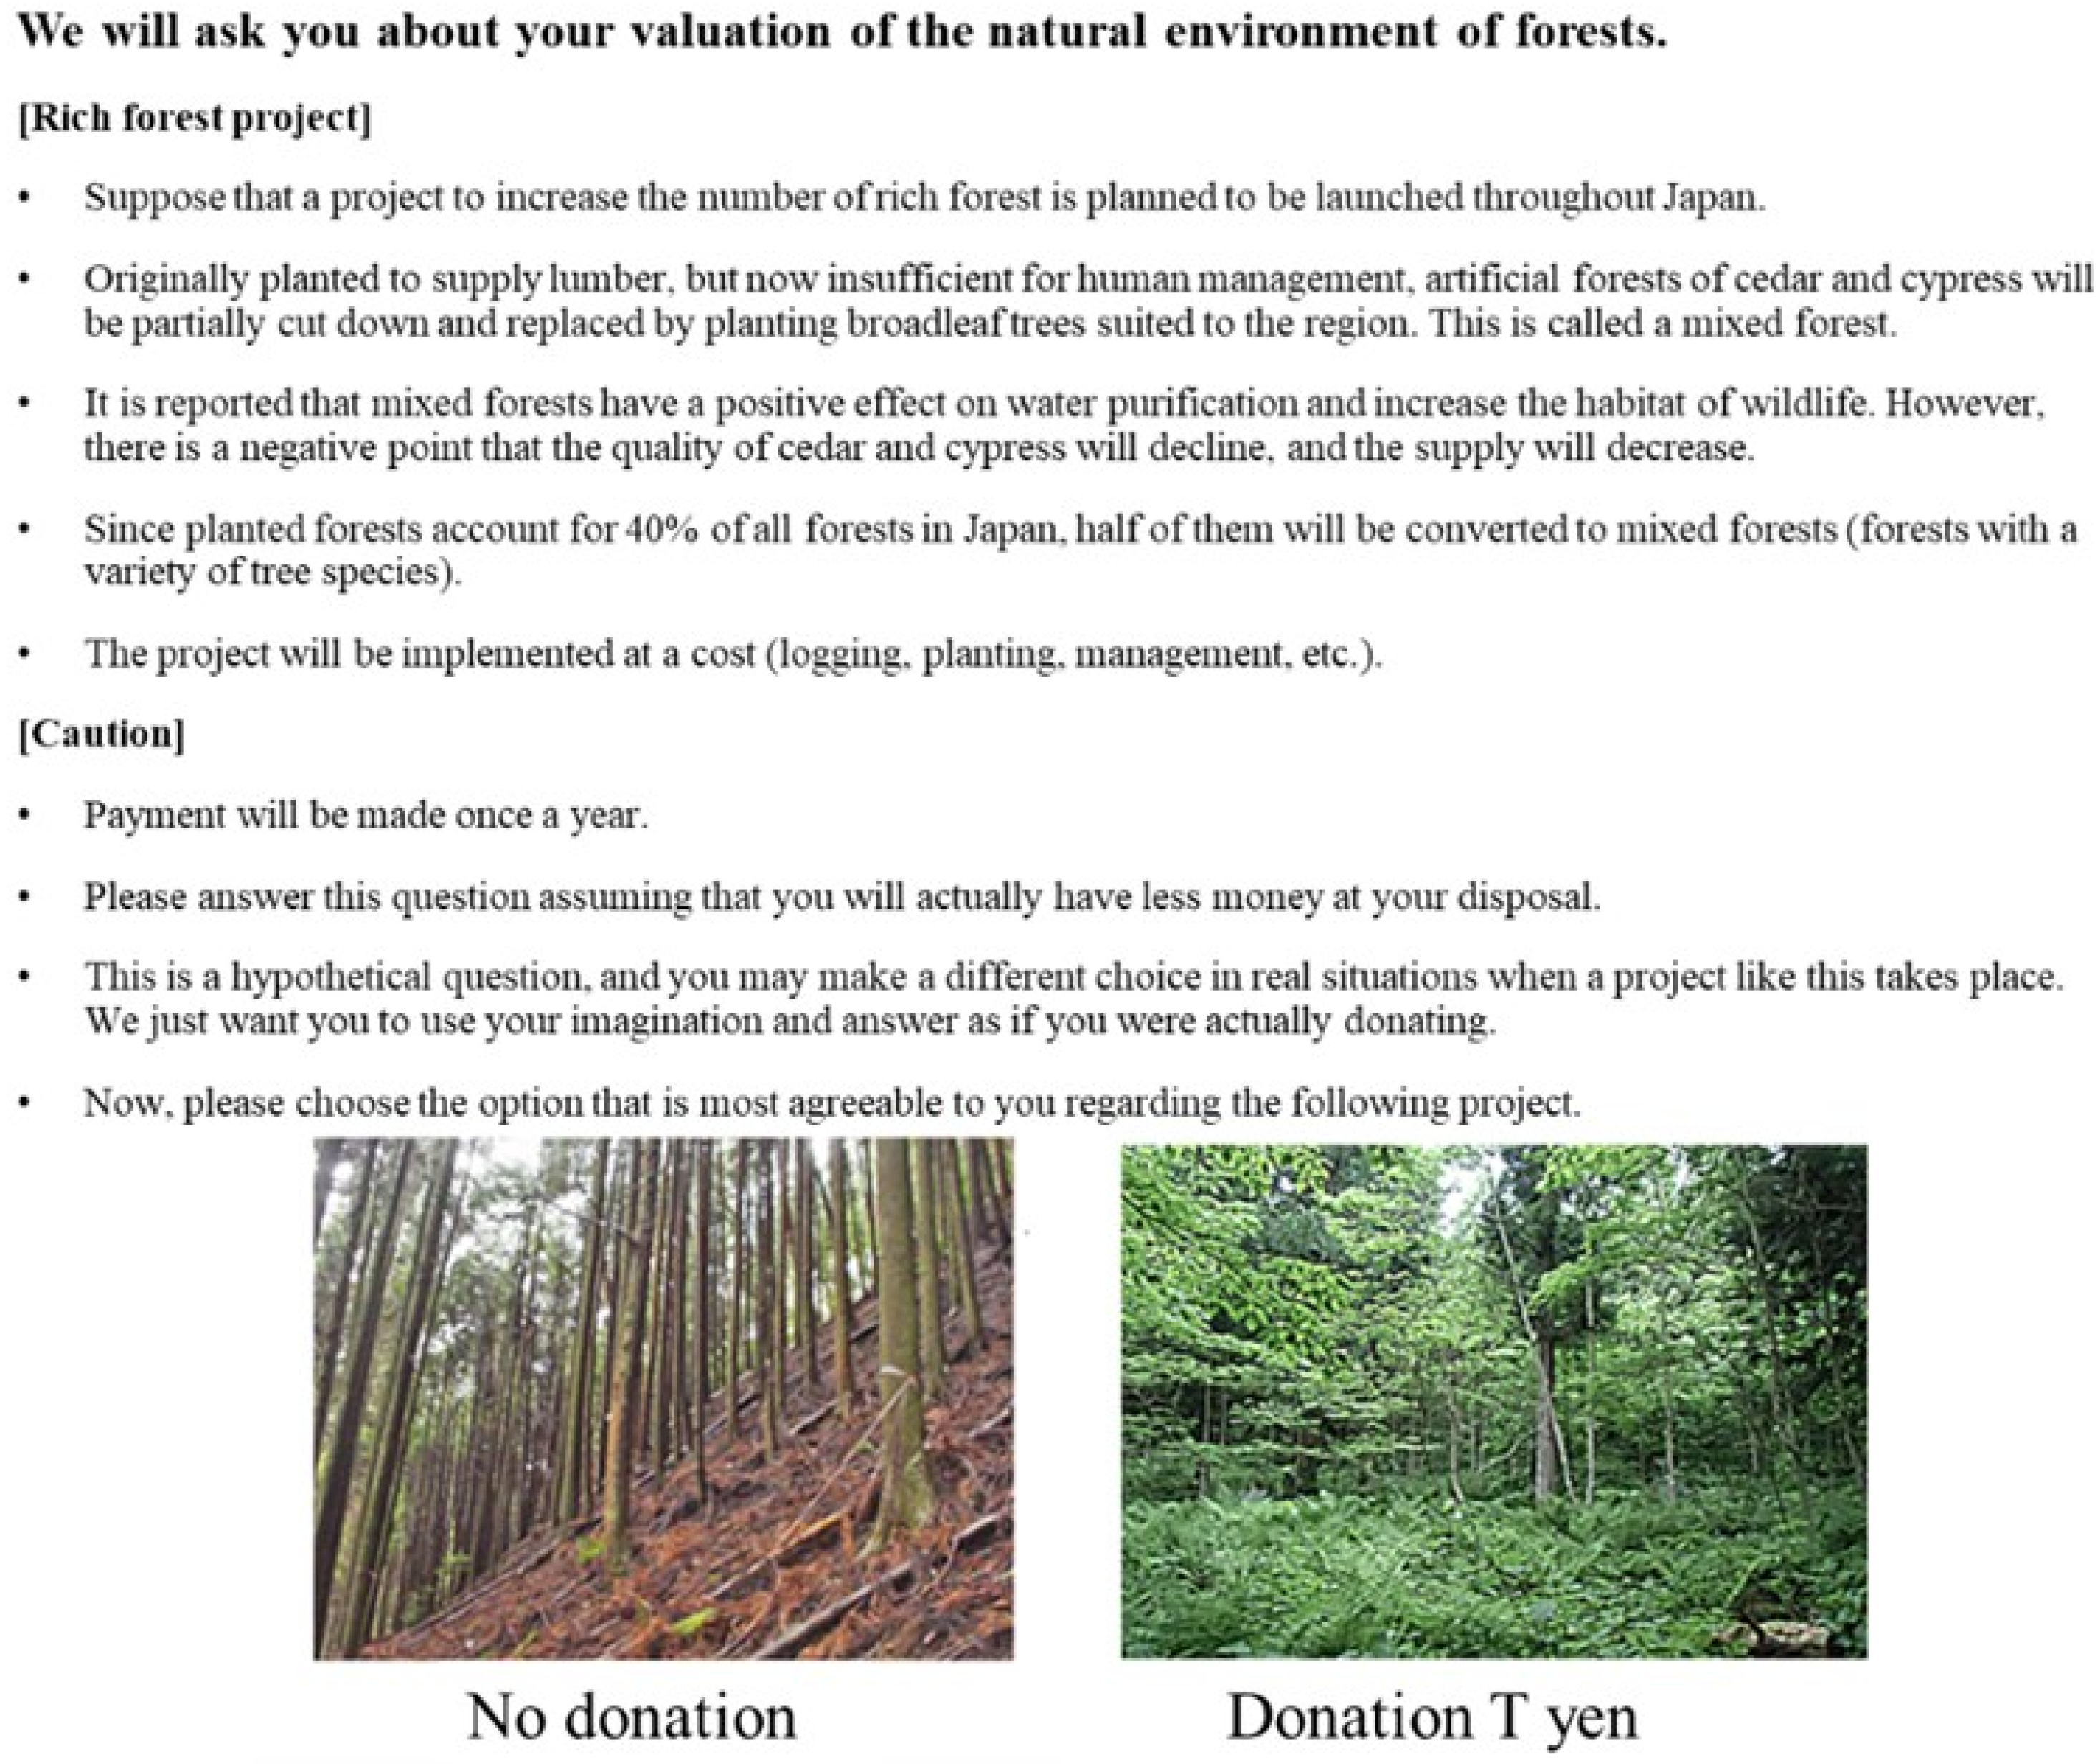
2.1. Target Respondents and Questionnaire

An online questionnaire survey was conducted in December 2018. The targets for the survey were people living in Japan registered with a survey company; a total of 3103 people responded. The respondents’ ages ranged evenly from their twenties to their sixties. Japan’s prefectures were divided into 10 regions, and the populations of the prefectural capitals and non-prefectural capitals in each region were calculated. The number of respondents was assigned to each region in which they live according to that population ratio.
The questionnaire comprised the following four sections. Respondents’ images of the word “nature” were explored using five types of nature with pictures in the questionnaire (Figure 1); urban parks and street trees (hereafter, “Urban Nature”); riverbanks and suburban forest (“Suburban Nature”); traditional agricultural landscapes in Japan including secondary woodlands, irrigation canals, rice paddies, pastures, and villages (“Satoyama”); cedar and cypress forest (“Artificial Forest”); and broadleaf and mixed forest of broadleaf and coniferous forest (“Natural Forest”). Some respondents may think of oceans or deserts when they hear the word “nature”, but the vast variety of nature may make statistical analysis impossible. In this study, nature was limited mainly to trees to measure the WTP for forests. Three pictures were presented so that later answers would not be drawn to a specific picture.
Next, to measure feelings toward the image of nature in the above section, 20 questions were presented. The scale for assessing feelings toward nature was determined based on a previous study [8]. However, in this survey, we asked the respondents were asked to answer the questions while picturing the image of nature, and there were some unnatural parts in the original scale. Therefore, some sentences were altered to match the image of nature selected by the respondents to retain the meaning of the original scale. The questions were shuffled among the 20 items and asked in random order for each respondent. All questions were answered using Likert-like five-point scales (1 = completely disagree to 5 = completely agree), as in Shibata [8].
Then, the respondents were asked about their relationship with nature such as the frequency of visits to the place, their image of nature, and preference for wood product purchases.
Finally, questions were asked about the WTP to convert artificial forest to mixed forest by applying a double-bounded dichotomous choice method (Figure 2). The respondents were asked about their hypothetical donation amount twice.

2.2. Data

To clarify respondents’ feelings toward the image of nature, factor analysis using the maximum likelihood method and Promax rotation were conducted using 20 questions measuring these feelings. Two types of factor analysis were conducted: one using the data of all respondents without dividing the groups of respondents by image of nature, and the other with dividing them thus. In addition, analysis of variance was conducted for each conjured image using the factor scores obtained from the factor analysis of the data of all respondents to clarify the trend of feelings.
A random parameter logit model [40] was applied to estimate WTP. The double-bounded dichotomous choice method is a way to increase the amount of information obtained from a single respondent by asking for the donation amount twice to obtain valid results even with a small sample size. A hypothetical environmental policy is presented to the respondent, and if the response is Yes to the first offer T1, a higher amount of TU was presented. If the respondent answered No, a lower amount of TL was presented. Four types of response patterns were obtained: Yes for both T1 and TU (YY), Yes for T1 but No for TU (YN), No for T1 but Yes for TL (NY), and No for both T1 and TL (NN). The probability of obtaining each answer is as follows:
Pr [YY] = 1 − G (TU) = S (TU)
Pr [YN] = G (TU) − G (T1) = S (T1) − S (TU)
Pr [NY] = G (T1) − G (TL) = S (TL) − S (T1)
Pr [NN] = G (TL) = 1 − S (TL)
Note that G (T) is the distribution function when the offered amount is T, and S (T) is the survival function. A random parameter logit model is applied, where β is the vector of parameters to be estimated, and x is the vector of explanatory variables.
l o g i t G ( T ) = 1 1 + exp ( β 0 + β T lnT + β k x k )
pj is the survival probability, and whether the respondent will say yes to the offer is Tj.
Assuming that the WTP is in the interval Tj to Tj+1, the log-likelihood function is
lnL = j N j ln ( p j p j + 1 )
Note that Nj is the number of respondents whose WTP is in the interval Tj to Tj+1. Estimate β using the maximum likelihood method to maximize the log-likelihood function.
For the WTP estimation, the questions on the relationship with nature and the factor scores of the feelings in the factor analysis with all the data were used to determine the explanatory variables selected according to the AIC criterion using the increasing variable method. The WTP of individuals was calculated from the obtained coefficients of the explanatory variables, the WTP of individuals was calculated, and the mean and median were calculated for each group of respondents for the image of nature. Then, based on the mean scores of the explanatory variables, the relationship between WTP and the conception of nature was discussed.

3. Results

The number of respondents who imagined urban nature, suburban nature, Satoyama, artificial forest, and natural forest were 59, 194, 964, 84 and 1802, respectively. Therefore, it was found that most Japanese people imagined nature as a natural forest in mountainous areas (58%). Nonetheless, 31% of Japanese people chose images of Satoyama, the traditional agricultural landscape in Japan.
Factor analysis was conducted using the data of all respondents without dividing the groups of respondents by the image of nature (Table 1). Five factors were extracted from the 20 questions of the emotional response scale using the screen plot criterion, interpreted as care, oneness, aversion, mystery, and restorativeness to increase factor contribution. The contents of the five factors are generally similar to those of Shibata [8]. In his study, the inter-factor correlations between mystery and care, oneness, and restorativeness were positive, while mystery and aversion were negative. However, the results of the inter-factor correlations were different for mystery. The signs of the inter-factor correlations between mystery and other factors were reversed.
Next, the relationship between the image of nature and the factor scores was confirmed. Variance analysis was applied to the factor scores for each feeling among the group of respondents in the image of nature (Table 2). A difference in the mean values of the four factors was found except for aversion at the 1% level. The factor score for care was lower for respondents who imagined urban nature, suburban nature, and artificial forests. The factor score for oneness was particularly low among respondents who imagined natural forests. The difference in factor scores for aversion was not significant but was higher only for respondents who imagined natural forests. Mystery was felt more strongly by respondents who imagined artificial and natural forests. Those who imagined urban, suburban nature, and artificial forest had lower factor scores for restorativeness, as with care.
Then, the respondents were categorized according to their imagined nature and a factor analysis was conducted for each. As the respondents who imagined urban, suburban, and artificial forests were small in number, they were analyzed together. Four factors were extracted and interpreted as care or restorativeness, aversion, oneness, and mystery, in order of factor contribution (Table 3). The factor structure differed from the results of the factor analysis for all respondents. Care and restorativeness were negatively correlated with other factors.
As in the overall results, five factors were extracted for the Satoyama group and it was found that the order of the factor contributions was similar (Table 4). The values of the inter-factor correlations between oneness and other factors were reversed compared to the overall results, but the effect was weak.
The same five factors were extracted for natural forests (Table 5). In the inter-factor correlations, the values between aversion and the other factors were reversed, contrary to the overall results.
The impact of conceptions of nature on WTP was estimated (Table 6). As explanatory variables, three questions on the relationship with nature and five factor scores on five feelings in the factor analysis with all the data were selected according to the AIC criterion. The WTP of each person was calculated based on the coefficients of these explanatory variables, and the median and mean of the WTP for each group of respondents by image of nature are shown at the bottom of Table 6. Respondents who imagined natural forest had the highest mean and median WTP, followed by those who imagined Satoyama. According to the variance analysis among the types of images of nature, there was a significant difference in the mean WTP at the 1% level (Table 7).
The coefficients for the three questions about the respondents’ relationship with nature were significantly positive, and the means for each group of respondents by image of nature were checked as follows. Respondents who imagined Satoyama and suburban nature visited natural places like the ones they imagined more often. The respondents who imagined Satoyama or natural forest preferred viewing pictures or video images of nature. Respondents who imagined artificial forests and suburban nature preferred purchasing wood products, while those who imagined urban nature did not.
As for the five feelings factor scores as explanatory variables, the coefficients of care, oneness, mystery, and restorativeness were significantly positive, while the coefficient of aversion was significantly negative.

4. Discussion

When they heard the word “nature”, featuring mainly trees, the respondents imagined different things with 58% of respondents imagined a natural forest with many trees, while 31% imaging Satoyama, a Japanese agricultural land containing various ecosystems. Even in an environment with many trees, the natural forest was imagined more than the artificial forest. It is consistent with the result of Kovács et al. [20] who found that the more the trees with relatively minor human intervention are, the more natural they seem.
Based on the results of factor analysis and analysis of variance, the relationship between respondents’ images of nature and their five feelings toward nature was considered. The sense of care was higher among those who imagined Satoyama and natural forest than among those who imagined urban nature, suburban nature and artificial forests. The destruction of Satoyama and natural forests has become a problem in recent years, and people are aware of this danger. However, the destruction of man-made nature is hardly a problem, and awareness of its protection is low. The sense of restorativeness was higher among those who imagined Satoyama, while artificial nature might not provide a feeling of healing. This is consistent with the results of the physiological approach [41], indicating that people have more restorative effects in natural environments than in urban environments. The nature of Satoyama provided the most sense of restorativeness, and this is believed to emanate from a feeling of security and nostalgia for the traditional Japanese agricultural landscape. In the factor analysis of the group of respondents who imagined urban, suburban, and artificial forests, it can be assumed that care and restorativeness were extracted as a cohesive factor because they both showed similar patterns with low mean values. The factor scores for oneness were lower for respondents who imagined natural forests. The result was generally consistent with the result of the frequency of annual visits to the imagined nature, probably because natural forests are often far away from residential areas, and people have few opportunities to visit them. Respondents who imagined urban and suburban nature visited nature more frequently and also had a higher sense of oneness, suggesting that the relationship with nature is expected to have an impact on the individual’s conception of nature. Those who imagined the forests were more likely to have a sense of mystery. This is probably because Japanese people have a peculiar awareness that Gods inhabit mountains with forests. While Shibata [8] inquired about the sense of mystery in “deep forests” and “mountains”, this study focused on the respondents’ image of nature. Respondents who imagined natural forests felt a sense of mystery, but those who imagined Satoyama—the second largest number of respondents—felt little mystery. The fact that a certain number of respondents imagined Satoyama may explain why the inter-factor correlations were reversed from previous studies. The sense of aversion, although not significant, was lower among those who imagined natural forests. Some respondents who imagined natural forests may think that it is usual to have insects in nature and mud on the ground.
The conception of nature was defined as including the image of nature and derived feelings. Although the five factors of feelings extracted for Satoyama and natural forests, for which the proportion of respondents was particularly high, were the same, the patterns of the factor scores were different. Accordingly, evoked feelings differed depending on the characteristics of the image of nature and its relationship with nature. These findings reveal that people have different conceptions of nature.
It was also found that WTP differed depending on respondents’ view of nature. The WTP of respondents who imagined Satoyama and natural forests was high. The WTP of respondents who imagined urban and suburban nature and artificial forests was low. Respondents who imagined Satoyama and natural forest had a higher sense of care, which had the largest coefficient and was an important factor that made a difference in WTP. Respondents who imagined urban and suburban nature visited nature more frequently, indicating that individuals’ conceptions of nature varied depending on their relationship with nature. However, the number of visits had only a slight effect on WTP. Respondents who imagined Satoyama and natural forests preferred to viewing videos and photos of nature, increasing their WTP. Although the specifics could not be clarified, it is possible that animation and movies also contribute to environmental conservation. Preference for purchasing wood products increases WTP, but this preference is not linked to environmental protection awareness. These results suggest that different people have different views and ways of relating to nature, affecting their environmental valuation.

5. Conclusions

This study clarified individuals’ conceptions of nature, contrary to previous studies of groups’ conceptions of nature. Previous studies have defined nature as predominantly vegetation [8,10], but it is clear that different individuals have different images when they hear the word “nature”. Although many people think of Satoyama as traditional Japanese farmland and natural forests with many trees, few think of urban, suburban nature, and artificial forests. Four feelings toward urban nature, suburban nature, and artificial forests, and five feelings toward Satoyama and natural forests were extracted. However, each was felt to a different degree. The results show that the conception of nature is not consistent but varies from person to person. Additionally, differences in environmental valuation were found depending on the individual’s conception of nature. In forest conservation, those who imagined Satoyama and natural forests with rich vegetation and high awareness of environmental conservation provided high valuations, which differed from those who imagined other types of nature.
Findings in this study suggests that researchers need to present nature in a more concretely when conducting research on relationships between nature and people. This is because people’s feelings toward nature are caused by their image of nature. Otherwise, respondents may imagine nature differently from the researchers’ assumptions, which may prevent the accurate estimation of environmental valuation and behavior. Therefore, research on environmental concern, behavior, and psychology should be implemented after sharing the image of nature with respondents and researchers.
Finally, in this study, some of the results were difficult to interpret. It was unclear why the inter-factor correlations of feelings differed depending on the nature of the image. This may be because, unlike previous studies, this study considered each image of nature separately. Therefore, it is necessary to organize the mutual influence relationships between feelings toward each image of nature. This will allow clarification of the structure of our conception of nature in detail and the development of detailed behaviors and valuations.

Author Contributions

Conceptualization, A.N., T.I. and Y.N.; methodology, A.N., T.I. and Y.N.; validation, Y.N.; formal analysis, Y.N. and T.I.; investigation, A.N. and T.I.; resources, A.N. and T.I.; data curation, T.I.; writing—original draft preparation, Y.N.; writing—review and editing, T.I. and A.N.; visualization, Y.N.; supervision, T.I.; project administration, T.I.; funding acquisition, T.I. All authors have read and agreed to the published version of the manuscript.

Funding

This research was funded by JSPS KAKENHI, Grant Number JP21K18128.

Institutional Review Board Statement

Ethical review and approval were waived for this study for the following reasons: This survey is a questionnaire survey that does not directly affect or burden the human body, etc., and is not intended to collect information or data on an individual’s body, mind, etc. Necessary and sufficient information was provided to the subjects, and after obtaining their understanding and consent, the subjects were left to answer the questionnaire at their own will. The data was collected from information already anonymized by other organizations and does not contain any personal information.

Informed Consent Statement

Informed consent was obtained from all subjects involved in the study.

Data Availability Statement

Data are not available due to ethical restrictions. Due to the nature of this research, the participants of this study did not agree for their data to be shared publicly, so supporting data are not available.

Conflicts of Interest

The authors declare no conflict of interest.

References

  1. Intergovernmental Science-Policy Platform on Biodiversity and Ecosystem Services. Summary for Policymakers of the Global Assessment Report on Biodiversity and Ecosystem Services of the Intergovernmental Science-Policy Platform on Biodiversity and Ecosystem Service; IPBES Secretariat: Bonn, Germany, 2019. [Google Scholar] [CrossRef]
  2. Kadykalo, A.N.; López-Rodriguez, M.D.; Ainscough, J.; Droste, N.; Ryu, H.; Ávila-Flores, G.; Le Clec’h, S.; Muñoz, M.C.; Nilsson, L.; Rana, S.; et al. Disentangling ‘ecosystem services’ and ‘nature’s contributions to people’. Ecosyst. People 2019, 15, 269–287. [Google Scholar] [CrossRef] [Green Version]
  3. Mayer, F.S.; Frantz, C.M. The Connectedness to Nature Scale: A Measure of Individuals’ Feeling in Community with Nature. J. Environ. Psychol. 2004, 24, 503–515. [Google Scholar] [CrossRef] [Green Version]
  4. Nisbet, E.K. The Human-Nature Connection: Increasing Nature Relatedness, Environmental Concern, and Well-Being, Through Education. Master’s Thesis, Carleton University, Ottawa, ON, Canada, 2005. [Google Scholar] [CrossRef] [Green Version]
  5. Nisbet, E.K.; Zelenski, J.M.; Murphy, S.A. The Nature Relatedness Scale: Linking Individuals’ Connection With Nature to Environmental Concern and Behavior. Environ. Behav. 2009, 41, 715–740. [Google Scholar] [CrossRef]
  6. Kals, E.; Schumacher, D.; Montada, L. Emotional Affinity Toward Nature as a Motivational Basis to Protect Nature. Environ. Behav. 1999, 31, 178–202. [Google Scholar] [CrossRef]
  7. Müller, M.M.; Kals, E.; Pansa, R. Adolescents’ Emotional Affinity Toward Nature: A Cross-Societal Study. J. Dev. Process. 2009, 4, 59–69. [Google Scholar]
  8. Shibata, S. Development of the Feelings Toward Nature Scale and Relationship Between Feelings Toward Nature and Proximity to Nature. Shinrigaku Kenkyu (Jpn. J. Psychol.) 2016, 87, 50–59. [Google Scholar] [CrossRef] [Green Version]
  9. Ives, C.D.; Giusti, M.; Fischer, J.; Abson, D.J.; Klaniecki, K.; Dorninger, C.; Laudan, J.; Barthel, S.; Paivi, A.; Martín-López, B.; et al. Human-Nature Connection: A Multidisciplinary Review. Curr. Opin. Environ. Sustain. 2017, 26–27, 106–113. [Google Scholar] [CrossRef]
  10. Ulrich, R.S. Aesthetic and Affective Response to Natural Environment. In Behavior and the Natural Environment; Altman, I., Wohlwill, J.F., Eds.; Plenum Press: New York, NY, USA, 1983; pp. 85–125. [Google Scholar] [CrossRef]
  11. Breckler, S.J. Empirical validation of affect, behavior, and cognition as distinct components of attitude. J. Pers. Soc. Psychol. 1984, 47, 1191–1205. [Google Scholar] [CrossRef] [PubMed]
  12. Isen, A.M. Positive Affect, Cognitive Processes, and Social Behavior. Adv. Exp. Soc. Psychol. 1987, 20, 203–253. [Google Scholar] [CrossRef]
  13. Forest and Forestry Statistics. Available online: https://www.rinya.maff.go.jp/j/kikaku/toukei/youran_mokuzi2020.html (accessed on 6 September 2021).
  14. Tsuge, T. The Valuation of the Externalities of Forest on Citizen’s Preferences and Possibility of Use in a Policy-Making: A Choice Experiment Study. Environ. Sci. 2001, 14, 465–476. [Google Scholar] [CrossRef]
  15. Yao, R.T.; Scarpa, R.; Turner, J.A.; Barnard, T.D.; Rose, J.M.; Palma, J.H.N.; Harrison, D.R. Valuing Biodiversity Enhancement in New Zealand’s Planted Forests: Socioeconomic and Spatial Determinants of Willingness-to-Pay. Ecol. Econ. 2014, 98, 90–101. [Google Scholar] [CrossRef] [Green Version]
  16. Muranaka, A.; Terawaki, T. Socioeconomic Evaluation for Benefits of Satoyama Forest Management by Stated Preference Measures. Jpn. J. Hum. Geogr. 2005, 57, 153–172. [Google Scholar] [CrossRef]
  17. Rosenberger, R.S.; Needham, M.D.; Morzillo, A.T.; Moehrke, C. Attitudes, Willingness to Pay, and Stated Values for Recreation Use Fees at an Urban Proximate Forest. J. Forest Econ. 2012, 18, 271–281. [Google Scholar] [CrossRef]
  18. Czajkowski, M.; Bartczak, A.; Budziński, W.; Giergiczny, M.; Hanley, N. Preference and WTP Stability for Public Forest Management. Forest Policy Econ. 2016, 71, 11–22. [Google Scholar] [CrossRef] [Green Version]
  19. Filyushkina, A.; Agimass, F.; Lundhede, T.; Strange, N.; Jacobsen, J.B. Preferences for Variation in Forest Characteristics: Does Diversity Between Stands Matter? Ecol. Econ. 2017, 140, 22–29. [Google Scholar] [CrossRef]
  20. Kovács, B.; Uchiyama, Y.; Miyake, Y.; Penker, M.; Kohsaka, R. An explorative analysis of landscape value perceptions of naturally dead and cut wood: A case study of visitors to Kaisho Forest, Aichi, Japan. J. For. Res. 2020, 25, 291–298. [Google Scholar] [CrossRef]
  21. Notaro, S.; Grilli, G.; Paletto, A. The Role of Emotions on Tourists’ Willingness to Pay for the Alpine Landscape: A Latent Class Approach. Landsc. Res. 2019, 44, 743–756. [Google Scholar] [CrossRef]
  22. Terada, T. The Japanese Concept of Nature. In Torahiko Terada’s Collection of Essays; Iwanami Bunko, Iwanami Shoten Publishers: Tokyo, Japan, 1948; Volume 5. [Google Scholar]
  23. Oyamada, S.; Hasebe, T.; Kitani, S.; Moore, R.H.; Fan, W.; Park, S. Diversity and Change in the Conceptions of Nature. In Studies in Conceptions of Nature, Fate of Humanity; Zakota, Y., Ed.; Tohoku University Press: Sendai, Japan, 2015. [Google Scholar]
  24. Hayashi, F. The Way Nature Is Perceived in Japan, as Reflected in Opinion Surveys, With a Focus on the Younger Generation. Rev. Humanit. Soc. Sci. 1999, 15, 31–51. [Google Scholar]
  25. Negev, M.; Sagie, H.; Orenstein, D.E.; Shamir, S.Z.; Hassan, Y.; Amasha, H.; Raviv, O.; Fares, N.; Lotan, A.; Peled, Y.; et al. Using the Ecosystem Services Framework for Defining Diverse Human-Nature Relationships in a Multi-Ethnic Biosphere Reserve. Ecosyst. Serv. 2019, 39, 100989. [Google Scholar] [CrossRef]
  26. Christie, M.; Martín-López, B.; Church, A.; Siwicka, E.; Szymonczyk, P.; Sauterel, J.M. Understanding the Diversity of Values of “Nature’s Contributions to People”: Insights From the IPBES Assessment of Europe and Central Asia. Sustain. Sci. 2019, 14, 1267–1282. [Google Scholar] [CrossRef] [Green Version]
  27. Asquith, P.J.; Kalland, A. Japanese Perceptions of Nature: Ideals and Illusions. In Japanese Images of Nature; Asquith, P.J., Kalland, A., Eds.; Curzon Press: London, UK, 1997. [Google Scholar]
  28. Watanabe, M. The Conception of Nature in Japanese Culture. Science 1974, 183, 279–282. [Google Scholar] [CrossRef]
  29. Odin, S. The Japanese Concept of Nature in Relation to the Environmental Ethics and Conservation Aesthetics of Aldo Leopold. Environ. Ethics 1991, 13, 345–360. [Google Scholar] [CrossRef]
  30. Aoyagi, M. An Analysis of Pro-Environmental Behavior and Environmental Values. Environ. Sci. 2001, 14, 597–607. [Google Scholar] [CrossRef]
  31. Ueda, H.; Ono, R.; Simomura, A. A Study of Forest Landscape Image Structure From Experience and Conceptualized Images. J. Jpn. Inst. Landsc. Archit. 2001, 65, 685–688. [Google Scholar] [CrossRef]
  32. Suzuki, T. Mountain Worship and Hot Springs in Japan. Mon. Bull. Inst. Soc. Sci. 2019, 671, 1–15. [Google Scholar]
  33. Furusawa, Y. On Mountain Spirituality: The Secularization and Resacralization of Mountains. Annu. Rev. Relig. Stud. 2009, 26, 45–61. [Google Scholar]
  34. Koizumi, T. The Birth of Mountaineering—Why Do We Climb Mountains? Chuko Shinsho; Chuo Koron-Shinsha Publisher: Tokyo, Japan, 2001. [Google Scholar]
  35. Yanagita, K.; Matsumoto, T.; Iwaoka, M. The Characteristics and Regionality of the Yama No Kami Religion in the Forest Owners’ Cooperative in Chubu District. Chubu For. Res. 2016, 64, 73–76. [Google Scholar]
  36. The Secretariat of the Convention on Biological Diversity (CBD). Global Biodiversity Outlook 3. Available online: https://www.cbd.int/doc/publications/gbo/gbo3-final-en.pdf (accessed on 6 September 2021).
  37. Okada, W. Origin of and Change in the Concept of Satoyama in History of Forest Policy. J. Forest Econ. 2017, 63, 58–68. [Google Scholar] [CrossRef]
  38. Hori, S.; Kurihara, M.; Shinohara, O. On Structure of Experienced Landscape. J. Jpn. Inst. Landsc. Archit. 1987, 51, 287–292. [Google Scholar]
  39. Kado, K. The Environmental Thought in GHIBLI’s Movies: A Consideration Concerned With the Japanese-Style Climate. J. Hokkaido 2016, 66, 73–88. [Google Scholar]
  40. Hanemann, W.M. Discrete/Continuous Models of Consumer Demand. Econometrica 1984, 52, 541–561. [Google Scholar] [CrossRef]
  41. Hartig, T.; Mang, M.; Evans, G.W. Restorative Effects of Natural Environment Experiences. Environ. Behav. 1991, 23, 3–26. [Google Scholar] [CrossRef]
Figure 1. Five options presented to respondents.
Sustainability 13 12683 g001
Figure 2. The scenario for WTP for converting planted forests to mixed forests.
Sustainability 13 12683 g002
Table 1. Factor analysis using all data.
Question of the Scale for Assessing Feelings toward NatureFactor Loadings
Factor 1
Care
Factor 2
Oneness
Factor 3
Aversion
Factor 4
Mystery
Factor 5
Restorativeness
I feel relaxed when I see lush nature.0.4100.096−0.0160.0070.498
I find solace in the greeness of trees.0.3730.1070.0020.0490.504
I become happy when I see beautiful flowers and plants.0.2770.1980.0140.0880.404
I feel content and somehow at home when I see lush nature.0.1380.3940.0130.0780.389
I feel a sense of being emotionally close to the rich natural environment.0.1960.608−0.015−0.0820.210
I feel like I belong to nature.−0.0790.9120.045−0.044−0.010
I feel a strong attachment to the natural environment.0.1320.697−0.0180.0110.054
I feel a strong sense of oneness with nature.0.0050.6720.0240.1380.030
I feel a sense of awe regarding old and large trees.0.184−0.126−0.0440.6960.159
I feel a sense of spirituality when trees are dense.0.187−0.066−0.0450.6630.120
I think there is a God in nature.−0.0700.1430.0700.691−0.167
I feel holy when I go to places with nature.0.0470.173−0.0110.659−0.019
It makes me sad to see natural environments destroyed.0.8620.033−0.023−0.009−0.013
It makes me sad to think trees are cleared in the environment.0.7140.2030.0370.035−0.124
I feel sad that nature is diminished for development.0.8590.033−0.042−0.004−0.028
I feel sad when I see garbage scattered in a place rich in nature.0.769−0.160−0.0260.0450.182
The thought of being deep in the woods is frightening.0.0140.0550.6910.024−0.047
I do not like going into nature because my shoes and clothes get dirty.−0.0610.0270.815−0.016−0.005
I do not like places with a lot of nature because they are unclean.−0.1700.1600.800−0.036−0.062
I do not like places with a lot of trees and flowers because they are full of insects.0.233−0.2890.7070.0080.160
Percentage of the variance explained by the factors0.1600.1300.1150.0940.051
Inter-factor correlations
Care 0.182−0.593−0.6820.596
Oneness −0.212−0.0420.287
Aversion 0.683−0.494
Mystery −0.560
Note: Values of 0.4 and above are shown in bold.
Table 2. Analysis of variance for each feeling.
Dependent Variable: CareDependent Variable: Mystery
GroupsCountSumAverageVariance GroupsCountSumAverageVariance
Urban Nature59−48.005−0.8140.873 Urban Nature59−0.337−0.0060.502
Suburban Nature194−103.132−0.5321.439 Suburban Nature194−22.965−0.1181.415
Satoyama96454.2640.0561.593 Satoyama964−180.570−0.1871.653
Artificial Forest84−29.479−0.3511.170 Artificial Forest842.4940.0301.033
Natural Forest1802126.3530.0701.564 Natural Forest1802201.3770.1121.694
Source of VariationSSdfMSFp-valueFcritSource of VariationSSdfMSFp-valueFcrit
Between Groups116.14429.03618.8310.0002.375Between Groups59.12414.7809.1010.0002.375
Within Groups4776.9030981.542Within Groups5031.1030981.624
Total4893.043102Total5090.223102
Dependent Variable: OnenessDependent Variable: Restorativeness
GroupsCountSumAverageVariance GroupsCountSumAverageVariance
Urban Nature5912.4220.2110.740 Urban Nature59−11.777−0.2000.543
Suburban Nature19422.6760.1171.117 Suburban Nature194−47.800−0.2461.034
Satoyama96489.4680.0931.323 Satoyama96494.6810.0981.017
Artificial Forest8418.9830.2261.468 Artificial Forest84−28.023−0.3340.812
Natural Forest1802−143.549−0.0801.685 Natural Forest1802−7.080−0.0041.036
Source of VariationSSdfMSFp-valueFcritSource of VariationSSdfMSFp-valueFcrit
Between Groups29.2947.3244.8390.0012.375Between Groups32.8048.2018.0820.0002.375
Within Groups4688.8230981.513Within Groups3143.7030981.015
Total4718.113102Total3176.513102
Dependent Variable: Aversion
GroupsCountSumAverageVariance
Urban Nature595.7530.0981.088
Suburban Nature1947.9400.0410.864
Satoyama96436.5140.0380.875
Artificial Forest845.1490.0611.150
Natural Forest1802−55.356−0.0310.989
Source of VariationSSdfMSFp-valueFcrit
Between Groups4.2941.0711.1250.3432.375
Within Groups2949.3030980.952
Total2953.593102
Table 3. Factor analysis of respondents who imagined Urban Nature, Suburban Nature, and Artificial Forest.
Question of the Scale for Assessing Feelings toward NatureFactor Loadings
Factor 1
Care/Restorativeness
Factor 2
Aversion
Factor 3
Oneness
Factor 4
Mystery
I feel relaxed when I see lush nature.0.813−0.0430.091−0.050
I find solace in the greenness of trees.0.7600.0280.118−0.014
I become happy when I see beautiful flowers and plants.0.6930.0780.119−0.019
I feel content and somehow at home when I see lush nature.0.5930.0430.284−0.029
I feel a sense of being emotionally close to the rich natural environment.0.376−0.0160.590−0.027
I feel like I belong to nature.−0.0440.0880.7580.061
I feel a strong attachment to the natural environment.0.3820.1080.443−0.014
I feel a strong sense of oneness with nature. 0.1840.1120.4690.156
I feel a sense of awe from old and large trees.0.460−0.1340.0360.502
I feel a sense of spirituality when trees are dense.0.168−0.1020.2190.583
I think there is a God in nature.−0.128−0.0850.3940.641
I feel holy when I go to places with nature.0.1370.0080.3420.401
It makes me sad to see natural environments destroyed.0.775−0.0590.0290.078
It makes me sad to think trees are cleared in the environment.0.5080.1420.1400.086
I feel sad that nature is diminished for development.0.704−0.0890.0070.196
I feel sad when I see garbage scattered in a place rich in nature.1.006−0.100−0.105−0.084
The thought of being deep in the woods is frightening.−0.1560.4270.0700.281
I do not like going into nature because my shoes and clothes get dirty.−0.0380.690−0.0400.079
I do not like places with a lot of nature because they are unclean.−0.1981.0330.201−0.252
I do not like places with a lot of trees and flowers because they are full of insects.0.4100.552−0.3700.036
Percentage of the variance explained by the factors0.2630.1080.1000.070
Inter-factor correlations
Care/Restorativeness −0.453−0.626−0.697
Aversion 0.3250.645
Oneness 0.550
Note: Values of 0.4 and above are shown in bold.
Table 4. Factor analysis of respondents who imagined Satoyama.
Question of the Scale for Assessing Feelings toward NatureFactor Loadings
Factor 1
Care
Factor 2
Oneness
Factor 3
Aversion
Factor 4
Mystery
Factor 5
Restorativeness
I feel relaxed when I see the view of lush nature.0.3520.060−0.0080.0130.567
I find solace in the greenness of trees.0.3090.103−0.0170.0530.548
I become happy when I see beautiful flowers and plants.0.2310.2250.0290.0440.448
I feel content and somehow at home when I see lush nature.0.1390.440−0.0030.0430.345
I feel a sense of being emotionally close to the rich natural environment.0.2000.510−0.010−0.0640.279
I feel like I belong to nature.−0.0870.8820.016−0.001−0.018
I feel a strong attachment to the natural environment.0.0970.724−0.0090.0140.033
I feel a strong sense of oneness with nature. 0.0190.7240.0200.125−0.028
I feel a sense of awe from old and large trees.0.107−0.187−0.0420.6810.309
I feel a sense of spirituality when trees are dense.0.1150.081−0.0100.6230.094
I think there is a God in nature.−0.0630.0500.0140.751−0.118
I feel holy when I go to places with nature.0.0060.1880.0230.664−0.032
It makes me sad to see natural environments destroyed.0.8490.034−0.002−0.0320.019
It makes me sad to think trees are cleared in the environment.0.6770.1790.0320.077−0.131
I feel sad that nature is diminished for development.0.8960.003−0.0610.006−0.055
I feel sad when I see garbage scattered in a place rich in nature.0.741−0.154−0.0160.0170.204
The thought of being deep in the woods is frightening.−0.0220.0860.6930.038−0.078
I do not like going into nature because my shoes and clothes get dirty.−0.0350.0120.827−0.009−0.006
I do not like places with a lot of nature because they are unclean.−0.1860.1250.768−0.003−0.068
I do not like places with a lot of trees and flowers because they are full of insects.0.222−0.2580.716−0.0250.165
Percentage of the variance explained by the factors0.1500.1290.1140.0950.062
Inter-factor correlations
Care −0.245−0.607−0.6290.647
Oneness 0.2940.052−0.331
Aversion 0.681−0.559
Mystery −0.514
Note: Values of 0.4 and above are shown in bold.
Table 5. Factor analysis of respondents who imagined Natural Forest.
Question of the Scale for Assessing Feelings toward NatureFactor Loadings
Factor 1
Care
Factor 2
Oneness
Factor 3
Aversion
Factor 4
Mystery
Factor 5
Restorativeness
I feel relaxed when I see the view of lush nature.0.2670.092−0.0150.0130.603
I find solace in the greenness of trees.0.2440.0950.0060.0380.609
I become happy when I see beautiful flowers and plants.0.1680.178−0.0010.1200.465
I feel content and somehow at home when I see lush nature.0.0150.3860.0210.0980.466
I feel a sense of being emotionally close to the rich natural environment.0.1320.640−0.027−0.0830.212
I feel like I belong to nature.−0.0560.9310.060−0.080−0.014
I feel a strong attachment to the natural environment.0.1040.725−0.0420.0090.042
I feel a strong sense of oneness with nature. −0.0150.6750.0170.1240.051
I feel a sense of awe from old and large trees.0.134−0.112−0.0460.7550.117
I feel a sense of spirituality when trees are dense.0.175−0.121−0.0480.6650.178
I think there is a God in nature.−0.0390.1750.1020.668−0.215
I feel holy when I go to place with nature.0.0570.189−0.0090.6270.012
It makes me sad to see natural environments destroyed.0.8590.028−0.0340.022−0.032
It makes me sad to think of trees being cleared in the environment.0.7430.2300.0450.000−0.114
I feel sad that nature is diminished for development.0.8400.052−0.027−0.018−0.008
I feel sad when I see garbage scattered in a place rich in nature.0.712−0.178−0.0260.0860.197
The thought of being deep in the woods is frightening.0.0440.0510.718−0.025−0.006
I do not like going into nature because my shoes and clothes get dirty.−0.0770.0290.807−0.002−0.019
I do not like places with a lot of nature because they are unclean.−0.1290.1560.802−0.036−0.089
I do not like places with a lot of trees and flowers because they are full of insects.0.175−0.2930.7200.0210.179
Percentage of the variance explained by the factors0.1400.1380.1180.0960.070
Inter-factor correlations
Care 0.2250.562−0.6800.692
Oneness 0.245−0.1070.325
Aversion −0.6640.546
Mystery −0.651
Note: Values of 0.4 and above are shown in bold.
Table 6. Coefficients of WTP and mean factor scores by image of nature.
WTPMean Scores
CoefficientUrban NatureSuburban NatureArtificial ForestSatoyamaNatural Forest
Number of visits per year to the kind of nature you imagined
0 times (1), 1–2 times (2), 3–10 times (3), 11–20 times (4) 21–40 times (5), 41 or more times (6), almost every day (7)
0.077*2.4412.4952.0482.3952.066
Do you like to see pictures or video images of nature?
Not at all interested (1), Not interested (2), Cannot say either (3), Somewhat like (4), Very much like (5)
0.277**3.1693.4023.3453.4273.478
Do you prefer to buy wood products?
Do not like (1), Do not like much (2), Cannot say either (3) Buy somewhat preferably (4), Buy preferably (5)
0.259**3.0513.2013.2383.1123.123
Care
(factor score)
0.506**−0.814−0.532−0.3510.0560.070
Oneness
(factor score)
0.460**0.2110.1170.2260.093−0.080
Aversion
(factor score)
−0.423**0.0980.0410.0610.038−0.031
Mystery
(factor score)
0.386**−0.006−0.1180.030−0.1870.112
Restorativeness
(factor score)
0.253**−0.200−0.246−0.3340.098−0.004
constant5.488**
AIC7254
Mean WTP (Yen) 1462.1601495.5841870.6132593.2202801.283
median WTP (Yen) 1042.2091238.5641279.7961585.5121671.404
N 59194849641802
Note: * and ** indicate significance levels at 5% and 1% respectively.
Table 7. Analysis of variance for WTP.
Dependent Variable: Care
GroupsCountSumAverageVariance
Urban Nature5986,26714622,534,059
Suburban Nature194290,1431496996,166
Satoyama9642,499,86425938,134,973
Artificial Forest84157,13118712,611,579
Natural Forest18025,047,912280110,334,702
Source of VariationSSdfMSFp-valueFcrit
Between Groups430,696,2424107,674,06012.3530.0002.375
Within Groups27,002,772,94030988,716,195
Total27,433,469,1823102
Publisher’s Note: MDPI stays neutral with regard to jurisdictional claims in published maps and institutional affiliations.

