Article

Farmer Perceptions of Agricultural Risks; Which Risk Attributes Matter Most for Men and Women

1
Development Economics Group, Wageningen University & Research, 6706 KN Wageningen, The Netherlands
2
International Center for Tropical Agriculture (CIAT), Nairobi P.O. Box 823-00621, Kenya
*
Author to whom correspondence should be addressed.
Sustainability 2021, 13(23), 12978; https://doi.org/10.3390/su132312978
Submission received: 22 October 2021 / Revised: 14 November 2021 / Accepted: 17 November 2021 / Published: 23 November 2021
(This article belongs to the Section Sustainable Agriculture)

Abstract

:
Analysis of farmer risk perceptions is usually limited to production risks, with risk perception as a function of likelihood and severity. Such an approach is limited in the context of the many risks and other important risk attributes. Our analysis of the risk perceptions of farmers extends beyond production risks, severity of the risks, and their likelihoods. We first characterize agricultural risks and identify their main sources and consequences. We then analyze risk perceptions as a hierarchical construct using partial least squares path modelling. We determine the most important risks and risk attributes in the perceptions of farmers, and test for differences in the perceptions between men and women. Results show that severity and ability to prevent a risk are most important in forming risk perceptions. Second, probabilities (ability to prevent) tend to matter more to men (women) for some risks; lastly, low crop yields and fluctuating input prices have greater total effects on the overall risk perception. Our results provide an impetus for risk analysis in agriculture to consider risk attributes that cause affective reactions such as severity and perceived ability to prevent the risks, the need for input price stabilization, and redress of the rampart yield gaps in small-scale agriculture.

1. Introduction

The role of risk and uncertainty perceptions on the decisions of small-scale farmers is increasingly acknowledged [1,2]. However, the lens through which perceptions of risk and uncertainty are addressed in agriculture is blurry in several ways. There are three issues that deserve consideration for a more comprehensive understanding of the risk perceptions and behavior of farmers.
First, risk and uncertainty are conventionally addressed as functions of probabilities, where, according to Knight [3], the former is associated with known probabilities while the latter is associated with unknown probabilities. In classical economics, expected utility theory—which dominates the literature on decision-making under risk—considers risk as a product of likelihood and stakes (magnitude), where choice is a result of the assessment by an individual of the magnitude and likelihood of an event [4]. However, the empirical literature shows that individuals do not always follow the tenets of expected utility in making decisions under risk [5], especially in the absence of insights about objective probabilities such as in the case of small-scale farmers in developing countries. In addition, in some cases, even with probabilities, individuals may portray probability insensitivity [4], while in other cases the probabilities may be less important [6]. Such evidence warrants extending risk and risk perception analysis beyond likelihood and stakes, which are just a fraction of the risk attributes.
Second, most research on risk in agriculture focuses on production risks, yet farmers face several other types of risks. Komarek et al. [7] characterize risk into five types, namely production, market, financial, institutional, and personal. These risks are interlinked with each other in the sense that some risks may cause some others, while others reinforce each other as shown in the analysis by Ansah et al. [8]. This interlinked nature of agricultural risks complicates both the analysis and the design of risk management tools for farmers. Methodologies that can disentangle the complex nomological networks of risks, risk sources, and risk attributes are needed to enhance the understanding of agricultural risk and, ultimately, management.
Third, each risk is associated with several attributes, either objective or subjective. The attributes (characteristics) include controllability, voluntariness, degree of uncertainty, and catastrophic potential [9], as well as the consequences, familiarity and sources of the risk [10]. According to the psychometric paradigm of risk analysis, the attributes of risk influence risk perceptions [11]. For this reason, people have as many risk perceptions as there are risks, contexts, and situations around them. Notwithstanding, the current analysis of attributes of the many risks in agriculture, and their role in shaping the risk perceptions of farmers, is limited.
The objective of this paper is to shed more light on the concept of risk and uncertainty from the perspective of a small-scale farmer in a developing country, considering the issues discussed above. A small-scale farmer in our case farms on less than two acres of land [12], produces mostly for subsistence with minimal use of inputs such as fertilizer and certified seeds, and has a dominance of family labor in running their farm operations. A better understanding of the risk perceptions of these farmers is important for informing the appropriate design of risk management tools relevant to them in building their adaptive capacity and resilience. Our work builds on Weber et al. [13], who show that the attitude of an individual towards risk differs across various risk domains; hence, the need to assess the specific risk attitudes and perceptions in the concrete context of the small-scale farmer that is characterized by many simultaneous risks and risk domains. We also build on Wilson et al. [6], who tackle important confounding issues in the study of risk perceptions. Most importantly, the authors argue that risk is multi-dimensional, and such multi-dimensionality calls for approaches that go beyond consideration of just likelihood of, and exposure to, risks. We follow this approach and model risk perceptions as a hierarchical construct. Specifically, we seek to assess how multiple risks, risk attributes, and risk domains interact to shape the risk perceptions of farmers.
To achieve this objective, our concept of risk encompasses all dimensions given by Hardaker [14], namely risk as the variation in an outcome of interest, probability of unwanted outcomes, and uncertainty of outcomes. In this sense, ‘risk’ entails both risk and uncertainty. Our use of risk to also include uncertainty is further justifiable in our context given two additional reasons. First, our subjects, namely small-scale farmers in a developing country, do not differentiate between the two concepts since they use the same term in their local dialect to mean both risk and uncertainty; second, most farmers do not have objective probabilities for most of the events related to agriculture. Instead, the farmers impute subjective probabilities (Important to note is the difference between probability weighting and subjective probabilities. Weighted probabilities are surrogates of objective probabilities, while subjective probabilities are probability substitutes, which form individually where there are no objective probabilities). The substitution of objective probabilities, which are usually weighted in actual decision-making [15], with subjective probabilities blurs the intuitive difference between the concepts of risk and uncertainty.
Our analysis is divided into two distinct but related parts. In the first part, we provide a characterization of the risks experienced by the farmers. We adopt the characterization of risk by Komarek et al. [7] that divides agricultural risks into five main types, which we call domains. We add a sixth domain, namely consumption risks, based on evidence from Ethiopia regarding its role in technology adoption [16].
We proceed by mapping out the main sources, severity, perceived ability to prevent (cope with), and the main consequences of every risk in each of the six domains. For the purposes of discussion, we report findings for the most problematic (important) risks only. Importance in this case is based on a ranking of the risks performed by the farmers themselves during the survey we conducted. Details about the other risks are given in the Appendix A.
In the second part of the paper, we use 435 respondents to assess the most important risks and the most important risk attributes contributing to risk perceptions of farmers, using a partial least squares structural equation modelling approach (PLS-SEM). We focus on three problematic risks, namely low crop production, fluctuating input prices, and reduction in agricultural incomes, as discussed in detail in the subsequent sections. It is noteworthy that all farmers included in this second part of our analysis have experienced the three risks in the previous five years from the time we conducted our survey.

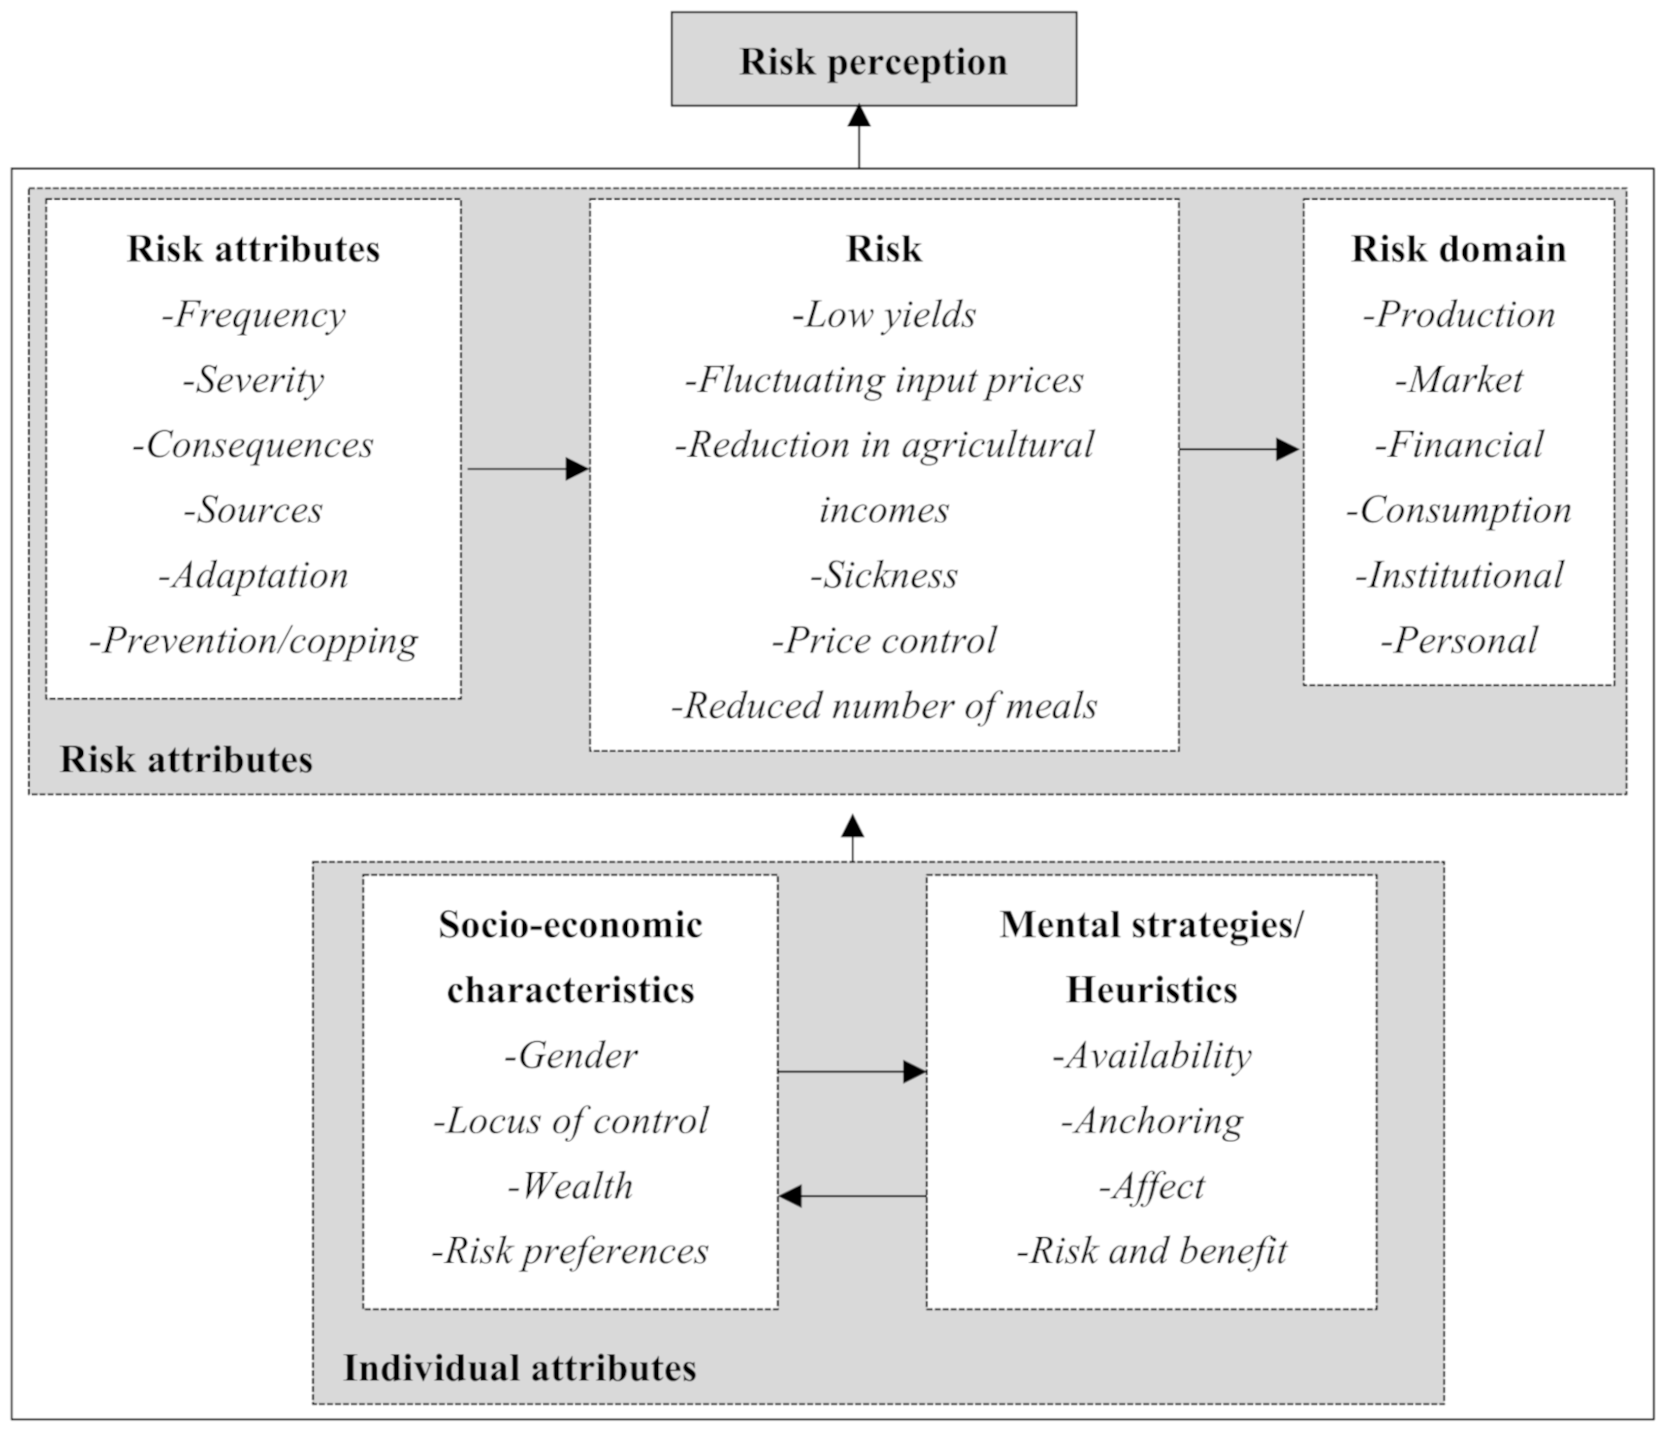
2. Theoretical Framework

Risk perceptions, which refer to how individuals relate, collect, select, and interpret signals about uncertain impacts of events, activities, or technologies [17], are influenced by three broad factors, namely individual characteristics, risk attributes [18,19], and trust in communicating institutions [20]. Individual characteristics such as gender, age, education, and wealth, as well as other innate attributes, create the lens through which a person assesses various risks and the attributes of them.
Based on the three broad factors, four main approaches, namely attribution (attention and selection filters), heuristics and biases, psychometrics and semantic images, and cultural theory of risk, dominate the literature [21] (p. 346). In this study, we take an integrative approach that entails the first three approaches in order to address the issues we have highlighted in earlier sections. Such an integrated approach has been suggested by Renn and Rohrmann [22].
In our context, the three approaches represent three stages of the process of forming a risk perception. The attribution approach, which represents the final stage in our case, assumes that the choices of individuals are based on the perceived impact of an event regardless of the probabilities of the event. Following this framework, farmers are likely to worry about risks and risk attributes that invoke affect, as we discuss in the following paragraphs. The psychometrics and heuristics approaches are intricately intertwined. The psychometrics approach relates to how individuals assess various risk attributes, while the heuristics approach entails the cognitive processes (biases) involved in assessing the risk attributes. The integrated approach perfectly fits our construct of risk perception that starts from individual attributes (heuristics and biases), which are the lenses through which individuals assess risks and risk attributes (psychometric), and finally to the overall perception (attribution) of whether a risk or risk attribute is of importance in the order outlined in Figure 1.
Two main ontologies explain how individuals assess (perceive) risk and associated risk attributes, namely risk as a “feeling”, and risk as an “analysis” [23]. Risk as a feeling, advanced by Loewenstein et al. [4], involves emotion, intuition, and instinctive reactions to uncertain events. Risk as analysis, in contrast, involves logic and reason. Unlike in a risk as feeling assessment, individuals systematically and objectively process information about a risk in the “analysis”. Theoretically, since some risk situations may be greatly consequential, individuals should be more objective about how they assess situations and properly act either to cope/prevent the risk from happening or to avoid it. However, evidence shows that risk as feeling tends to override the risk analysis in actual decision-making [11]. Two related theories on cognitive processing, namely the experiential and rational modes developed by Epstein [24], as well as System 1 and System 2 developed by Kahneman [25], explain the dominance of risk as feeling in actual decision-making. The experiential mode (System 1) operates automatically, is more rapid, encodes reality in concrete metaphors and narratives, and is mediated by past experience, while the rational mode (System 2) devotes effort to more complex computations. System 1 originates impressions, ideas, and feelings, which form the blueprints for the judgment of System 2 [25]. System 2 uses various mental strategies and heuristics in reducing complex information to manageable levels.
Reduction of the complex risk environment depends on the degree to which the mental strategies or heuristics of an individual provide readily accessible and coherent beliefs about certain risks. In the language of Lindell and Perry [18], when someone has a certain schema (heuristic)—a generic knowledge structure defined by instances, attributes that differentiate these instances, and interrelationships among the attributes—beliefs about a risk encompassed by that schema are rapidly accessed to produce an overall judgement that is congruent with the available information about the risk situation. Some of the heuristics discussed in the literature include the availability heuristic, anchoring, and the affect heuristic. The availability heuristic refers to the tendency of people assessing events based on the ease with which instances or occurrences are easily recalled [26]. Anchoring refers to the tendency of people making estimates from a certain reference that is adjusted to give a final answer. For example, people are likely to use historic probabilities to make judgments about future likelihoods of risks, or historic input prices to infer to possible prices in the future. Lastly, the affect heuristic involves the instinctive and intuitive reactions to risk [4].
Our framework is also built on the philosophy that the diverse socio-economic environments and diverse psychological states of farmers will result in heterogenous risk perceptions even when we consider the same risks and set of risk attributes. Such heterogeneity is likely to be observed not only across individuals, but also across risks and risk domains for the same individual. Some studies have already shown differences in risk perceptions across groups such as men and women [11]. Noteworthy is that although our analysis does not explicitly consider individual attributes except for gender, we control for them in an extra stage of analysis using a multiple linear regression. We find that the individual characteristics explain less than 10% of the variation in risk perception, hence we do not discuss the results of this final stage here (see Table A6 for details).
Given the above background, we test the following hypotheses non-parametrically:
Hypothesis 1.
Risks under the production domain are not the most important to the farmer.
Most of the research and risk management work is focused on the production domain [7]. However, not only is there insufficient evidence to support such a narrow focus, but also insufficient evidence on which specific risks under the production domain matter most. In addition, we hypothesize that other risks in other domains might be even more important to the farmer. We, therefore, first characterize different risks to assess which is the most important in each risk domain; second, we use structural equations to determine the most important risk across domains.
Hypothesis 2.
Historic and future frequencies of risks are not the most important risk attributes to the perception of risks by the farmer.
Though risks are associated with several attributes, many studies measure risk perceptions as the product of probability and magnitude [6]. Such an approach is limited in agriculture since agricultural risks are associated with many other attributes such as controllability, ability to prevent the risk, consequences, and sources. The risks are also likely to be interlinked. For example, a weather shock may result in low yields, which in turn will result in a reduction in agricultural incomes. Therefore, whether the frequencies matter in how farmers perceive the risks in this complex environment is non-trivial. We are not aware of any studies that empirically assess the role of other risk attributes, other than probabilities in forming the risk perceptions of farmers.
Hypothesis 3.
There are no statistically significant differences in the perception of risk attributes and the risks themselves between men and women.
Many differences between men and women influence the uptake and choice of risk management strategies. For example, several studies have documented differences in risk attitudes and perceptions between men and women [27]. However, it is not clear from the literature how male and female farmers value risk attributes, and whether their perceptions of relationships across risk attributes and the risks are different. We hypothesize that there are no statistically significant differences between men and women when it comes to perception of various risk attributes and relationships across them.

3. Definition of Concepts

Risk Attributes, Risk Sources, and Consequences

Under the psychometric paradigm of risk analysis, risk attributes play an important role in influencing risk perceptions [11]. A taxonomy of risk and risk attributes exists in the literature [28]. The qualitative attributes, which include risk sources, consequences, severity, and ability to control [10], relate to how an individual assesses self (feelings and emotions) with respect to the risk. Such an assessment will depend on how clear the various risks and their attributes are understood by the individual.
A challenge arises in the context of agricultural risks, since the taxonomy of risk and attributes, such as sources and consequences, is not straightforward. There seems to be no clear distinction of risks, their sources, and consequences in the literature. For example, Komarek et al. [7] identify the broad risk categories, namely production, market, financial, personal, and institutional, as risk types. Duong et al. [29] and Harwood et al. [30] identify them as risk sources. Though there is no empirical evidence of the extent to which such arbitrary taxonomy may limit understanding and management of the risks by farmers, there is a likelihood of such a limitation, not only on the side of farmers but also for other stakeholders in agricultural risk management. Nevertheless, it is not our goal to disentangle these issues in this paper. However, for the sake of maintaining clarity, we endeavor to explain our use of the terms risk type (risk domain), risk sources, and consequences.
With regard to risk sources, we consider first- and second-level sources. For instance, in cases where a weather-related hazard causes low crop yields, and the low crop yields in turn cause a reduction in agricultural incomes, the weather-related hazards and low crop yields are first- and second-level sources of reduction in agricultural incomes, respectively. The final implication of the risk on any aspect of the life of a farmer forms the consequence. Noteworthy is that some outcomes (consequences), such as reduction in agricultural incomes, are considered as risks as well. Following the classification we have outlined, we briefly discuss the risks and their attributes in the subsequent paragraphs.
Production risks entail all risks relating to the production stage. Therefore, risks relating to quality of inputs, farm equipment, produce at the field, and produce off the field (post-harvest) all fall under the production category. Risk sources in the production domain will include weather-related shocks, pests and diseases, and input quality.
Market risks relate to all risks entailing acquisition of the inputs and marketing of produce. The risks include fluctuating prices and poor access to markets (in cases of physical markets). Sources of market risks include information asymmetries and weather shocks. Favorable weather may, for instance, cause an upside risk, which in turn will cause gluts in the markets that result in low output prices.
Financial risks relate to all risks entailing financing of farm operations, and sources include variation in wage rates, interest rates, and access to credit. Current COVID-19 restrictions can be considered as additional sources of financial risks.
Institutional risks include risks relating to formal and informal laws and regulations in the agricultural sector, such as tenure security, price controls (or lack of them), and export or import tariffs. Regulations on land use and policies on, for instance, irrigation are all considered institutional risks.
We incorporate consumption risk based on evidence from Ethiopia about the role of consumption risk in technology adoption [16]. Though consumption risk in the mentioned paper relates more to its financial meaning regarding the uncertainties associated with investing in something in expectation of higher returns in the future instead of current consumption, we use the term to relate more to food security since food expenditure constitutes the largest portion of household expenditure in Kenya. Consumption risks include reduced number of meals, reduced quantities of food, food contamination, and food lacking sufficient nutrients. Some of the sources of consumption risk include climate hazards and volatility of food prices.
Lastly, personal risks relate to the health and social problems of an individual, which affect farm operations. Some of the personal risks include illness, death, and divorce.

4. Materials and Methods

4.1. Study Site

We used survey data collected from four sub-counties of Machakos County in Kenya, namely Machakos Central, Yatta, Kathiani and Mwala. Machakos County is one of the arid and semi-arid counties of Kenya. Farming in the county is largely small-scale; average farm sizes are below 2 acres [31]. Production, which is mostly subsistence, is characterized by low use of inputs such as fertilizers and certified seeds. In addition, family labor is the most dominant source of labor for the farms.
Although agriculture is the main economic activity in the county, the sector is vulnerable to many shocks including climate shocks, especially droughts and dry spells. The county has two rain seasons: the October and December short rains, and the March and May long rains. The short rains season is the most important for crops. The county receives about 500 mm to 1250 mm of rainfall annually, with disparities in temporal distribution. The studied sub-counties were purposively selected to have a representation of the variation in rainfall as well as the agricultural activities for the county and the whole country in general. On one hand, the Mwala and Yatta sub-counties, where livestock production is dominant, are very dry. The two sub-counties usually receive less than 500 mm of rainfall annually. On the other hand, Machakos Central and Kathiani are wet sub-counties most suitable for crop production.

4.2. Sampling

We surveyed 792 farmers in November and December of 2020. Important to note is that we needed a minimum of 768 participants from our sample size calculations assuming a 5% margin of error, a confidence interval of 95%, and a 50-50 distribution of men and women in the population. Participants were randomly selected. The random selection was systematic in the sense that we did random walks skipping at least three households to the next participant. The starting point was a point agreed upon with the local village administration heads, who were our contacts at the village level. The willingness of farmers to participate in the survey and their availability also determined the number of households skipped until the next participant as well as the starting points. For each of the households, we interviewed the household head, or the person who made agricultural decisions if it was not the household head. Figure 2 shows a map of the study area and the geo-positioning system (GPS) points of the sampled farmers.

4.3. Empirical Approach

Each of the farmers was asked several questions on socio-economic characteristics (individual attributes) and risk attributes, as we discuss below. We chose the attributes based on direct or indirect relevance to risk perceptions.

4.3.1. Individual and Farm Characteristics

The individual and farm characteristics that we focused on are: sources of capital for financing farming, household information (household size, education level, age, and employment), welfare and wealth status (asset counts, household dietary diversity, annual expenditure, and satisfaction with life), non-cognitive skills (locus of control), whether directly affected by COVID-19, reported propensity to take risks, and risk preferences.

4.3.2. Dietary Diversity

Dietary diversity was measured using the 24 h recall questions adopted from the Food and Agriculture Organization [32]. The final dietary diversity score is obtained by summing up the number of food groups the respondent consumed. The score ranges from 0 to 12. Individuals with higher values are considered to have a higher dietary diversity. Dietary diversity is of relevance in risk perceptions especially for the consumption domain.

4.3.3. Locus of Control

We adopt the brief scale, by Rotter, in measuring the locus of control of the farmer [33], but also incorporate 5 more items to make a total of 11 items (Appendix A). Locus of control is the extent to which people believe that the outcome and circumstances around them are creations of their choices and decisions [34]. According to this scale, individuals either have an internal locus of control in that they believe that they control their lives and circumstances, or an external locus of control in that they believe that their lives and circumstances are controlled by strong others. We determine the locus of control score by first reverse-coding the negatively phrased items, and then finding the difference between the sums of the positively phrased items and those of the negatively phrased items. In this sense, a higher score means that the individual has an internal locus of control, and vice versa. Locus of control has been found to vary with factors that influence differences in risk perceptions, such as gender and age [35].

4.3.4. Risk Aversion

We adopt the approach by Tanaka et al. [36] to measure risk aversion. Following this approach, farmers responded to 28 hypothetical questions (Series 1 and Series 2, each having 14 questions) involving small monetary stakes (Appendix B). We asked the farmer to choose either Option A or Option B for each of the questions in Series 1 and 2. The farmers were allowed to switch only once between Option A and Option B in each series. The risk game was incentive-compatible, since farmers played for real money in the last round of the risk game. We use the switching points from Series 1 and Series 2 to obtain probability weights and risk aversion measures as estimated by Tanaka et al. [36] (Noteworthy is that our stakes were in Kenyan Shillings. Therefore, we factored the stakes in Tanaka et al. ( 2014) [36] by three to make them decently comparable in value to the Vietnamese Dong. In this analysis, we assume that such factoring will not have an impact on the risk parameters), who use prospect theory. In prospect theory, value is attached to changes in wealth and not the final asset position, as in expected utility theory. We assume a piecewise power function and the probability weighting function by Prelec [37]. The values of σ and α for every possible switching point are provided in Table A2.
Table 1 and Table 2 provide a summary of the characteristics of our respondents based on the variables outlined above. We note that men tend to register higher scores that are significantly different from those of women regarding annual household expenditures, asset count, locus of control, and propensity to take risks. There tends to be no difference across the sub-counties, except for Machakos sub-county, which is statistically significantly different from the other sub-counties regarding life satisfaction, reported propensity to take risks, and average household size (Table 1). Regarding other characteristics, farming is the main economic activity for about 73% of our sample, many of whom finance farm activities from either their own savings or income from the previous season. Many of the respondents tend to have a primary or secondary level education, and about 57% of the sample reported to have been directly affected by COVID-19.

4.3.5. Perceptions of Risk Attributes

The bulk of the questions were dedicated to assessing risk perceptions of the farmer. Assessing risk perceptions entailed asking farmers questions about several risk attributes for every risk in each domain. The risk attribute questions were asked only if the farmer mentioned having experienced the risk. The risk attributes we focused on were historic and future return frequencies of the risk, severity of the risk, the perceived ability of the farmer to prevent the risk, the number of sources of the risk, the number of consequences caused by the risk, and whether the farmer did anything to adapt to the risk. Table 3 provides a summary of the risk attributes and how they were measured.

4.4. Measurement and Analysis of Risk Perceptions

Measuring risk perceptions is as elusive as the concept of risk itself [38]. The diverse definitions of risk are associated with specific measurement strategies. However, even though there is no single unified measure of risk perception [39], most studies measure risk perception as a unidimensional multiplicative function of likelihood and severity [6], with the assumption that individuals are objective when assessing risk. The studies use Likert-scale items for the two variables, and data reduction through factor analysis or principal components analysis. Such a unidimensional view of risk perception can be limited on several accounts. The most important account is about how individuals make judgements under uncertainty as we discuss in our theoretical framework. Emotional and experiential assessment of risk through mental strategies such as the affect heuristic, availability heuristic, optimism, and unrealistic optimism tend to dominate over objective, logical, and intellectual assessment [24,25,40]. Therefore, a measure considering probabilities and magnitude only is not reliable. The second account is on the interlinked nature of agricultural risks. Some of the risks have common sources and consequences, while some other risks cause or reinforce each other. The nomological network of the risks, sources, and consequences may mask or amplify some risk attributes. Our estimation strategy extends the analysis beyond just probabilities and magnitude, to consider the inter-connectedness of the risks we study. Though contexts are different, our estimation strategy is comparable to that of Wilson et al. [6], who use confirmatory factor analysis to assess risk perception as a multidimensional construct. We use partial least squares path modelling for the reasons explained below.
PLS SEM is a variance-based multivariate analysis approach. Unlike the covariance based approach (CB-SEM) that seeks to increase covariance of the items of a common factor, PLS-SEM seeks to reduce unexplained variance of a construct using ordinary least squares as the estimation method [41]. PLS-SEM is appropriate in our analysis because of the following reasons. First, our concept of risk entails a nomological network of risk attributes and risks in different domains. Second, we do not want to assume that our data achieves the requirements such as multivariate normality necessary for other estimation methods such as CB-SEM; lastly, PLS-SEM supports estimation of formative constructs. Studies such as Burns et al. [42] recommend the use of partial least squares in analysis of risk perceptions.
The PLS-SEM model is composed of measurement (outer) and structural (inner) models. The measurement model is the interaction of manifest variables with the constructs that they explain. The structural model is the interaction between the various constructs.

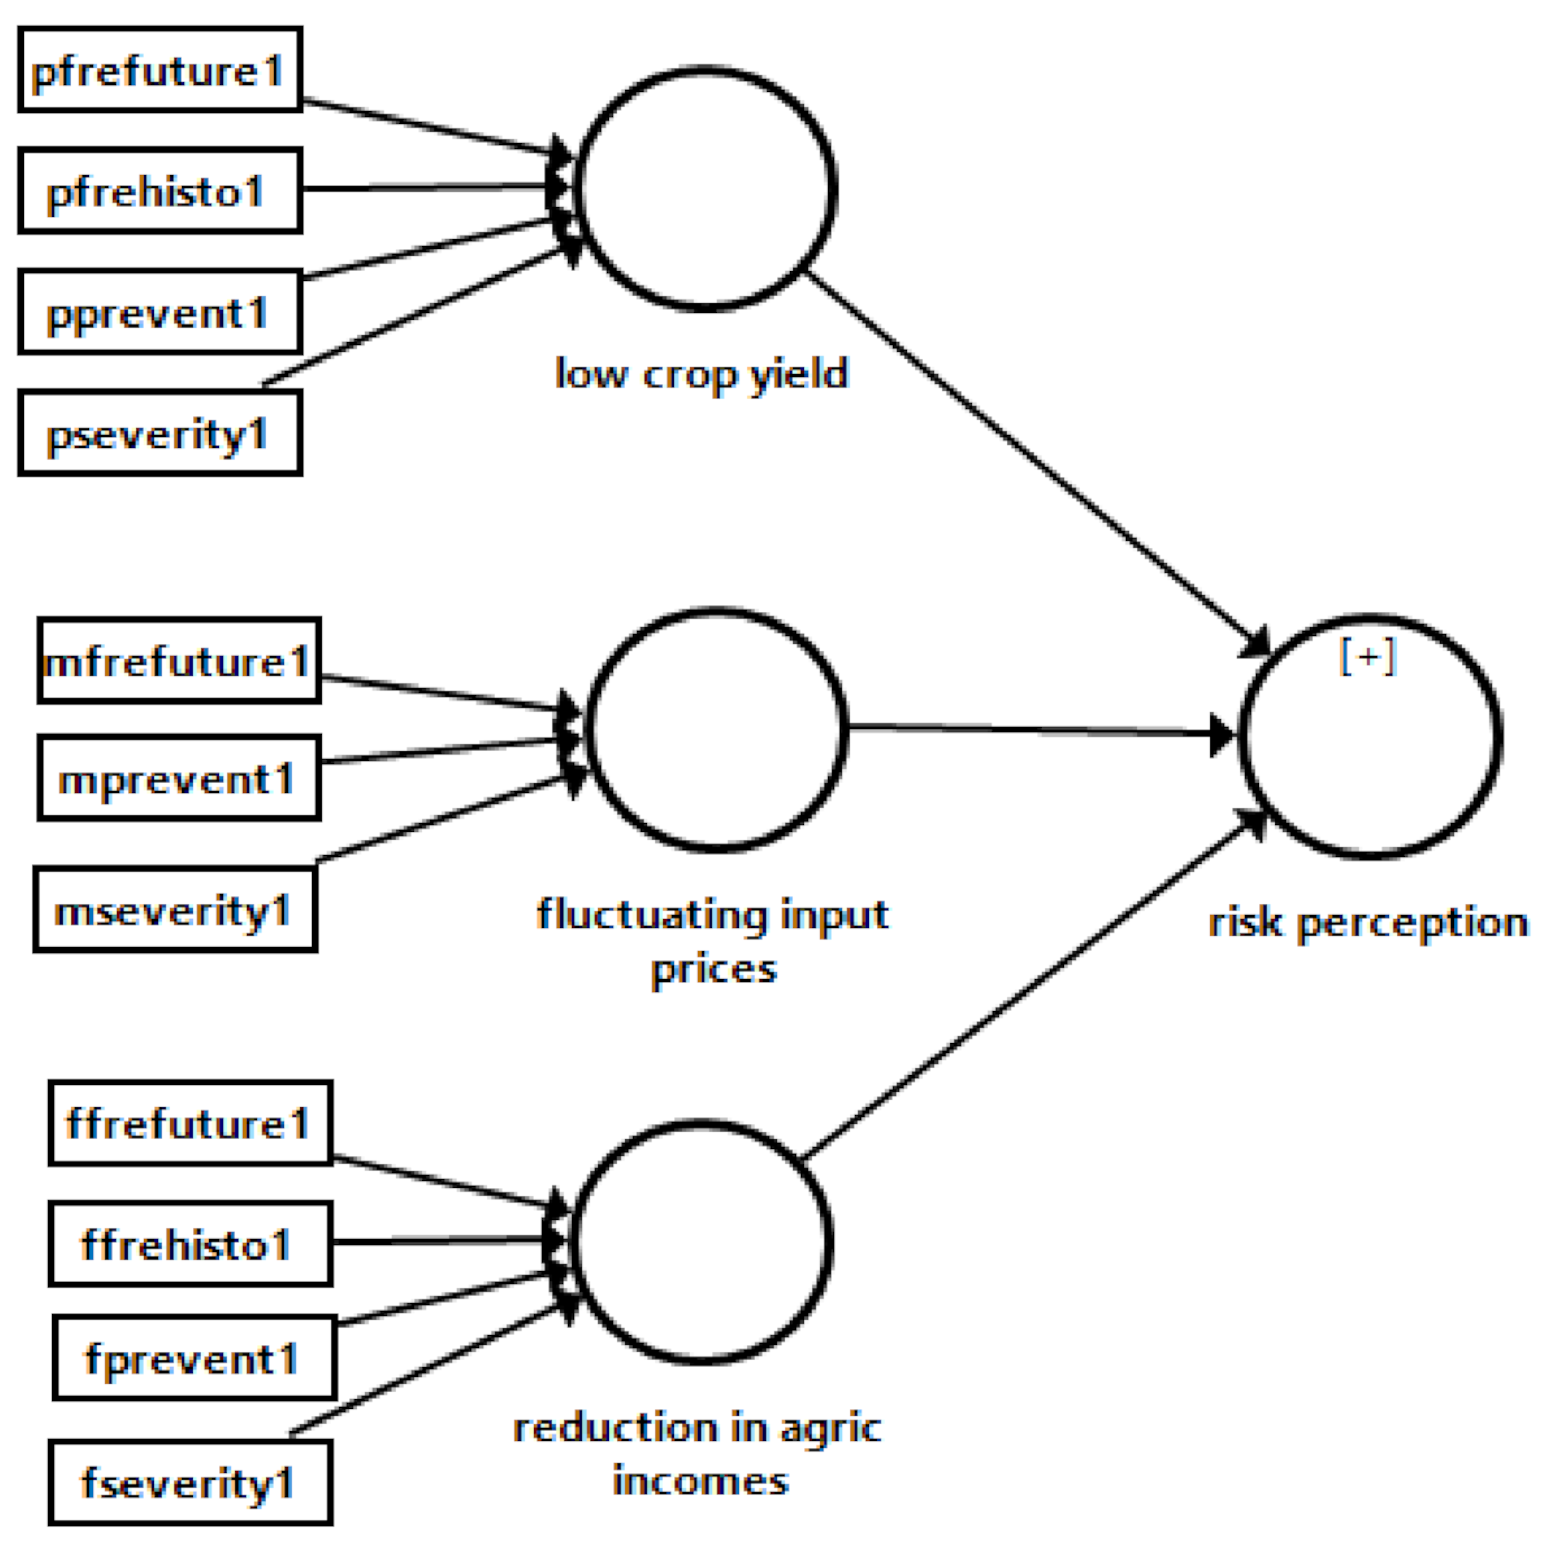
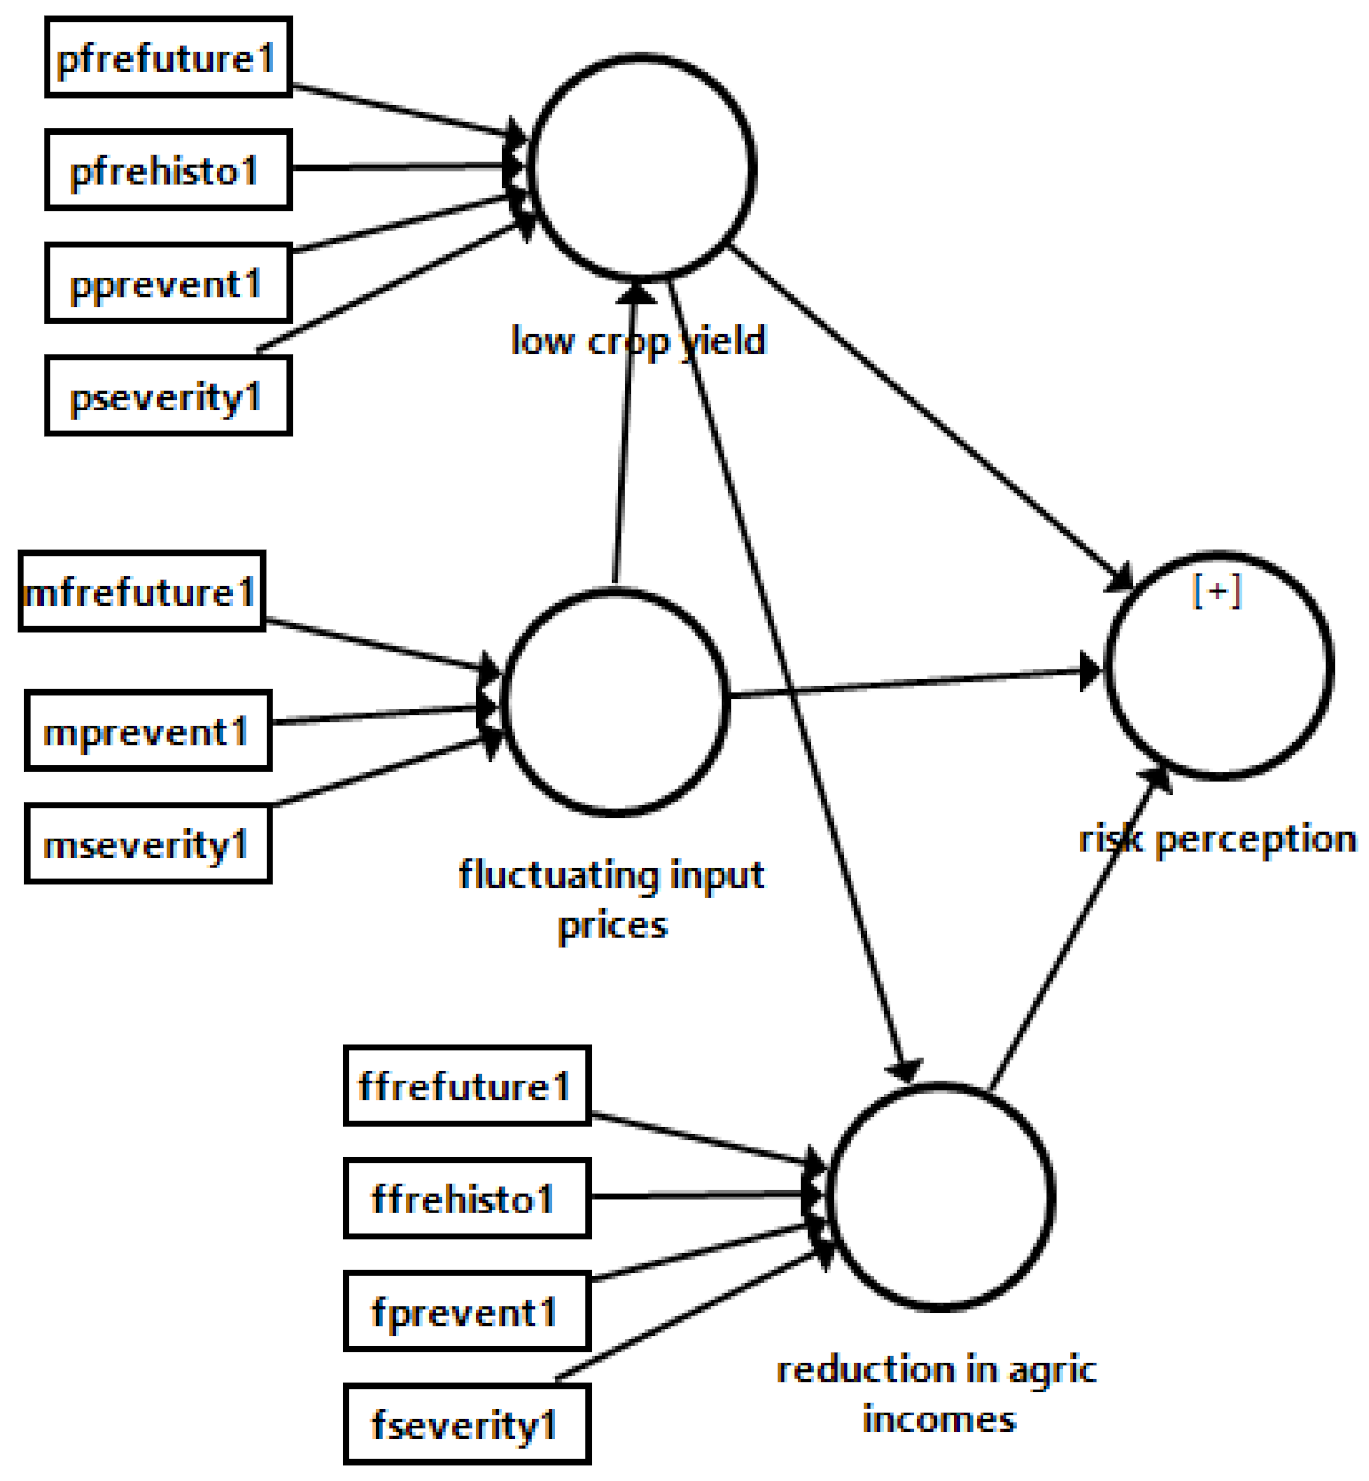
4.4.1. Measurement Model

Our measurement model consists of the risk attributes and the important risks. Though our manifest variables are the same (Table 3), based on our assumption described in previous sections, we consider the attributes for each risk as different variables. These attributes explain low crop yields, fluctuating input prices, and reduction in agricultural incomes, which are our formative lower-level constructs. Noteworthy is that only the manifest variables that have sufficient weights, and/or significant outer and inner loadings, are included in the final model.

4.4.2. Structural Model

The lower-level constructs interact to explain the overall risk perception, which is our higher-level construct. The structural model is also formative, in the sense that all the lower constructs point to the higher-level risk perception construct. Based on our findings from the risk characterization, there is also some mediation among the constructs, i.e., some risks are sources of other risks. For example, fluctuations in input prices cause low crop yields, while low crop yields cause a reduction in agricultural incomes (see Figure 1).

4.4.3. Estimation

We use SmartPLS 3 in the PLS SEM modelling. Our analysis focuses on three of the six most frequently cited problematic risks, namely low crop yields, fluctuating input prices, and reduction in agricultural incomes, which represent the production, market, and financial domains, respectively. All the farmers included in this analysis have experienced all the risks in the past five years from the time of data collection; hence, our sample reduces from 792 to 435. The objective of the path modelling is to determine the most important risk attribute(s) and the most important risk(s), as perceived by farmers. We use the weights from the measurement model as proxies for importance of risk attributes, and the path coefficients (structural model) as proxies for importance of the three risks in forming risk perceptions.
We consider two models in this analysis to represent two different perspectives of risk by the farmer (Figure 3 and Figure 4).
In Model 1, we assume no interaction across risks (i.e., the farmer evaluates the risks in isolation), while in Model 2 we consider interactions. The interactions and their directions are informed by the findings from the characterization in the first part of the paper (Figure 5).
Based on findings from the characterization, low crop yields cause a reduction in agricultural incomes and fluctuating input prices cause low crop yields. In this sense, fluctuating input prices cause a reduction in agricultural incomes through reduced crop yields, as shown in Figure 3. ([+] means there are hidden variables to the construct). Since Model 2 is supported by theory, we use it to test whether there are differences in perceptions between men and women. We use the multiple group analysis (MGA) in smartPLS to test for the differences.
Noteworthy is that before arriving at the models shown above, we first estimated models with all the risk attributes in Table 3. We use the results from the first step to eliminate risk attributes that do not significantly explain our risk perception composite according to the requirements for partial least squares path modelling [43]. Manifest variables in the model should have outer weights greater than 0.7, otherwise be significant, possess significant loadings, or otherwise be at least 0.5 if not significant [44]. Since we are estimating a formative model, the focus is on the outer weights and collinearity among manifest variables. Collinearity among indicators should have a variance inflation factor (VIF) of less than three (Important to note is that for formative models, model checks such as construct reliability and average variance explained are not relevant [44]). The two models we estimate achieve all these criteria. Table A5 provides the results from the test for collinearity.
We use a repeated indicator approach in the estimation. The repeated indicator approach is one of the two approaches used to model higher order composites. The approach has the advantage of considering the entire nomological network hence reducing loss of information compared to its counterpart two stage approach [45]. Our PLS SEM algorithm entails a path weighting scheme. Though the available weighting schemes yield almost similar results, the path weighting scheme is recommended [41].

5. Results

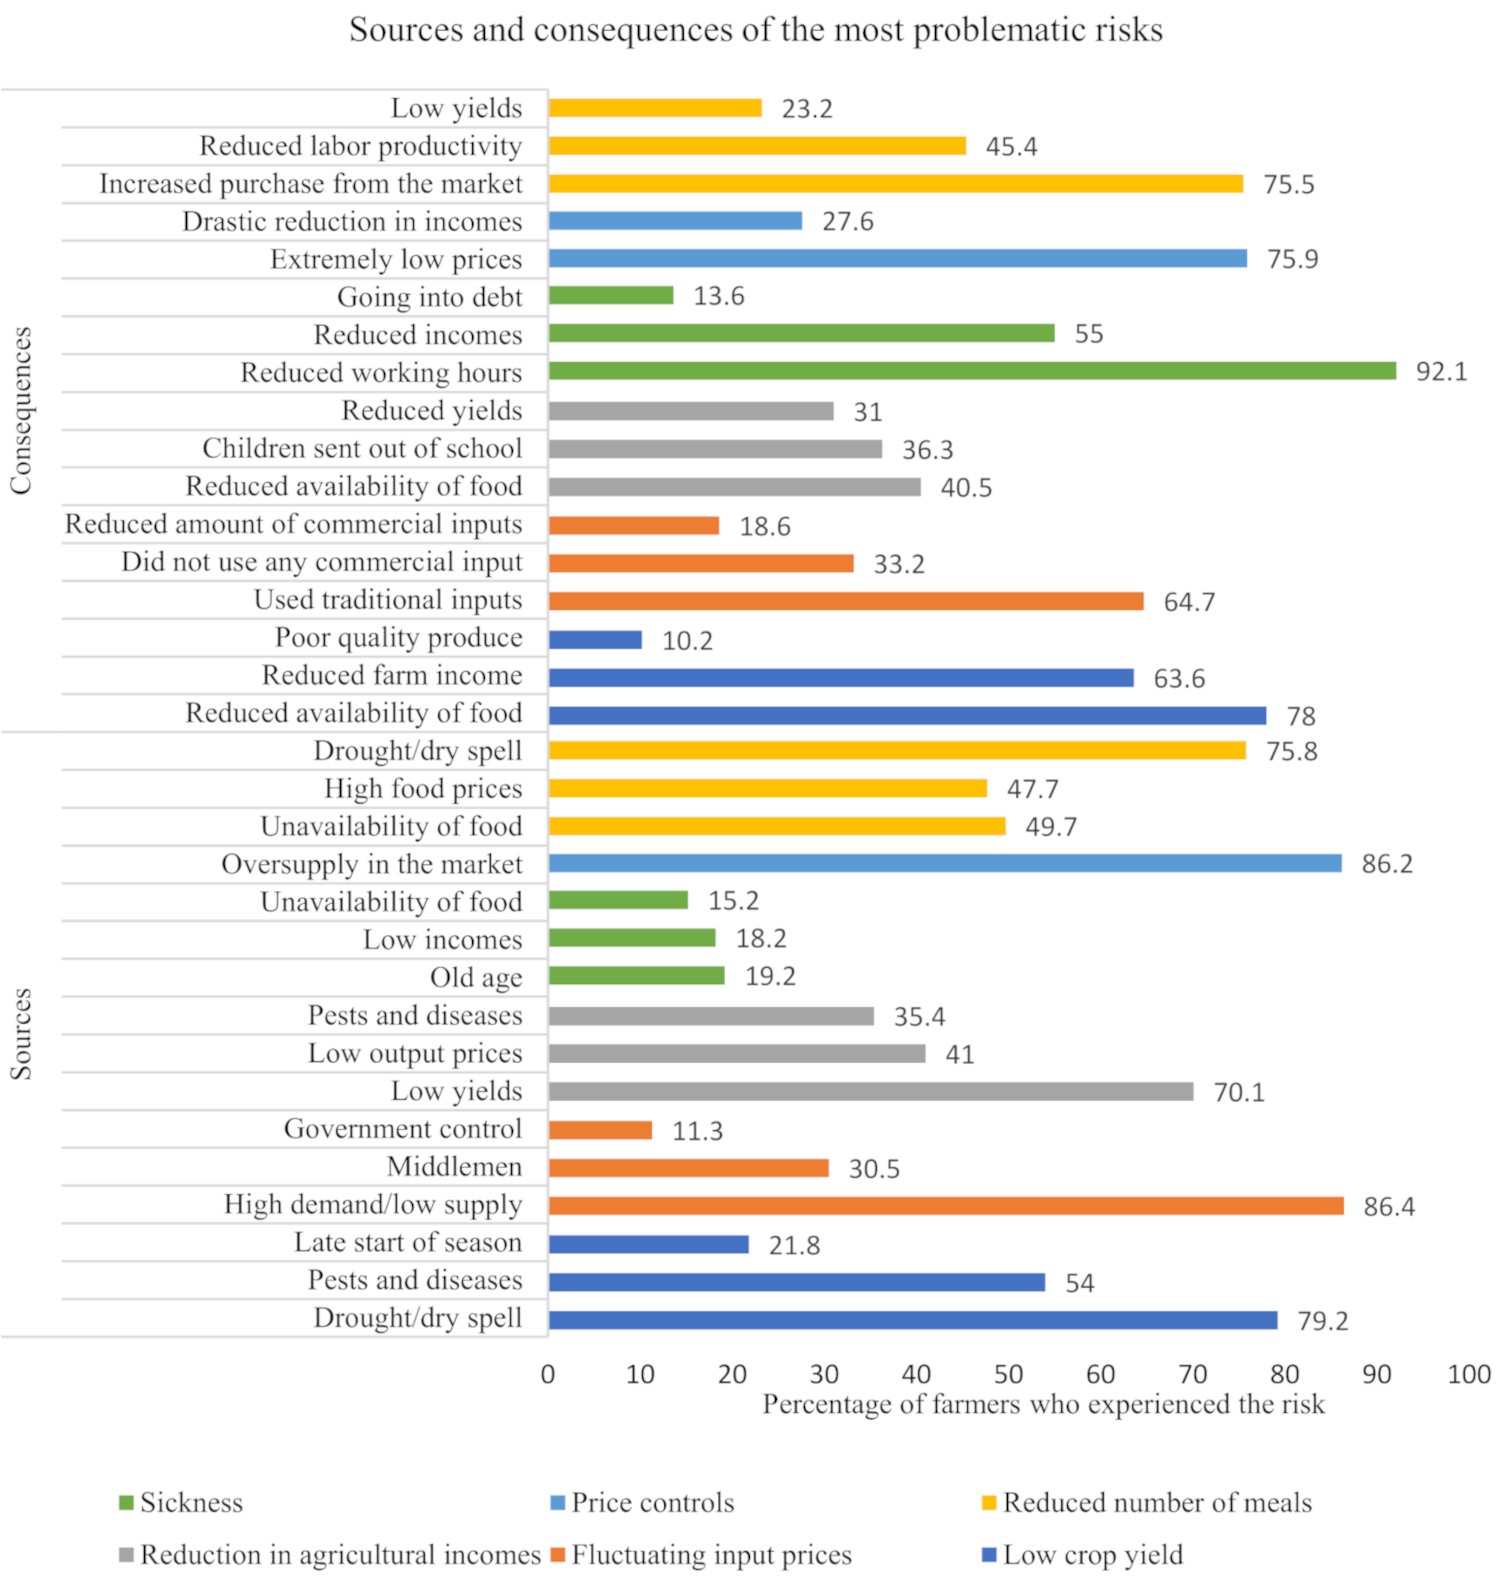
5.1. Risk Characterization: Most Problematic Risk, Main Sources, and Consequences

In this section, we provide results for the most problematic risks in each of the six domains (see Table A3 and Table A4 for more details) (Important to note is that the most (least) frequently mentioned is not necessarily the most (least) problematic). Low crop yields, fluctuating input prices, reduction of agricultural incomes, sickness, price controls, and reduced number of meals were the most frequently mentioned problematic risks in production, market, financial, personal, institutional, and consumption domains. Table 4 provides a summary of the risks focusing on the assessment by farmers of the severity of risks, ability to prevent (cope with) the risk, and why the risks were rated as most problematic. The figures represent percentages of the total number of farmers who experienced the respective risks.
The results show that though most of the farmers are not at the extremes when it comes to rating the risks, more than half of those who experienced the risks rated the risks as severe, very severe, or extremely severe. More than half also reported that they were just able, unable, or extremely unable to prevent (cope with) the risks. Low crop yields was by far the most frequently mentioned production risk by farmers, and more than half of the farmers rated it as most problematic.
The results also show that consequences of a risk affecting most aspects of the farmer and those affecting all members of the household were the most frequently cited criteria for classifying a risk as most problematic.
Regarding risk sources, weather related shocks as well as pests and diseases are the main causes of low crop yields. Drought was the most frequently mentioned source (about 79% of all the farmers who experienced low crop yields) (Figure 5). The most frequently mentioned consequences of low crop yields were reduced availability of food (78% of the farmers), and reduction of agricultural incomes (63% of the farmers). Regarding market risks, the most frequently mentioned cause of fluctuations in input prices was high demand and low supply in the market. Consequently, about 64% of the farmers who experienced fluctuations in input prices mentioned that they used traditional inputs as a result. Noteworthy is that for the case of market risks, fluctuating input prices was selected as the most problematic even though fluctuations in output prices was the most frequently mentioned market problem (see Appendix D for details).
For the case of reductions in agricultural incomes, low yields, low output prices, and pests and diseases were the main sources. The most frequently mentioned (70% of the farmers) was low crop yields. Reduced availability of food, children sent out of school, and low crop yields were identified as the main consequences of reduction in agricultural incomes. Sickness, old age, low incomes, and unavailability of food were identified as the main causes. The main consequences of sickness were reduced working hours, reduced incomes, and going into debt. In this regard, a shock in incomes is likely to have a double effect on households that are experiencing sickness.
Regarding institutional risks, price controls (or the lack thereof) was the most problematic. The risk applies mostly to output prices since oversupply in the market was identified as the main cause. Consequently, farmers end up selling at extremely low prices. Lastly, regarding reduced number of meals, drought/dry spell, unavailability of food, and high food prices were identified as the main sources, while increased purchases from the market, reduced labor productivity, and low crop yields were identified as the main consequences.
A critical evaluation of the risks, main sources, and consequences shows how interconnected the risks, risk sources, and consequences are. For example, drought directly causes low crop yields and reduced number of meals, indirectly. Low crop yields result in a reduction in agricultural incomes that in turn cause a reduction in availability of food. Reduced availability of food (reduced number of meals) in turn is among the main causes of sickness and low crop yields. Sickness in turn causes a reduction in agricultural incomes. The cycle continues. It therefore becomes evident that though we only consider a limited number of risks, tracing the whole cycle of risks, their sources, and consequences is a non-trivial task that presents a “chicken” and “egg” situation. Such a complex interconnection of risks, risk sources, and consequences requires a bundle of risk management strategies to effectively manage the risks.

5.2. Determination of Important Risk Attributes through Partial Least Squares Path Modelling

We now turn to determining the most important risk attributes and risk (Hypothesis 2). The results from the path modelling show no difference between Model 1 and Model 2 (Table 5). All the indicators included significantly explain both the lower and higher constructs at 1%, albeit with weak associations (i.e., the weights are less than 0.3). Both models show that perceived ability to prevent a risk from happening or cope with it and its severity have the strongest effect on perception of the three risks and the overall risk perception. However, the similarities in the outer weights notwithstanding, there are differences in path coefficients for the two models, as shown in Table 6. For Model 1, the path coefficients for the three risks are comparable, with reduction in agricultural incomes having a slightly greater contribution to the overall risk perception. Model 2, on the other hand, shows that low crop yields and fluctuating input prices have bigger total effects following the direct and indirect effects on the overall risk perception.

5.3. Determination of Differences in Perceptions between Men and Women

Lastly, we address the third hypothesis by testing for differences in perceptions of both the weights of risk attributes and path coefficients between men and women. This test is motivated by the statistically significant differences we found in some of the variables likely to influence the risk perceptions highlighted in Table 1. We find that men tend to give a larger weight for historic frequencies for the case of reduction in agricultural incomes, while women tend to place a greater weight on perceived ability to prevent reduction in agricultural incomes. These differences between the two groups are statistically significant at 5%. We also find a significant difference at 10% in the weights for historic probabilities for the case of low crop yields. Similar to reduction in agricultural incomes, men tend to have on average a bigger weight. Table 7 provides more details on these findings. We do not find any significant statistical difference in the path coefficients for both groups. However, we find a significant difference at 5% in the total effects of fluctuating input prices on the overall risk perception. Women tend to have bigger weights on average compared to men (Table 8).

6. Discussion

Our risk analysis entails characterization of agricultural risks, determination of risk attributes that matter in forming the risk perception of a small-scale farmer, and testing whether there are differences in the perceptions between men and women. Results from the risk characterization show that indeed small-scale farmers face many important risks across the different risk domains, as has been highlighted in many studies already. Low crop yield is the most frequent (in terms of mentions) risk among the farmers, and is the most problematic in the production domain. Fluctuating input prices, reduction in agricultural incomes, price controls (and lack thereof), reduced number of meals, and sickness are the most problematic in the market, financial, institutional, consumption and personal risk domains. We find that risks that affect many aspects of the life of the farmer as an individual, and those that affect many household members, are deemed the most problematic. Return frequencies of the risks had the least mentions by farmers as the main criterion for ranking a risk as most problematic. These two findings point to the possibility of dominance of the affect heuristic in risk assessment among farmers. Intuitively, farmers are more likely to take action against risks that invoke affect.
We also identify main sources and main consequences of the risks in the characterization. We find that other than sources such as climate-related shocks, including drought and dry spells, farmers know that some risks cause other risks. For example, farmers are aware of the role of low crop yields in reducing agricultural incomes as well as the role of fluctuating input prices on low yields and, ultimately, low incomes. This is an interesting finding, since we can infer from it the pathways for adaptation and risk management that the farmer thinks are relevant. For example, the problem of low farm incomes can be addressed through addressing factors that cause low crop yields (weather-related factors and pests and diseases) and fluctuating input prices (seasonality in demand and government controls or lack of them). Consumption, or income smoothing, should be used when all available pathways have been exhausted. These results further provide empirical evidence on the importance of multiple risks assessment in the context of small-scale farmers. The need to assess multiple risks in agriculture becomes more elaborate when we compare Model 1 and Model 2. From the comparison, we find that considering the links from one risk to another shifts the importance of various risks as perceived by the farmer. We find that, independently, reduction of agricultural incomes has a relatively bigger contribution to forming the risk perceptions of farmers. However, Model 2, which incorporates the interconnectedness of the risks, shows that low crop yields and fluctuating input prices tend to be more important when we consider total effects. Therefore, effective management of the risks will entail offering farmers a wide range of risk management strategies, through well-coordinated networks of government agencies, market actors, and the farmers themselves [46].
Analysis of risk attributes and their importance in forming risk perceptions shows that, first, both historic and future probabilities of risks, perceived ability to prevent a risk, and severity of the risk significantly influence the risk perception of a farmer. Though our findings are in tandem with theory and the literature, when it comes to probabilities and severity of a risk [20,47], we find that perceived ability to prevent (cope with) has the biggest weight; hence, it is the most important in forming the risk perceptions of farmers. Other studies have also found probabilities to be less critical in the way individuals assess risks [6,48]. Our results are plausible when we view risks as either catastrophic or normal [21]. Though catastrophic risks are less frequent, they can be more detrimental than the more frequent risks. In this case, consideration of probabilities might be misleading when rating the importance of a risk. Consequently, in the context of small-scale farmers, consideration of attributes that invoke affective reactions, such as the ability to control a risk when designing risk management mechanisms, is likely to increase the relevance of such strategies to the farmer. Special attention should be given to those risks that the farmer has dismal control over (involuntary), or ability to cope with them. However, of importance is also filtering for the tolerance levels of the farmers to various risks when considering ability to prevent risks. High tolerance to a risk may give a false impression of high ability to control the risk (cope with it). High risk tolerance is likely to keep farmers in risk-induced poverty traps [49]. Our results also have implications on risk communication. Since risk perception is usually considered a function of probability and severity, most risk communication is in terms of these two attributes. A good example in agriculture involves weather-related agri-advisories, which are usually communicated in terms of probabilities. Farmers are likely to perceive such information as less useful. As such, risk information that aims to nudge farmers to take precautionary measures should be packaged and synthesized around the severity and involuntary nature of the risks.
Second, the data supports our initial hypothesis that risk attributes, such as return frequencies that may be considered objective, are interpreted differently by farmers in the same geographical location with almost similar “objective” exposure to the risks. Interpretations of the attributes depend on the risk and the gender of the individual as we discuss in subsequent sections. Such high heterogeneity poses a challenge when it comes to prioritizing adaptation options for certain groups of people or even regions. Though participatory and co-creation approaches can be used to reconcile varied perceptions, effort should be put towards addressing behavioral factors that cause biases in the perception of risks. The biases may inhibit the adoption of effective risk management strategies by farmers.
Further analysis of the risk attributes shows that the four risk attributes consistently, and significantly, influence perceptions for low crop yields and reduction in agricultural incomes. However, historic probabilities tend to matter less (have small weights) for the case of fluctuating input prices. Therefore, our data does not support the notion that a certain set of risk attributes can fully generalize the concept of risk across many risks, such as in the case of agriculture. Similar to our first finding, considering all risks as a function of probability and severity may be misleading.
Third, we find some differences in the risk perceptions between men and women, as already shown in some studies [50]. We find that historic probabilities tend to matter more to men compared to women when we consider reduction in agricultural incomes and low crop yields, while the ability to prevent a risk tends to matter more to women compared to men when it comes to reduction in agricultural incomes. Both the similarities and differences are justifiable, as discussed by Gustafson [51]. The similarities point to the possibility of both groups employing the same strategies in understanding the risks around them. The differences point to the possibility of one group having higher sensitivity to affect, different exposure to the risks, or more knowledge and awareness about a risk and associated attributes, or a combination of all three of those factors. In our context, we attribute the differences first to the level of knowledge and understanding of the risk attributes where men are likely to have more understanding of probabilities than women, and second to the differences we find in wealth status (annual expenditure and asset count), locus of control, and propensity to take risks. Scores for men tend to be significantly higher than those for women. Poor scores, especially in terms of wealth status among women, may also mean more exposure to risk relative to men.

Limitations of the Study

The contribution of our study to the knowledge on risk perceptions among small-scale farmers is evident. However, we need to point out some limitations of this study. First, we consider the entire farm enterprise, making our scope wide instead of focusing on a particular enterprise, crop, or livestock. Notwithstanding, studies with a wide scope such as this one are useful in informing more focused studies. We recommend the use of the approach we have used for specific farm enterprises. Second, there is a likelihood that the attributes of the risks are also linked to each other, in the sense that the ability to prevent, for instance, low crop yield correlates with the ability to prevent fluctuations in input prices or reduction of agricultural incomes. Future research should also consider this interconnectedness of the risk attributes. Lastly, though the goal of this paper is to inform the design of risk management tools relevant to small-scale farmers, we do not extend the analysis to assess the effect of the perceptions on selection and the use of various risk management strategies. Future studies should fill this knowledge gap.

7. Conclusions

In this paper, we have addressed three issues that challenge analysis of risk perceptions in agriculture to enhance understanding of the risk perceptions of small-scale farmers. A clear understanding of the risk perceptions by farmers is paramount for effective support in managing the risks. We achieved our objective by first characterizing agricultural risks, and then using an integrative approach to analyze the risk perceptions. We extend the analysis beyond risks in the production domain. We also consider other risk attributes on top of severity and likelihood of the risks.
Our qualitative assessment of risk perceptions across the six risk domains highlights the most problematic risks that matter to the farmer, namely low crop yields, fluctuating input prices, reduction in agricultural incomes, reduced number of meals, price controls (or the lack thereof), and sickness. Though the risks are interlinked with regard to sources and consequences, no single strategy can simultaneously address all of them. Therefore, bundling risk management strategies is imperative in effectively addressing the risks. Future studies should test this claim and identify an optimal mix of risk management strategies that simultaneously address the risks. Noteworthy is that the most problematic risks are those that affect many aspects of the life of the farmer and many members of the household.
Findings from the PLS SEM modelling have shown that though likelihood of a risk, severity, and the perceived ability to prevent or cope with the risk significantly affect farmer risk perceptions, the perceived ability of farmers to prevent a risk is the most important (has the biggest weight) for all three risks we consider. Probabilities are the least important. This finding has implications for risk perceptions research. Future studies on farmer risk perceptions should give more attention to risk attributes that invoke affective reactions such as severity and ability to prevent or cope with a risk. Such attention is lacking in the current literature. Another implication of this finding is for risk communication. We use the example of weather-related advisories and forecasts. Since risk is usually considered a function of severity and probabilities, most weather advisories are communicated in terms of probabilities. Therefore, packaging weather agri-advisories around other risk attributes (especially that affect invoking) may be a good way of enhancing relevance and usability of the forecasts and other risk information by the farmers to plan their farming activities.
Our results have also shown that neglecting the interlinkages across risks may misguide risk prioritization. Considered independently, reduction in agricultural incomes is relatively more important. However, fluctuating input prices and low crop yields tend to be more important when we consider total effects on the risk perceptions. Therefore, mechanisms that stabilize input prices and those that address the problem of low yields should be addressed first. Stabilization of input prices is likely to enhance the uptake of technologies such as fertilizers and improved (certified) varieties, ultimately addressing the problem of low farm incomes.
Lastly, we find some differences in the perceptions of the risk attributes and the linkages across risks between men and women when it comes to perceived ability to control or cope with a risk. We attribute this difference to wealth status, locus of control, and reported propensity to take risks. As such, disparities in access to resources between men and women might be an important issue to consider when designing risk management tools that target women.

Author Contributions

Conceptualization, data curation, formal analysis, and original draft preparation, J.O.; methodology, R.R.; conceptualization, supervision, review, and editing, E.G.; conceptualization, funding acquisition, review, and editing. All authors have read and agreed to the published version of the manuscript.

Funding

This research is funded by the European Commission as part of its support to AR4D and is administered by the International Fund for Agricultural Development (IFAD) and the CGIAR Research Program on Climate Change, Agriculture and Food Security (CCAFS).

Institutional Review Board Statement

The study was conducted according to the guidelines of the Declaration of Helsinki, and approved by the Institutional Review Board of the Alliance of Bioversity International and CIAT (IRB number 2020-IRB36, approved on 25 November 2020).

Informed Consent Statement

Informed consent was obtained from all subjects involved in the study.

Data Availability Statement

The data presented in this study are available on request from the corresponding author.

Conflicts of Interest

The authors declare no conflict of interest.

Appendix A

Appendix A.1. Indicators of Locus of Control

These questions are based on a 5-point scale from strongly disagree (1) to strongly agree (5) (1 = Strongly agree; 2 = Agree; 3 = Not sure; 4 = Disagree; 5 = Strongly disagree). Select one for each of the questions.

Appendix A.1.1. Internal Items (Self-Drive, Motivation, Belief That We Can Change Our Circumstances)

  • When I make plans, I am almost certain that I can make them work;
  • What happens to me is my own doing;
  • Getting people to do the right things depends on ability; luck has nothing to do with it;
  • When I work hard, I get rewards;
  • I have the needed knowledge and skills to make my life better;
  • If I plan myself well, I can avoid many unpleasant outcomes, now and in the future.

Appendix A.1.2. External Items (Wellbeing Is Controlled by Some Strong Other)

7.
Many of the unhappy things in people’s lives are partly due to bad luck;
8.
Getting a good job depends on mainly on being in the right place at the right time;
9.
Many times, I feel that I have little influence over the things that happen to me;
10.
Whatever you do, if things are to go wrong, they will go wrong;
11.
The yields I get from agriculture at the end of the season are beyond my control.

Appendix A.2. Indicators of General Satisfaction with Life

Indicate for each of the following questions whether you: 1 = Strongly agree; 2 = Agree; 3 = Not sure; 4 = Disagree; 5 = Strongly disagree
  • I am satisfied with my life;
  • I have achieved all the goals/dreams I wanted to achieve in life;
  • I am working to my best to see that I improve the quality of my life;
  • I am satisfied with my social relations (including my family);
  • I am satisfied with the material things that I have now;
  • Every morning, I look forward to a good day ahead;
  • I have suffered a lot in this life;
  • I live a life of poverty;
  • I have access to nutritious food.

Appendix A.3. Reported Propensity to Take Risks

  • How likely are you to take risks (1 = very likely; 2 = likely; 3 = Not sure; 4 = unlikely; 5 = very unlikely);
  • How likely can (do) you adopt new agricultural technologies that you have never used before (1 = very likely; 2 = likely; 3 = Not sure; 4 = unlikely; 5 = very unlikely);
  • I like learning about something, see results from other people, before I can try that thing (1 = Strongly agree; 2 = Agree; 3 = Not sure; 4 = Disagree; 5 = Strongly disagree).

Appendix B

Appendix B.1. Risk Game

Appendix B.1.1. Instructions

We are going to play a game that involves money. Your earnings will depend partly on your choice and partly on chance. There are 3 series of questions. Series 1 consists of 14 questions, Series 2 consists of 14 questions, and Series 3 consists of 7 questions. In total, we have 35 questions. We will offer you two plans; plan A and plan B. you are required to choose a plan for each of the questions. Once you finish answering the questions, we will offer you a bag containing 35 balls with numbers 1 to 35. You are required to select a ball from the bag. We will then play the selected question for real money. For example, if you choose ball number 10, we will play question number 10 for real money.
Table A1. Payouts for the risk game.
Series 1Series 2
Option AOption BOption AOption B
#Balls 1–3Balls 4–10#Ball 1Balls 4–10#Balls 1–9Ball 10#Balls 1–7Balls 8–10
112030120415112090116215
212030222515212090216815
312030324915312090317415
412030427915412090418015
512030531815512090518615
612030637515612090619515
712030745015712090720415
812030855515812090821615
912030966015912090923115
1012030109001510120901024915
11120301112001511120901127015
12120301218001512120901230015
13120301330001513120901333015
14120301451001514120901439015
Table A2. Risk aversion and probability weights estimates.
σSwitching Question in Series 1
Series 21234567891011121314Never
11.501.401.351.251.151.101.000.950.900.850.800.750.650.550.50
21.401.301.251.151.101.000.950.900.850.800.750.700.600.550.50
31.301.201.151.101.000.950.900.850.800.750.700.650.550.500.45
41.201.151.051.000.950.900.850.800.750.700.650.600.500.450.40
51.151.051.000.950.900.850.800.750.700.650.600.550.500.400.35
61.051.000.950.900.850.800.750.700.650.600.550.500.450.400.35
71.000.950.900.850.800.750.700.650.600.550.500.450.400.350.30
80.950.900.850.800.750.700.650.600.550.500.450.400.350.300.25
90.900.850.800.750.700.650.600.550.500.450.400.350.300.250.20
100.850.800.750.700.650.600.550.500.450.400.350.300.250.200.20
110.800.700.650.650.600.550.500.450.400.350.300.250.200.150.15
120.750.650.600.550.500.500.450.400.350.300.250.200.200.150.10
130.650.600.550.500.450.450.400.350.300.250.200.150.150.100.10
140.600.550.500.450.400.350.350.300.250.200.150.100.100.100.05
Never0.500.450.400.400.350.300.300.250.200.150.100.100.050.050.05
αSwitching Question in Series 1
Series 21234567891011121314Never
10.600.750.750.850.900.951.001.051.101.151.201.251.301.401.45
20.600.700.750.800.850.900.951.001.051.101.151.201.251.351.40
30.550.600.700.750.800.850.900.951.001.051.101.151.201.251.30
40.500.600.650.700.750.800.850.900.951.001.051.101.151.201.25
50.450.550.600.650.700.750.800.850.900.951.001.051.101.151.20
60.450.500.550.600.650.700.750.800.850.900.951.001.051.101.15
70.400.450.500.550.600.650.700.750.800.850.900.951.001.051.10
80.350.400.450.500.550.600.650.700.750.800.850.900.951.001.05
90.300.350.400.450.500.550.600.650.700.750.800.850.900.951.00
100.250.300.350.400.450.500.550.600.650.700.750.800.850.900.95
110.200.250.300.350.400.450.500.550.600.650.700.750.800.850.90
120.150.200.250.300.350.400.450.500.550.600.650.700.750.800.85
130.100.150.200.250.300.350.400.450.500.550.600.650.700.750.80
140.050.100.150.200.250.300.350.400.450.500.550.600.650.700.75
Never0.050.050.100.150.200.250.300.350.400.450.450.550.550.650.60

Appendix C

Table A3. Risks experienced by farmers (percentages).
DomainRiskTotalGenderSub County
n = 792Male
n = 327
Female
n = 465
Kathiani
n = 187
Machakos
n = 178
Mwala
n = 193
Yatta
n = 234
ProductionLow crop yields95.393.696.695.293.893.897.9
Death of livestock47.742.551.444.449.441.554.3
Lack of fertilizer28.026.928.840.616.926.427.8
Post-harvest loss24.522.026.224.616.323.831.2
Reseeding/replanting23.120.524.917.133.124.918.8
Poor germination22.019.623.715.524.220.726.5
Lack of water18.122.015.310.230.310.920.9
Low animal production13.416.211.47.016.913.515.8
Poor quality produce10.411.99.211.219.15.27.3
Pests and diseases4.23.74.51.1 2.111.5
Equipment breakdown3.94.33.70.511.81.03.0
Lack of seeds0.80.60.91.6 0.50.9
FinancialReduction in agricultural incomes69.613.110.315.59.612.49.0
Reduction in daily wages15.72.82.63.22.24.11.3
Inability to replay loan11.5 0.9 1.10.50.4
Increase in interest rates2.715.615.714.47.316.122.6
Reduction in non-agricultural income0.573.766.775.962.970.568.8
MarketFluctuating output prices72.975.571.078.157.379.874.8
Fluctuating input prices50.146.852.550.350.048.751.3
Fluctuating interest rates1.10.91.3 1.13.10.4
Lack of markets1.10.91.31.1 2.11.3
ConsumptionReduced quantities of food38.138.837.638.039.937.837.2
Reduced number of meals33.733.933.531.043.336.826.1
Lack of a balanced diet21.523.520.020.316.325.922.6
Food contamination3.23.13.24.33.44.11.3
Food lacking necessary nutrients2.53.41.92.15.61.61.3
InstitutionalImportation of cheaper produce11.112.510.18.619.710.96.8
Price controls3.74.03.40.512.41.01.7
Tenure security3.44.92.43.77.91.61.3
COVID-19-related restrictions1.51.51.51.11.11.62.1
High export tariff0.92.1 2.7 0.9
Breach of contract farming agreement0.40.60.21.1 0.4
Lack of price control0.30.6 0.5 0.5
PersonalSickness38.137.038.936.442.738.935.5
Traffic accident4.86.43.75.94.52.66.0
Divorce1.31.21.30.52.81.00.9
Death of family member0.4 0.60.50.6 0.4
Land disputes0.6 1.11.10.60.50.4
Other accidents0.40.60.20.51.1
Domestic conflicts0.1 0.2 0.6
Table A4. Most problematic risks (percentage of farmers).
DomainRisk GenderSub-County
TotalMaleFemaleKathianiMachakosMwalaYatta
ProductionLow crop production56.556.356.657.256.358.054.7
Low animal production16.818.016.016.618.219.713.7
Reseeding/replanting13.713.513.816.610.214.013.7
Equipment breakdown5.35.55.23.76.33.67.3
Poor germination4.12.85.03.74.51.66.0
Death of livestock2.02.41.70.52.82.12.6
Post-harvest loss0.60.30.90.51.1 0.9
Lack of seeds0.40.30.4 0.50.9
Pest and diseases0.30.6 0.5 0.5
Poor quality produce0.30.30.20.50.6
Lack of water0.1 0.2 0.4
FinancialReduction in agricultural incomes93.293.692.995.893.190.893.1
Increase in interest rates5.76.05.52.45.48.66.4
Inability to repay loan0.50.40.51.8
Reduction in non-agricultural incomes0.6 1.1 1.50.60.5
MarketFluctuating input prices71.172.670.072.380.166.767.6
Fluctuating output prices27.826.728.527.219.931.031.0
Lack of markets1.10.71.50.6 2.31.4
ConsumptionReduced number of meals79.476.481.574.880.276.685.0
Reduced quantities of food14.416.313.117.414.415.610.9
Food contamination5.66.45.06.15.47.04.1
Food lacking necessary nutrients0.61.00.31.7 0.8
InstitutionalPrice controls87.786.688.981.891.486.786.7
COVID-19-related restrictions5.54.96.26.12.910.06.7
High export tariff3.13.72.53.04.33.3
Breach of contract farming agreement1.82.41.26.1 3.3
Cheap imports0.61.2 1.4
Tenure security0.6 1.2 3.3
Lack of price control0.61.2 3.0

Appendix D

Appendix D.1. Collinearity Test across the Manifest Variables

Table A5. Collinearity test across the manifest variables.
VariableVIF
ffrefuture11.342
ffrefuture11.478
ffrehisto11.339
ffrehisto11.473
fprevent11.112
fprevent11.666
fseverity11.111
fseverity11.42
mfrefuture11.026
mfrefuture11.151
mprevent11.195
mprevent11.572
mseverity11.213
mseverity11.387
pfrefuture11.382
pfrefuture11.509
pfrehisto11.393
pfrehisto11.508
pprevent11.085
pprevent11.502
pseverity11.043
pseverity11.236

Appendix D.2. Regression Analysis of Effect of Variables of Interest on Risk Perceptions

Model diagnostics show that the assumptions for OLS (no multicollinearity, homoscedasticity, normality of the residuals) are achieved by the data.
Table A6. Regression analysis results.
Dependent VariableRisk Perception
Risk aversion−0.313 ***
(0.101)
Dietary diversity0.005
(0.025)
Age0.006
(0.004)
Life satisfaction−0.024 **
(0.01)
Locus of control0.008
(0.009)
Asset count−0.025
(0.016)
factor (Education)20.701
(1.049)
factor (Education)30.344
(0.983)
factor (Education)40.037
(0.984)
factor (Education)50.301
(0.993)
factor (Education)6−0.112
(1.015)
factor (Occupation)20.02
(0.205)
factor (Occupation)3−0.134
(0.212)
factor (Occupation)4−0.103
(0.158)
factor (Occupation)6−0.739
(0.982)
Constant0.149
(1.08)
Observations435
R20.084
Adjusted R20.051
Residual Std. Error0.975 (df = 419)
F Statistic2.569 *** (df = 15; 419)
Note: ** p < 0.05; *** p < 0.01; Figures in brackets are standard errors.

References

  1. Meraner, M.; Finger, R. Risk perceptions, preferences and management strategies: Evidence from a case study using German livestock farmers. J. Risk Res. 2019, 22, 110–135. [Google Scholar] [CrossRef]
  2. Nastis, S.A.; Mattas, K.; Baourakis, G. Understanding farmers’ behavior towards sustainable practices and their perceptions of risk. Sustainability 2019, 11, 1–13. [Google Scholar] [CrossRef] [Green Version]
  3. Knight, F.H. Risk, Uncertainty and Profit; Houghton Mifflin Company: Boston, MA, USA; New York, NY, USA, 1921. [Google Scholar]
  4. Loewenstein, G.F.; Hsee, C.K.; Weber, E.U.; Welch, N. Risk as Feelings. Psychol. Bull. 2001, 127, 267–286. [Google Scholar] [CrossRef] [PubMed]
  5. Dhami, S. The Foundations of Behavioral Economic Analysis, 1st ed.; Oxford University Press: Oxford, UK, 2016. [Google Scholar]
  6. Wilson, R.S.; Zwickle, A.; Walpole, H. Developing a Broadly Applicable Measure of Risk Perception. Risk Anal. 2019, 39, 777–791. [Google Scholar] [CrossRef] [PubMed]
  7. Komarek, A.M.; de Pinto, A.; Smith, V.H. A review of types of risks in agriculture: What we know and what we need to know. Agric. Syst. 2020, 178, 102738. [Google Scholar] [CrossRef]
  8. Ansah, I.G.K.; Gardebroek, C.; Ihle, R. Shock interactions, coping strategy choices and household food security. Clim. Dev. 2020, 13, 414–426. [Google Scholar] [CrossRef]
  9. Martin, W.E.; Martin, I.M.; Kent, B. The role of risk perceptions in the risk mitigation process: The case of wildfire in high risk communities J. Environ. Manag. 2009, 91, 489–498. [Google Scholar] [CrossRef]
  10. Renn, O. Risk Perception and Risk Management. In Proceedings of the 14th Congress of the World Energy Conference, Montreal, QC, Canada, 17–21 September 1989; Volume 2, pp. 1–16. [Google Scholar]
  11. Breakwell, D.G.M. Risk: Social Psychological Perspectives, 2nd ed.; Elsevier: Amsterdam, The Netherlands, 2015. [Google Scholar]
  12. Foresight4Food. Understanding Small-Scale Agriculture. Available online: https://www.foresight4food.net/understanding-small-scale-agriculture/ (accessed on 9 November 2021).
  13. Weber, E.U.; Blais, A.R.; Betz, N.E. A Domain-specific Risk-attitude Scale: Measuring Risk Perceptions and Risk Behaviors. J. Behav. Decis. Mak. 2002, 15, 263–290. [Google Scholar] [CrossRef]
  14. Hardaker, J.B. Some Issues in Dealing with Risk in Agriculture by J Brian Hardaker No. 2000-3—March 2000 Working Paper Series in Agricultural and Resource Economics Some Issues in Dealing with Risk in Agriculture; University of New England: Armidale, NSW, Australia, 2000; Volume 3. [Google Scholar]
  15. Kahneman, D.; Tversky, A. Prospect theory: An analysis of decision under risk. Econometrica 1979, 47, 263–292. [Google Scholar] [CrossRef] [Green Version]
  16. Dercon, S.; Christiaensen, L. Consumption risk, technology adoption and poverty traps: Evidence from Ethiopia. J. Dev. Econ. 2011, 96, 159–173. [Google Scholar] [CrossRef] [Green Version]
  17. Wachinger, G.; Renn, O.; Begg, C.; Kuhlicke, C. The risk perception paradox-implications for governance and communication of natural hazards. Risk Anal. 2013, 33, 1049–1065. [Google Scholar] [CrossRef] [PubMed]
  18. Lindell, M.K.; Perry, R.W. The Protective Action Decision Model: Theoretical Modifications and Additional Evidence. Risk Anal. 2012, 32, 616–632. [Google Scholar] [CrossRef]
  19. Siegrist, M.; Hartmann, C. Consumer acceptance of novel food technologies. Nat. Food 2020, 1, 343–350. [Google Scholar] [CrossRef]
  20. Sullivan-Wiley, K.A.; Gianotti, A.G.S. Risk Perception in a Multi-Hazard Environment. World Dev. 2017, 97, 138–152. [Google Scholar] [CrossRef]
  21. Raue, M.; Lermer, E.; Streicher, B. Psychological perspectives on risk and risk analysis: Theory, models, and applications. In Psychological Perspectives on Risk and Risk Analysis: Theory, Models, and Applications; Springer: Berlin/Heidelberg, Germany, 2018; pp. 1–379. [Google Scholar]
  22. Renn, O.; Rohrmann, B. Cross-Cultural Risk Perception: A Survey of Empirical Studies. Statew. Agric. L. Use Baseline 2015 2000, 13, 242. [Google Scholar]
  23. Slovic, P.; Peters, E. Risk perception and affect. Curr. Dir. Psychol. Sci. 2006, 15, 322–325. [Google Scholar] [CrossRef]
  24. Epstein, S. Integration of the Cognitive and the Psychodynamic Unconscious. Am. Psychol. 1994, 49, 709–724. [Google Scholar] [CrossRef] [PubMed]
  25. Kahneman, D. Thinking, Fast and Slow; Farrar, Straus and Giroux: New York, NY, USA, 2011. [Google Scholar]
  26. Kahneman, D.; Slovic, P.; Tversky, A. Judgment Under Uncertainty: Heuristics and Biases; Cambridge University Press; Press Syndicate of the University of Cambridge: Cambridge, UK; New York, NY, USA, 1982. [Google Scholar]
  27. Cullen, A.C.; Anderson, C.L.; Biscaye, P.; Reynolds, T.W. Variability in Cross-Domain Risk Perception among Smallholder Farmers in Mali by Gender and Other Demographic and Attitudinal Characteristics. Risk Anal. 2018, 38, 1361–1377. [Google Scholar] [CrossRef] [PubMed] [Green Version]
  28. Slovic, P. Risk Perception Paul. Science 1987, 236, 280–285. [Google Scholar] [CrossRef] [PubMed]
  29. Duong, T.T.; Brewer, T.; Luck, J.; Zander, K. A global review of farmers’ perceptions of agricultural risks and risk management strategies. Agriculture 2019, 9, 10. [Google Scholar] [CrossRef] [Green Version]
  30. Harwood, J.; Richard, H.; Coble, K.; Perry, J.; Somwaru, A. Managing Risk in Farming: Concepts, Research, and Analysis. Agric. Econ. Rep. 1999, 774, 125. [Google Scholar]
  31. Machakos County Government. Machakos County Integrated Development Plan II; County Government of Machakos: Machakos, Kenya, 2018. [Google Scholar]
  32. Food and Agriculture Organization. Guidelines for Measuring Household and Individual Dietary Diversity; Food and Agriculture Organization: Rome, Italy, 2010. [Google Scholar]
  33. Lumpkin, J.R. Scale for Survey Research1. Psychol. Rep. 1985, 55, 655–659. [Google Scholar] [CrossRef]
  34. Rotter, J.B. Generalized Expectancies for Internal versus External Control of reinforcement. Psychol. Monogr. Gen. Appl. 1966, 80, 1–28. [Google Scholar] [CrossRef] [Green Version]
  35. Armaş, I.; Cretu, R.Z.; Ionescu, R. Self-efficacy, stress, and locus of control: The psychology of earthquake risk perception in Bucharest, Romania. Int. J. Disaster Risk Reduct. 2017, 22, 71–76. [Google Scholar] [CrossRef]
  36. Tanaka, T.; Camerer, C.F.; Nguyen, Q. American Economic Association Risk and Time Preferences: Linking Experimental and Household Survey Data from Vietnam Author (s). Available online: https://www.jstor.org/stable/27804941 (accessed on 10 November 2019).
  37. Prelec, D. The Probability Weighting Function. Econometrica 1999, 66, 497–527. [Google Scholar] [CrossRef] [Green Version]
  38. Sjöberg, L. The methodology of risk perception research. Qual. Quant. 2000, 34, 407–418. [Google Scholar] [CrossRef]
  39. Van der Linden, S. Determinants and Measurement of Climate Change Risk Perception, Worry, and Concern; Oxford University Press: Oxford, UK, 2017. [Google Scholar]
  40. Paek, H.; Hove, T. Risk perceptions and risk characteristics risk and risk perception: Definitions and dimensions. Oxford Res. Encycl. Commun. 2017, 1–15. [Google Scholar] [CrossRef]
  41. Hair, J.F., Jr.; Hult, G.T.; Ringle, C.; Sarstedt, M. A Primer on Partial Least Squares Structural Equation Modeling (PLS-SEM); SAGE: Thousand Oaks, CA, USA, 2016. [Google Scholar]
  42. Burns, W.J.; Slovic, P.; Kasperson, R.E.; Kasperson, J.X.; Renn, O.; Emani, S. Incorporating Structural Models into Research on the Social Amplification of Risk: Implications for Theory Construction and Decision Making. Risk Anal. 1993, 13, 611–623. [Google Scholar] [CrossRef] [Green Version]
  43. Hair, J.F.; Howard, M.C.; Nitzl, C. Assessing measurement model quality in PLS-SEM using confirmatory composite analysis. J. Bus. Res. 2020, 109, 101–110. [Google Scholar] [CrossRef]
  44. Hair, J.F.; Risher, J.J.; Sarstedt, M.; Ringle, C.M. When to use and how to report the results of PLS-SEM. Eur. Bus. Rev. 2019, 31, 2–24. [Google Scholar] [CrossRef]
  45. Becker, J.M.; Klein, K.; Wetzels, M. Hierarchical Latent Variable Models in PLS-SEM: Guidelines for Using Reflective-Formative Type Models. Long Range Plann. 2012, 45, 359–394. [Google Scholar] [CrossRef]
  46. OECD. Managing Risk in Agriculture: A Holistic Approach; OECD: Paris, France, 2009. [Google Scholar]
  47. van Duinen, R.; Filatova, T.; Geurts, P.; van der Veen, A. Empirical Analysis of Farmers’ Drought Risk Perception: Objective Factors, Personal Circumstances, and Social Influence. Risk Anal. 2015, 35, 741–755. [Google Scholar] [CrossRef] [PubMed]
  48. Renn, O.; Siovic, P.; Burns, W.J.; Kasperson, J.X.; Kasperson, R.E. Social amplification theory: Theoretical foundations and empirical applications. J. Soc. Issues 1992, 48, 127–160. [Google Scholar] [CrossRef]
  49. Azariadis, C.; Stachurski, J. Chapter 5 Poverty Traps. Handb. Econ. Growth 2005, 1, 295–384. [Google Scholar]
  50. Brown, G.D.; Largey, A.; McMullan, C. The impact of gender on risk perception: Implications for EU member states’ national risk assessment processes. Int. J. Disaster Risk Reduct. 2021, 63, 102452. [Google Scholar] [CrossRef]
  51. Gustafson, P.E. Gender differences in risk perception: Theoretical and methodological perspectives. Risk Anal. 1998, 18, 805–811. [Google Scholar] [CrossRef] [PubMed]
Figure 1. Formation of risk perceptions (conceptualization by the authors).
Sustainability 13 12978 g001
Figure 2. Study area and sampled households.
Sustainability 13 12978 g002
Figure 3. Model 1. ([+] means that there are hidden variables to the construct risk perception.)
Sustainability 13 12978 g003
Figure 4. Model 2. ([+] means that there are hidden variables to the construct risk perception.)
Sustainability 13 12978 g004
Figure 5. Sources and consequences of the problematic risks.
Sustainability 13 12978 g005
Table 1. Summary of characteristics of our respondents.
Variable GenderSub-County
TotalMale (a)Female (b)Kathiani (a)Machakos (b)Mwala (c)Yatta (d)
Age51.354.0 b49.351.852.152.449.3
Annual household expenditure (000 shillings)149.7172.4 b133.7144.9172.1143.0141.9
Dietary diversity score11.511.611.411.511.711.211.6
Household size54.95.15.0 b4.15.2 b5.5 b
Asset count6.67.0 b6.36.26.26.67.2 a,b
Risk aversion0.50.50.60.6 b0.40.50.5
Locus of control *8.48.9 b88.28.77.68.9
Life satisfaction score *18.71918.518.620.0 a,c,d18.118.4
Propensity to take risks *4.75.1 b4.54.45.5 a,c,d4.54.5
The letters show significance in statistical difference test of the means at 95% confidence interval. * Locus of control, life satisfaction score, and reported propensity to take risks are constructs. The reliability of these constructs measured by the Cronbach alpha values are 0.61, 0.52, and 0.21. The reliability measure for the propensity to risks is very low, owing to the small number of indicators we used (see Appendix D). However, such a construct is considered relatively better compared to a single item.
Table 2. Farmer characteristics (categorical variables).
Variable GenderSub-County
Total
n = 792
Male
n = 327
Female
n = 465
Kathiani
n = 187
Machakos
n = 178
Mwala
n = 193
Yatta
n = 234
OccupationFarming (crop/livestock)73.279.868.677.075.869.970.9
Employed (Informal)8.57.39.23.29.011.49.8
Employed (Formal sector)6.45.86.96.44.58.86.0
Business11.46.714.612.39.69.813.2
Student0.30.30.2 1.1
None0.3 0.41.1
EducationInformal education0.3 0.41.1
No education1.50.62.20.52.22.60.9
Primary43.835.549.734.842.740.954.3
Secondary39.846.535.148.737.140.933.8
Vocational training11.011.310.813.910.113.07.7
University3.76.11.91.17.92.63.4
Affected by COVID-19Yes57.357.257.468.437.156.564.5
Farming capitalOwn savings56.154.757.044.969.159.152.6
Income from previous season31.734.929.547.616.329.532.5
Borrowing from friends2.32.12.40.56.70.51.7
Borrowing from bank1.52.40.91.62.22.10.4
Borrowing from MFI2.12.81.71.62.82.12.1
Remittances from family2.30.33.73.21.12.62.1
Table banking1.50.62.2 1.72.12.1
Livestock sales2.52.12.80.5 2.16.4
Table 3. Description of risk attributes and how they were measured.
VariableDescription (How the Question Was Asked)Response
Historic frequency (frehisto1 *)How many times has the risk occurred in the last 5 years (10 seasons)Number ranging from 1 to 10
Future frequency (frefuture1)How many times is the risk likely to occur in the next 5 yearsNumber ranging from 1 to 10
Severity (severity1)On a scale of 1 to 5, where 1 is not bad, and 5 is extremely bad, how could you rate this risk5-point Likert
SourcesWhat are the main sources of the riskNumber
ConsequencesWhat are the main consequences of the riskNumber
Ability to prevent (prevent1)On a scale of 1 to 5, where 1 is very able and 5 is not able at all, are you able to prevent (cope with) the risk from happening5-point Likert
Adaptation (adaptation1)Did you do anything to reduce the impact of the riskYes/No
* The names in parenthesis are the short names we adopt for the risk attributes in the second part of the paper (Model 1 and 2).
Table 4. Summary of the most problematic risks from each risk domain (percentage of farmers).
Risk Attribute/RiskLow Crop YieldReduction in Agricultural IncomesFluctuating Input PricesReduced Number of MealsPrice ControlsSickness
M *
n = 307
F
n = 449
M
n = 241
F
n = 310
M
n = 153
F
n = 244
M
n = 127
F
n = 175
M
n = 13
F
n = 16
M
n = 121
F
n = 181
Severity
Not severe4.64.54.65.24.62.97.14.615.412.56.61.1
Moderately severe34.228.132.031.333.325.044.935.438.556.331.427.1
Severe21.827.426.622.320.919.317.328.630.82526.423.2
Very severe24.829.222.428.122.932.820.522.915.4 26.437.6
Extremely severe14.710.914.513.218.320.110.28.6 6.39.111
Perceived ability to prevent risk
Very able5.93.84.64.82.00.47.95.1 6.30.84.4
Moderately able32.926.529.925.815.020.121.314.323.112.523.118.8
Able23.823.624.520.013.18.228.330.923.1 19.823.2
Unable29.030.727.834.534.641.032.336.623.17530.629.3
Extremely unable8.515.413.314.835.330.310.213.130.86.325.624.3
Why risk is most problematic
Risk affects many aspects of life33.326.348.640.033.026.315.217.43924.757.953.9
The risk occurs more frequently4.04.33.51.85.25.612.31.23.7 2.9
I lack sufficient coping 11.912.15.710.513.514.19.87.49.811.16.25.3
I have no control 6.15.26.43.713.515.42.52.718.333.34.15.3
Consequences are irreversible4.06.70.40.50.30.2 1.22.52.14.4
Effects carry over many seasons4.33.22.10.85.98.511.37.36.20.71.5
Affects all member of my household33.037.633.041.625.327.670.668.8221625.524.8
Effects carry over the entire season3.44.50.41.13.12.2 1.22.53.41.9
* M and F stand for male and female, respectively.
Table 5. Outer weights for Model 1 and Model 2.
AttributeFluctuating Input PricesLow Crop YieldReduction in Agricultural IncomesRisk Perception
Model 1Model 2Model 1Model 2Model 1Model 2Model 1Model 2
ffrefuture1 0.2560.250.1420.139
ffrehisto1 0.2580.2220.1390.132
fprevent1 0.5430.5740.2120.219
fseverity1 0.4450.4430.1850.185
mfrefuture10.340.309 0.110.107
mprevent10.580.605 0.1980.205
mseverity10.4830.475 0.1820.183
pfrefuture1 0.3260.294 0.1520.144
pfrehisto1 0.2690.213 0.1460.137
pprevent1 0.6110.673 0.2160.223
pseverity1 0.3140.317 0.1270.127
Note: All the indicators are significant at 1% on both the lower and higher constructs. The f, m, and p prefixes before the risk attributes denote the domain of the risk, namely financial, market, and production, respectively.
Table 6. Path coefficients and their significance.
ConstructMeanp Values
Model 1Model 2Model 1Model 2
Fluctuating input prices0.3350.6640.0000.000
Fluctuating input prices -> Low crop yields * 0.488 0.000
Low crop yield 0.4200.6680.0000.000
Low crop yields -> Reduction in agricultural incomes * 0.58 0.000
Reduction in agricultural incomes 0.4460.4470.0000.000
* This denotes the effect of one of the lower constructs on another lower construct.
Table 7. Lower construct perception differences between men and women.
Risk AttributeReduction in Agricultural IncomesFluctuating Input PricesLow Crop Yields
Outer Weights (Female-Male)p-ValueOuter Weights (Female-Male)p-ValueOuter Weights (Female-Male)p-Value
ffrefuture1−0.0780.527
ffrehisto1−0.2260.041 **
fprevent10.2610.025 **
fseverity1−0.0530.639
mfrefuture1 −0.1850.217
mprevent1 0.1540.303
mseverity1 −0.1470.333
pfrefuture1 0.210.131
pfrehisto1 −0.2290.073 *
pprevent1 0.0920.417
pseverity1 −0.0610.637
**, * denote significance at 5% and 10%, respectively.
Table 8. Test for differences across path coefficients (total effects) between men and women.
Risk PerceptionsTotal Effects-Diff (Female-Male)p-Value
Fluctuating input prices -> Low crop yield0.120.101
Fluctuating input prices -> Reduction in agricultural incomes0.0560.392
Fluctuating input prices -> Risk perception0.1270.03 **
Low crop yield -> Reduction in agricultural incomes−0.0310.642
Low crop yield -> Risk perception−0.0790.123
Reduction in agricultural incomes -> Risk perception−0.0510.282
** denote significance at 5%.
Publisher’s Note: MDPI stays neutral with regard to jurisdictional claims in published maps and institutional affiliations.

