Article

A Comprehensive Performance Characterization of a Nanofluid-Powered Dual-Fluid PV/T System under Outdoor Steady State Conditions

1
Green Energy Technology Research Center, Kongju National University, Cheonan 31080, Korea
2
Agriculture and Life Sciences Research Institute, Kangwon National University, Chuncheon 24341, Korea
3
Interdisciplinary Program in Smart Agriculture, Kangwon National University, Chuncheon 24341, Korea
4
Department of Architectural Engineering, Kongju National University, Cheonan 31080, Korea
*
Author to whom correspondence should be addressed.
Sustainability 2021, 13(23), 13134; https://doi.org/10.3390/su132313134
Submission received: 5 November 2021 / Revised: 24 November 2021 / Accepted: 25 November 2021 / Published: 26 November 2021
(This article belongs to the Special Issue Frontiers on Solar Thermal Harvesting Technology)

Abstract

:
This paper discusses the effectiveness of simultaneous use of CuO nanofluid and air as a dual-fluid coolant for the thermal management of a photovoltaic/thermal (PV/T) system. Outdoor experimental studies were performed to calculate the discrepancies between indoor and outdoor test findings. The thermal efficiency and the electrical characteristics of the dual-fluid PV/T system were investigated under steady-state test conditions following ISO standards. It was found that the divergence in electrical efficiency between indoor and outdoor-based PVT testing was significantly higher, while the difference in thermal efficiencies was marginal. It was observed that nanofluid/air, even at the lowest flow rates, outclassed the water/air coolant at higher flow rates in terms of PV/T energy output, which also ultimately helps in reducing the energy requirement for pumping. Unlike conventional solar air heaters, the proposed dual-fluid PV/T system produces a high air temperature when operated with only air at stagnant nanofluid. The maximum PV/T efficiency of approximately 85% was recorded when the nanofluid and air flows were kept at 0.02 kg/s and 0.04 kg/s, respectively. It is concluded that outdoor steady state testing provides comprehensive performance characterization of the nanofluid powered dual-fluid coolant for the PV/T system.

1. Introduction

Solar energy has proven to be an attractive renewable energy source in the context of meeting global sustainability goals and reducing greenhouse gas emissions. It is the most mature technology compared to other renewable technologies when considering both heat and electricity. Solar power has potential to supply nearly 55% of global energy demand. Over the last decade, photovoltaic (PV) technology has become the most popular renewable. The only major concern is its dependency on temperature, as a 1 °C increment in temperature causes a reduction in efficiency of 0.5% [1]. This overheating problem can be overcome by integrating a heat exchanger with the PV module. This approach has led to the development of photovoltaic/thermal (PV/T) technology. The primary purpose of a PV/T system is to generate electricity by controlling the PV temperature, and the secondary purpose is to produce heat. Due to simultaneous production of heat and electricity, the PV/T system offers significantly enhanced energy efficiency compared to conventional solar collectors.
For high-performance energy efficiency of the PV/T system, the heat transfer fluids play an extremely important role. Conventional coolants such as water and air limit the PV/T systems to the low temperature applications. To cope with this problem, the introduction of nanofluids for the solar thermal applications opened up new horizons for researchers to best utilize the sun energy [2,3,4]. Huang and Marefati [5] evaluated the thermal performance of concentrating and non-concentrating solar collectors using different nanofluids comprising of Al2O3 and CuO nanoparticles, and water and Thermia Oil B base fluids. Based on findings derived from mathematical modeling, they found that the suspension of CuO nanoparticles in water has the highest energy efficiency, while the Thermia Oil B based CuO nanofluid exhibited the highest exergy efficiency. Manigandan and Kumar [6] investigated the simultaneous use of CuO and ZnO nanofluids and the phase changing material (PCM) as coolants for the PV/T systems. Compared to ZnO, the CuO nanofluid showed a profound effect in terms of achieving the lowest PV surface temperature. Meanwhile, the addition of PCM further reduces the PV temperature to a considerable range. Muzaidi et al. [7] developed trihybrid nanofluid comprises of CuO/TiO2/SiO2 nanoparticles and investigated its temperature output performance for the solar thermal applications. The suspensions of TiO2, Al2O3, and CuO nanosized particles in the distilled water were the most widely reported nanofluids in the literature [8,9,10]. However, the majority of references in the literature describe the CuO nanofluid as a cost-effective and thermally sound solution for addressing the existing heat transfer problems. A vast range of its applications in the context of improving the thermal performance of different energy systems are summarized in Table 1.
A state-of-the-art heat exchanger design for the PV/T technology is another challenge to maximize the utilization of sun light and to minimize the heat loss [11]. The surface area covered by a single fluid, whether liquid or air, is not sufficient to extract the major portion of solar heat from the PV module. Therefore, alternate approaches were adopted. One of them is bi-fluid coolant, where two fluids are circulated simultaneously over or under the PV surface. In the recent years, the bi-fluid heat exchangers for the PV/T systems have been studied by various researchers. By applying a bi-fluid as a coolant provides multiple options, where both fluids and either fluid can be utilized according to the load requirements. Abu Bakar et al. [12] proposed a steady state mathematical model of a bi-fluid PV/T system, and a wide range of flow rates of water and air was used. The simulations indicate that during simultaneous operation of air and water, the overall performance of PV/T was found to be higher than a single-fluid (either water or air)-based PV/T system. Following this concept, an indoor experimental study of the dual-fluid PV/T system using a solar simulator was conducted by Jarimi et al. [13]. On the basis of the satisfactory agreement between simulation and indoor experimental data, it has been concluded that the proposed mathematical model is useful for predicting the performance of a bi-fluid PV/T system.
Through a detailed literature review it has been conceived as an expression that high efficiency conversion of solar radiation to electricity and thermal energy using PV/T technology is still a debatable issue. Application of nanofluids and the multi-coolant heat exchangers are the possible solutions to these existing challenges. Combining the aforementioned technologies into a single unit could be a viable solution to fill the existing research gaps in the development of a state-of-the-art PV/T technology. To the best of the authors’ knowledge, no previous study had tested this combination in outdoor climatic conditions considering international standards. In addition, it has been noticed that some studies had reported indoor tests of utilizing conventional fluids as a bi-fluid coolant for the thermal management of PV/T system. Due to difference in color temperature of lights produced by solar simulator and actual sun, the authenticity of the indoor test results is still questionable. Considering aforementioned scenario, this study tested a full-scale PV/T collector in outdoor test conditions, which assesses the practical viability of nanofluid powered dual-fluid coolant for the real world applications, and thus identifies the existing research gaps between the indoor and outdoor experimental outcomes. A comprehensive outdoor steady state analysis of nanofluid/air powered PV/T system was carried out in comparison with water/air and individual fluid in context of replacing nanofluid-based dual fluid system with conventional fluids. In this paper, different flow regimes, e.g., laminar, transitional, and turbulent for each fluid operation have been evaluated in the context of identifying the optimal flow combination for the maximum PV/T power output.
Table 1. Summary of recent studies carried out on CuO nanofluid.
AuthorsParticles SizeConcentrationBase FluidApplications/Investigations
Heris et al. [14]50–60 nm0.2–3 vol.%WaterThe authors examined the increased heat transfer coefficient of CuO nanofluid with increasing concentration of the nanoparticles and Peclet number. It was concluded that the optimal concentration of CuO nanoparticles is between 2.5% and 3%.
Menbari et al. [15]<100 nm 0.002–0.008 vol.%waterThe study investigated the thermal performance of CuO nanofluid for application to a direct absorption concentrating parabolic solar collector (DAPSC). Both experimental and numerical findings revealed that the thermal efficiency of DAPSC increased with increasing nanoparticle volume fraction and fluid flow rate.
Karami et al. [16]<40 nm25–100 Vol. fraction (ppm)water and
Ethylene glycol mixture
In this study, CuO nanofluid-based solar collector was built for residential applications in particular as a domestic water heater. The proposed colloidal solution was further assessed for its thermal-physical and optical properties.
Chen et al. [17]200 nmMass concentration 0.01–0.1%ParaffinThe authors observed that by adding a small amount of CuO nanopowder to PCM (paraffin), a significant enhancement in the solar absorption ability of the resultant composite PCM was observed.
Bellos and Tzivanidis [18]-6 vol.%Syltherm 800CuO nanoparticles dispersed in Syltherm 800 was used as a heat transfer fluid for a solar linear Fresnel reflector. Compared to conventional thermal oil, the CuO dispersed in Syltherm 800 proved to be beneficial in the context of improving the thermal efficiency and operation under high-temperature levels.
Venkitaraj et al. [19]40–50 nm Mass concentration 0.1%Neopentyl-glycolThe main objective of this study was to experimentally analyze the impact of CuO nano-additives on the heat extraction performance of Neopentylglycol for building cooling applications.
Malekan et al. [20]10–250 nm2–4 vol.%Therminol 66In this study, a CuO/Therminol 66 nanofluid is examined as a potential solution for performance improvement of a parabolic trough solar collector. Under an external magnetic field, a significant rise in thermal efficiency was noticed.
Mustafa et al. [21]40 nm0.1 vol.%WaterThe authors examined the usefulness of CuO nanofluid in a flat plate solar collector for assisting a hot process stream. It was found that by loading CuO nanoparticles, the thermal performance of a solar-assisted hot process stream was improved by 12.8%.

2. Energy and Performance Analyses

Generally, there is slight fluctuation in solar radiation during outdoor steady-state testing. Therefore, to realize a relative steady state test, the Hottel-Whillier model was adapted to obtain the general expression for calculation of the useful energy gain. The heat gain by the circulating fluids in the dual-fluid PV/T system can be expressed as follows [22,23]:
Q u = A c F r [ ( τ α ) G U L ( T i T ) ]
F r = m . c f ( T o u t T i n )   A c F r [ ( τ α ) G U L ( T i n T ) ]
where Q u is the useful energy and A c is the collector area, m . and c f are the mass flow rate and specific heat of the circulating fluid, respectively, F r and U L are the heat removal factor and heat loss coefficient, respectively, τ α is the product of the glass cover transmittance and PV layer absorptance, T i n and T o u t are the inlet and outlet temperatures, respectively, of the circulating fluids, G is the solar radiation incident on the collector plane, and T is the ambient air temperature. Finally, the expression for thermal efficiency in the form of optical efficiency, heat loss, and zero-reduced temperature is presented as follows:
ŋ = F r ( τ α ) F r U L ( T i T ) G
In the case of the dual-fluid heat exchanger, the total thermal gain by the proposed solar collector is given by summation of the relative contribution of each fluid. Therefore, the total thermal energy produced by the dual-fluid PV/T system can be computed as follows:
Q u , b i = m . c n ( T n , o T n , i ) + m . c a ( T a , o T a , i )
As described by Jarimi et al. [13] and others [24,25], under steady state conditions, the thermal performance of a solar collector is assessed by averaging its thermal output over a certain period of time. Therefore, Equation (4) can be modified as follows:
Q u , b i = m . c n ( T n , o T n , i ) + m . c a ( T a , o T a , i )   d t
ŋ b i = m . c n ( T n , o T n , i ) + m . c a ( T a , o T a , i )   A c   G   d t
The instantaneous electrical power and efficiency can be computed using the following expressions [26]:
F F = I m a x     V m a x I s c     V o c = P e l I s c V o c
P e l = I s c     V o c     F F
ŋ e l = P e l A c   G   d t
The overall power produced by the dual-fluid system is calculated by summing the total thermal energy and electrical powers:
P p v t = Q u , b i + P e l
As suggested by [12], the primary energy savings efficiency of a proposed collector can be written as:
ŋ t o t = ŋ b i + ŋ e l ŋ p p
where ŋ p p is the power plant conversion efficiency, apart from quality of the coal used, and its value is taken as 38%.
Based on the Reynolds number (Re) as given by [27], the flow regimes (laminar, transitional, and turbulent) for fluid passing through a pipe and channel are determined. The following correlation is used for calculation of the Re value:
R e = m . D h A µ
where µ is viscosity of the circulating fluid. A and D h are the cross-section area and hydraulic diameter of the pipe. For a circular pipe the inner diameter is considered as the hydraulic diameter. For a rectangular channel the hydraulic diameter is defined as follows [27]:
D h = 4 W d 2 ( W + d )
where W and d are the channel width and depth, respectively.

3. Experimentation

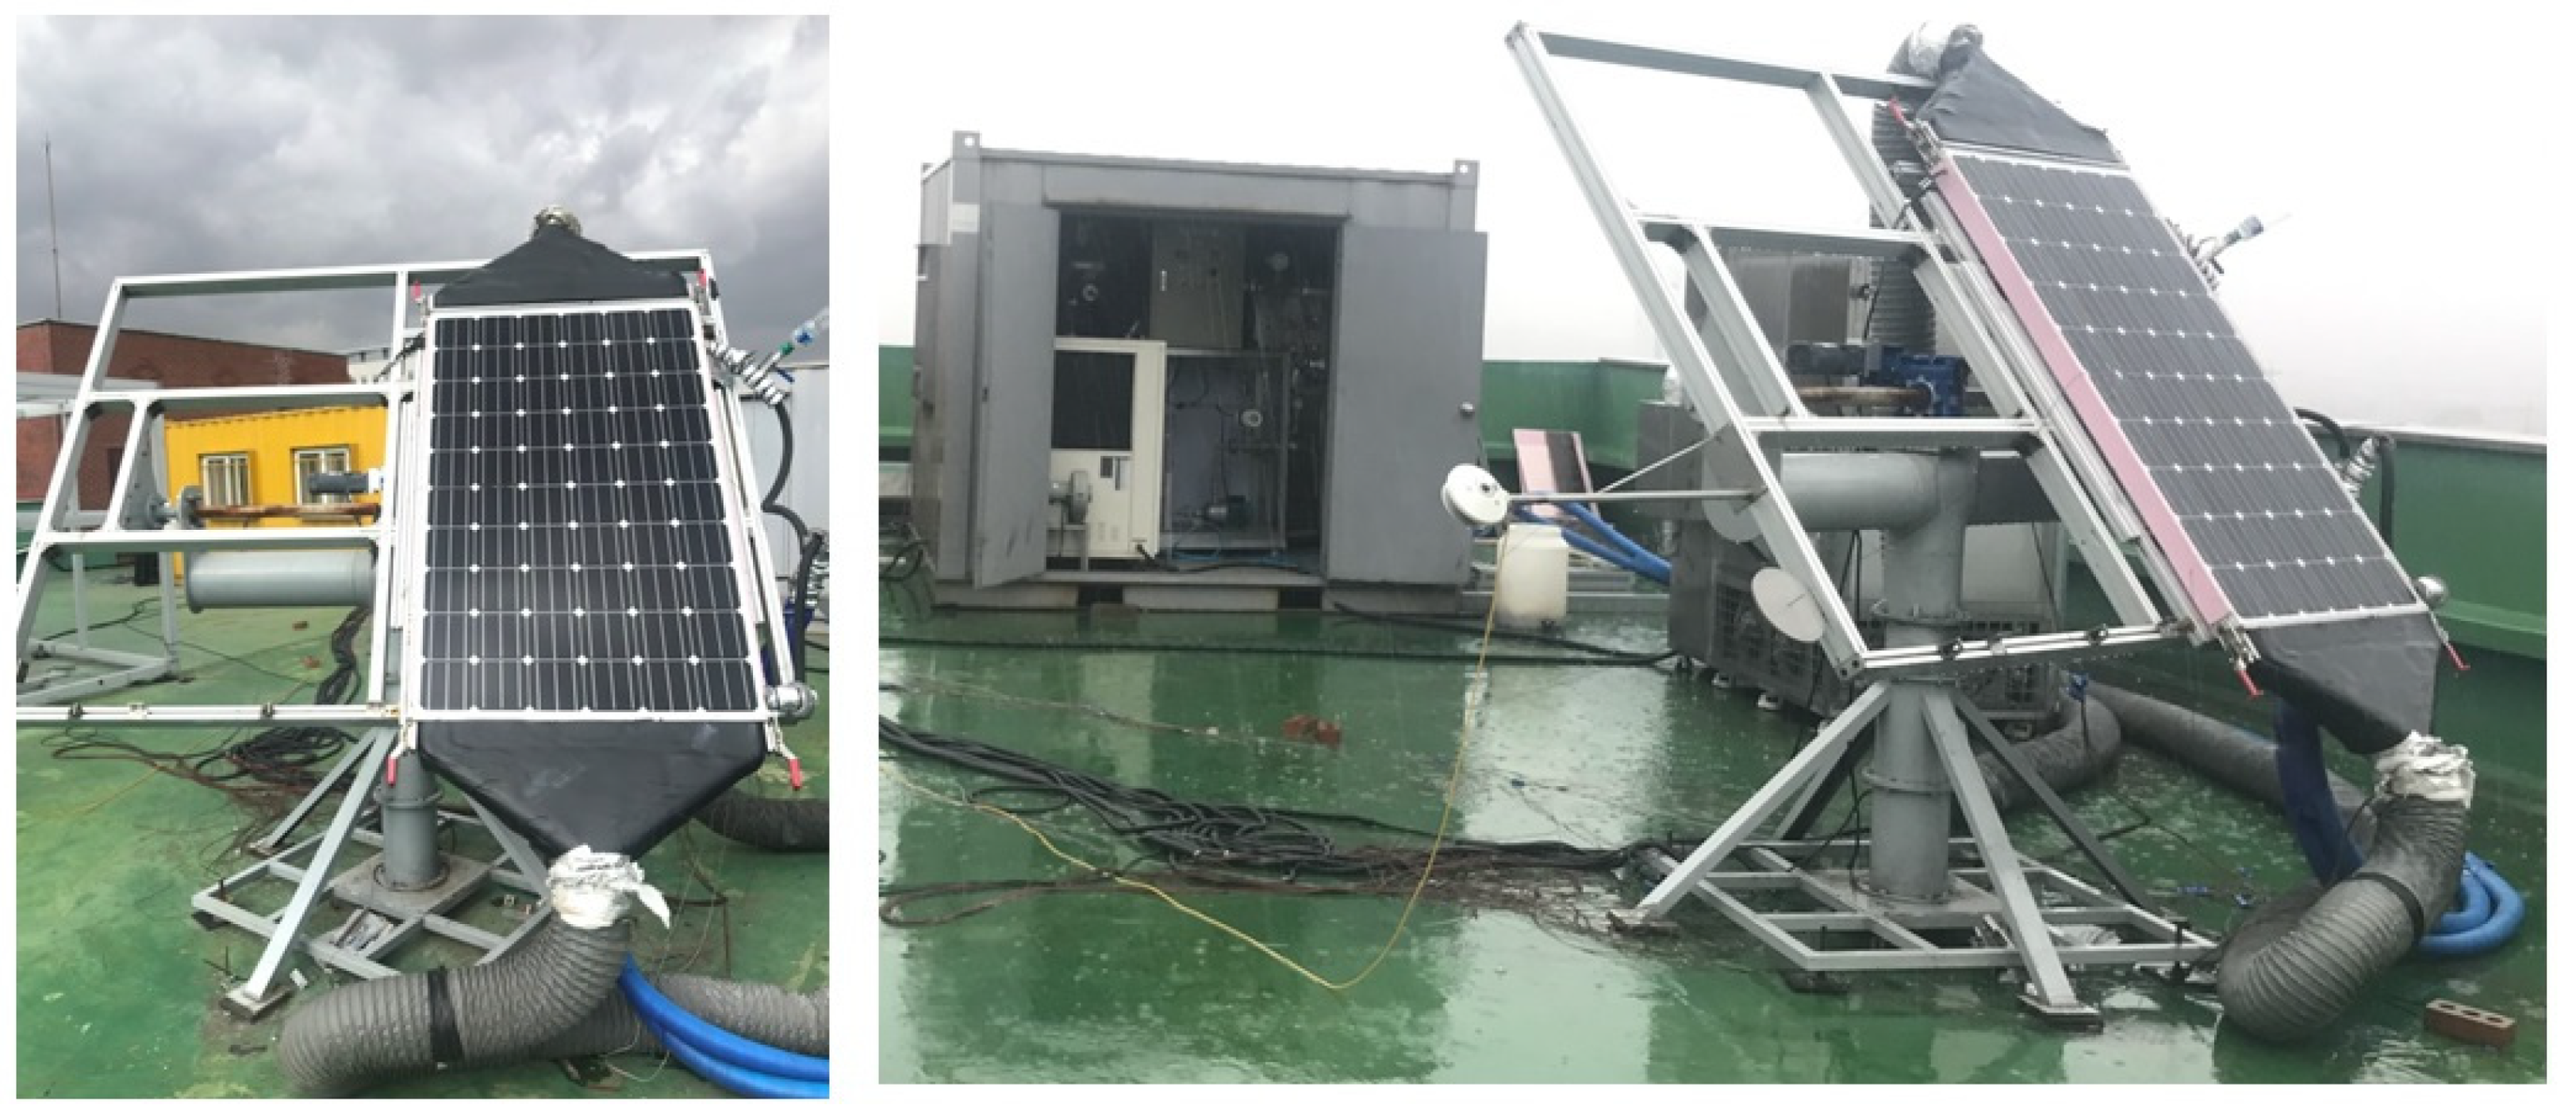
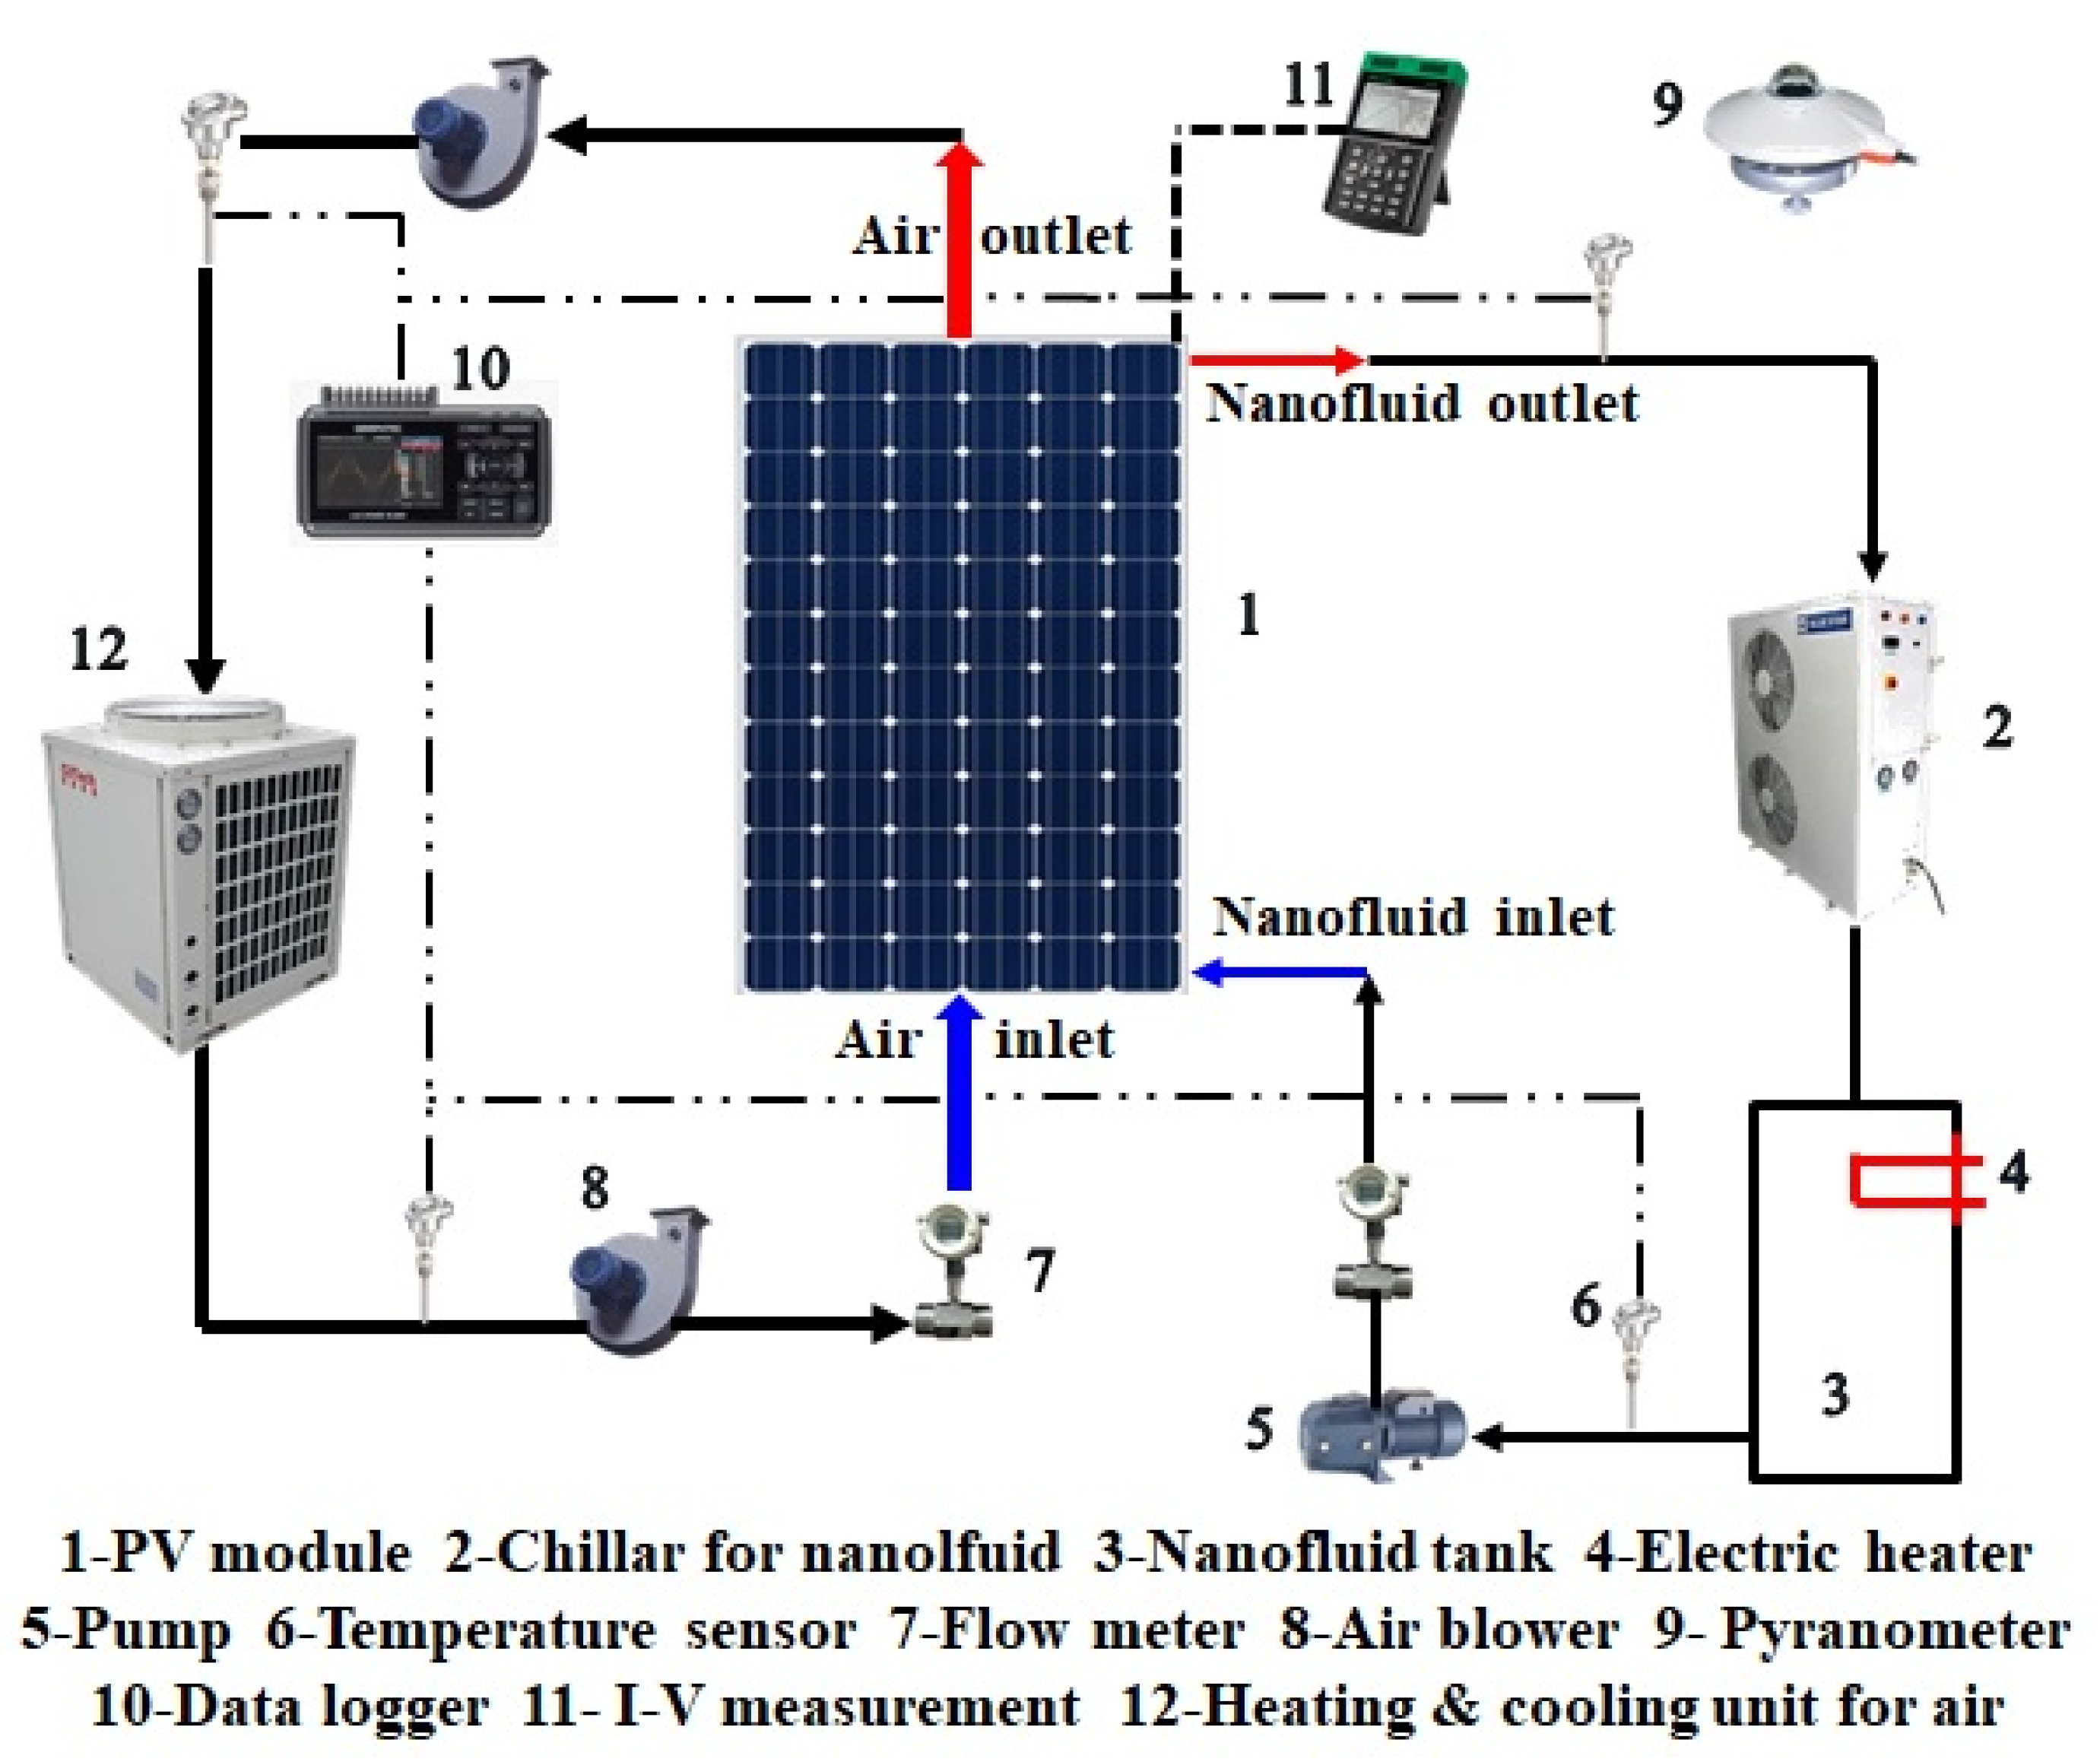
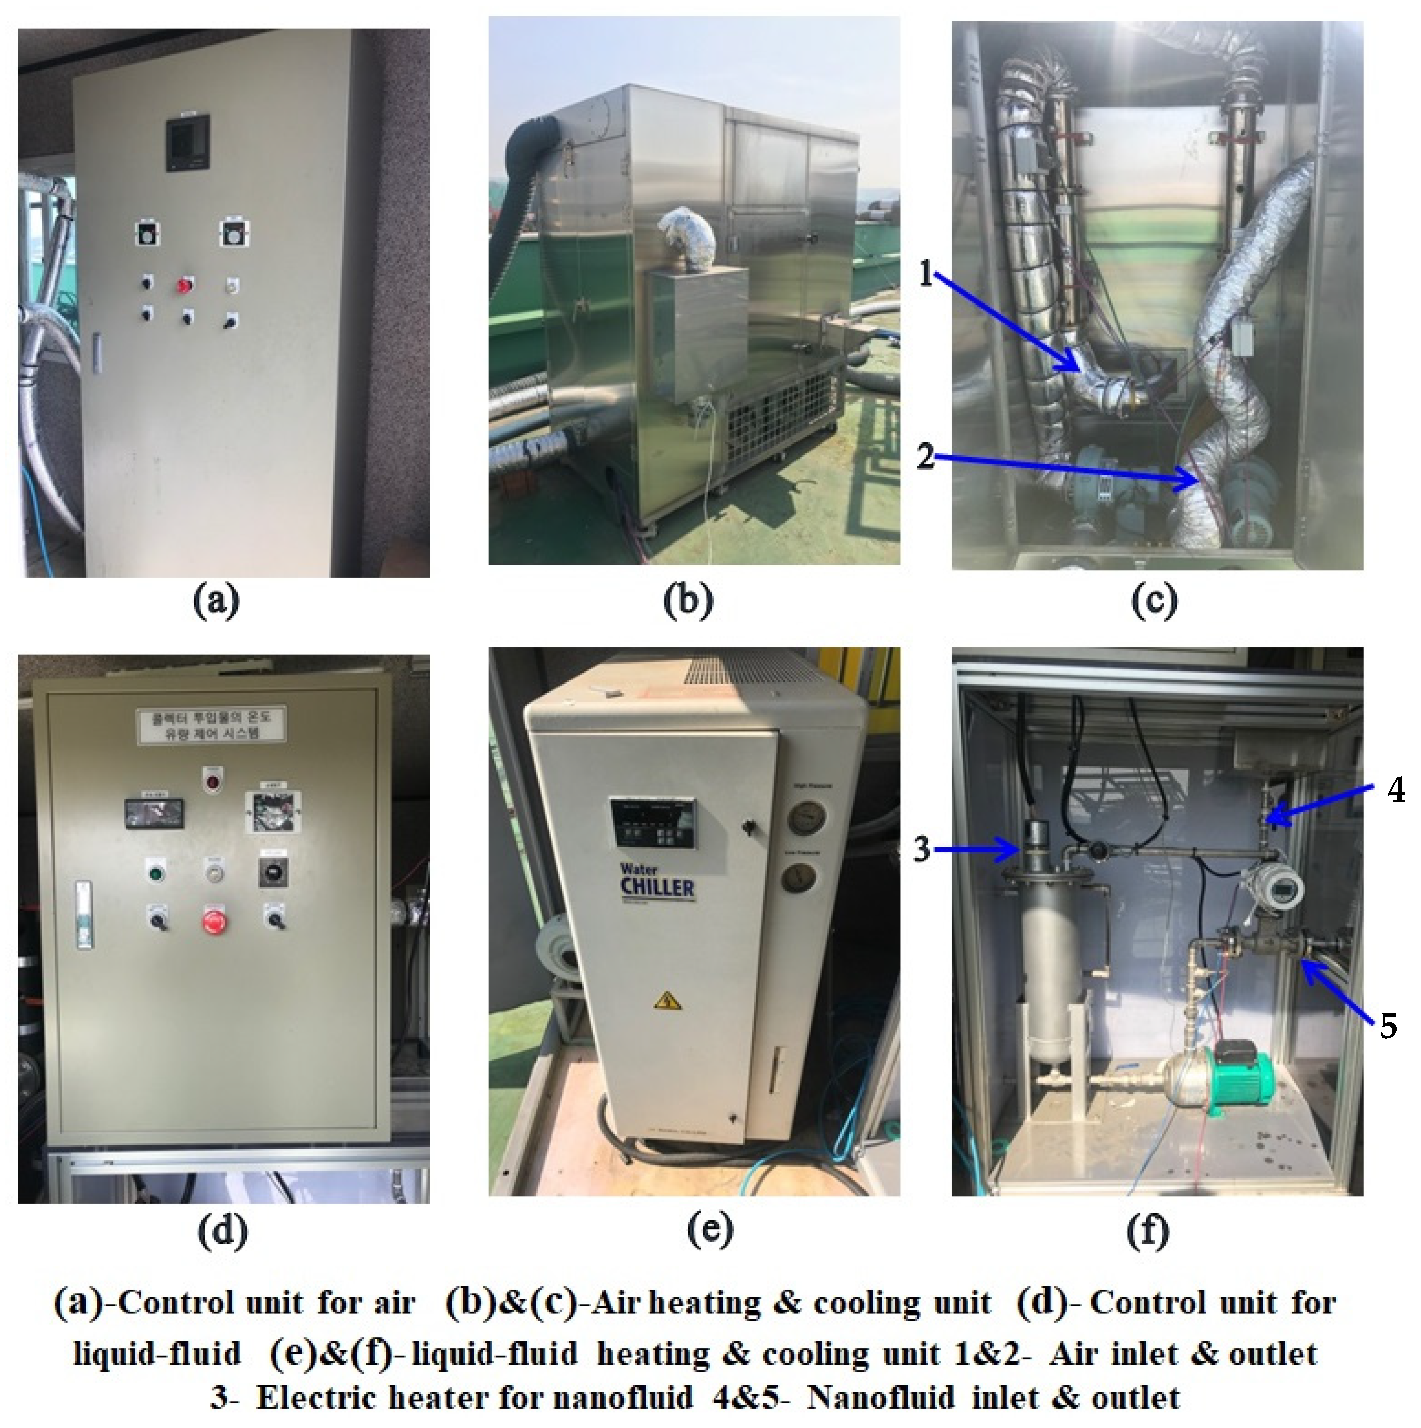
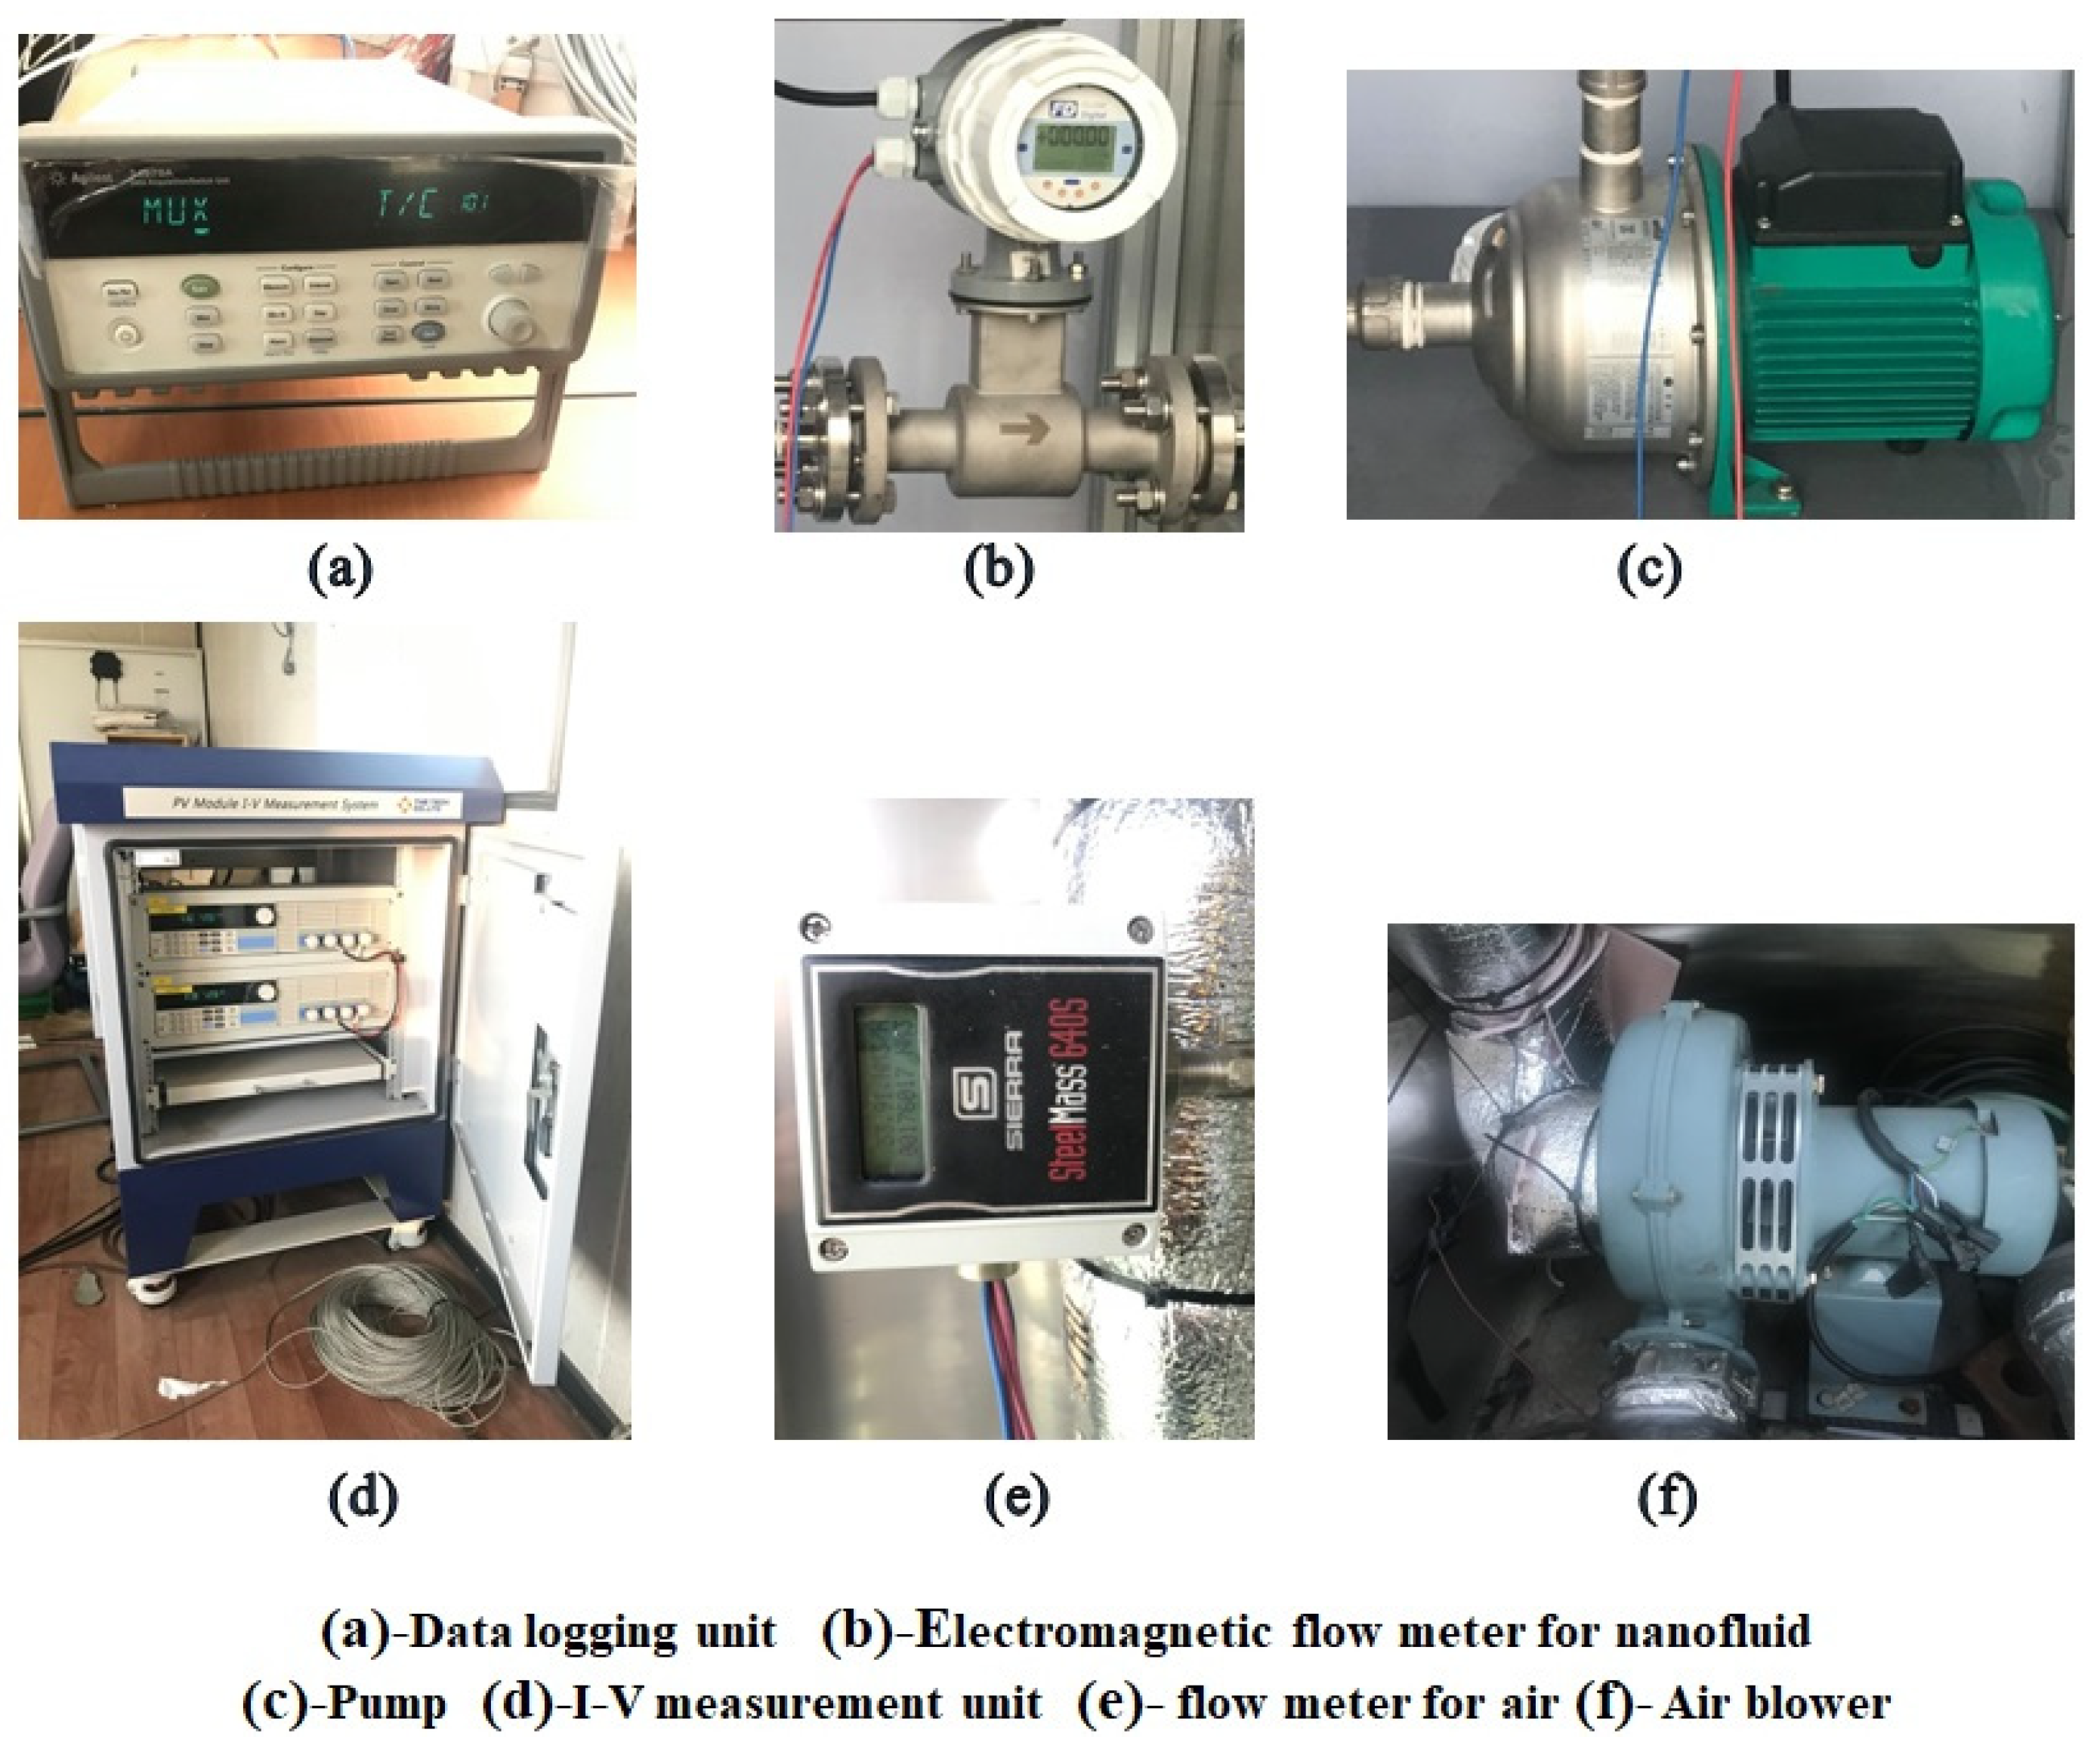
3.1. Experimental Setup

A photograph of a dual-fluid PV/T system with a single pass air channel is shown in Figure 1. The complete experimental setup mainly comprises a mono-crystalline PV module, experimental data monitoring and recording units, nanofluid and air circulation systems, heating and cooling units for both fluids, and a storage tank for the nanofluid (Figure 2). In order to maintain constant inlet temperature, a heating and cooling unit consisting of a chiller and heater was provided separately for nanofluid and air, respectively, so that outdoor performance testing of the dual-fluid PV/T system could be performed according to ISO standard operating conditions. As generally done previously, the researchers used a secondary tank to discard the heated fluid from the PV module with the intention of keeping the inlet fluid at nearly constant or fixed temperature. Using this method, a lack of accuracy was the prime concern. In this study, the test facility is equipped with heating/cooling units for both liquid-type and air-type heat transfer fluids, where the desired inlet temperature ranges can be selected using switch gear panels. Labeled pictures of the heating and cooling units for both fluids and control panels are shown in Figure 3. The preference of outdoor testing over indoor testing stems from the following: when the PV/T system is tested under tungsten halogen lamps or a simulator, a clear discrepancy was observed between the electrical characteristics measured by the indoor test and those given by the manufacturer [13]. This may be attributable to a stronger infrared portion and weaker blue and UV portions in the artificially produced spectrum.

3.2. Dual-Fluid PV/T System Design

A standard mono-crystalline PV module with dimensions 1.6 m × 1.0 m was used. The electrical characteristics of the PV module provided by the manufacturer are given in Table 2. Serpentine-shaped copper pipes were welded to a 0.2 mm absorber plate, and the resultant heat exchanger was then attached at the rear surface of the PV module using adhesive or thermal glue. Copper pipes with an inner diameter of 8 mm were used to carry the liquid fluids, that is, the nanofluid and water. Underneath the PV module a single pass air channel is provided for air circulation. To make the system cost-effective, the air channel was made of polyvinyl chloride (PVC) with a thickness of 4 mm. To produce a turbulence effect, a series of baffles were arranged transverse to the air flow at specific angles. Furthermore, the liquid fluids (by serpentine-shaped pipes) and air (channel pass) flow were designed to be perpendicular to one another so that the thermal contact area between both fluids can be maximized. The back chamber underneath the PV module, which includes copper pipes and the air channel, was painted matte black with the intention of achieving higher emissivity and heat transfer rates.

3.3. Measurement

For the energy performance evaluation, a prototype of the dual-fluid PV/T system was built and tested under outdoor conditions at Cheonan city, South Korea. The surface temperatures of the top and back of the PV panel were measured using K-type thermocouples. A total of eight temperature sensors solely for the PV module were used, where three of them were placed at its top surface, and the remaining five were attached at the rear surface. Three temperature sensors were installed respectively at inlets and outlets of both fluids. Prior to experimentation, all temperature sensors were calibrated as per ISO standard conditions. A first class pyranometer was installed parallel to the PV module to measure the global solar radiation. The nanofluid from the storage tank was pumped into the serpentine-shaped pipe heat exchanger by a pump, and air was circulated through the air channel by two air blowers (at the inlet and outlet) driven by an AC motor. The nanofluid flow rate was measured by an electromagnetic flow meter (FD Flow Digital), and the air flow rate was recorded by an insertion gas mass flow meter (SteelMass 640S). The speeds of both fluids, the nanofluid and air, were controlled using power regulators. The wind speed and direction were measured with a weather station installed near the experimental setup. Details of equipment used to control operational conditions are presented in Figure 4.

3.4. Uncertainty Analysis

All of the equipment used for measuring climatic, thermal, and electrical variables was calibrated prior to use in tests. In the current study, most errors were related to the measurements and sensitivity of the equipment. The values of the equipment sensitivities were taken from the catalogs provided by the manufacturers. Errors from the temperature measurement include the sensitivity of the PT100 Ω of ±0.4 °C, as well as the sensitivity of the thermocouples of ±0.1 °C and their measurement error of 0.25 °C. Second, the total error due to the flow rate measurement was the sum of the equipment accuracy and measurement error. For the insertion gas mass flow meter, the accuracy was the sum of ±1% of reading and ±0.5% of full scale. For measurement of the nanofluid or water flow, the error range and repeatability for the electromagnetic flow meter were ±0.5% and ≤0.17%, respectively. After factory calibration, the uncertainty and the nominal sensitivity related to the first class pyranometer were <1.2% and 10 µV/(W/m2), respectively. The accuracy associated with the PV module I-V measurement system (TNE Tech CO., Ltd., Yongin, Korea) for measuring peak power was ±1%. Thermal and electrical efficiencies were calculated from the uncertain measured values; both, therefore, have uncertainties associated with them, and these uncertainties were calculated using the error propagation law.

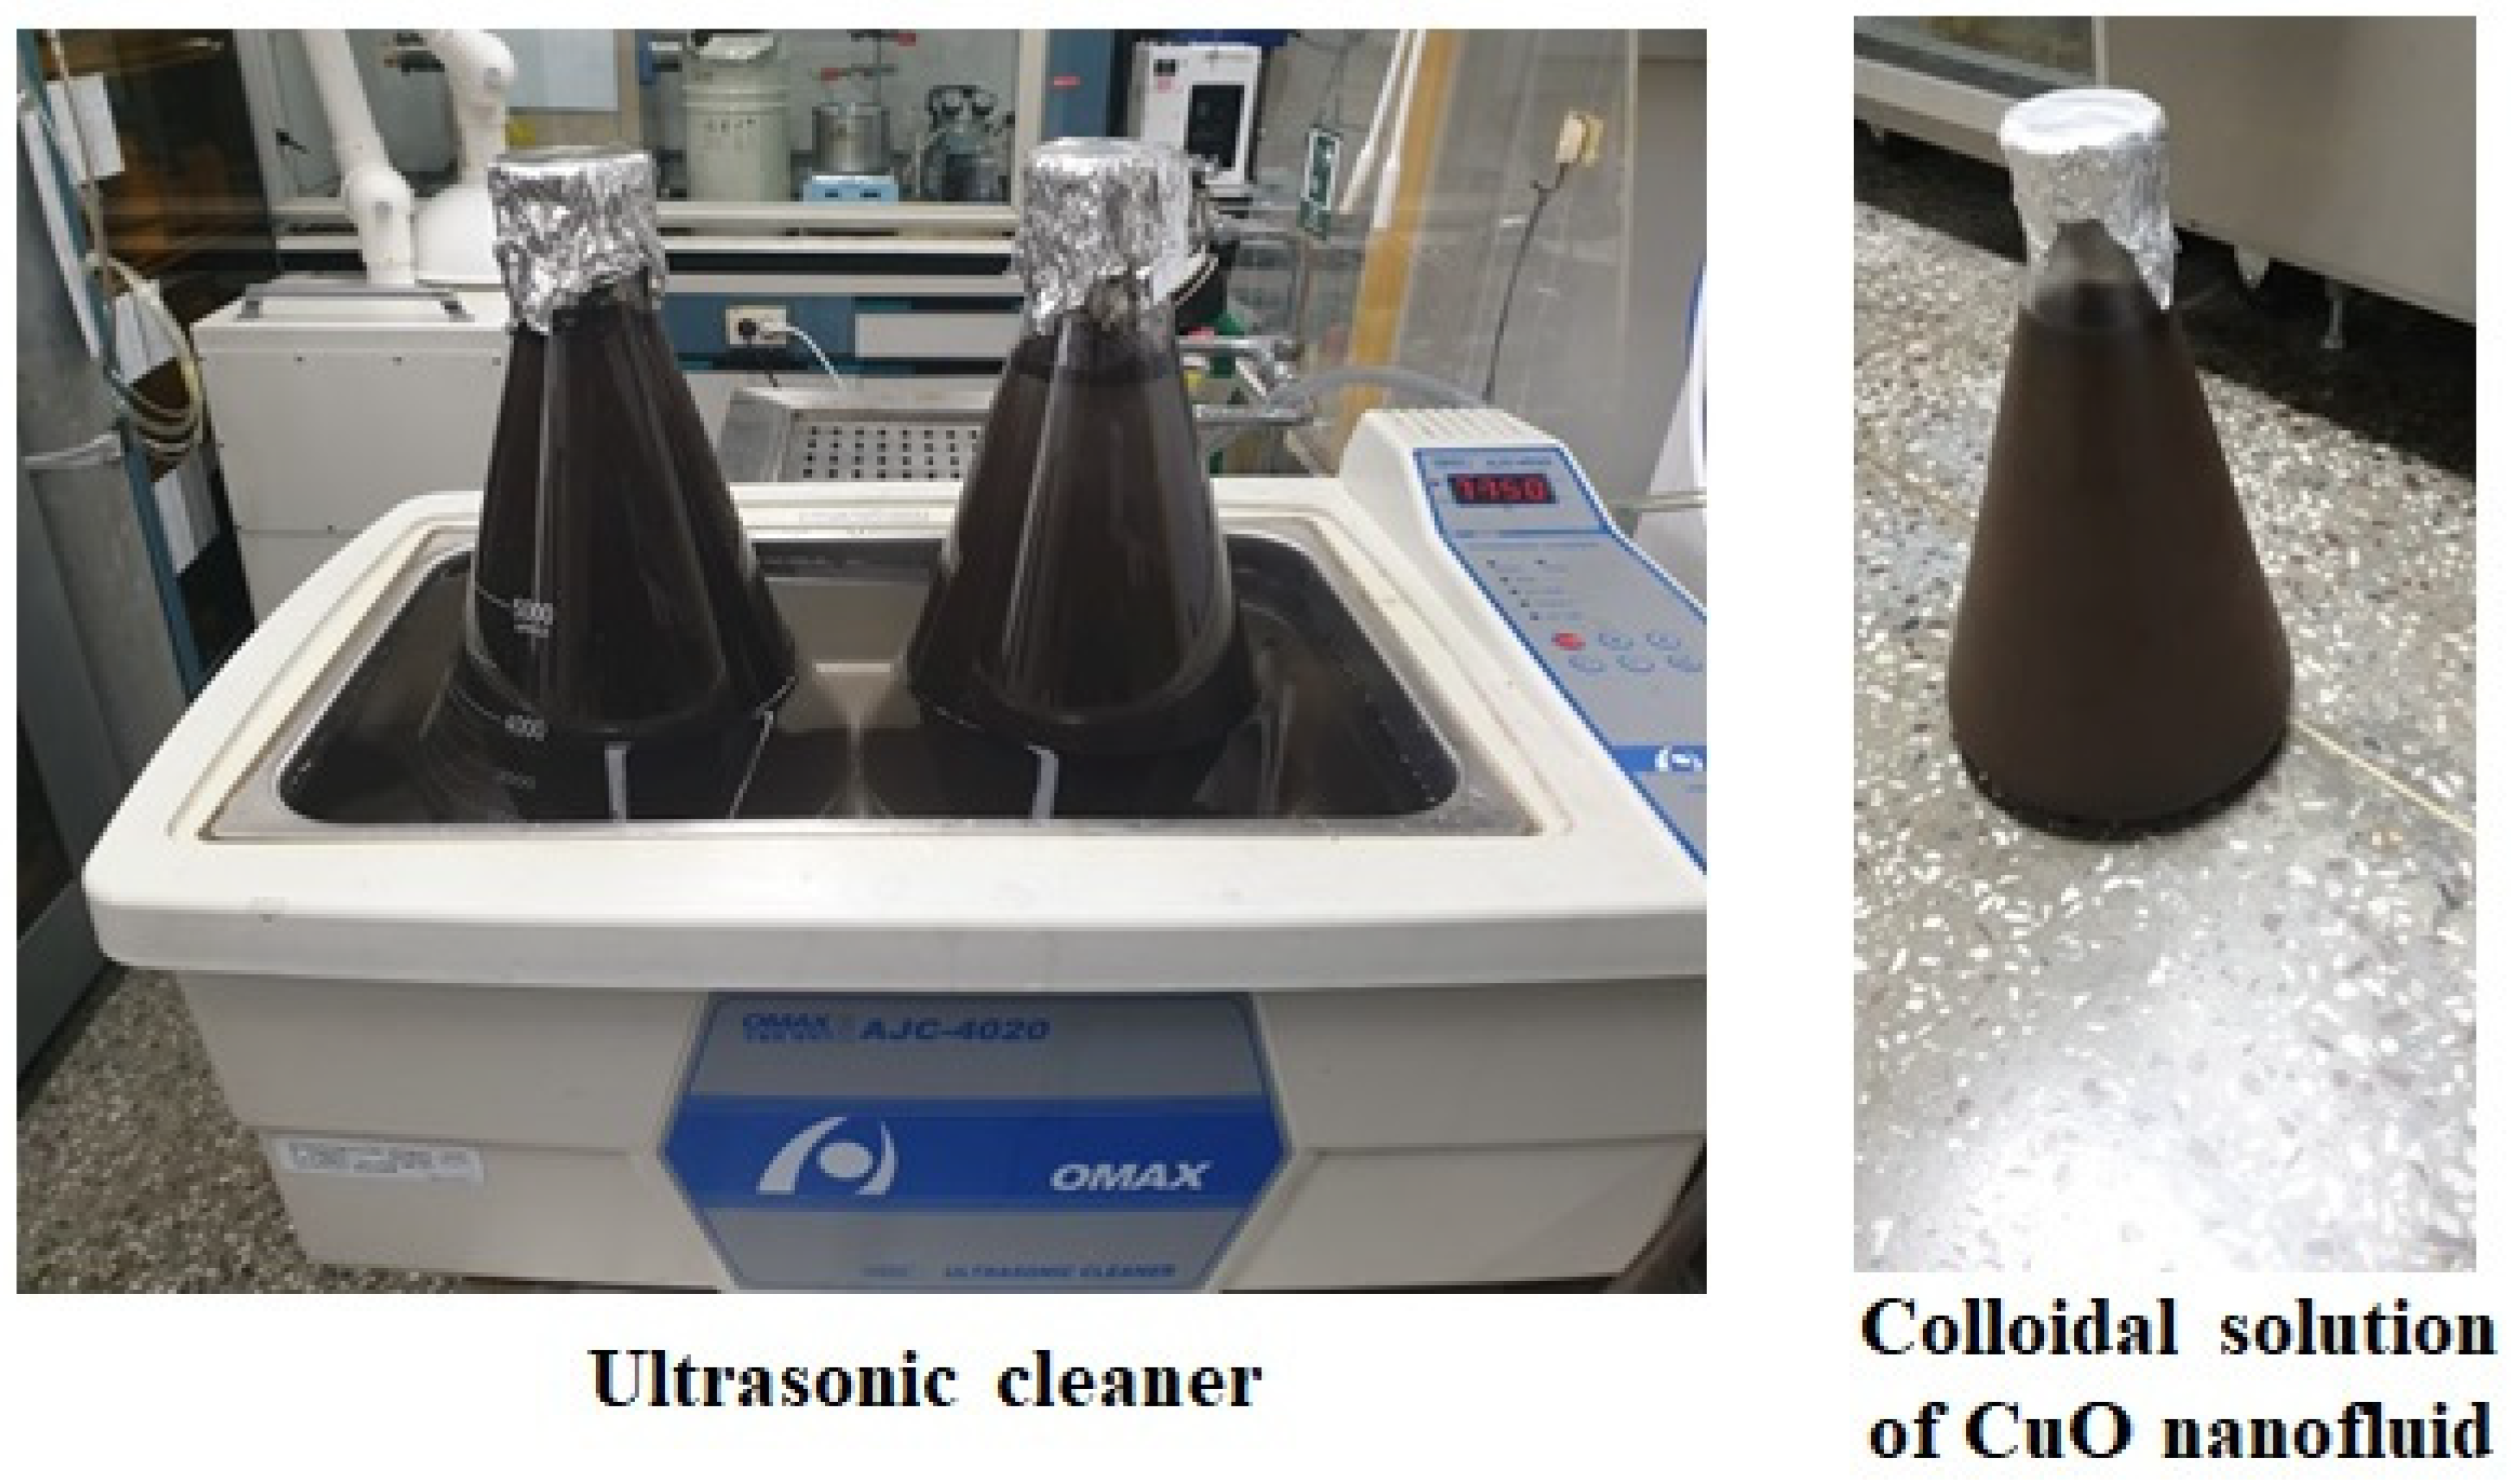
3.5. Nanofluid Preparation

In this study, copper oxide (CuO) nanoparticles were employed in powder form as supplied by a local supplier (HKK Solution). The size of the nanoparticles varied between 10 to 25 nm. Specifications of the CuO nanoparticles are presented in Table 3. Proper suspension of nanoparticles in a base fluid (distilled water) is very important to obtain a stable colloidal solution, and also to improve the thermal conductivity of the resultant solution. Prior to mixing, nanoparticles were put in an oven for an hour at 200 °C to remove existing moisture. Using an electronic balance, the desired mass of CuO nanoparticles was weighed. For nanofluid preparation, a two-step method was adopted here. Using a magnetic stirrer, sodium dodecyl sulfate (SDS) in a quantity of 5% weight of CuO nanoparticles was mixed completely in deionized water, and then the required amount of nanoparticles was added while stirring. An ultrasonic cleaner (OMAX AJC-4020) was used for the preparation of the nanofluids (Figure 5). The aforementioned mixture was further sonicated for 12 h to obtain 12 L of colloidal solution. The mass required for a particular volume concentration in the test sample of base fluid was calculated using the law of mixtures in terms of percentage of volume fraction [28], density of CuO nanoparticles, and density of deionized (DI) water base fluid using the following relationship:
ϕ % = ( w n p / ρ n p ) ( w n p / ρ n p ) + ( w b f / ρ b f )
where ϕ is the volume concentration, and w and ρ are respectively the mass and density of nanoparticles or base fluid. np and bf are abbreviations of nanoparticles and base fluid. A volume concentration of 1% was used, and the obtained mass of concentration was 767.073 g. It should be noted that several trial tests were done by changing the sonication time. It was found that the nanofluid sample with 12 h of continuous sonication showed no nanoparticle agglomeration. In addition, it was found that even after two months the colloidal solution showed an excellent stability with insignificant settling rate.

4. Results and Discussion

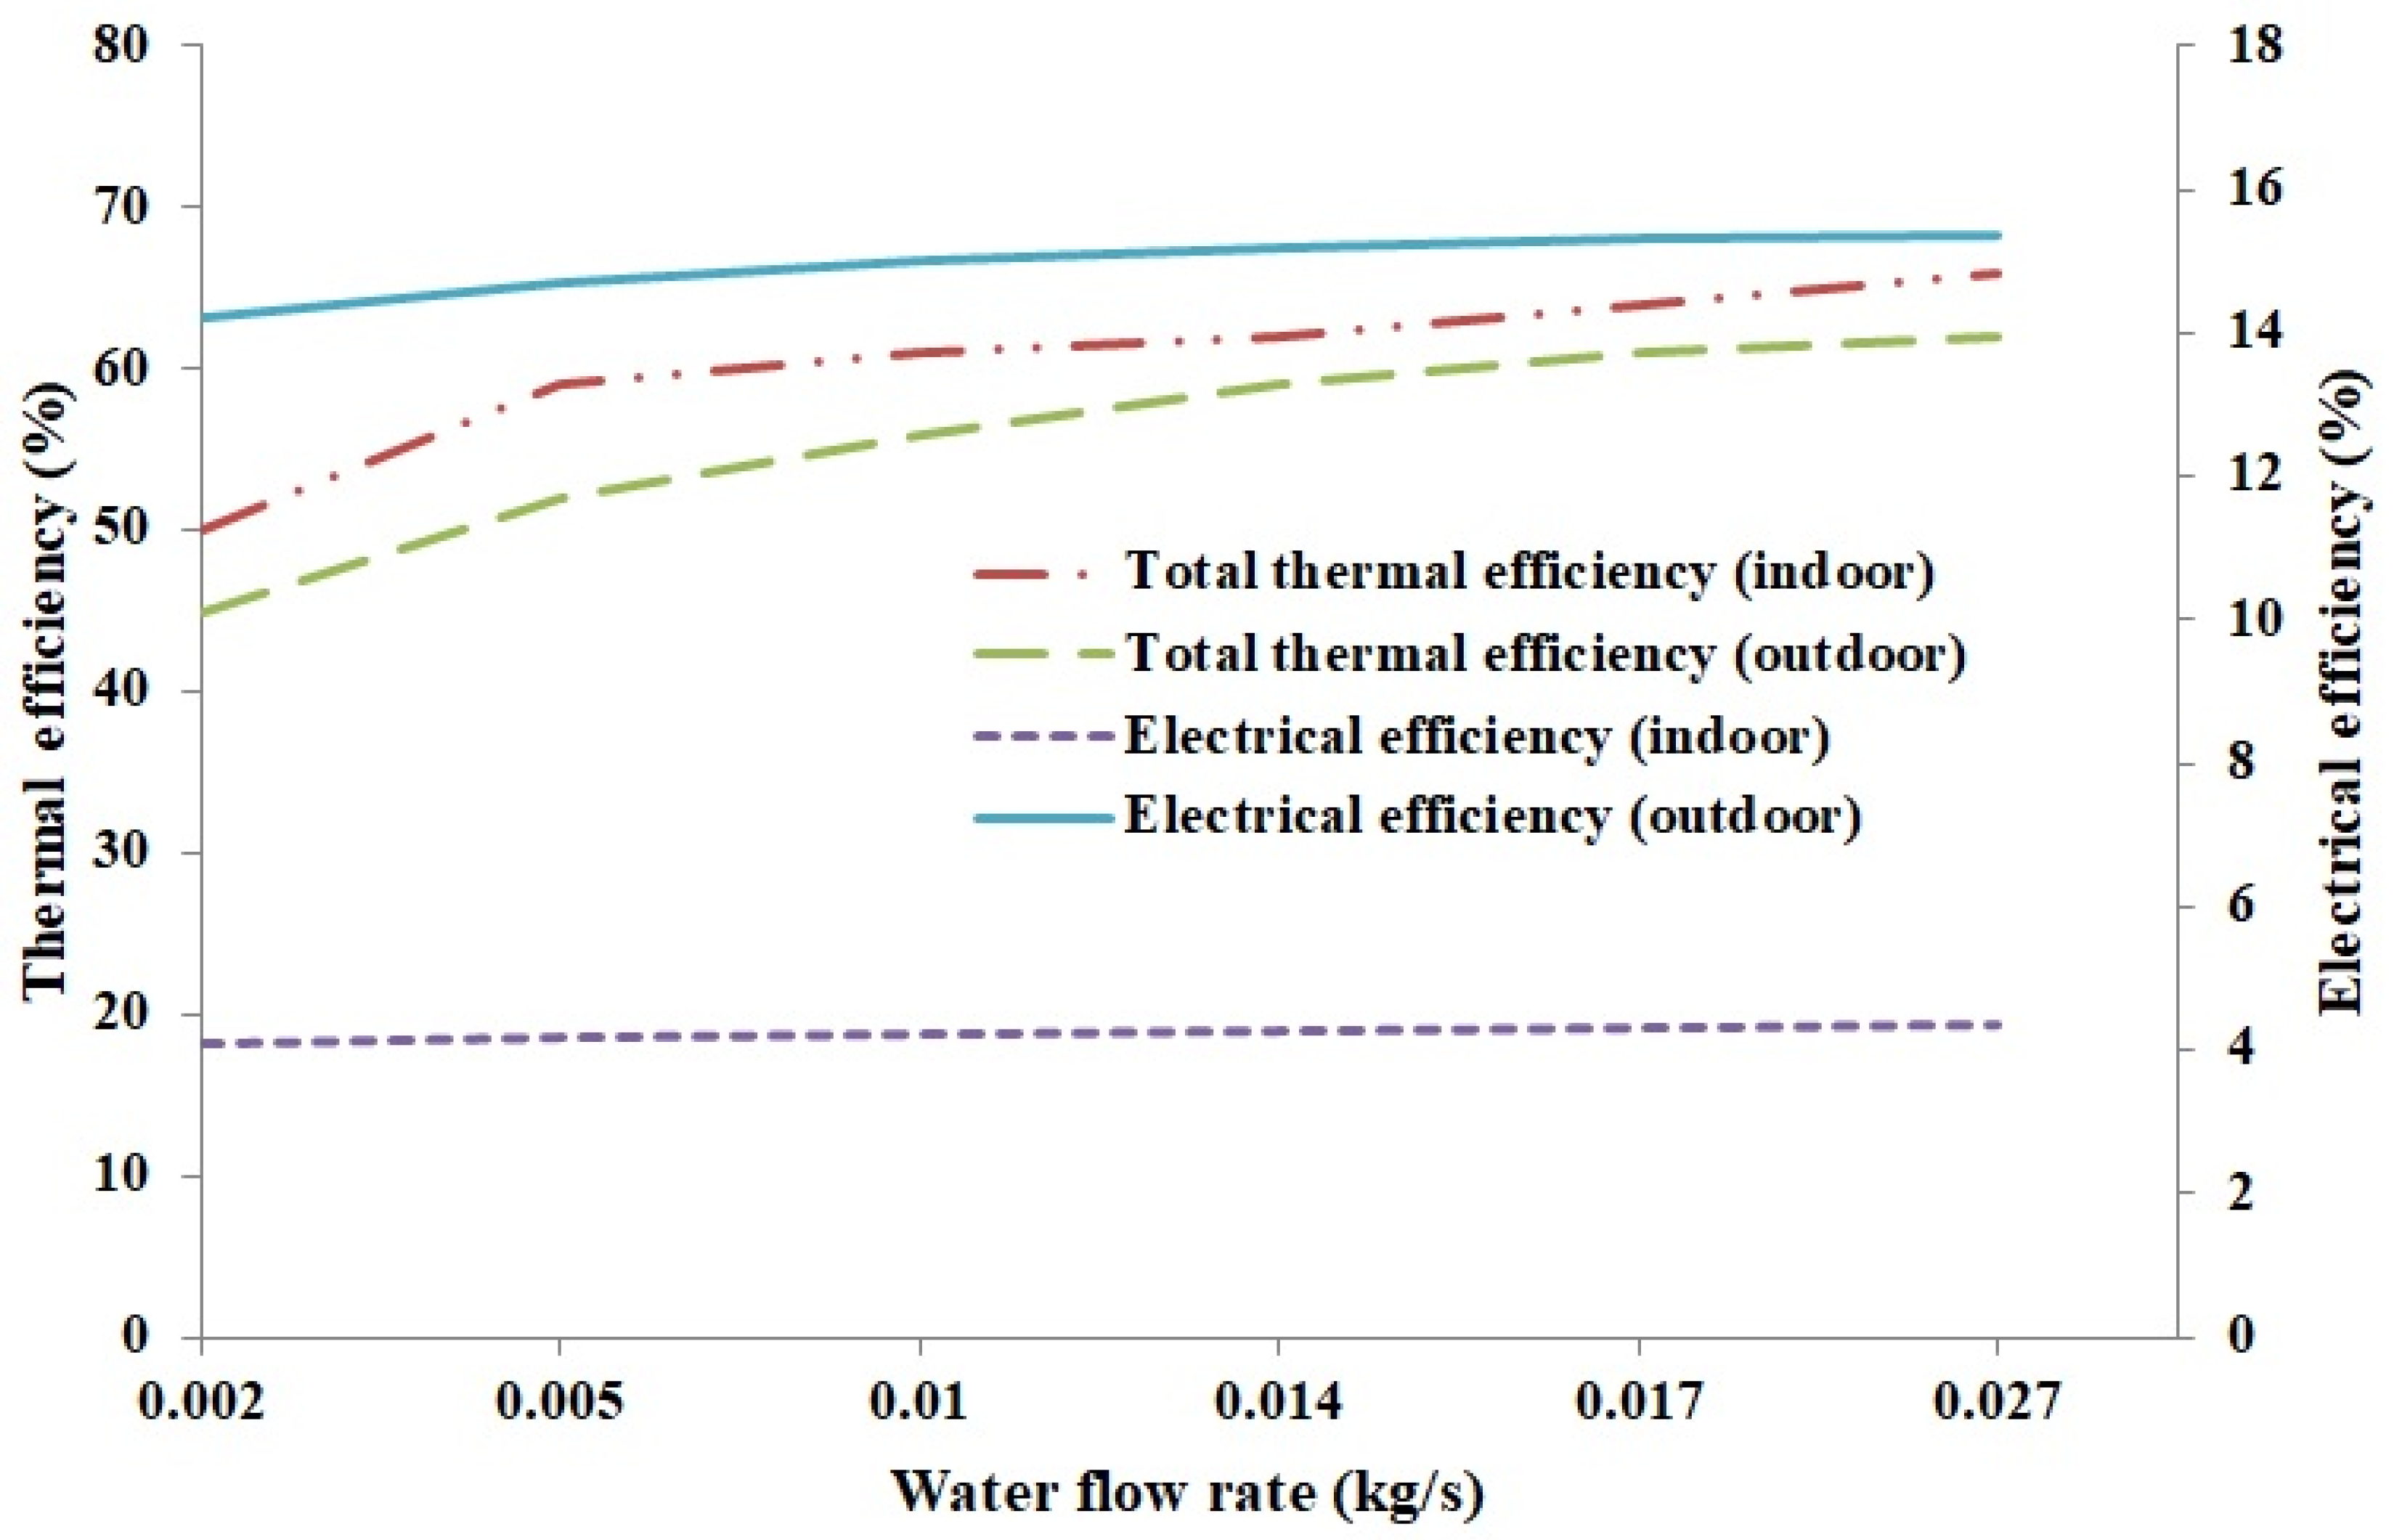
4.1. Comparison of Indoor and Outdoor-Based Testing

Under indoor experimental conditions, the solar simulator produces a light that has color temperature of 3400 K or less, while the actual color temperature of the sunlight spectrum is 5900 K. Therefore, the transient temperature responses across the collector components can only be evaluated precisely when the system is subjected to outdoor testing conditions. Therefore, the outdoor performance tests of a dual-PV/T system were carried out in comparison with indoor test conditions. Indoor test data for an identical system published by Jarimi et al. [13] was considered for comparison. Figure 6 shows the indoor and outdoor experimental analysis of the dual-PV/T system during simultaneous operation of water and air under a radiation intensity by solar simulator of 700 W/m2, and by sunlight of 700 ± 50 W/m2. Following the similar operational conditions, the water flow rate increased from 0.002 kg/s to 0.027 kg/s at constant air flow rate of 0.026 kg/s. The indoor and outdoor experimental total thermal efficiency increased from 50% to 66% and 45% to 62%, respectively, while indoor and outdoor electrical efficiencies increased from 4.1% to 4.36% and 14.2% to 15.3%, respectively. A significant discrepancy between indoor and outdoor test findings was observed in particular in electrical efficiency, even though the given data curves follow a similar pattern, but the difference between indoor and outdoor data was found to be notably high. As expected, due to weaker blue and UV radiation portions in light produced by indoor solar simulator, the electrical characteristics were greatly affected. Thus, results in a lower electrical efficiency, meanwhile, the outdoor thermal efficiency was slightly higher than that of indoor thermal efficiency of the dual-PV/T system.

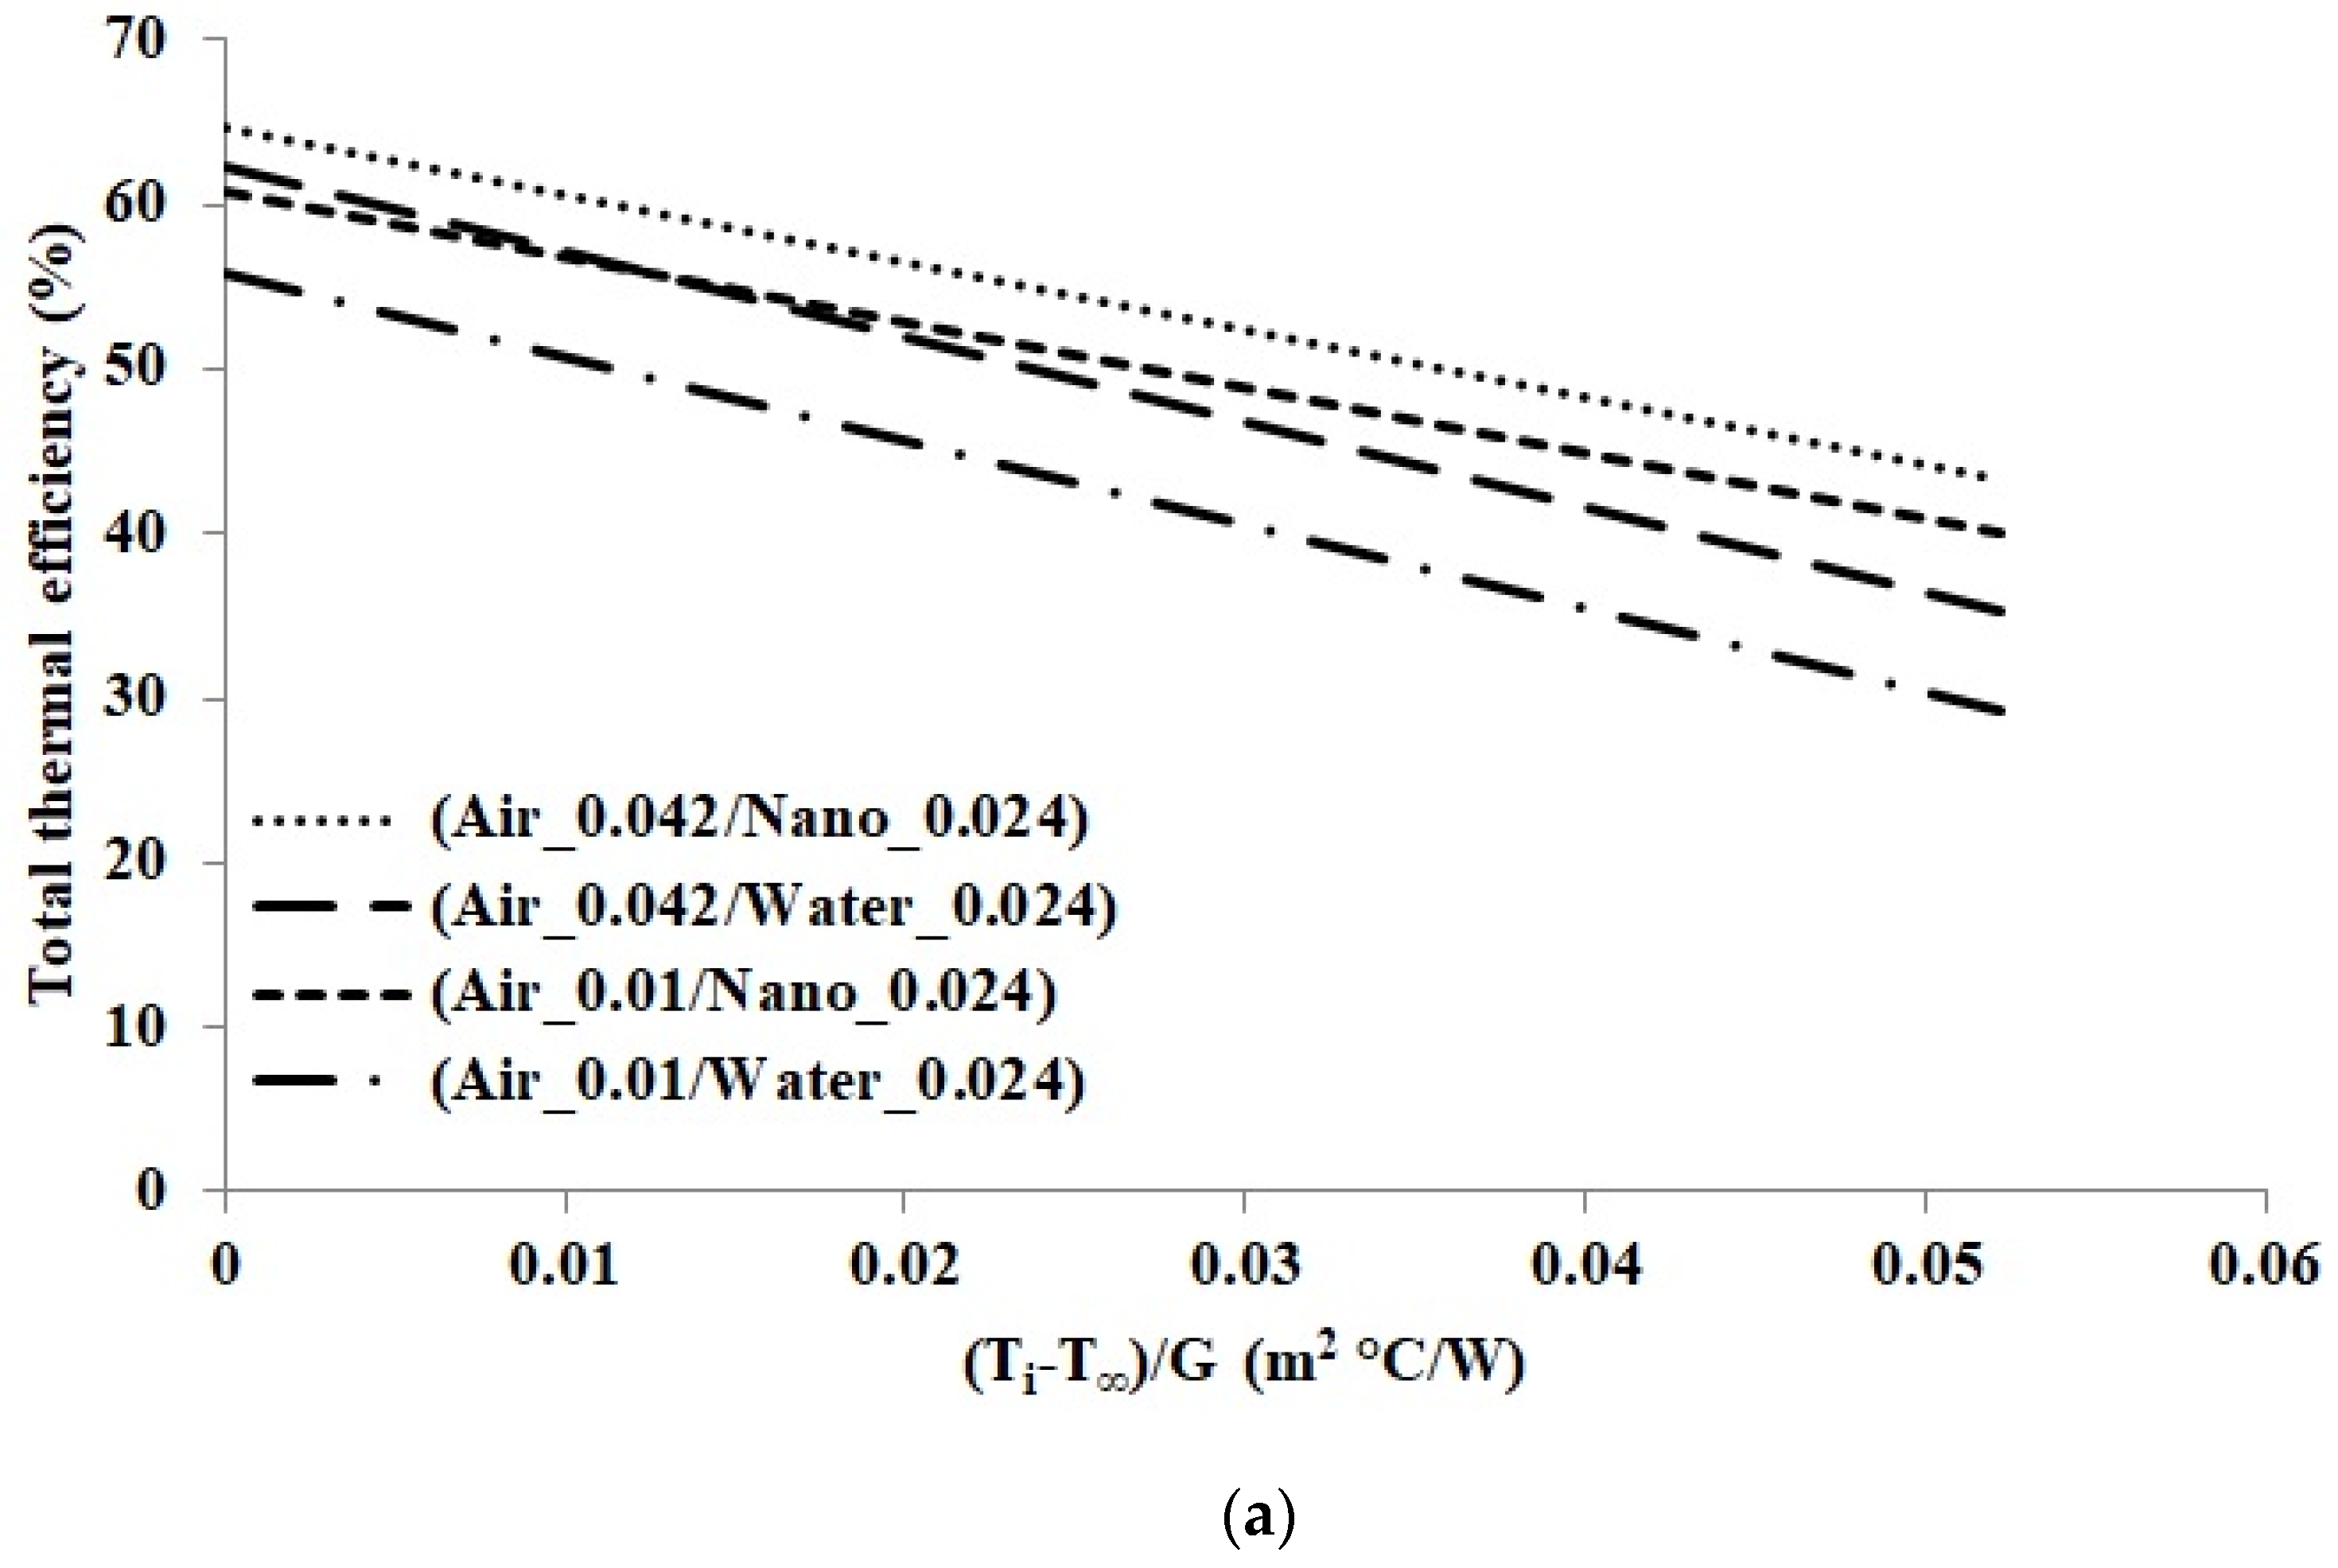
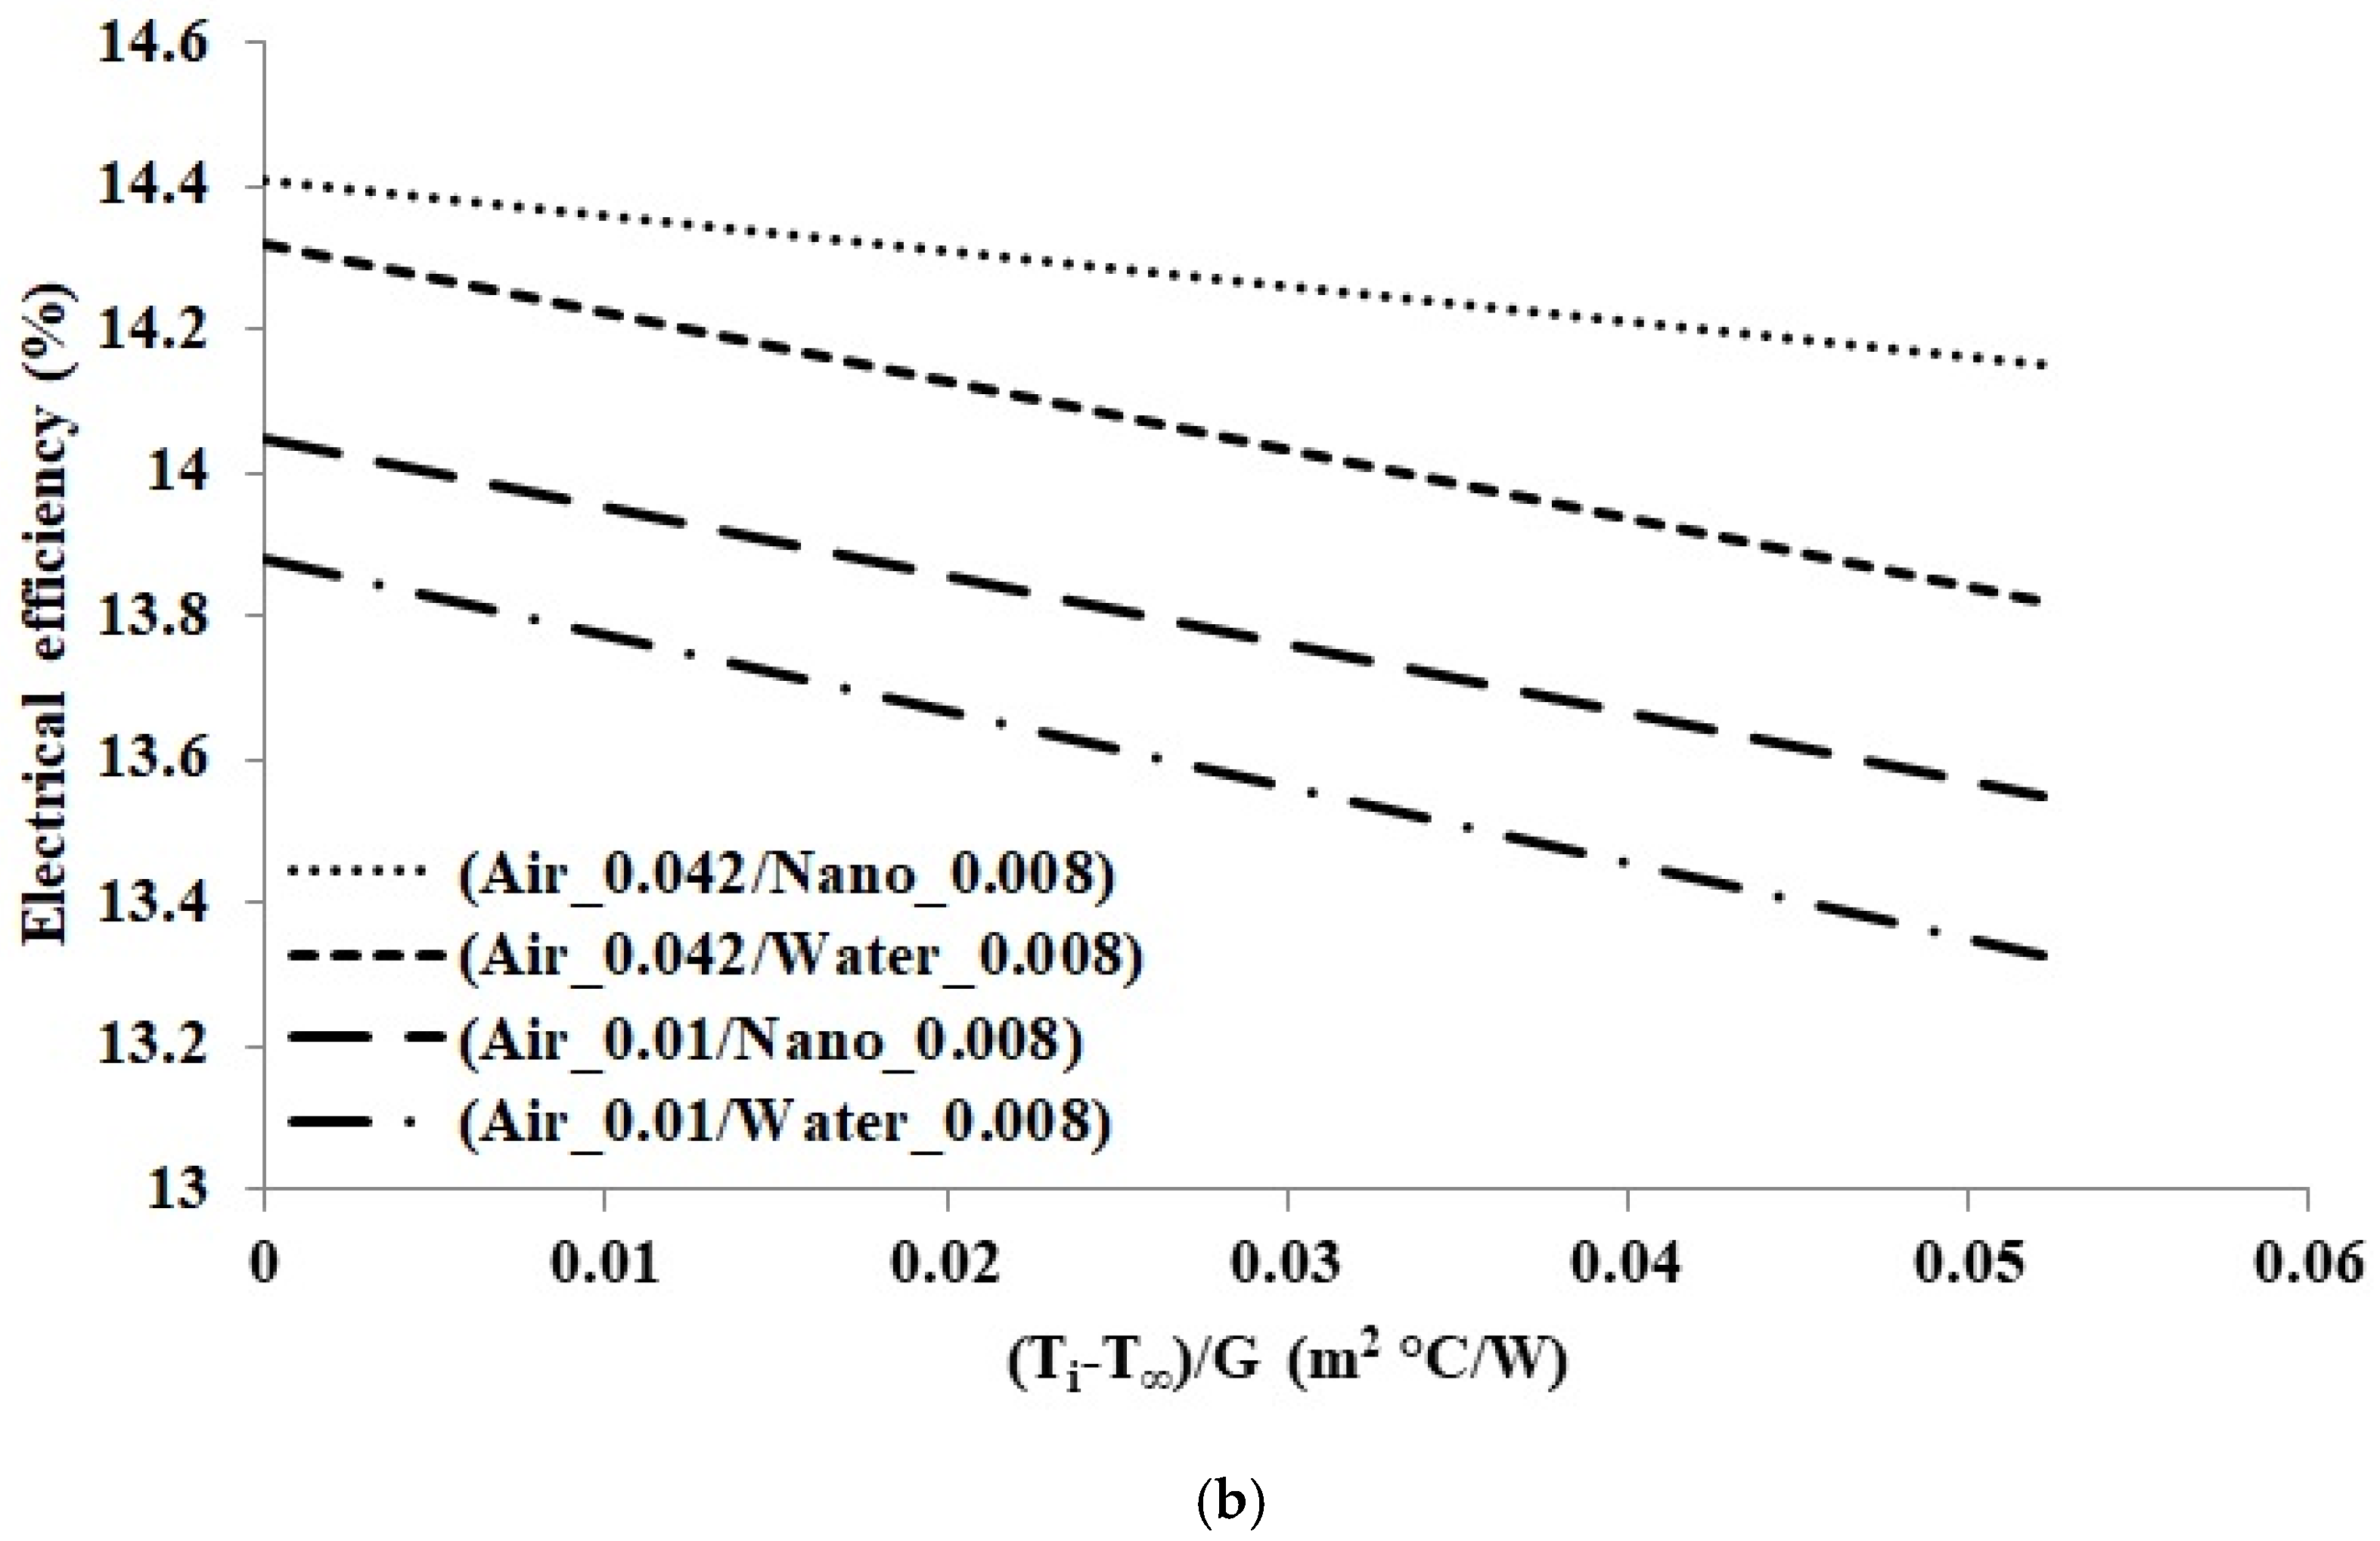
4.2. Outdoor Performance Evaluation

It is commonly understood that the thermo-physical properties of both solvent and suspended nanometer size particles influence the heat transfer characteristics of the resultant suspension. Mass fractions of nanoparticles in a base fluid have a major influence on the thermal-physical properties (thermal conductivity, density, viscosity) of a nanofluid, therefore determining the correct mixing ratio of colloidal solution or nanofluid is very important. The present study mainly focused on an experimental investigation of dual-fluid (nanofluid plus air) application for PV/T technology. Therefore, to avoid repetition of work, the information regarding selection of CuO as nanoparticles with an optimal mass fraction of 1% in deionized water as a base fluid has been taken from the literature, as suggested by [29]. Following the instructions reported by [29] and other researchers [28,30], a colloidal solution of CuO in deionized water was prepared as explained in Section 3.5. For detailed information on the examination of thermo-physical properties, please refer to [29].
Furthermore, it is important to estimate the exact percentage of the thermal contribution of each fluid when both heat transfer fluids are to be operated simultaneously. Since they are not in contact with each other, but the performance of both heat exchangers is directly associated with each other, investigating the interdependence of the thermal response of each fluid with respect to the system’s performance is worthwhile. The optimum flow rate of nanofluid or water is tracked when the air flow rate is kept constant in laminar, transition, and turbulent flow regions, and vice versa. Considering the design of the dual-fluid PV/T system, laminar, transition, and turbulent flow rates for the nanofluid or water are 0.008 kg/s (Re = 1590), 0.016 kg/s (Re = 3100), and 0.024 kg/s (Re = 4700), respectively, and for air the laminar, transition, and turbulent flow rates are 0.01 kg/s (Re = 1900), 0.028 kg/s (Re = 5500), and 0.042 kg/s (Re = 8300), respectively. The optimal output from the dual-fluid PV/T system is determined when the flow rate of either fluid is fixed in the laminar, transition, and turbulent flow regimes, while varying the second fluid from the laminar to turbulent flow regimes against each flow regime of the first fluid, and vice versa.
The performance of the PV/T system using dual-fluid and single-fluid as coolants is studied. Following the ISO standards, the experimental results based on fluids with different operational modes (laminar, transitional, and turbulent) at fixed inlet temperatures are presented in Table 4. The thermal and electrical performance of the PV/T using nanofluid plus air as a dual-fluid system was compared with water plus air, as well as individual fluid operational modes. During the experimentation temperatures were recorded every 10 s, and then averaged over the period when the collector’s components achieved a steady state condition. The thermal and electrical energy outputs of the PV/T system using nanofluid/air were higher than all other presented flow schemes. It was also observed that, in simultaneous fluid operation, the fluid with an increasing flow rate extracted more heat than its counterpart; however, due to its excellent thermal conductivity, the nanofluid performed outstandingly well both at low and high Reynolds number flows.
As illustrated in Figure 7 and Figure 8, the total thermal efficiency (sum of nanofluid or water and air) is calculated under simultaneous modes of fluid operation, i.e., fixed nanofluid or water flow rate and variable air flow. Based on the temperature difference between the inlet fluid and ambient air, the total thermal and electrical efficiencies were further analyzed by fixing nanofluid/air and water/air flow combinations in laminar and turbulent flow regimes. The maximum and minimum thermal efficiencies at reduced zero temperature for nanofluid/air flow combinations of 0.008/0.01 kg/s and 0.024/0.042 kg/s were 44.5% and 67.7%, respectively. For the same flow rates, the maximum and minimum thermal efficiencies at zero reduced temperature for water/air were 39.1% and 59.8%, respectively. Furthermore, the maximum electrical efficiency at reduced zero temperature for the nanofluid plus air and water plus air were found to be 15.69% and 14.41%, respectively. It was observed that in simultaneous fluid operation, the fluids with increasing flow rates usually extracted more energy than the fluids at fixed flow rates. It is worth noting that the total thermal and electrical efficiencies achieved with nanofluid plus air was notably higher than that of the water plus air case. The utilization of a nanofluid provides an alternative to water for minimizing the PV module temperature, thus enhancing the thermal performance.
In order to analyze the real time performance of a dual-fluid PV/T system, the daily variations of the electrical characteristics such as short circuit current, open circuit voltage, current, and voltage at the maximum power point were recorded during experimentation. Generally, voltage is more affected by the PV layer temperature than current is; therefore, utilization of different modes of fluid operation for the cooling of PV solar cells generates different electrical power outputs. The average temperature of the PV module and electric current vary directly with the irradiance, whereas the open circuit voltage decreases as the average temperature of the module increases. For the same irradiance of 850 W/m2 with a maximum deviation of 50 W/m2 and fixed air and water or nanofluid flow rates of 0.04 kg/s and 0.024 kg/s, respectively, the effects of simultaneous and individual fluid operations on the electric current and power are presented in Figure 9 and Figure 10. In the case of the dual-fluid as a coolant, increases in the open circuit voltage and electrical power were observed; however, the nanofluid in combination with air provided marginally better performance than water plus air. The aforementioned improvements in voltage and power in particular for the nanofluid plus air can be interpreted as a reward of smaller parasitic resistance. Therefore, an increase in the open circuit voltage will result in an increase in the maximum power point. These positive changes may also be associated with temperature uniformity across the PV module. It is concluded that the dual-fluid heat exchanger is an effective electricity enhancement technique, but the nanofluid plus air provided the highest value. This is attributed to the larger surface area of the dual-fluid and the superior thermo-physical properties of the nanofluid. Most importantly, the nanofluid performs even better under high operating temperature.
Generally, the thermal conductance between the PV layer and absorber metal plate is solely dependent on the thermal conductivity of the adhesive or silicon paste used to attach them directly. However, the selection of appropriate circulating fluids and correct operating conditions are also equally important in the context of extracting accumulated heat from the PV and absorber layers. Under a wide range of outdoor conditions, the PV temperature can be used to assess the heat conductance rate across the PV/T system. The measured PV temperatures using nanofluid plus air, water plus air, nanofluid, water, and air were plotted against fluid inlet temperatures, as shown in Figure 11. As expected, using simultaneous fluid operation, the PV layer temperature was lower compared to the results obtained with single-fluid-based coolants. However, the PV/T system with nanofluid/air coolant showed a lowest PV temperature that is almost 12 °C lower than that of the air type PV/T system. A low PV temperature brings about further benefits such as improvement in electrical efficiency and mitigated long-term performance reduction.
The previously tracked optimum flow rates for air, water, and nanofluid are used to calculate the primary energy savings efficiency of the PV/T system. When the air flow rate is set to vary between 0 to 0.055 kg/s at fixed nanofluid flow rates of 0.008 kg/s, 0.016 kg/s, and 0.024 kg/s, the primary energy savings efficiency using the nanofluid plus air varies from 73.3% to 78.8%, 78.6% to 83.8%, and 86.6% to 91.1%, respectively. Similarly, under the aforementioned flow rate conditions, the primary energy savings efficiency for water plus air varies from 71.2% to 75.3%, 74.8% to 81.7%, and 82.8% to 86.4%, respectively, as shown in Figure 12. However, using nanofluid plus air as a dual-fluid system, the primary energy savings efficiency of the PV/T system was notably higher than that of the case of water plus air. These findings can be interpreted as an effect of frequent random motion of nanoparticles and micro-convection in the nanofluid, which in turn augment heat transfer even at elevated temperature.
In the case of a dual-fluid heat exchanger, the heat removal performance or percentage contribution of each fluid can be described in terms of temperature rise. Figure 13 shows that under simultaneous fluid operation the temperature rise of both circulating fluids decreases when either of the fluids is set to vary for a specific flow range at a constant flow rate of its counterpart. When air is circulated in a range of 0–0.05 kg/s at fixed nanofluid flow rates of 0.008 kg/s (laminar) and 0.024 kg/s (turbulent), the temperature rises achieved by the nanofluid and air were 9.4–4.2 °C and 13.5–9.1 °C, and 12.3–7.5 °C and 8.5–3.2 °C, respectively. Under similar conditions when water is replaced by the nanofluid, temperature increases for water and air were 7.5–2.9 °C and 11.8–6.7 °C; 10.5–5.5 °C and 6.6–2.1 °C, respectively. It should be noted that even at a low flow rate the nanofluid can produce a large rise in temperature, hence lower PV temperature compared to water, which means the circulating pump requires low power input to satisfy the load requirements. Furthermore, the temperature rise for both the nanofluid and water is smaller than that of air. Due to its lower heat capacity the air showed a higher temperature rise in both cases. However, the overall rise in temperature using the nanofluid plus air is superior to the water plus air case.

5. Conclusions

In order to evaluate the potential benefits of CuO nanofluid and air as a dual-fluid coolant for the PV/T system, an outdoor steady state testing method was adapted. The measure of discrepancies between the outdoor and indoor test results were calculated by comparing the identical dual-fluid PV/T systems under similar operational conditions. Different modes of fluid operations were investigated including, nanofluid/air, water/air, nanofluid, water, and air. Compared to conventional fluids such as water/air or either one, the nanofluid/air showed a significant improvement in the thermal performance of the PV/T system. The maximum primary energy savings efficiency of the PV/T system using nanofluid/air and water/air was 91.6% and 85.4%, respectively. During simultaneous mode of fluid operation, even at the lowest flow rates of 0.008 kg/s for nanofluid and 0.01 kg/s for the air, the overall efficiency of the PV/T system was almost twice higher than that of an air-based only PV/T system. The electrical efficiency from the outdoor based PV/T testing was almost four times higher than that of indoor based testing. Discrepancies in the electrical efficiency calculated with indoor and outdoor-based testing would be helpful to the researchers for estimating the exact performance of the PV/T system. Furthermore, for a dual-fluid PV/T system, when only air is utilized at stagnant nanofluid or water, the trapped liquid-fluid in the copper tubes nanofluid in particular acts as a heat booster, and starts supplementing additional heat to the circulating air, which ultimately results in high air temperature, unlike the case of a conventional solar air heater. High accuracy heating/cooling units to control both the temperatures of both fluids, an electromagnetic flow meter for precise flow control, and triple-calibrated instruments would guarantee the authenticity of the results. The nanofluid powered dual-fluid PV/T system has energy advantages, and could be a valuable solution for buildings having a high ratio of energy demand to limited surface area.

Author Contributions

Conceptualization, M.I.H.; methodology, M.I.H.; formal analysis, M.I.H.; investigation, M.I.H.; resources, J.-T.K.; data curation, M.I.H.; writing—original draft preparation, M.I.H.; writing—review and editing, J.-T.K. and G.-H.L.; visualization, J.-T.K. and G.-H.L.; supervision, J.-T.K.; project administration, J.-T.K.; funding acquisition, J.-T.K. All authors have read and agreed to the published version of the manuscript.

Funding

This work was supported by the Korea Institute of Energy Technology Evaluation and Planning (KETEP) and the Ministry of Trade, Industry & Energy (MOTIE) of the Republic of Korea (No. 20188550000480); Korea Institute of Planning and Evaluation for Technology in Food, Agriculture and Forestry (IPET) through Technology Commercialization Support Program, funded by Ministry of Agriculture, Food and Rural Affairs (MAFRA) (No. 821048-3).

Institutional Review Board Statement

Not applicable.

Informed Consent Statement

Not applicable.

Data Availability Statement

Not applicable.

Conflicts of Interest

The authors declare no conflict of interest. The funders had no role in the design of the study; in the collection, analyses, or interpretation of data; in the writing of the manuscript, or in the decision to publish the results.

Nomenclature

m . mass flow rate (kg/s)
c f specific heat of the fluid (J/kg °C)
c a specific heat of air (J/kg °C)
c n specific heat of nanofluid (J/kg °C)
T i fluid inlet temperature (°C)
T o u t fluid outlet temperature (°C)
T a , i air inlet temperature (°C)
T a , o air outlet temperature (°C)
T n , i nanofluid inlet temperature (°C)
T n , o nanofluid outlet temperature (°C)
T ambient air temperature (°C)
F r heat removal factor
U L overall heat loss coefficient (W/m2 °C)
A c collector surface area (m2)
G solar radiation (W/m2)
Q u useful power (W)
Q u , b i useful power produced by dual-fluid (W)
P e l electric power (W)
I m a x max current (A)
I s c short-circuit current (A)
V m a x max voltage (V)
V o c open circuit voltage (V)
F F filling factor
R e Reynolds number
W & d width and depth of the air channel (m)
D h hydraulic diameter of the pipe (m)
Greek letter
w n p   &   ρ n p mass (kg) and density (kg/m3) of nanoparticles
w b f   &   ρ b f mass (kg) and density (kg/m3) of base-fluid
τ transmissivity of glass
α absorptivity of PV solar cells
ϕ volume concentration
ŋ efficiency
ŋ e l electric efficiency
ŋ b i dual-fluid PV/T efficiency
ŋ t o t primary energy savings efficiency
ŋ p p power plant conversion efficiency

References

  1. Qiu, Z.; Ma, X.; Zhao, X.; Li, P.; Ali, S. Experimental investigation of the energy performance of a novel Micro-encapsulated Phase Change Material (MPCM) slurry based PV/T system. Appl. Energy 2016, 165, 260–271. [Google Scholar] [CrossRef]
  2. Aberoumand, S.; Ghamari, S.; Shabani, B. Energy and exergy analysis of a photovoltaic thermal (PV/T) system using nanofluids: An experimental study. Sol. Energy 2018, 165, 167–177. [Google Scholar] [CrossRef]
  3. Al-Waeli, A.H.; Sopian, K.; Chaichan, M.T.; Kazem, H.A.; Ibrahim, A.; Mat, S.; Ruslan, M.H. Evaluation of the nanofluid and nano-PCM based photovoltaic thermal (PVT) system: An experimental study. Energy Convers. Manag. 2017, 151, 693–708. [Google Scholar] [CrossRef]
  4. Ebaid, M.S.; Ghrair, A.M.; Al-Busoul, M. Experimental investigation of cooling photovoltaic (PV) panels using (TiO2) nanofluid in water-polyethylene glycol mixture and (Al2O3) nanofluid in water-cetyltrimethylammonium bromide mixture. Energy Convers. Manag. 2018, 155, 324–343. [Google Scholar] [CrossRef]
  5. Huang, W.; Marefati, M. Energy, exergy, environmental and economic comparison of various solar thermal systems using water and Thermia Oil B base fluids, and CuO and Al2O3 nanofluids. Energy Rep. 2020, 6, 2919–2947. [Google Scholar] [CrossRef]
  6. Manigandan, S.; Kumar, V. Comparative study to use nanofluid ZnO and CuO with phase change material in photovoltaic thermal system. Int. J. Energy Res. 2019, 43, 1882–1891. [Google Scholar] [CrossRef]
  7. Muzaidi, N.A.S.; Fikri, M.A.; Wong, K.N.S.W.S.; Sofi, A.Z.M.; Mamat, R.; Adenam, N.M.; Yunin, M.Y.A.M.; Adli, H.K. Heat absorption properties of CuO/TiO2/SiO2 trihybrid nanofluids and its potential future direction towards solar thermal applications. Arab. J. Chem. 2021, 14, 103059. [Google Scholar] [CrossRef]
  8. Pattanayak, B.; Mund, A.; Jayakumar, J.; Parashar, K.; Parashar, S.K. Estimation of Nusselt number and effectiveness of double-pipe heat exchanger with Al2O3–, CuO–, TiO2–, and ZnO–water based nanofluids. Heat Transf. 2020, 49, 2228–2247. [Google Scholar] [CrossRef]
  9. Alkasmoul, F.S.; Al-Asadi, M.; Myers, T.; Thompson, H.; Wilson, M. A practical evaluation of the performance of Al2O3-water, TiO2-water and CuO-water nanofluids for convective cooling. Int. J. Heat Mass Transf. 2018, 126, 639–651. [Google Scholar] [CrossRef] [Green Version]
  10. Minea, A.; Moldoveanu, M. Studies on Al2O3, CuO, and TiO2 water-based nanofluids: A comparative approach in laminar and turbulent flow. J. Eng. Thermophys. 2017, 26, 291–301. [Google Scholar] [CrossRef]
  11. Du, M.; Tang, G.; Wang, T. Exergy analysis of a hybrid PV/T system based on plasmonic nanofluids and silica aerogel glazing. Sol. Energy 2019, 183, 501–511. [Google Scholar] [CrossRef]
  12. Abu Bakar, M.N.; Othman, M.; Hj Din, M.; Manaf, N.A.; Jarimi, H. Design concept and mathematical model of a bi-fluid photovoltaic/thermal (PV/T) solar collector. Renew. Energy 2014, 67, 153–164. [Google Scholar] [CrossRef]
  13. Jarimi, H.; Bakar, M.N.A.; Othman, M.; Din, M.H. Bi-fluid photovoltaic/thermal (PV/T) solar collector: Experimental validation of a 2-D theoretical model. Renew. Energy 2016, 85, 1052–1067. [Google Scholar] [CrossRef]
  14. Heris, S.Z.; Etemad, S.G.; Esfahany, M.N. Experimental investigation of oxide nanofluids laminar flow convective heat transfer. Int. Commun. Heat Mass Transf. 2006, 33, 529–535. [Google Scholar] [CrossRef]
  15. Menbari, A.; Alemrajabi, A.A.; Rezaei, A. Heat transfer analysis and the effect of CuO/Water nanofluid on direct absorption concentrating solar collector. Appl. Therm. Eng. 2016, 104, 176–183. [Google Scholar] [CrossRef]
  16. Karami, M.; Akhavan-Bahabadi, M.; Delfani, S.; Raisee, M. Experimental investigation of CuO nanofluid-based direct absorption solar collector for residential applications. Renew. Sustain. Energy Rev. 2015, 52, 793–801. [Google Scholar] [CrossRef]
  17. Chen, M.; He, Y.; Ye, Q.; Zhang, Z.; Hu, Y. Solar thermal conversion and thermal energy storage of CuO/Paraffin phase change composites. Int. J. Heat Mass Transf. 2019, 130, 1133–1140. [Google Scholar] [CrossRef]
  18. Bellos, E.; Tzivanidis, C. Multi-criteria evaluation of a nanofluid-based linear Fresnel solar collector. Sol. Energy 2018, 163, 200–214. [Google Scholar] [CrossRef]
  19. Venkitaraj, K.; Suresh, S.; Praveen, B.; Nair, S.C. Experimental heat transfer analysis of macro packed neopentylglycol with CuO nano additives for building cooling applications. J. Energy Storage 2018, 17, 1–10. [Google Scholar] [CrossRef]
  20. Malekan, M.; Khosravi, A.; Syri, S. Heat transfer modeling of a parabolic trough solar collector with working fluid of Fe3O4 and CuO/Therminol 66 nanofluids under magnetic field. Appl. Therm. Eng. 2019, 163, 114435. [Google Scholar] [CrossRef]
  21. Mustafa, J.; Alqaed, S.; Kalbasi, R. Challenging of using CuO nanoparticles in a flat plate solar collector-Energy saving in a solar-assisted hot process stream. J. Taiwan Inst. Chem. Eng. 2021, 124, 258–265. [Google Scholar] [CrossRef]
  22. Bergman, T.L.; Incropera, F.P.; DeWitt, D.P.; Lavine, A.S. Fundamentals of Heat and Mass Transfer; John Wiley & Sons: New York, NY, USA, 2011. [Google Scholar]
  23. Cengel, Y. Heat and Mass Transfer: Fundamentals and Applications; McGraw-Hill Higher Education: New York, NY, USA, 2014. [Google Scholar]
  24. Chow, T.T.; Pei, G.; Fong, K.; Lin, Z.; Chan, A.; Ji, J. Energy and exergy analysis of photovoltaic–thermal collector with and without glass cover. Appl. Energy 2009, 86, 310–316. [Google Scholar] [CrossRef]
  25. Garg, H.; Adhikari, R.S. System performance studies on a photovoltaic/thermal (PV/T) air heating collector. Renew. Energy 1999, 16, 725–730. [Google Scholar] [CrossRef]
  26. Sardarabadi, M.; Passandideh-Fard, M.; Heris, S.Z. Experimental investigation of the effects of silica/water nanofluid on PV/T (photovoltaic thermal units). Energy 2014, 66, 264–272. [Google Scholar] [CrossRef]
  27. Baljit, S.S.S.; Chan, H.Y.; Audwinto, V.A.; Hamid, S.A.; Fudholi, A.; Zaidi, S.H.; Othman, M.Y.; Sopian, K. Mathematical modelling of a dual-fluid concentrating photovoltaic-thermal (PV-T) solar collector. Renew. Energy 2017, 114, 1258–1271. [Google Scholar] [CrossRef]
  28. Khalifa, A.J.N.; Banwan, M.A. Effect of Volume Fraction of γ-Al2O3 Nanofluid on Heat Transfer Enhancement in a Concentric Tube Heat Exchanger. Heat Transf. Eng. 2015, 36, 1387–1396. [Google Scholar] [CrossRef]
  29. Al-Waeli, A.H.; Chaichan, M.T.; Kazem, H.A.; Sopian, K. Comparative study to use nano-(Al2O3, CuO, and SiC) with water to enhance photovoltaic thermal PV/T collectors. Energy Convers. Manag. 2017, 148, 963–973. [Google Scholar] [CrossRef]
  30. Naik, B.A.K.; Vinod, A.V. Heat transfer enhancement using non-Newtonian nanofluids in a shell and helical coil heat exchanger. Exp. Therm. Fluid Sci. 2018, 90, 132–142. [Google Scholar] [CrossRef]
Figure 1. Dual-fluid PV/T system.
Sustainability 13 13134 g001
Figure 2. Schematic of complete experimental setup.
Sustainability 13 13134 g002
Figure 3. Details heating & cooling units for air and nanofluid or water.
Sustainability 13 13134 g003
Figure 4. Equipment details.
Sustainability 13 13134 g004
Figure 5. Ultrasonic cleaner and colloidal solution of CuO.
Sustainability 13 13134 g005
Figure 6. Comparison of indoor and outdoor test results for variable water flow at fixed air flow of 0.026 kg/s.
Sustainability 13 13134 g006
Figure 7. (a) Total thermal efficiency; (b) electrical efficiency at reduced-zero temperature for variable air flow from 0.01–0.042 kg/s at fixed nanofluid or water flow of 0.024 kg/s.
Sustainability 13 13134 g007aSustainability 13 13134 g007b
Figure 8. (a) Total thermal efficiency; (b) electrical efficiency at reduced-zero temperature for variable air flow from 0.01–0.042 kg/s at fixed nanofluid or water flow of 0.008 kg/s.
Sustainability 13 13134 g008aSustainability 13 13134 g008b
Figure 9. Current-voltage curves for different flow combinations at fixed air and water or nanofluid flow rates of 0.04 kg/s and 0.024 kg/s, respectively.
Sustainability 13 13134 g009
Figure 10. Power-voltage curves for different flow combinations at fixed air and water or nanofluid flow rates of 0.04 kg/s and 0.024 kg/s, respectively.
Sustainability 13 13134 g010
Figure 11. The PV layer temperature for different flow combinations.
Sustainability 13 13134 g011
Figure 12. Primary energy savings efficiency when the air flow is set to vary between 0.005 to 0.055 kg/s at fixed nanofluid or water flow rates of 0.008 kg/s, 0.016 kg/s, and 0.024 kg/s.
Sustainability 13 13134 g012
Figure 13. Temperature rises of (a) nanofluid/air & (b) water/air when air is circulated ranges from 0.005–0.055 kg/s at fixed nanofluid or water flow rates of 0.008 kg/s and 0.024 kg/s.
Sustainability 13 13134 g013
Table 2. Characteristics of the PV module.
Specifications Descriptions
Cell type siliconMono-crystalline
Module size1619 mm ∗ 979 mm
Pmax260 W
Vmp31.6 V
Imp8.23 A
Voc38.1 V
Isc9.27 A
Aperture ratio48% (8 mm holes)
Table 3. Specifications of the CuO nanoparticles.
Specifications of the CuO Nanoparticles
Grain size20–30 nm
Purity99.9%
Density6.48 g/cm3 at 25 °C
Thermal Conductivity33 W/m K
Melting point1326 °C
PH value7 at 20 °C
SupplierHKK Solution South Korea
Table 4. Experimental findings for different flow combinations.
Simultaneous and Individual Fluid Operations (kg/s)Temperature (°C)Energy Input (W/m2)Power (W)
Nanofluid or Water Flow RateAir Flow RateInlet for All FluidsOutlet for Nanofluid or WaterOutlet for AirSolar RadiationTotal ThermalElectrical
Nanofluid
0.0080.012032.935.7957609.99235.3
-0.0282131.8133.48978697.32236.8
-0.0421926.8429.39968706.03238.4
0.0160.011423.1222.72988733.89241.4
-0.0281725.8124.37955778.36243.5
-0.0421320.721.41039900.31244.6
0.0240.012431.9630.31986869.18242.9
-0.0282027.6126.131001915.65247.3
-0.0422431.3130.8910731032.50251.8
0.00802134.95 932486.10240.4
0.01601522.94 950535.58245.8
0.024 01623.36 1050728.15248.2
Water
0.0080.011930.8933.51932520.89233.3
-0.0282129.9232.83920589.52234.6
-0.0421724.9227.49990680.47236.2
0.0160.011826.8225.34936647.77236.7
-0.0282128.5627.36975729.11238.3
-0.0422228.8729.28985772.74240.4
0.0240.012026.9525.58972796.98237.1
-0.0281925.7124.2980805.76239.7
-0.0421722.8222.27985847.75241.3
0.00801830.84 930419.24231.3
0.01602027.56 989502.82232.5
0.024 01722.42 924503.49234.8
00.0119 37.45910181.50213.3
00.02818 32.96958414.12222.5
00.04212 22.881001465.78230.6
Publisher’s Note: MDPI stays neutral with regard to jurisdictional claims in published maps and institutional affiliations.

