Spatiotemporal Trends and Driving Factors of Urban Livability in the Yangtze River Delta Agglomeration
Abstract
:1. Introduction
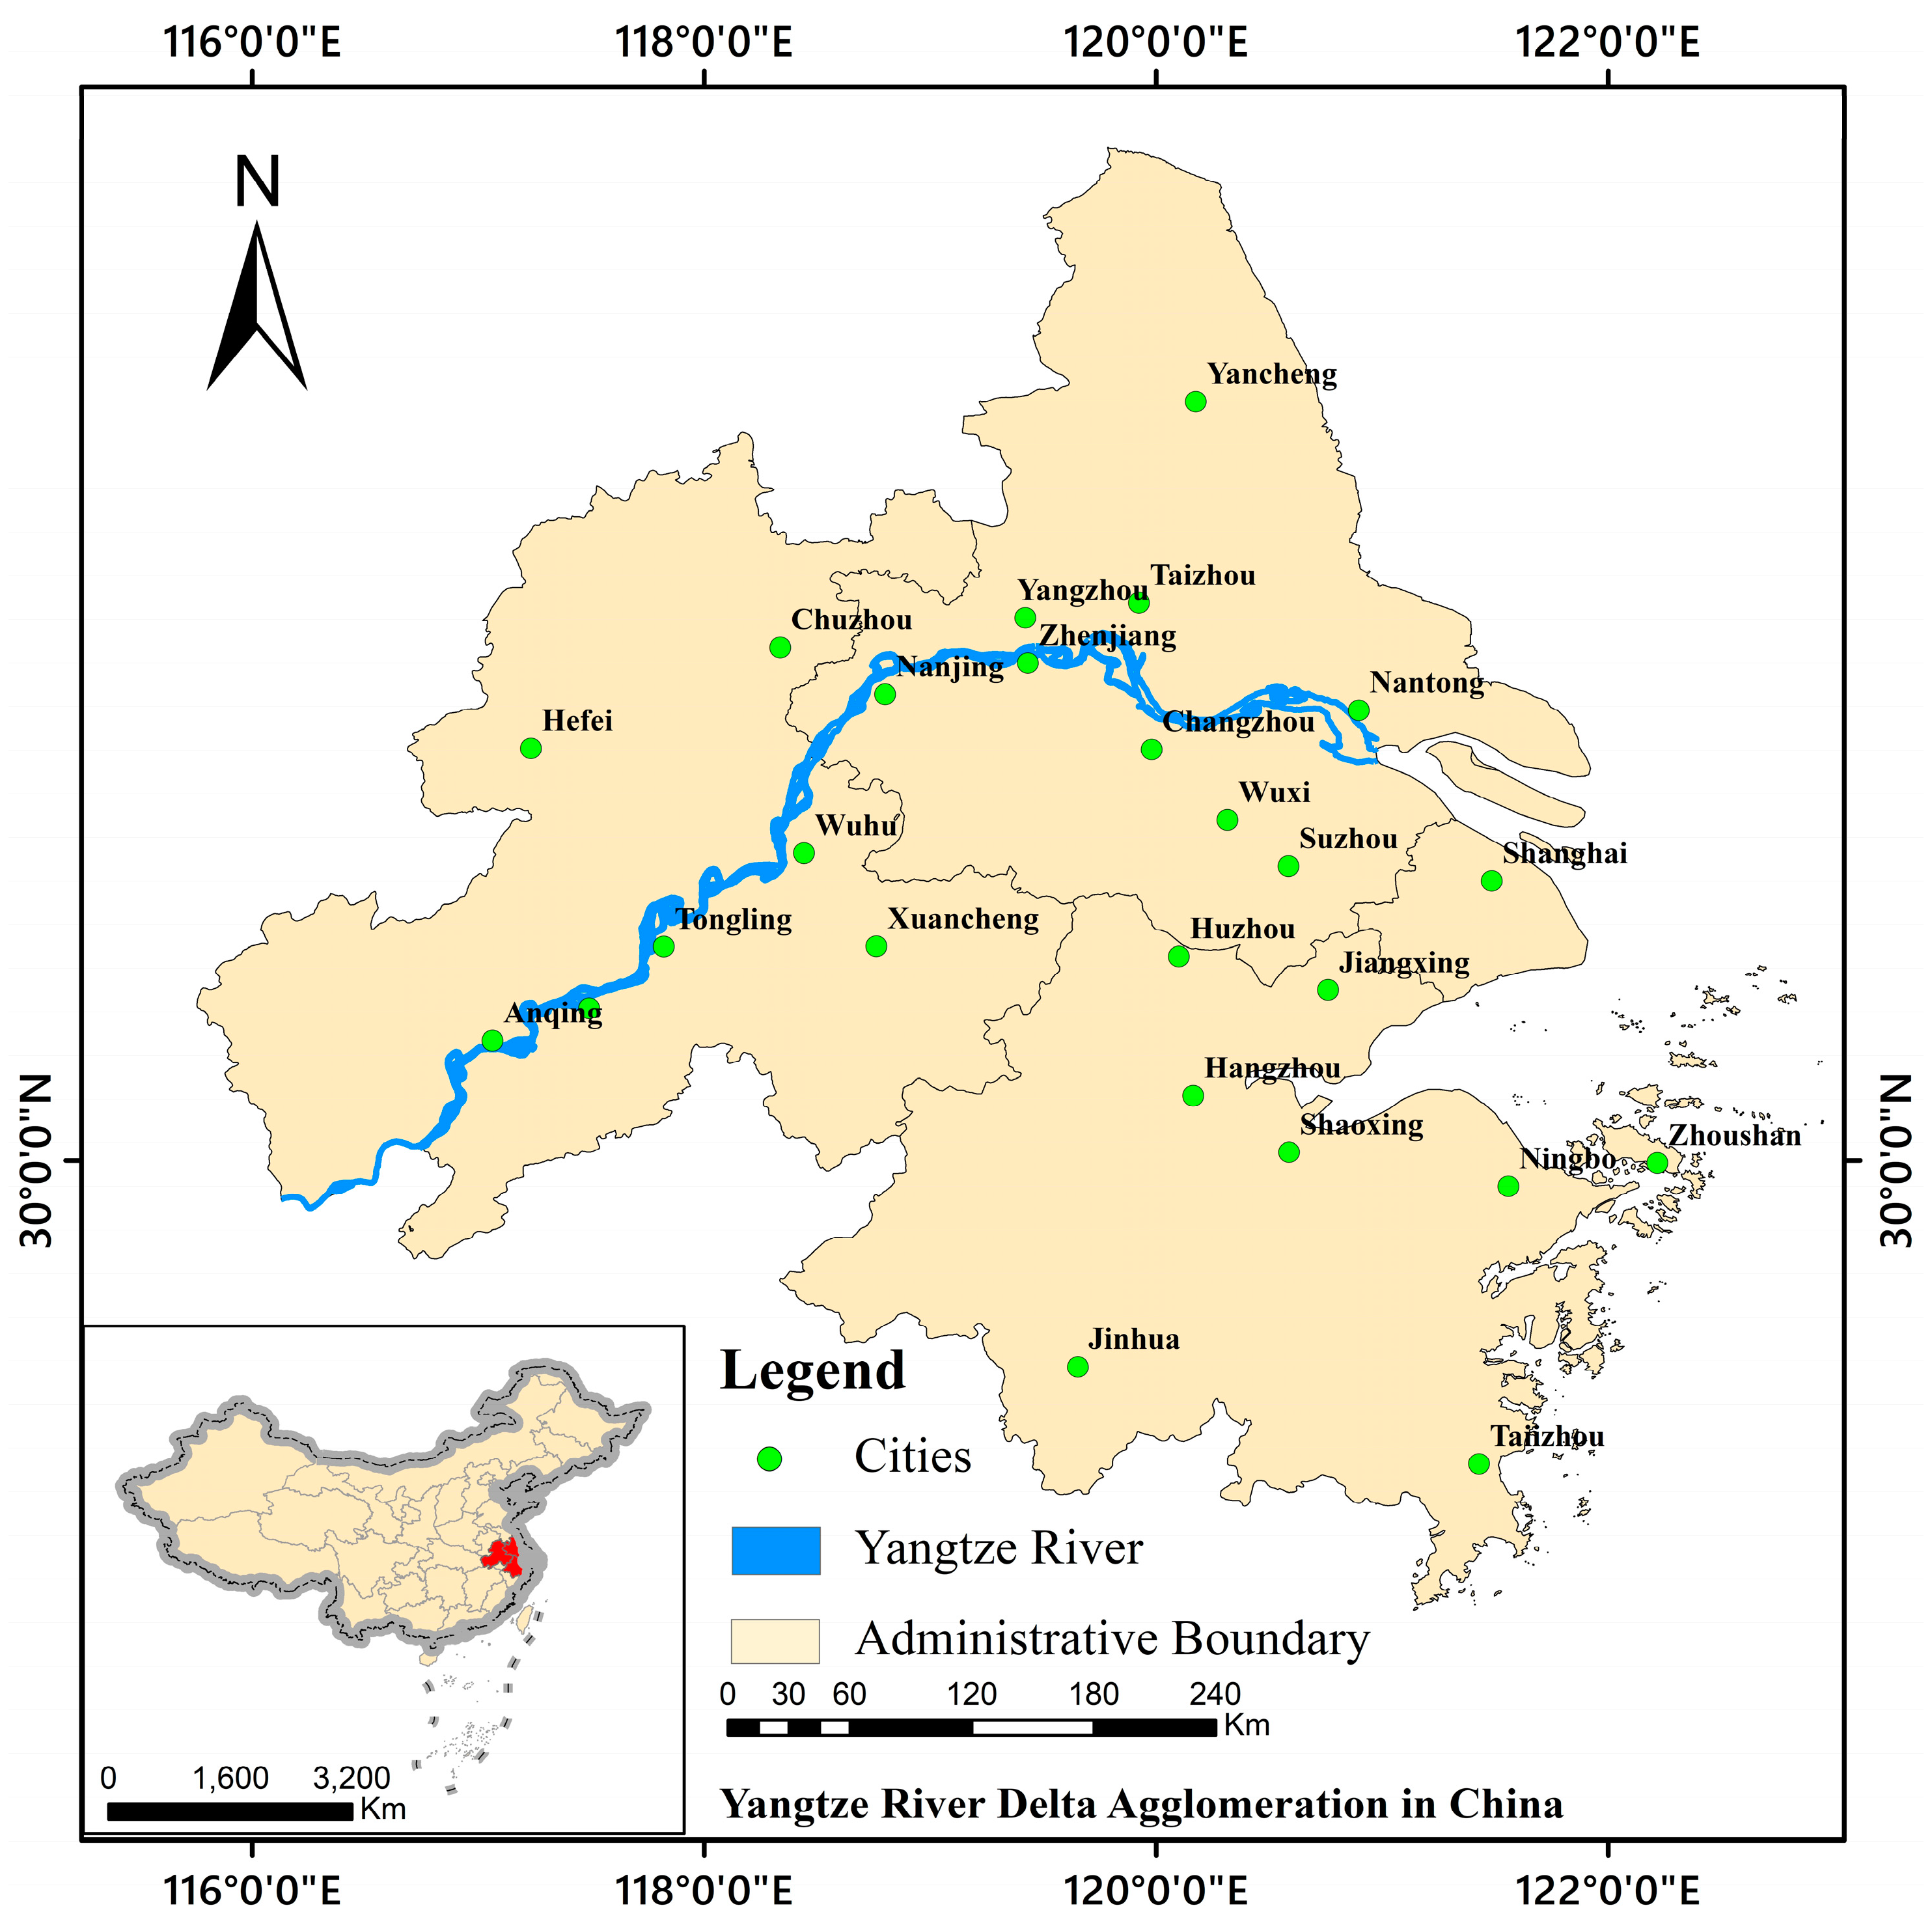
2. Overview of the Study Area
3. Data and Methods
3.1. Index System Construction
3.2. Entropy Method
3.3. ARIMA Model
3.4. Hierarchical Clustering
3.5. Moran’s I
3.6. Data Resources
4. Results and Analysis
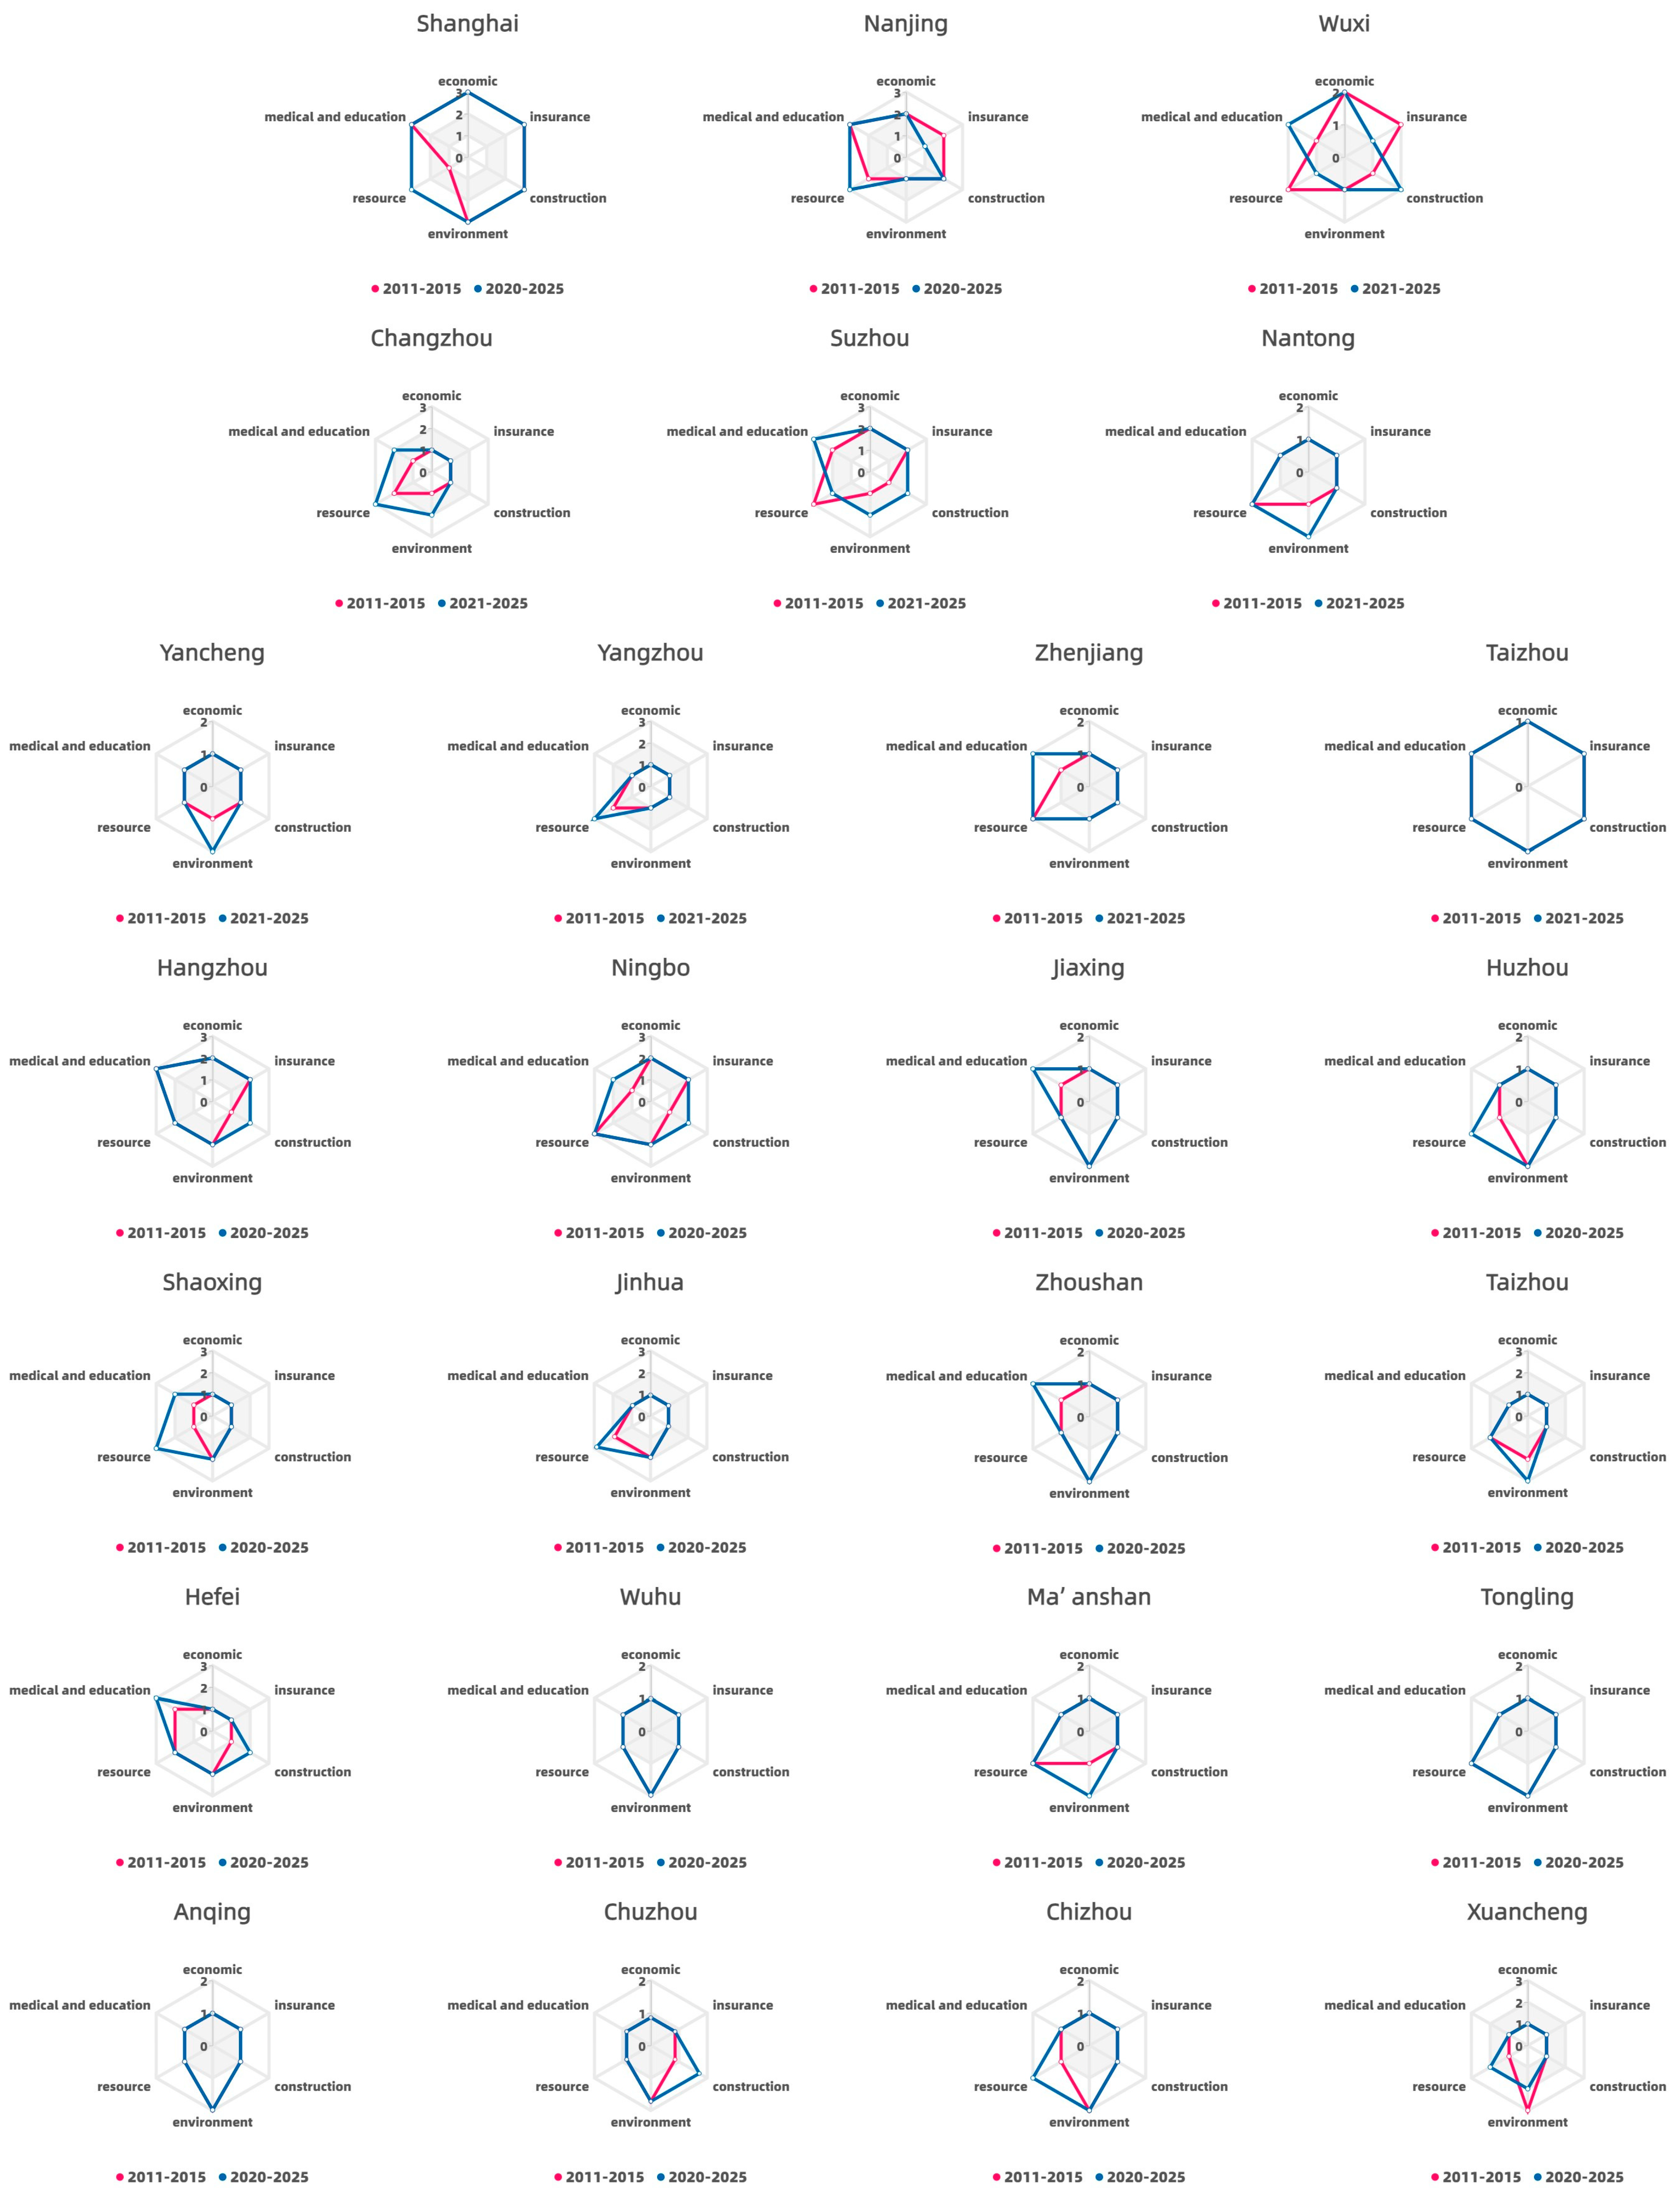
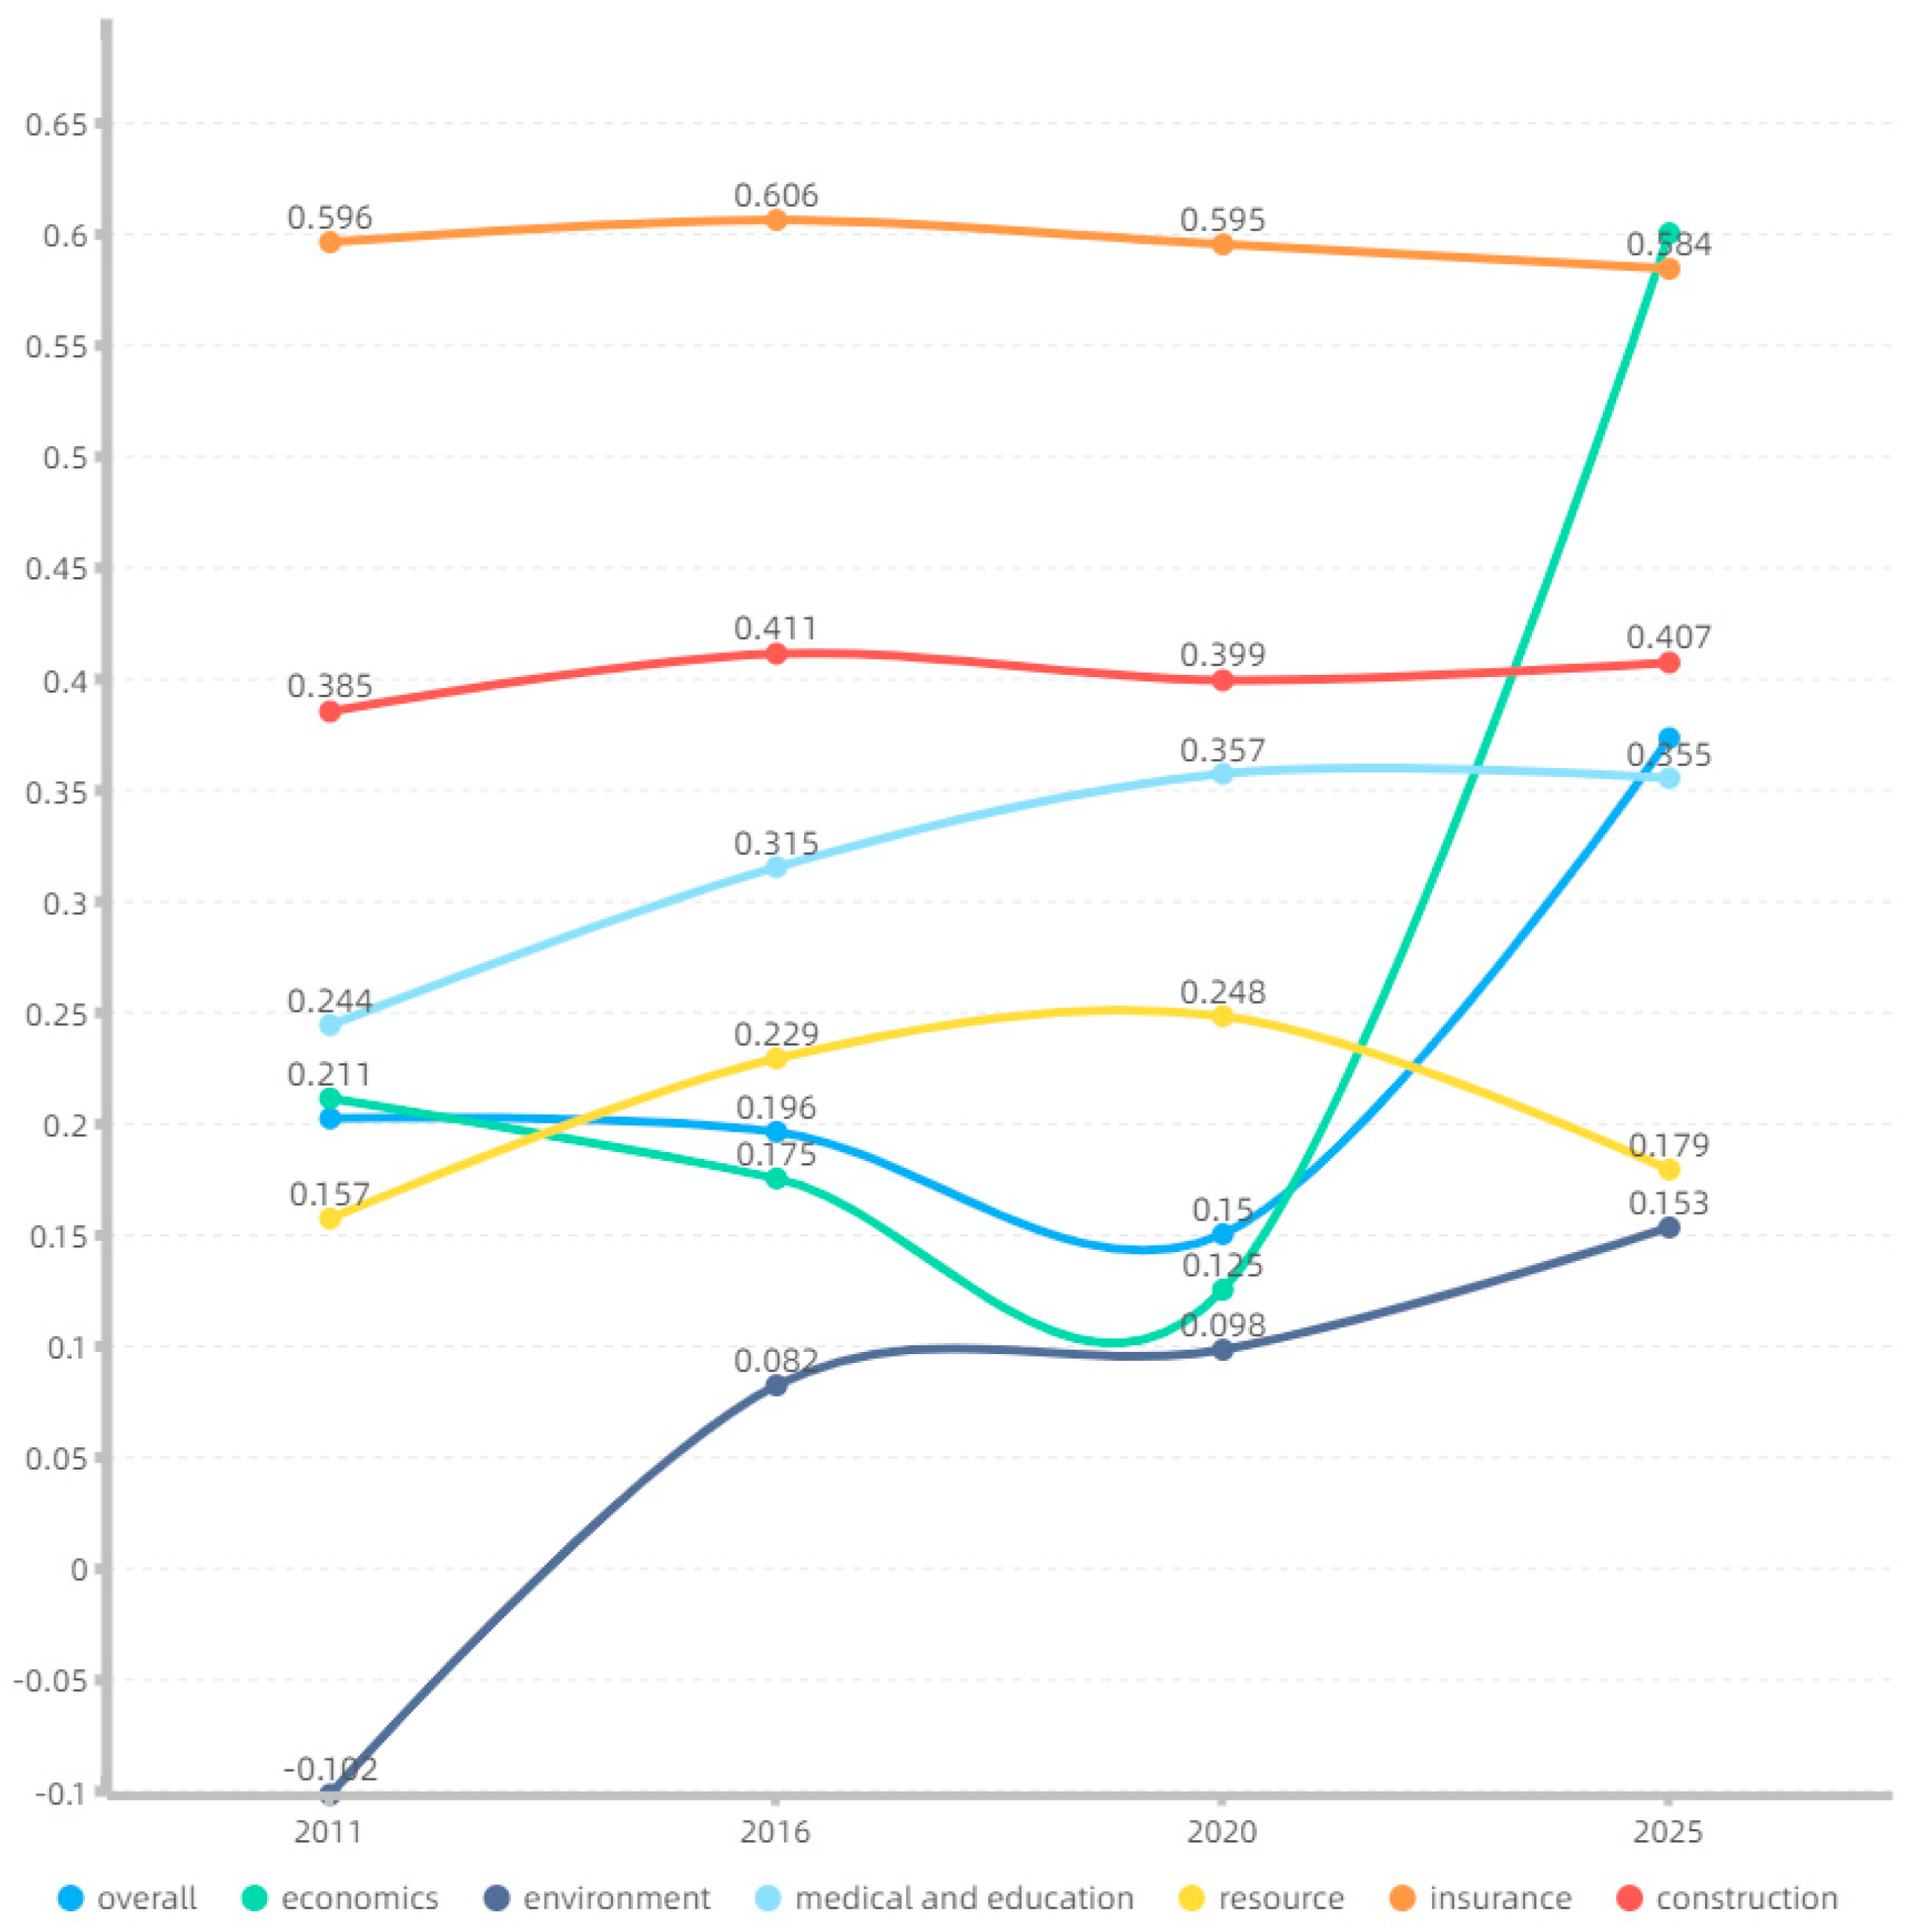
4.1. Urban Livability System Score Characteristics
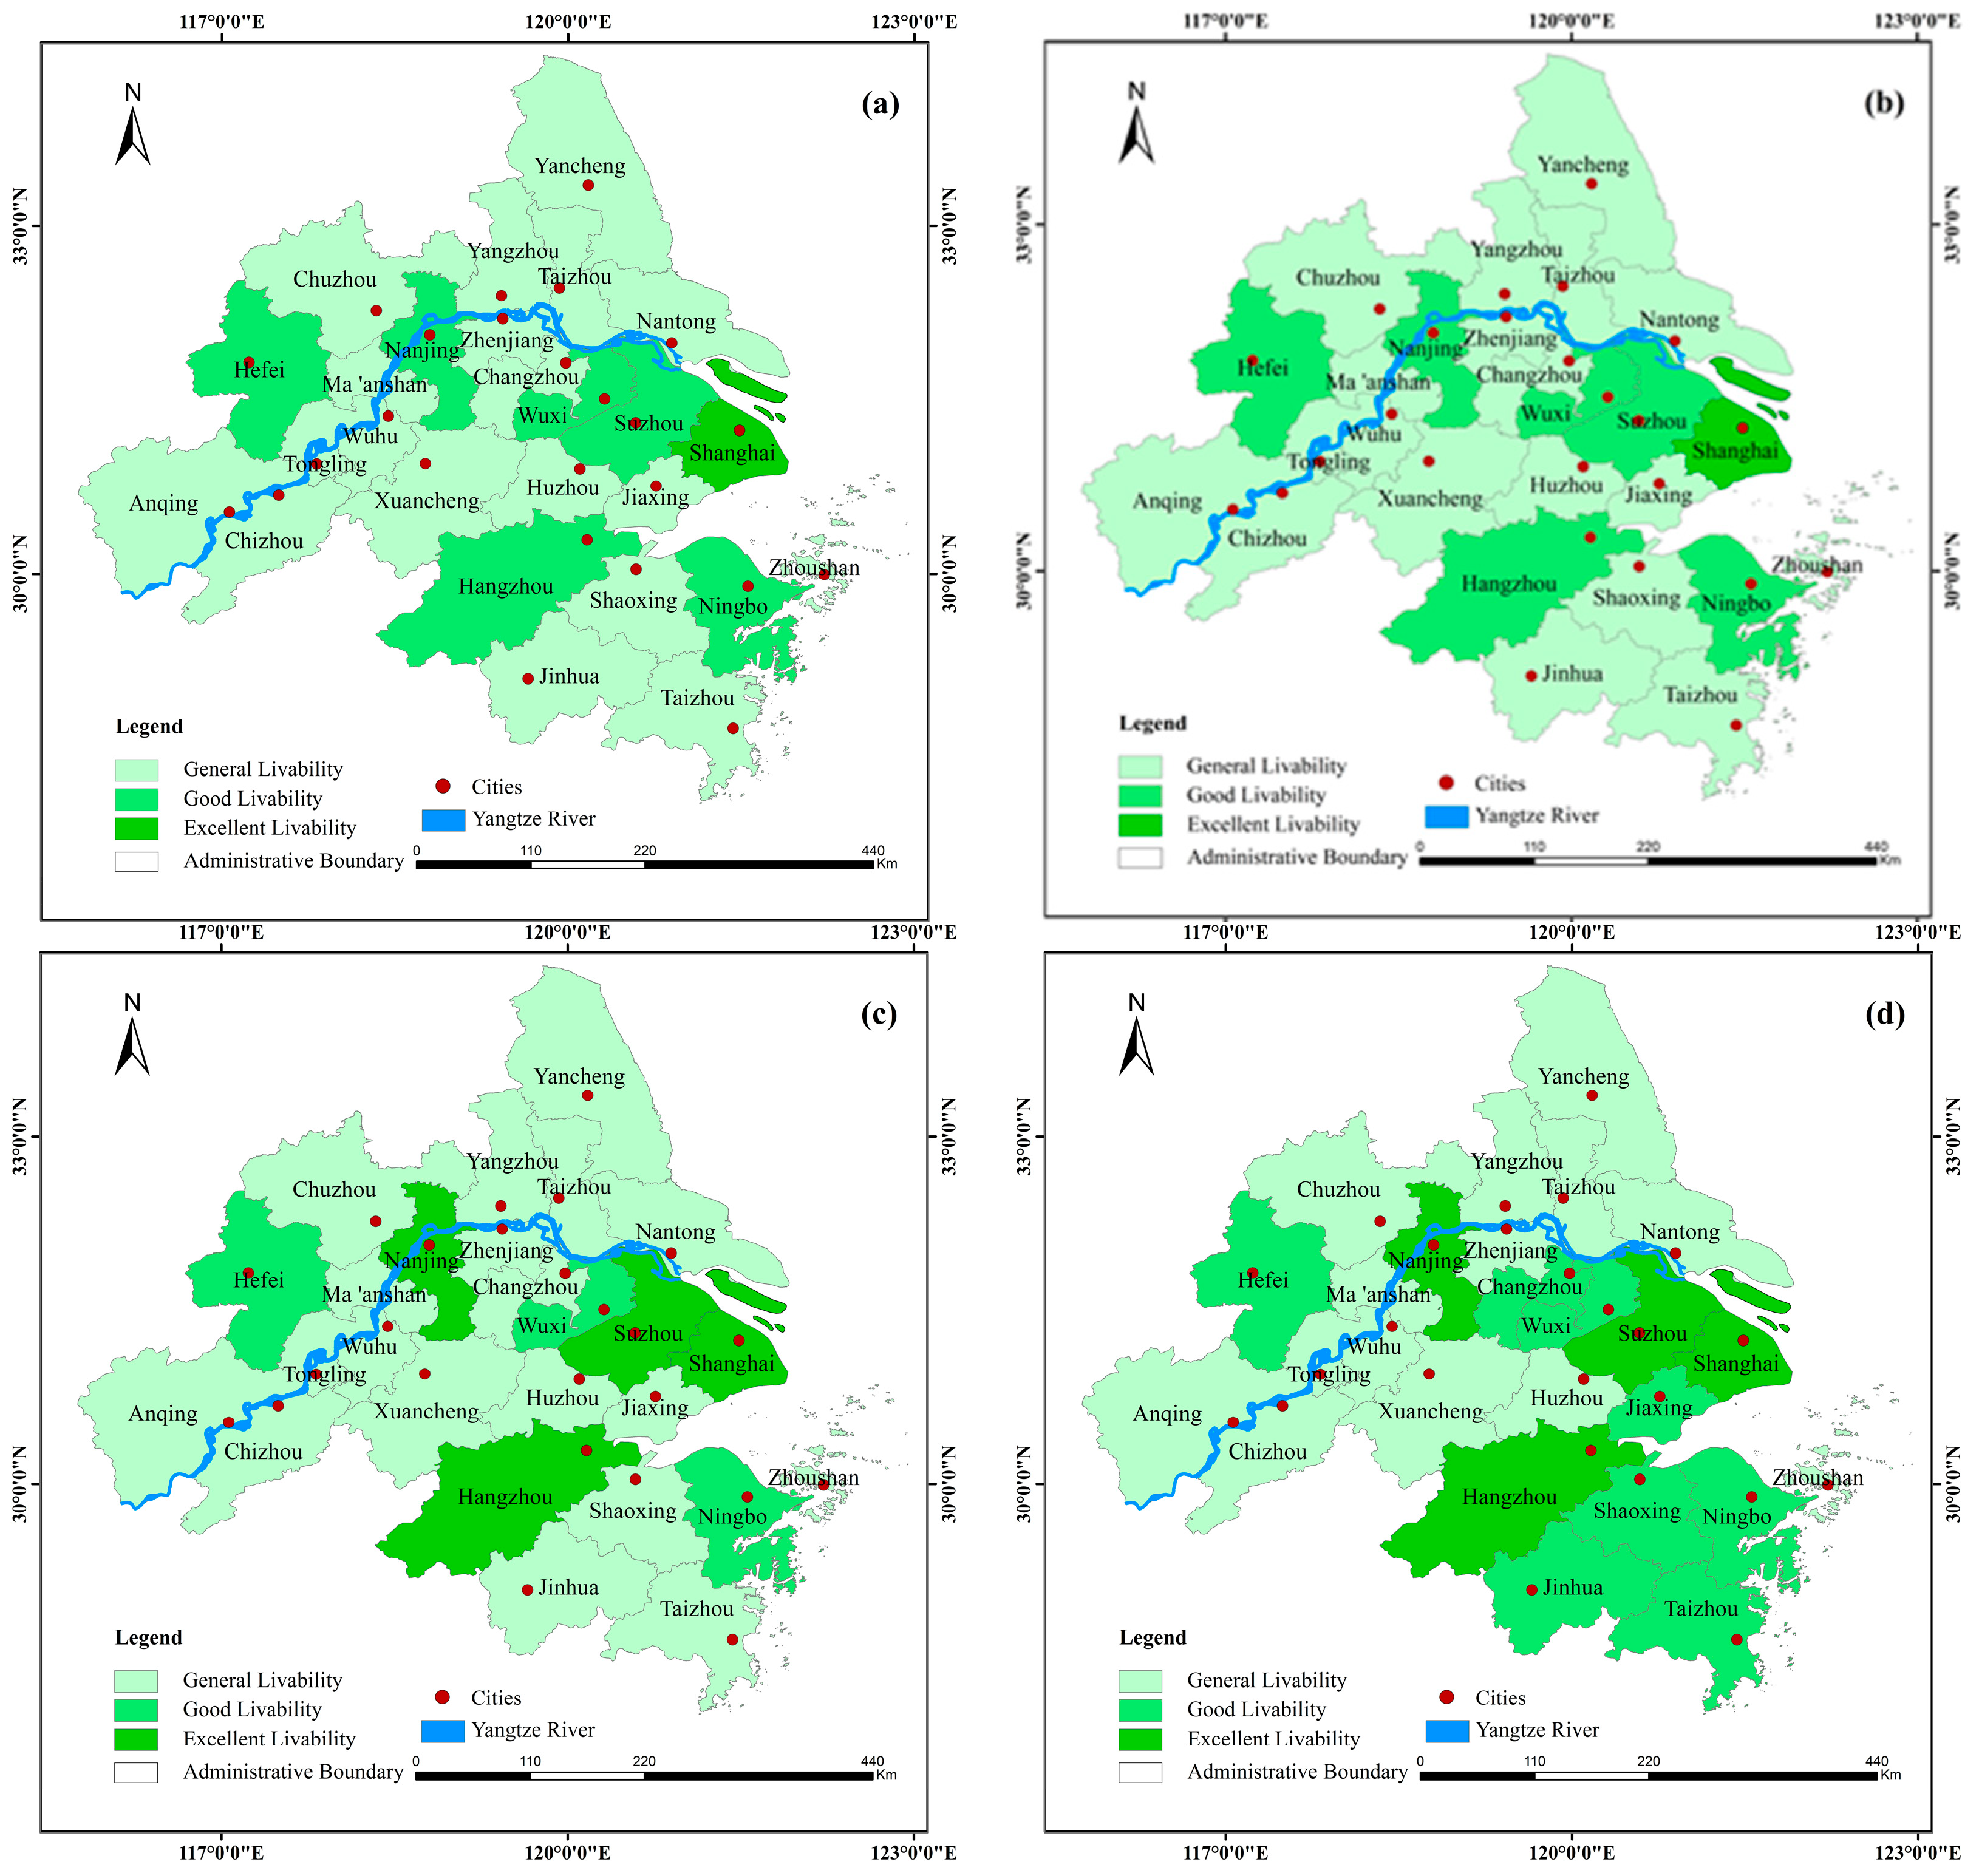
4.2. Spatiotemporal Characteristics of Urban Livability
4.3. Autocorrelation Characteristics of Urban Livability
4.4. Driving Factors
5. Discussion
5.1. Simulation Accuracy
5.2. Uncertainty
5.3. Policy Suggestions
6. Conclusions
Author Contributions
Funding
Acknowledgments
Conflicts of Interest
References
- Un-Habitat. State of the World’s Cities, 2010/2011: Bridging the Urban Divide; Earthscan: London, UK, 2008. [Google Scholar]
- Wei, Y.; Huang, C.; Lam, P.T.; Yuan, Z. Sustainable urban development: A review on urban carrying capacity assessment. Habitat Int. 2015, 46, 64–71. [Google Scholar] [CrossRef]
- Bongaarts, J. World Health Organization Health in 2015: From MDGs, Millennium Development Goals, to SDGs, Sustainable Development Goals Geneva: WHO Press, 2016. 212 p. $60.00 (pbk.). Popul. Dev. Rev. 2016, 42, 575. [Google Scholar] [CrossRef] [Green Version]
- Yu, S.; Sial, M.S.; Tran, D.K.; Badulescu, A.; Thu, P.A.; Sehleanu, M. Adoption and implementation of sustainable development goals (SDGs) in China—Agenda 2030. Sustainability 2020, 12, 6288. [Google Scholar] [CrossRef]
- Chen, S.; Guo, L.; Wang, Z.; Mao, W.; Ge, Y.; Ying, X.; Fang, J.; Long, Q.; Liu, Q.; Xiang, H. Current situation and progress toward the 2030 health-related Sustainable Development Goals in China: A systematic analysis. PLoS Med. 2019, 16, e1002975. [Google Scholar] [CrossRef]
- Marans, R.W. Quality of urban life & environmental sustainability studies: Future linkage opportunities. Habitat Int. 2015, 45, 47–52. [Google Scholar]
- Ruth, M.; Franklin, R.S. Livability for all? Conceptual limits and practical implications. Appl. Geogr. 2014, 49, 18–23. [Google Scholar] [CrossRef] [Green Version]
- Kashef, M. Urban livability across disciplinary and professional boundaries. Front. Archit. Res. 2016, 5, 239–253. [Google Scholar] [CrossRef] [Green Version]
- Norouzian-Maleki, S.; Bell, S.; Hosseini, S.-B.; Faizi, M. Developing and testing a framework for the assessment of neighbourhood liveability in two contrasting countries: Iran and Estonia. Ecol. Indic. 2015, 48, 263–271. [Google Scholar] [CrossRef] [Green Version]
- Buder, S. Visionaries and Planners: The Garden City Movement and the Modern Community; Oxford University Press on Demand: Oxford, UK, 1990. [Google Scholar]
- Balsas, C.J. Measuring the livability of an urban centre: An exploratory study of key performance indicators. Plan. Pract. Res. 2004, 19, 101–110. [Google Scholar] [CrossRef]
- Carley, M.; Smith, H.; Jenkins, P. Urban Development and Civil Society: The Role of Communities in Sustainable Cities; Routledge: London, UK, 2013. [Google Scholar]
- Palej, A. In Architecture for, by and with children: A way to teach livable city. In Proceedings of the International Making Cities Livable Conference, Vienna, Austria, 4–8 July 2000. [Google Scholar]
- Bonaiuto, M.; Fornara, F.; Ariccio, S.; Cancellieri, U.G.; Rahimi, L. Perceived residential environment quality indicators (PREQIs) relevance for UN-HABITAT city prosperity index (CPI). Habitat Int. 2015, 45, 53–63. [Google Scholar] [CrossRef]
- Harvey, C.; Aultman-Hall, L. Measuring urban streetscapes for livability: A review of approaches. Prof. Geogr. 2016, 68, 149–158. [Google Scholar] [CrossRef]
- Mahmoudi, M.; Ahmad, F.; Abbasi, B. Livable streets: The effects of physical problems on the quality and livability of Kuala Lumpur streets. Cities 2015, 43, 104–114. [Google Scholar] [CrossRef]
- Marans, R.W.; Stimson, R.J. Investigating Quality of Urban Life: Theory, Methods, and Empirical Research; Springer Science & Business Media: Berlin/Heidelberg, Germany, 2011; Volume 45. [Google Scholar]
- Easterlin, R.A.; Morgan, R.; Switek, M.; Wang, F. China’s life satisfaction, 1990–2010. Proc. Natl. Acad. Sci. USA 2012, 109, 9775–9780. [Google Scholar] [CrossRef] [Green Version]
- Okulicz-Kozaryn, A. City life: Rankings (livability) versus perceptions (satisfaction). Soc. Indic. Res. 2013, 110, 433–451. [Google Scholar] [CrossRef]
- World Health Organization. Health in 2015: From MDGs, Millennium Development Goals to SDGs, Sustainable Development Goals; World Health Organization: Geneva, Switzerland, 2015. [Google Scholar]
- Appio, F.P.; Lima, M.; Paroutis, S. Understanding Smart Cities: Innovation ecosystems, technological advancements, and societal challenges. Technol. Forecast. Soc. Chang. 2019, 142, 1–14. [Google Scholar] [CrossRef]
- Batty, M. Big data, smart cities and city planning. Dialogues Hum. Geogr. 2013, 3, 274–279. [Google Scholar] [CrossRef] [PubMed]
- Jokar Arsanjani, J.; Helbich, M.; Bakillah, M.; Hagenauer, J.; Zipf, A. Toward mapping land-use patterns from volunteered geographic information. Int. J. Geogr. Inf. Sci. 2013, 27, 2264–2278. [Google Scholar] [CrossRef]
- Resch, B.; Summa, A.; Zeile, P.; Strube, M. Citizen-centric urban planning through extracting emotion information from twitter in an interdisciplinary space-time-linguistics algorithm. Urban Plan. 2016, 1, 114–127. [Google Scholar] [CrossRef]
- Wu, L. Sciences of human settlements: Searching for the theory and practice. Ekistics 2002, 69, 279. [Google Scholar]
- Huang, H.; Li, Q.; Zhang, Y. Urban residential land suitability analysis combining remote sensing and social sensing data: A case study in Beijing, China. Sustainability 2019, 11, 2255. [Google Scholar] [CrossRef] [Green Version]
- Xiong, Y.; Zhang, F. Effect of human settlements on urban thermal environment and factor analysis based on multi-source data: A case study of Changsha city. J. Geogr. Sci. 2021, 31, 819–838. [Google Scholar] [CrossRef]
- Fu, B.; Yu, D.; Zhang, Y. The livable urban landscape: GIS and remote sensing extracted land use assessment for urban livability in Changchun Proper, China. Land Use Policy 2019, 87, 104048. [Google Scholar] [CrossRef]
- Cui, F.; Tang, H.; Zhang, Q. Urban livability and influencing factors in Beijing, Tianjin, and Hebei: An empirical study based on panel data from 2010–2016. J. Beijing Norm. Univ. (Nat. Sci.) 2018, 54, 666–673. [Google Scholar]
- Guo, Z.; Yao, S.; Chen, S.; Wu, W.; Liu, W. Spatial-temporal evolution of the livability levels in the Yangtze River Delta urban agglomerations and its influencing factors. Econ. Geogr. 2020, 40, 79–88. [Google Scholar]
- Lu, H.; Zhang, M.; Sun, W.; Li, W. Expansion analysis of yangtze river delta urban agglomeration using dmsp/ols nighttime light imagery for 1993 to 2012. ISPRS Int. J. Geo-Inf. 2018, 7, 52. [Google Scholar] [CrossRef] [Green Version]
- Zhen, F.; Cao, Y.; Qin, X.; Wang, B. Delineation of an urban agglomeration boundary based on Sina Weibo microblog ‘check-in’data: A case study of the Yangtze River Delta. Cities 2017, 60, 180–191. [Google Scholar] [CrossRef]
- Huang, Z.; Du, X.; Castillo, C.S.Z. How does urbanization affect farmland protection? Evidence from China. Resour. Conserv. Recycl. 2019, 145, 139–147. [Google Scholar] [CrossRef] [Green Version]
- Olawumi, T.O.; Chan, D.W. A scientometric review of global research on sustainability and sustainable development. J. Clean. Prod. 2018, 183, 231–250. [Google Scholar] [CrossRef]
- Ye, C.; Zhu, J.; Li, S.; Yang, S.; Chen, M. Assessment and analysis of regional economic collaborative development within an urban agglomeration: Yangtze River Delta as a case study. Habitat Int. 2019, 83, 20–29. [Google Scholar] [CrossRef]
- Hillmer, S.C.; Tiao, G.C. An ARIMA-model-based approach to seasonal adjustment. J. Am. Stat. Assoc. 1982, 77, 63–70. [Google Scholar] [CrossRef]
- Perone, G. An ARIMA model to forecast the spread and the final size of COVID-2019 epidemic in Italy. HEDG-Health Econom. Data Group Work. Pap. Ser. Univ. York (2020) 2020, 2004, 00382. [Google Scholar]
- Benvenuto, D.; Giovanetti, M.; Vassallo, L.; Angeletti, S.; Ciccozzi, M. Application of the ARIMA model on the COVID-2019 epidemic dataset. Data Brief 2020, 29, 105340. [Google Scholar] [CrossRef] [PubMed]
- Voorhees, E.M. Implementing agglomerative hierarchic clustering algorithms for use in document retrieval. Inf. Process. Manag. 1986, 22, 465–476. [Google Scholar] [CrossRef] [Green Version]
- Getis, A. A history of the concept of spatial autocorrelation: A geographer’s perspective. Geogr. Anal. 2008, 40, 297–309. [Google Scholar] [CrossRef]
- Getis, A. Reflections on spatial autocorrelation. Reg. Sci. Urban Econ. 2007, 37, 491–496. [Google Scholar] [CrossRef]
- Griffith, D.A. Spatial autocorrelation. In A Primer; Association of American Geographers: Washington, DC, USA, 1987. [Google Scholar]
- Liang, L.; Deng, X.; Wang, P.; Wang, Z.; Wang, L. Assessment of the impact of climate change on cities livability in China. Sci. Total Environ. 2020, 726, 138339. [Google Scholar] [CrossRef] [PubMed]
- Liu, H. Comprehensive carrying capacity of the urban agglomeration in the Yangtze River Delta, China. Habitat Int. 2012, 36, 462–470. [Google Scholar] [CrossRef]
- Cai, P.; Huang, Z.-W. Spatial patterns of urban agglomeration in the Yangtze River Delta based on synergy development. Econ. Geogr. 2014, 34, 75–79. [Google Scholar]
- Xu, S.; Yu, T.; Wu, Q. A study of urbanization quality assessment system of county-level cities in China under the regional perspective: Taking the Yangtze delta area as an example. Urban Plan. Int. 2011, 26, 53–58. [Google Scholar]
- Hao, J.; Zhang, P.; Yu, W.; Mou, X. Causes of Spatial Patterns of Livability in Chinese Cities: MGWRL Analysis Based on Didi’s Big Data. J. Urban Plan. Dev. 2021, 147, 04021025. [Google Scholar] [CrossRef]
- Shi, Q.; Lai, X. Identifying the underpin of green and low carbon technology innovation research: A literature review from 1994 to 2010. Technol. Forecast. Soc. Chang. 2013, 80, 839–864. [Google Scholar] [CrossRef]
- Shi, T.; Zhang, W.; Zhou, Q.; Wang, K. Industrial structure, urban governance and haze pollution: Spatiotemporal evidence from China. Sci. Total Environ. 2020, 742, 139228. [Google Scholar] [CrossRef]
- Cheng, S.; Chen, Y.; Meng, F.; Chen, J.; Liu, G.; Song, M. Impacts of local public expenditure on CO2 emissions in Chinese cities: A spatial cluster decomposition analysis. Resour. Conserv. Recycl. 2021, 164, 105217. [Google Scholar] [CrossRef]
- Liu, Y.; Wang, S.; Qiao, Z.; Wang, Y.; Ding, Y.; Miao, C. Estimating the dynamic effects of socioeconomic development on industrial SO2 emissions in Chinese cities using a DPSIR causal framework. Resour. Conserv. Recycl. 2019, 150, 104450. [Google Scholar] [CrossRef]
- Howard, K.; Gerber, R. Impacts of urban areas and urban growth on groundwater in the Great Lakes Basin of North America. J. Great Lakes Res. 2018, 44, 1–13. [Google Scholar] [CrossRef]
- Fan, H.; Hashmi, S.H.; Habib, Y.; Ali, M. How Do Urbanization and Urban Agglomeration Affect CO2 Emissions in South Asia? Testing Non-Linearity Puzzle with Dynamic STIRPAT Model. Chin. J. Urban Environ. Stud. 2020, 8, 2050003. [Google Scholar] [CrossRef]


| System Layer | Subsystem Layer | Index Layer (Mean Value, Variance Value, and Weight Coefficient) |
|---|---|---|
| The urban livability evaluation system of Yangtze River Delta agglomeration | Economy | Gross regional output per capita (0.366, 0.044, 2.01%), Revenue from local general public budgets (0.084, 0.023, 7.95%), GDP growth rate (0.6, 0.016, 0.28%), Per capita disposable income of urban residents (0.381, 0.048, 1.96%), Proportion of tertiary industry in GRP (0.44, 0.033, 1.08%) |
| Insurance | Number of urban workers insured by basic old-age insurance (0.133,0.032,6.08%), Number of urban employees insured by basic medical insurance (0.134, 0.032, 6.27%), Number of people covered by unemployment insurance (0.129, 0.030, 6.42%), Number of registered unemployed persons in urban areas (0.76, 0.029, 0.34%), Number of criminal cases (0.879, 0.022, 0.22%) | |
| Environment | Days with air quality better than level 2 (0.574, 0.062, 1.19%), Urban built-up area green coverage (0.158, 0.007, 1.19%), Comprehensive utilization rate of industrial solid waste (0.74, 0.041, 0.52%), Sewage treatment rate (0.742, 0.047, 0.63%), Harmless disposal rate of domestic garbage (0.965, 0.012, 0.11%) | |
| Resource | Gas penetration (0.949, 0.022, 0.24%), Water supply penetration (0.978, 0.008, 0.08%), Per capita household water supply (0.328, 0.037, 2.12%), Per capita power supply (0.386,0.050,2.02%), Average selling price of residential commercial housing (0.807, 0.028, 0.32%) | |
| Construction | Number of mobile phone users at year-end (0.169,0.028,4.15%), Number of internet broadband access users (0.192, 0.033, 4.13%), Urban road area per capita (0.32, 0.038, 2.16%), The number of urban buses and trams in operation per 10,000 people (0.377, 0.043, 1.81%), The number of taxis in operation per 10,000 people in cities (0.26, 0.051, 3.70%), Length of city subway lines (0.055, 0.030, 17.96%) | |
| Medical and education | Number of hospital beds per 10,000 people (0.335, 0.046, 2.28%), Number of doctors per 10,000 people (0.334, 0.032, 1.59%), Number of college students per 10,000 people (0.196, 0.037, 4.06%), Number of universities (0.188, 0.063, 6.97%), Education expenditure in financial expenditure (0.108, 0.023, 5.71%), Public libraries contain books for every hundred people (0.205, 0.045, 4.47%) |
| City | 2011 Scoring | 2011 Ranking | 2025 Scoring | 2025 Ranking | Change Curve | City | 2011 Scoring | 2011 Ranking | 2025 Scoring | 2025 Ranking | Change Curve |
|---|---|---|---|---|---|---|---|---|---|---|---|
| Shanghai | 0.54 | 1 | 0.86 | 1 |  | Huzhou | 0.10 | 19 | 0.15 | 18 |  |
| Nanjing | 0.29 | 2 | 0.60 | 2 |  | Shaoxing | 0.13 | 10 | 0.23 | 10 |  |
| Wuxi | 0.19 | 7 | 0.33 | 7 |  | Jinhua | 0.12 | 15 | 0.23 | 9 |  |
| Changzhou | 0.14 | 8 | 0.22 | 12 |  | Zhoushan | 0.10 | 21 | 0.14 | 19 |  |
| Suzhou | 0.25 | 4 | 0.57 | 3 |  | Taizhou | 0.11 | 16 | 0.22 | 11 |  |
| Nantong | 0.12 | 11 | 0.16 | 16 |  | Hefei | 0.22 | 5 | 0.40 | 5 |  |
| Yancheng | 0.08 | 23 | 0.11 | 26 |  | Wuhu | 0.12 | 12 | 0.14 | 20 |  |
| Yangzhou | 0.10 | 18 | 0.17 | 15 |  | Ma’anshan | 0.11 | 17 | 0.12 | 23 |  |
| Zhenjiang | 0.12 | 14 | 0.20 | 13 |  | Tongling | 0.12 | 13 | 0.11 | 24 |  |
| Taizhou | 0.09 | 22 | 0.13 | 21 |  | Anqing | 0.10 | 20 | 0.13 | 22 |  |
| Hangzhou | 0.28 | 3 | 0.57 | 4 |  | Chuzhou | 0.08 | 24 | 0.18 | 14 |  |
| Ningbo | 0.21 | 6 | 0.37 | 6 |  | Chizhou | 0.06 | 26 | 0.11 | 25 |  |
| Jiaxing | 0.13 | 9 | 0.24 | 8 |  | Xuancheng | 0.06 | 25 | 0.15 | 17 |  |
| Test Type | Testing Purpose | Test Value | Inspection Conclusion |
|---|---|---|---|
| F test | FE and POOL models are compared and selected | F (25202) = 55.432, p = 0.000) | FE model |
| BP inspection | RE and POOL models are compared and selected | χ squared (1) = 460.278, p = 0.000) | RE model |
| Hausman test | FE and RE models are compared and selected | χ squared (6) = 60.601, p = 0.000 | FE model |
| Item | Coef | Std. Err | T | p | 95% CI |
|---|---|---|---|---|---|
| intercept | 0.38 | 0.144 | 2.641 | 0.008 | 0.662~0.098 |
| Ln (Industrial SO2 emissions ) | 0.007 | 0.004 | 1.907 | 0.057 | 0.014~0.000 |
| Ln (General Public Budget Expenditure for Social Security and Employment) | 0.001 | 0.011 | 0.132 | 0.895 | 0.020~0.022 |
| Ln (Fixed assets investment in urban Public utilities construction) | 0.007 | 0.003 | 1.956 | 0.051 | 0.000~0.014 |
| Ln (Total Retail Sales) | 0.018 | 0.011 | 1.621 | 0.105 | 0.004~0.039 |
| Ln (Education and healthcare expenditures) | 0.039 | 0.013 | 2.903 | 0.004 | 0.013~0.065 |
| Ln (Urban construction land area) | 0.014 | 0.011 | 1.217 | 0.223 | 0.009~0.036 |
| F (6202) = 54.771, p = 0.000) | |||||
| R ² = 0.848, adjusted R ² = 0.844 | |||||
| p < 0.05 p < 0.01 | |||||
| Check the Name | Statistic | The Numerical |
|---|---|---|
| Cronbach reliability analysis | Cronbach alpha coefficient | 0.852 |
| KMO test | KMO value | 0.907 |
| Bartlett test of sphericity | The approximate chi-square | 10,426.434 |
| df | 496 | |
| p-Values | 0 |
| City | MSE | Q Statistic p-Value | City | MSE | Q Statistic p-Value |
|---|---|---|---|---|---|
| Shanghai | 0.00073 | 0.573 | Huzhou | 0.00005 | 0.33 |
| Nanjing | 0.00014 | 0.847 | Shaoxing | 0.00001 | 0.485 |
| Wuxi | 0.00003 | 0.867 | Jinhua | 0.00002 | 0.603 |
| Changzhou | 0.00003 | 0.172 | Zhoushan | 0.00013 | 0.574 |
| Suzhou | 0.00026 | 0.527 | Taizhou | 0.00006 | 0.784 |
| Nantong | 0.00008 | 0.569 | Hefei | 0.00010 | 0.991 |
| Yancheng | 0.00004 | 0.404 | Wuhu | 0.00009 | 0.584 |
| Yangzhou | 0.00001 | 0.403 | Ma’anshan | 0.00009 | 0.961 |
| Zhenjiang | 0.00006 | 0.445 | Tongling | 0.00018 | 0.584 |
| Taizhou | 0.00007 | 0.314 | Anqing | 0.00011 | 0.687 |
| Hangzhou | 0.00003 | 0.772 | Chuzhou | 0.00001 | 0.309 |
| Ningbo | 0.00003 | 0.992 | Chizhou | 0.00002 | 0.964 |
| Jiaxing | 0.00002 | 0.237 | Xuancheng | 0.00002 | 0.643 |
Publisher’s Note: MDPI stays neutral with regard to jurisdictional claims in published maps and institutional affiliations. |
© 2021 by the authors. Licensee MDPI, Basel, Switzerland. This article is an open access article distributed under the terms and conditions of the Creative Commons Attribution (CC BY) license (https://creativecommons.org/licenses/by/4.0/).
Share and Cite
Yang, Y.; Fang, S.; Wu, H.; Du, J.; Tu, H.; He, W. Spatiotemporal Trends and Driving Factors of Urban Livability in the Yangtze River Delta Agglomeration. Sustainability 2021, 13, 13152. https://doi.org/10.3390/su132313152
Yang Y, Fang S, Wu H, Du J, Tu H, He W. Spatiotemporal Trends and Driving Factors of Urban Livability in the Yangtze River Delta Agglomeration. Sustainability. 2021; 13(23):13152. https://doi.org/10.3390/su132313152
Chicago/Turabian StyleYang, Yichen, Shifeng Fang, Hua Wu, Jiaqiang Du, Haomiao Tu, and Wei He. 2021. "Spatiotemporal Trends and Driving Factors of Urban Livability in the Yangtze River Delta Agglomeration" Sustainability 13, no. 23: 13152. https://doi.org/10.3390/su132313152
APA StyleYang, Y., Fang, S., Wu, H., Du, J., Tu, H., & He, W. (2021). Spatiotemporal Trends and Driving Factors of Urban Livability in the Yangtze River Delta Agglomeration. Sustainability, 13(23), 13152. https://doi.org/10.3390/su132313152


