
Component-Based Model for Building Material Stock and Waste-Flow Characterization: A Case in the Île-de-France Region

 , ,
, ,
Abstract
:1. Introduction
1.1. State of the Art
- First, it can be applied to both residential and non-residential buildings.
- Second, the results are broken down by waste categories and not just by large groups (for instance: inert, hazardous, and non-hazardous wastes).
- Third, the structure of the model allows its replicability to other territories in France.
- Finally, the model can be easily updated (because it is based on a rich macro-component description of buildings) to allow its continuous improvement.
1.2. Objectives
- Measure: estimate, both nature and quantity, of the building stock and construction waste generated by the deconstruction and renovation of buildings, its territorial distribution, the distribution of waste in the various outlets, and the associated treatment costs;
- Optimize: anticipate the production of waste to limit and valorize it as well as possible;
- Develop new channels: determine the volumes and categories of waste generated by territory to support actors of building waste management in the development of new channels of reuse or recycling.
2. Materials and Methods
2.1. Methodology Overview
- The French national building database (BDNB): a data product built by joining multiple national building-stock databases, including property taxes, energy performance diagnostics, and energy consumption. The BDNB comprises more than 20 million localized buildings’ geometry with multiple thematic layers, such as wall and roof material, energy performance, and energy consumption at the scale of single buildings.
- TyPy: a database and management tool for building typologies and components and their assemblies as macro-components. Material properties are linked to product EPD to assess nature and quantities of construction products within a given building.
- The geometric service: a software brick that calculates a building’s geometric properties from its geospatial data. Namely, this service provides the area, perimeter, and azimuth of each surface of the building envelope.
- The BTP-flux model itself provides the following functions, in addition to orchestrating the call to the various elements mentioned above: the estimation of renovation and demolition waste on a territorial scale, the assessment of the outlets and costs associated with the management of each waste and potential secondary resources, and the extrapolation of results calculated for a sample of the target population, namely the entire building stock of a territory.
2.2. BTP-Flux Model
2.2.1. Data Merging and Sample Generation
- (1)
- Available Data Description and Data Requirements
- (2)
- Data Processing (Data Merging: Geo- and Not Geo-Processing)
- Cardinality 1–1: one building entry in fichiers fonciers and one building footprint in BD-TOPO exist on the parcel geometry. No ambiguity exists on the geometric matching. This configuration mainly gathered detached individual housing and collective housing in the city center where parcel boundaries meet building footprint boundaries.
- Cardinality 1–n: one building entry in fichiers fonciers and n building footprints in BD-TOPO exist on the parcel geometry. Here, if building uses are only residential, we made geometrical clusters and took the biggest one as the building footprint. The building height retained from BD-TOPO is the maximal height of the buildings of this cluster. Otherwise (i.e., non-residential use), we created a collection of geometries and assigned one to the single entry in fichiers fonciers. This configuration frequently gathered residential buildings with detached dependencies on the same parcel.
- Cardinality n–1: n building entries in fichiers fonciers and one building footprint in BD-TOPO exist on the parcel geometry. No specific treatment was taken; we took the weighted sums of each fichiers fonciers entry feature to characterize the building. This configuration gathered physical collective housing buildings that are generally split into stairwell units.
- Cardinality n–m: n building entries in fichiers fonciers and m building footprints in BD-TOPO exist on the parcel geometry. This was the more challenging case to deal with. A complex algorithm to allocate the good tabular entries to adequate building geometries is currently being investigated; this configuration is beyond the scope of this paper.
- (3)
- Sample Generation
2.2.2. Data Enrichment
- (1)
- Association Service
- (2)
- TyPy: Macro-Components Catalog Development
2.2.3. Modeling
- (1)
- Sizing
- (2)
- Material Accounting
2.2.4. Flow Assessment
- (1)
- Waste Categories
- (2)
- Material-Flow Estimation
2.2.5. Extrapolation
2.3. Case Study
3. Results
3.1. Île-de-France Sample Description
3.2. Geometrical Characteristics of the Studied Buildings for the Île-de-France Region
3.3. Material Mass Calculation Results
3.4. Extrapolation for Residential Buildings
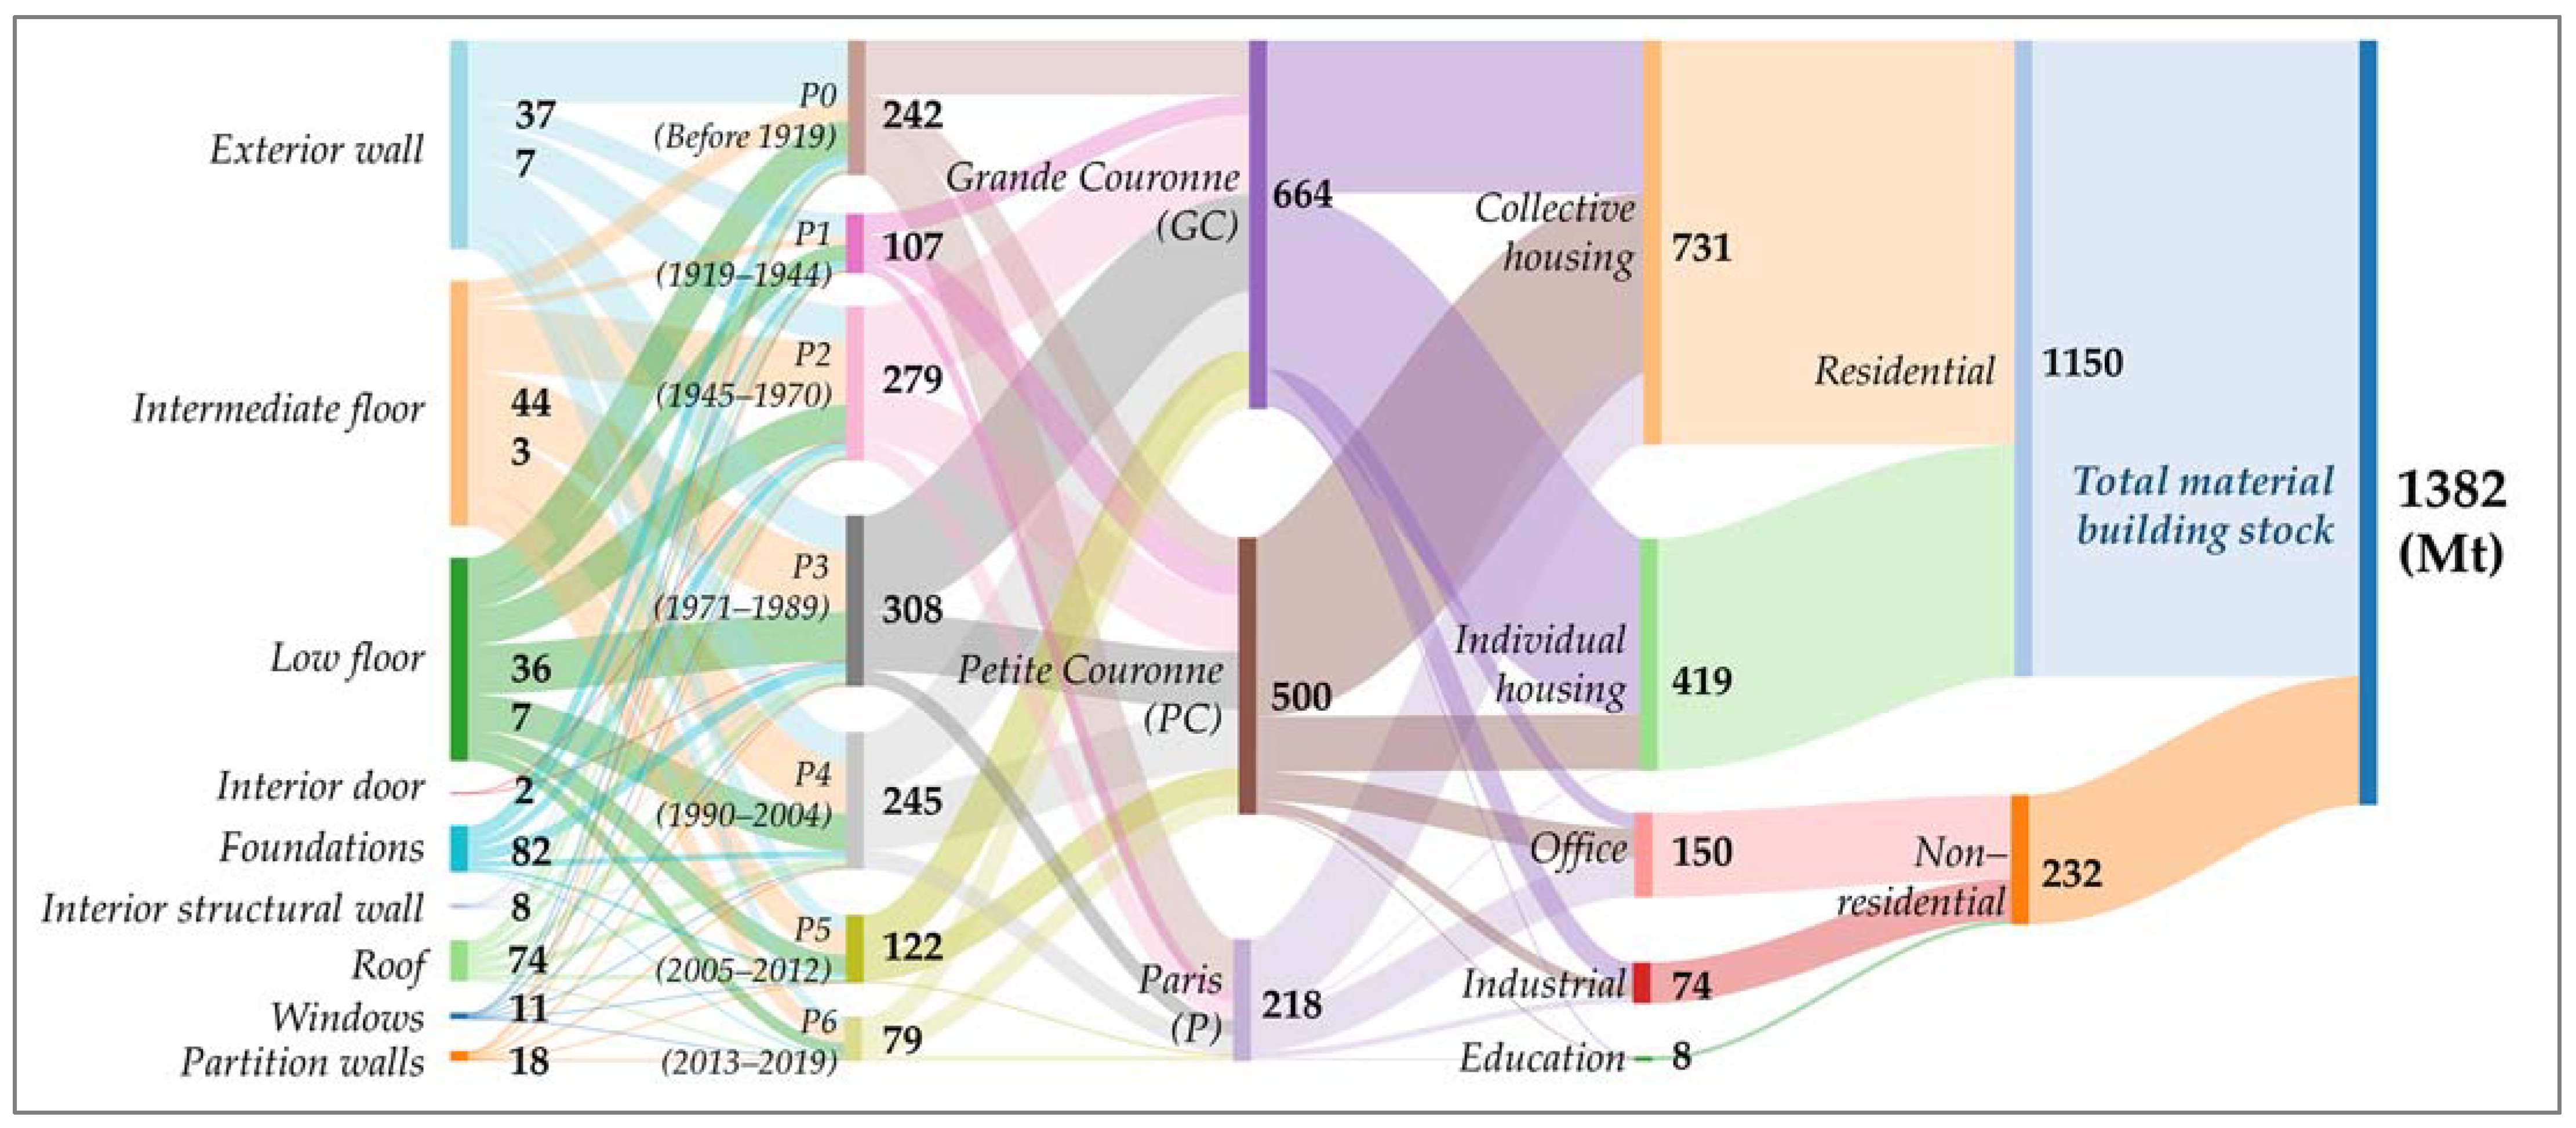
3.5. Material Stock
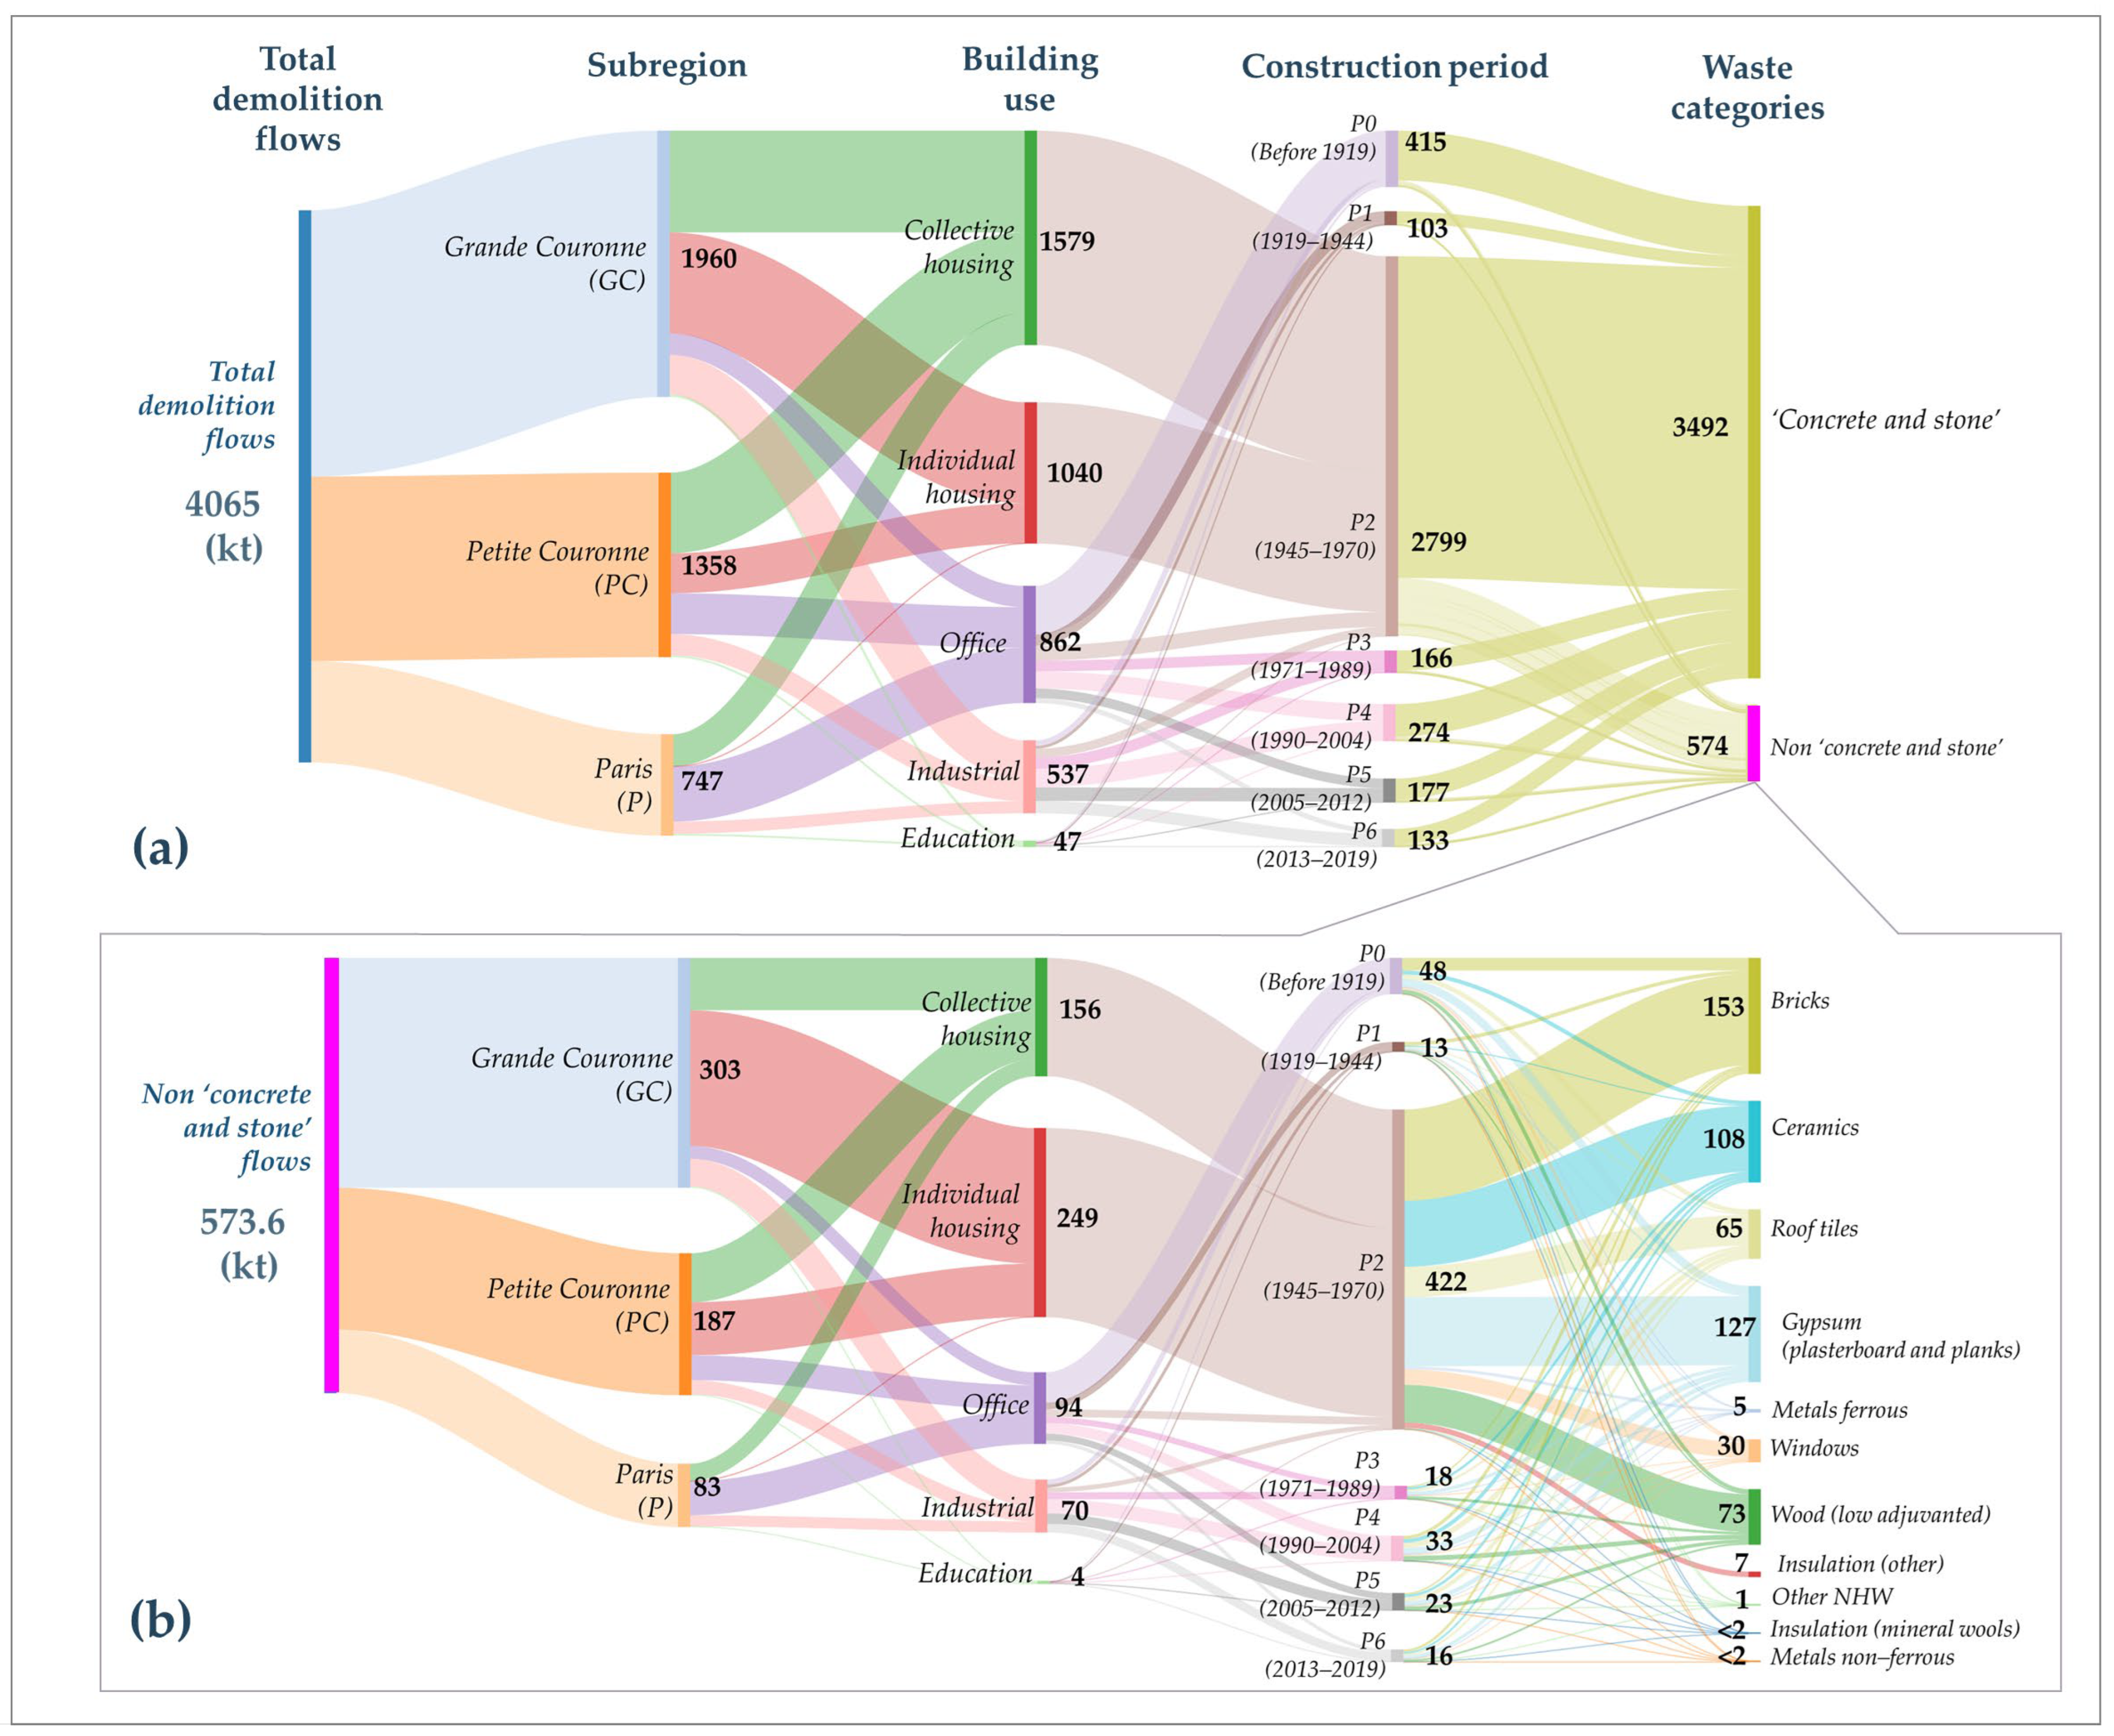
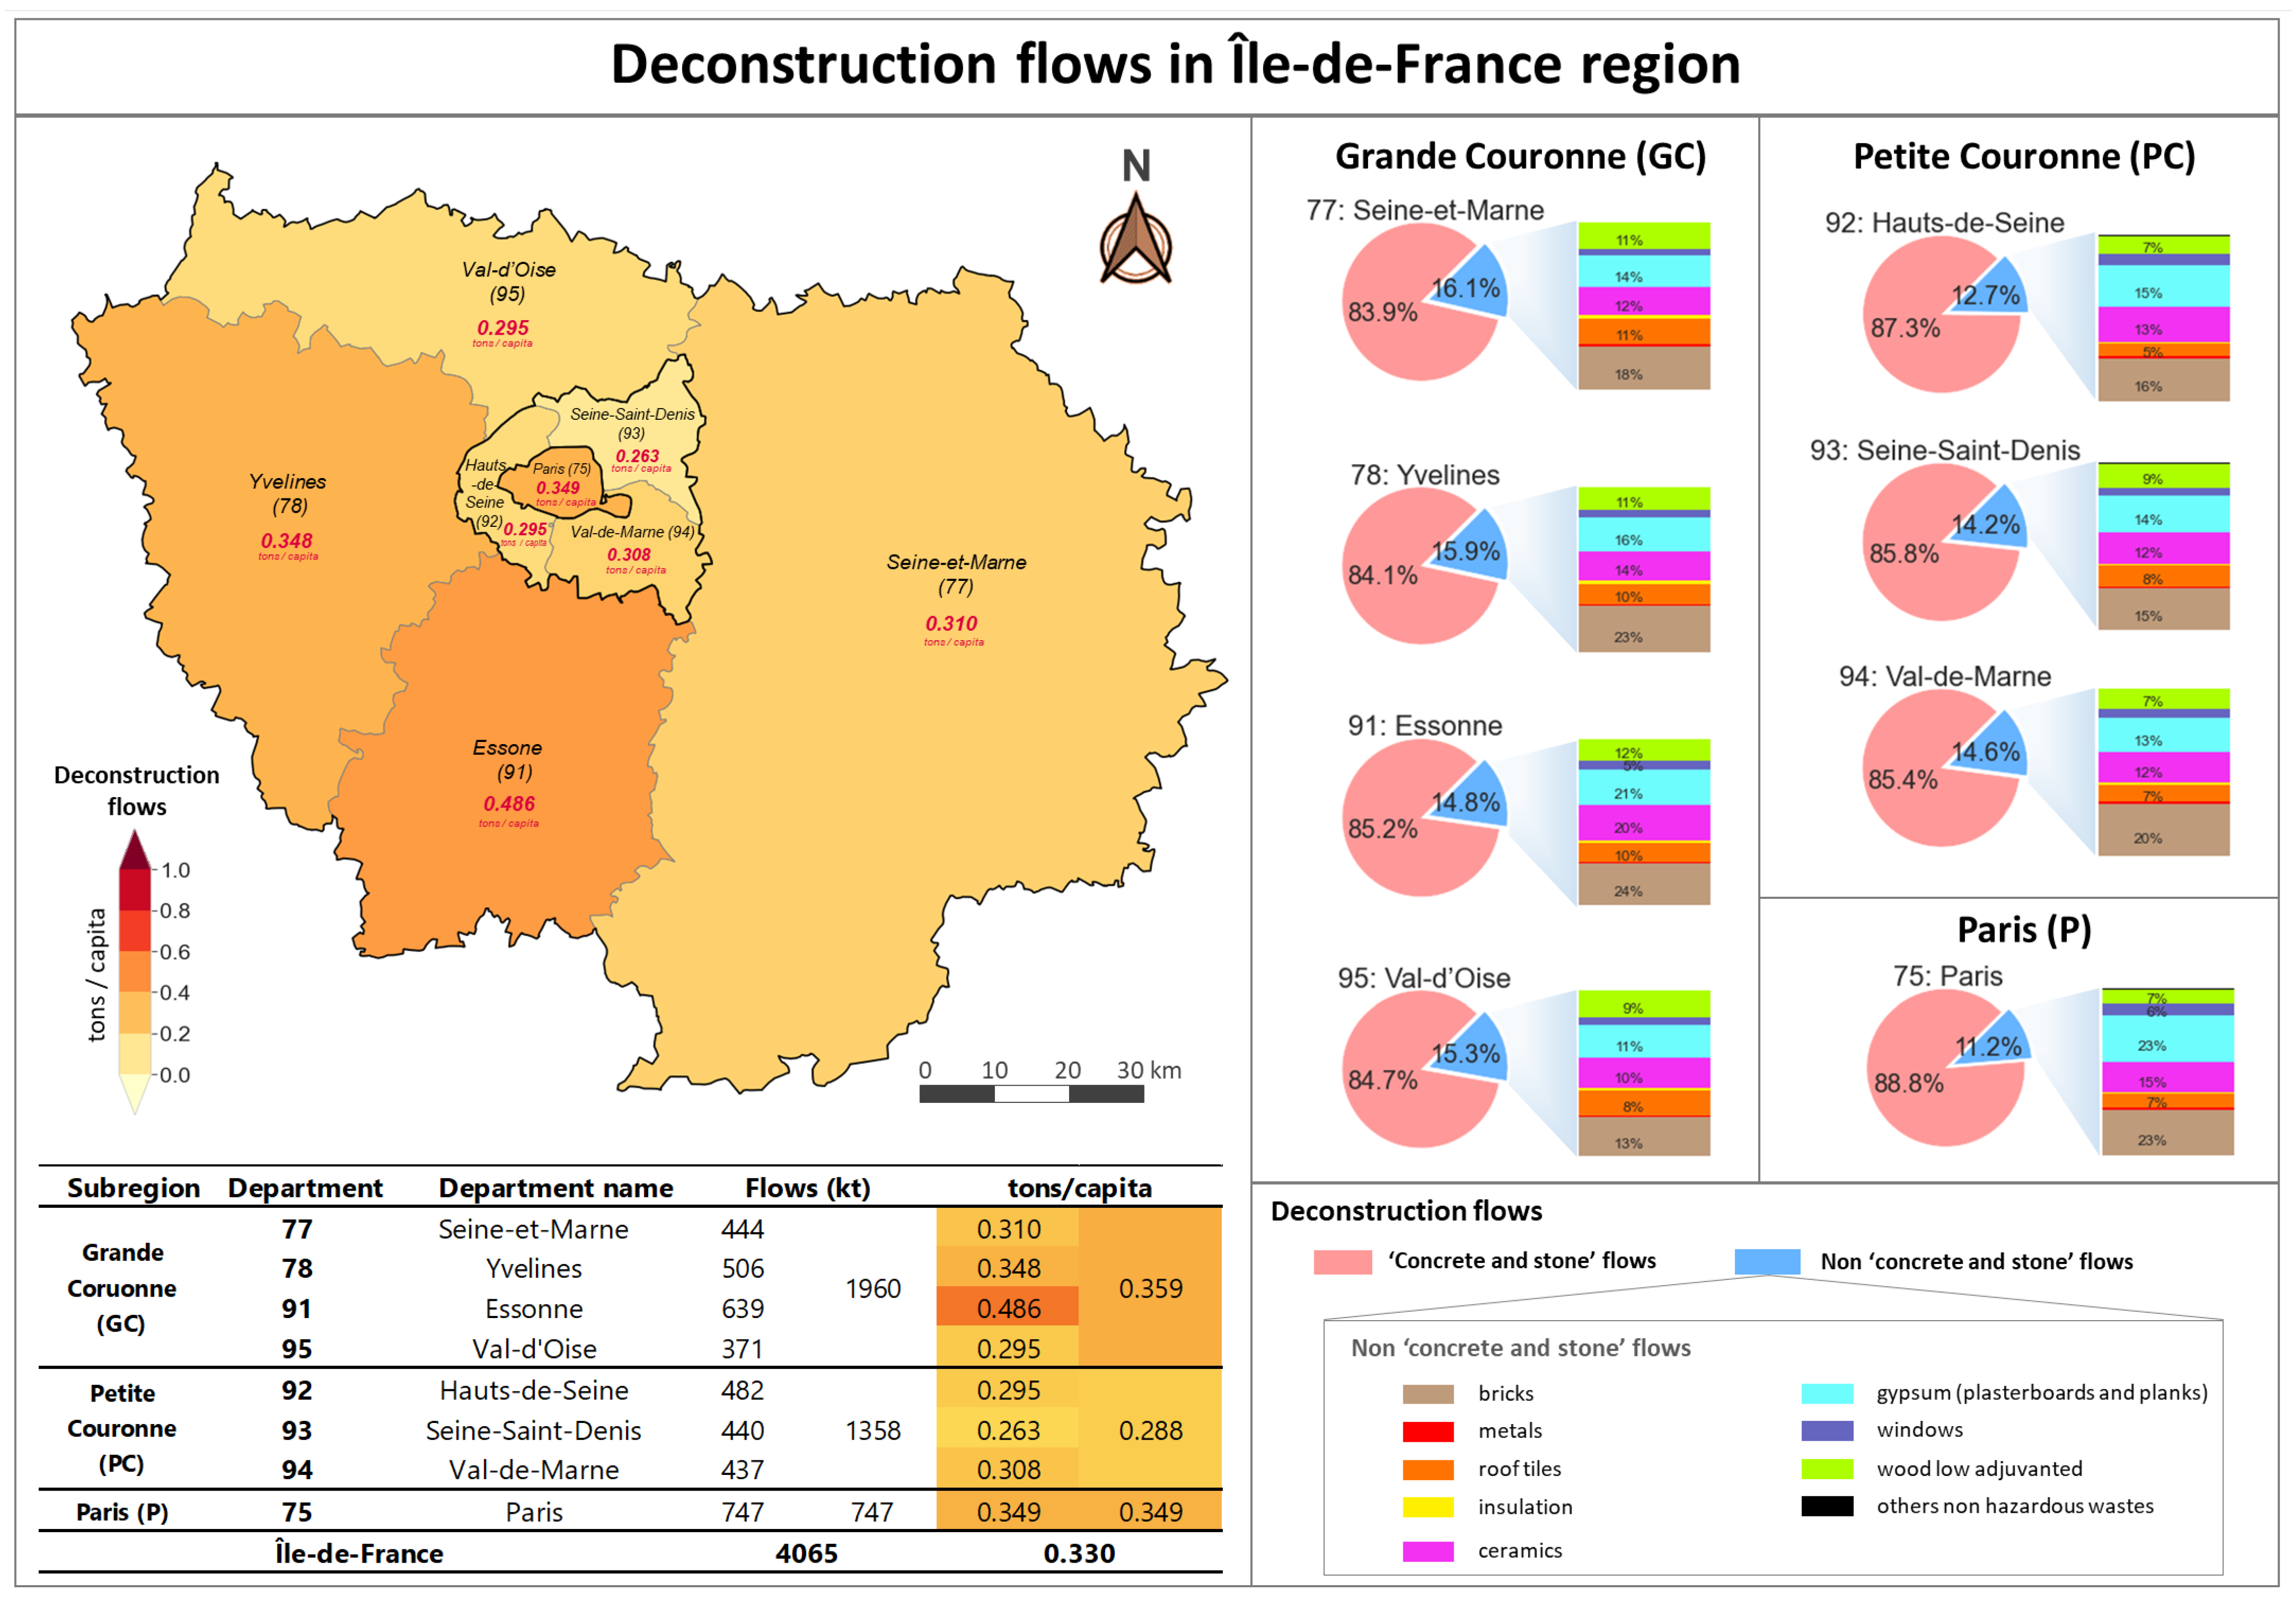
3.6. Material Flows
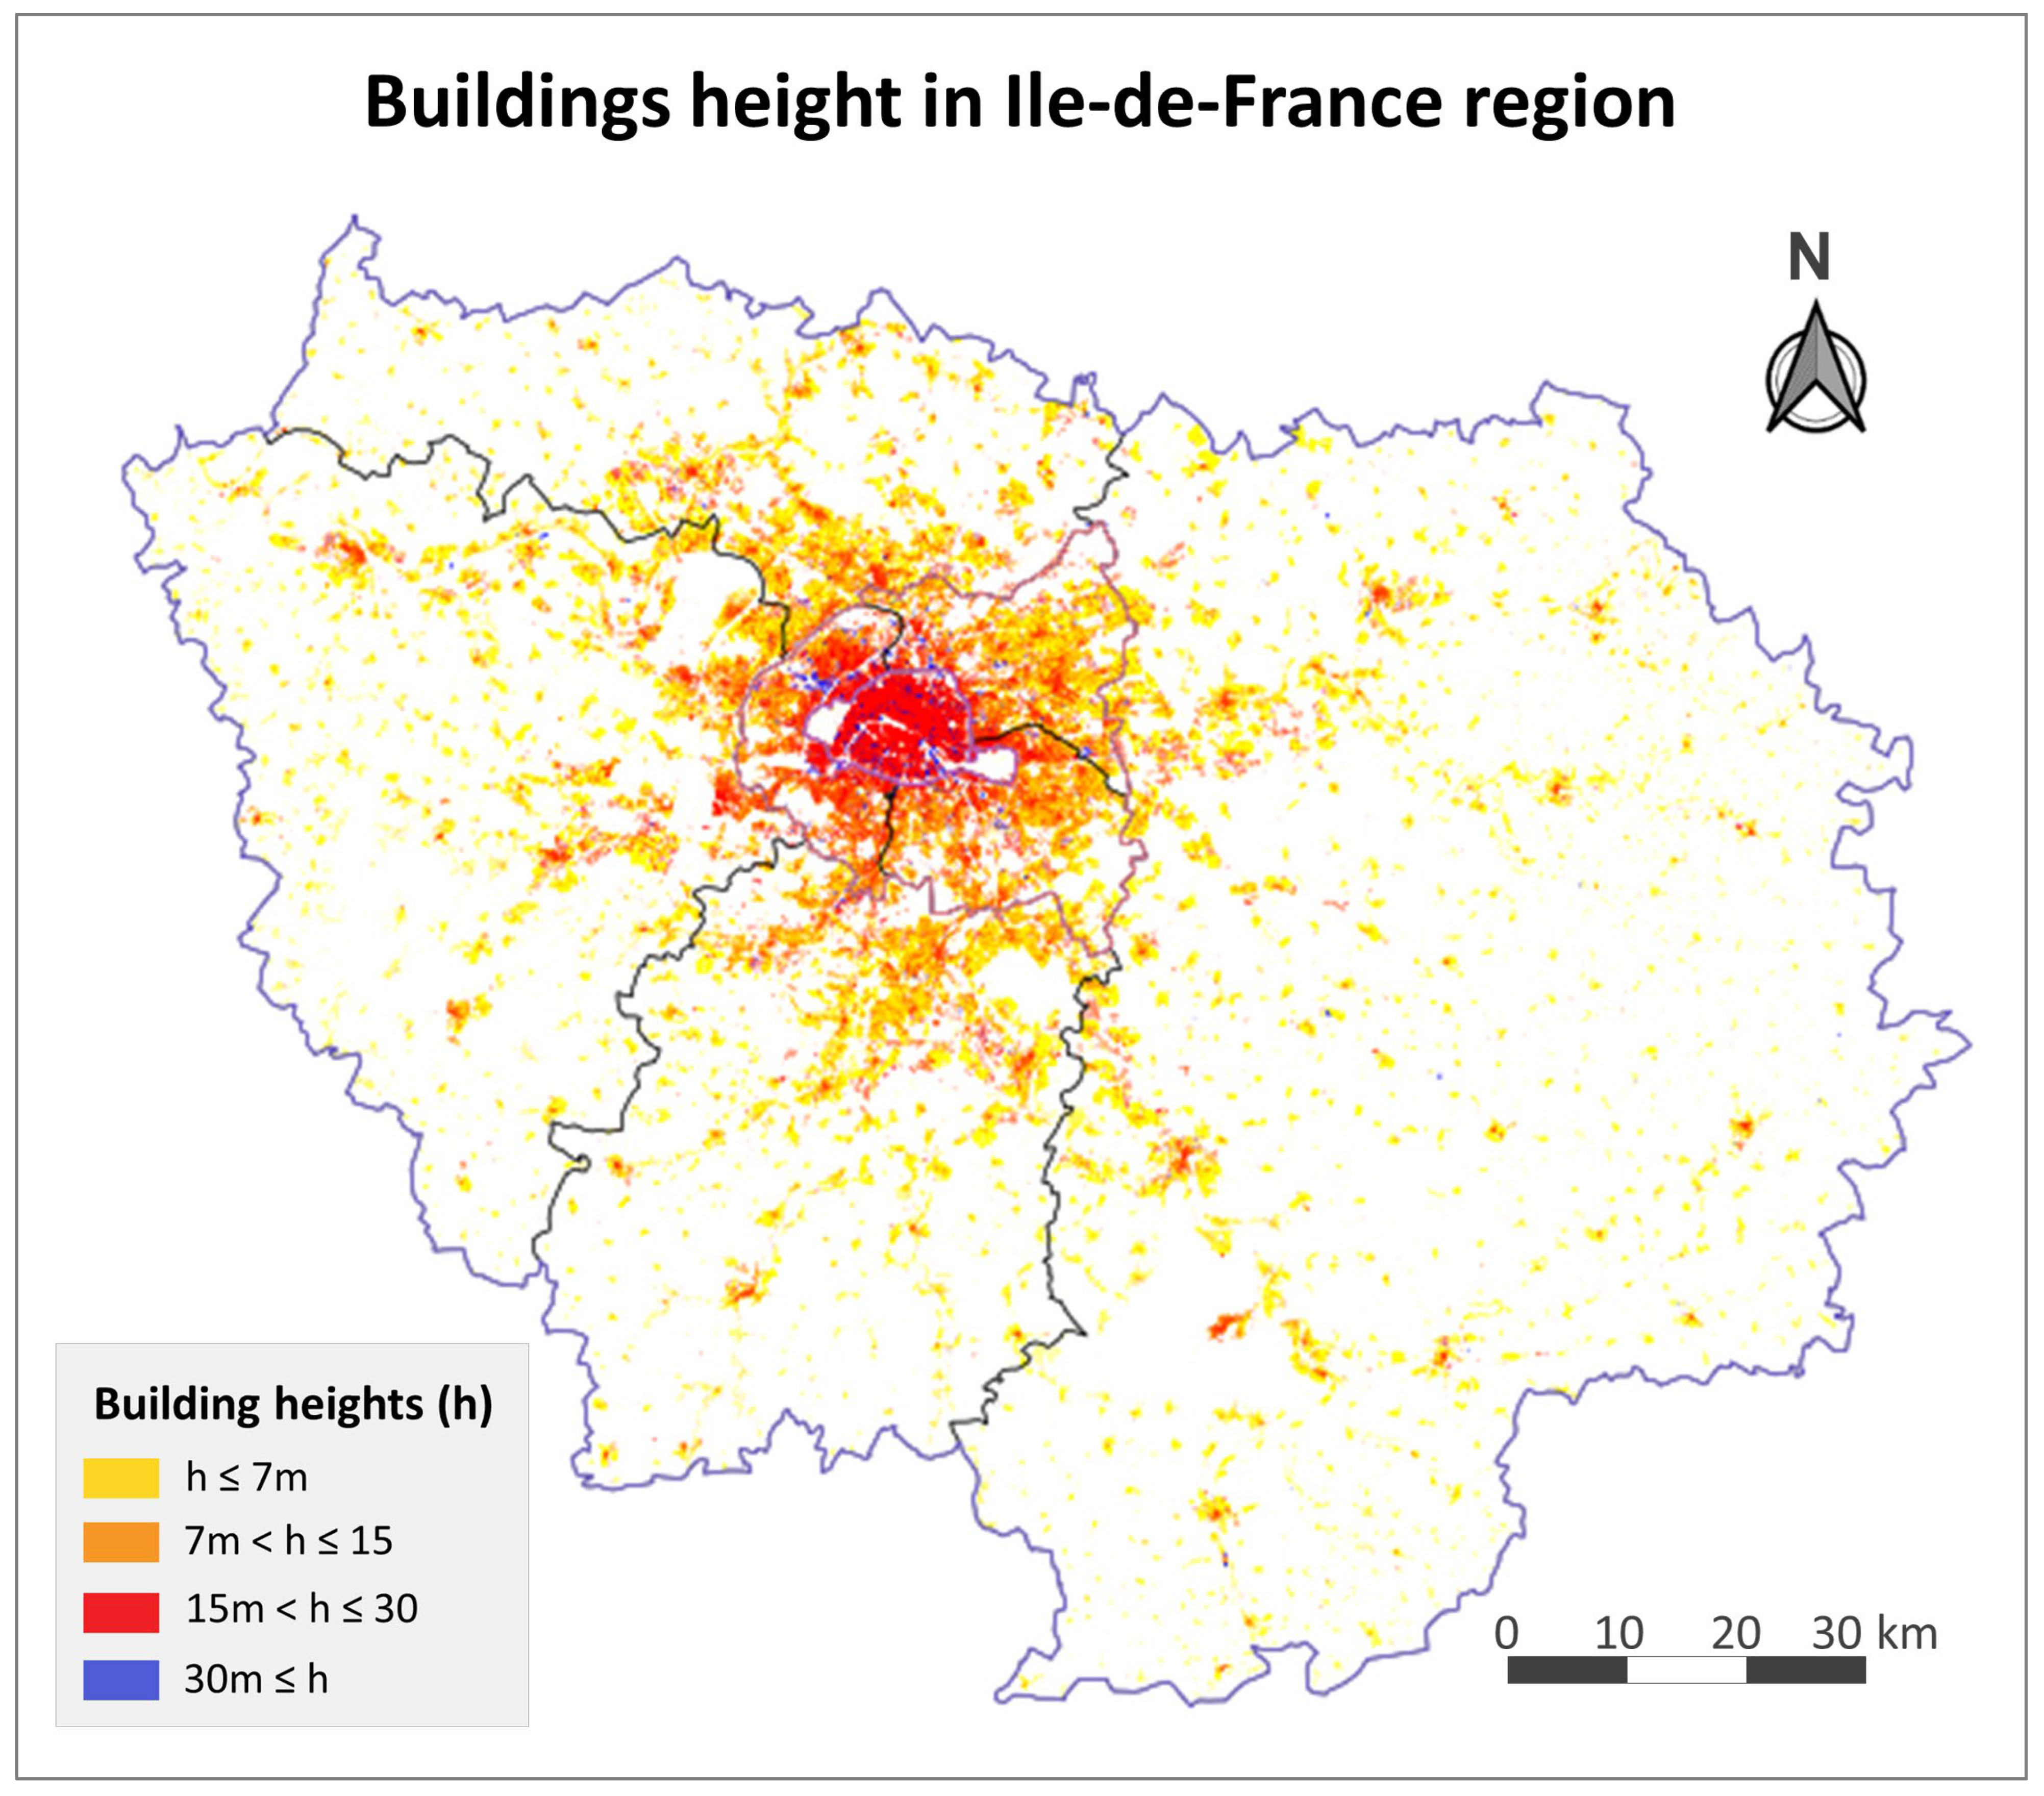
3.7. Relationship between Urbanization, Material Stock, and Demolition Flows
4. Discussion
4.1. Comparison with Previous Studies
4.2. Model Utility and Result Application
4.3. Limitations and Future Research
4.3.1. Data Availability
4.3.2. Model
4.3.3. Flow Estimation
4.3.4. Uncertainties
5. Conclusions
Supplementary Materials
Author Contributions
Funding
Institutional Review Board Statement
Informed Consent Statement
Data Availability Statement
Acknowledgments
Conflicts of Interest
Appendix A

| Reference | Geographic Boundaries | Period under Study | Buildings Use | Number of Building Type |
|---|---|---|---|---|
| [89] | France | Before 2000 | R | 26 |
| [90] | Paris suburbs | Before 1920–1940 | CH | / |
| [91] | Paris | 1945–1974 | R and NR | 6 |
| [92] | France | 1850–2014 | R | 40 |
| [93] | France | Before 1948 | R | 19 |
| [94] | France | 1950–1984 | CH | 10 |
| [95] | France | 1949–1981 | CH | 4 |
| [96] | Paris | Before 1800–2000 | CH | 13 |
| [97] | France | Before 1948 | R | 7 |
| [98] | France | Before 1918 | R | 10 |
| [99] | France | Before 1914–2000 | R | 46 |
| [100] | France | 1947–1997 | R | / |
| [101] | Saint-Denis (Paris North) | 1850–1914 | R | 20 |
| CSTB studies on building stock | France | Before 1914–2020 | R and NR | / |
Appendix B
Appendix C


References
- United Nations. World Urbanization Prospects: The 2018 Revision. 2018. Available online: https://population.un.org/wup/Publications/ (accessed on 18 June 2020).
- Ellen Macarthur Foundation. Circular Economy in Cities: Project Guide. 2019. Available online: https://www.ellenmacarthurfoundation.org/assets/downloads/CE-in-Cities-Project-Guide_Mar19.pdf (accessed on 24 March 2021).
- Lanau, M.; Liu, G. Developing an Urban Resource Cadaster for Circular Economy: A Case of Odense, Denmark. Environ. Sci. Technol. 2020, 54, 4675–4685. [Google Scholar] [CrossRef]
- Augiseau, V.; Barles, S. Studying construction materials flows and stock: A review. Resour. Conserv. Recycl. 2017, 123, 153–164. [Google Scholar] [CrossRef]
- Rosado, L.; Kalmykova, Y.; Patrício, J. Urban metabolism profiles. An empirical analysis of the material flow characteristics of three metropolitan areas in Sweden. J. Clean. Prod. 2016, 126, 206–217. [Google Scholar] [CrossRef]
- Göswein, V.; Silvestre, J.D.; Habert, G.; Freire, F. Dynamic Assessment of Construction Materials in Urban Building Stocks: A Critical Review; American Chemical Society: Washington, DC, USA, 2019; Volume 53, pp. 9992–10006. [Google Scholar]
- Menegaki, M.; Damigos, D. A review on current situation and challenges of construction and demolition waste management. Curr. Opin. Green Sustain. Chem. 2018, 13, 8–15. [Google Scholar] [CrossRef]
- Ajayi, S.O.; Oyedele, L.O. Policy imperatives for diverting construction waste from landfill: Experts’ recommendations for UK policy expansion. J. Clean. Prod. 2017, 147, 57–65. [Google Scholar] [CrossRef] [Green Version]
- Villoria Sáez, P.; Osmani, M. A diagnosis of construction and demolition waste generation and recovery practice in the European Union. J. Clean. Prod. 2019, 241, 118400. [Google Scholar] [CrossRef]
- Yuan, H.; Shen, L. Trend of the research on construction and demolition waste management. Waste Manag. 2011, 31, 670–679. [Google Scholar] [CrossRef] [PubMed]
- Tam, V.W.; Li, J.; Cai, H. System dynamic modeling on construction waste management in Shenzhen, China. Waste Manag. Res. 2014, 32, 441–453. [Google Scholar] [CrossRef]
- Ma, M.; Tam, V.W.Y.; Le, K.N.; Li, W. Challenges in current construction and demolition waste recycling: A China study. Waste Manag. 2020, 118, 610–625. [Google Scholar] [CrossRef]
- Petit-Boix, A.; Leipold, S. Circular economy in cities: Reviewing how environmental research aligns with local practices. J. Clean. Prod. 2018, 195, 1270–1281. [Google Scholar] [CrossRef]
- UNEP Resource Efficiency and Climate Change: Material Efficiency Strategies for a Low-Carbon Future. 2020. Available online: https://www.resourcepanel.org/reports/resource-efficiency-and-climate-change (accessed on 25 March 2021).
- Ministère de la Transition Écologie. The Anti-Waste Law in the Dailylives of the French People: What Does That Mean in Practice? 2020. Available online: https://circulareconomy.europa.eu/platform/sites/default/files/anti-waste_law_in_the_daily_lives_of_french_people.pdf (accessed on 24 March 2021).
- Alnajem, M.; Mostafa, M.M.; Elmelegy, A.R. Mapping the first decade of circular economy research: A bibliometric network analysis. J. Ind. Prod. Eng. 2020, 38, 29–50. [Google Scholar] [CrossRef]
- Pomponi, F.; Moncaster, A. Circular economy for the built environment: A research framework. J. Clean. Prod. 2017, 143, 710–718. [Google Scholar] [CrossRef] [Green Version]
- Schiller, G.; Müller, F.; Ortlepp, R. Mapping the anthropogenic stock in Germany: Metabolic evidence for a circular economy. Resour. Conserv. Recycl. 2017, 123, 93–107. [Google Scholar] [CrossRef]
- Pauliuk, S.; Wang, T.; Müller, D.B. Moving toward the circular economy: The role of stocks in the Chinese steel cycle. Environ. Sci. Technol. 2012, 46, 148–154. [Google Scholar] [CrossRef] [Green Version]
- Domingo, N.; Batty, T. Construction waste modelling for residential construction projects in New Zealand to enhance design outcomes. Waste Manag. 2021, 120, 484–493. [Google Scholar] [CrossRef]
- Schiller, G.; Gruhler, K.; Ortlepp, R. Continuous Material Flow Analysis Approach for Bulk Nonmetallic Mineral Building Materials Applied to the German Building Sector. J. Ind. Ecol. 2017, 21, 673–688. [Google Scholar] [CrossRef]
- Van der Voet, E.; Kleijn, R.; Huele, R.; Ishikawa, M.; Verkuijlen, E. Predicting future emissions based on characteristics of stocks. Ecol. Econ. 2002, 41, 223–234. [Google Scholar] [CrossRef]
- Cao, Z.; Shen, L.; Zhong, S.; Liu, L.; Kong, H.; Sun, Y. A Probabilistic Dynamic Material Flow Analysis Model for Chinese Urban Housing Stock. J. Ind. Ecol. 2018, 22, 377–391. [Google Scholar] [CrossRef]
- Ellen Macarthur Foundation. The Built Environment: Two Key Circular Investment Opportunities for a Resilient and Low-Carbon Economic Recovery. Available online: https://www.ellenmacarthurfoundation.org/our-work/activities/covid-19/the-built-environment (accessed on 24 March 2021).
- Stephan, A.; Athanassiadis, A. Towards a more circular construction sector: Estimating and spatialising current and future non-structural material replacement flows to maintain urban building stocks. Resour. Conserv. Recycl. 2018, 129, 248–262. [Google Scholar] [CrossRef]
- Müller, E.; Hilty, L.M.; Widmer, R.; Schluep, M.; Faulstich, M. Modeling metal stocks and flows: A review of dynamic material flow analysis methods. Environ. Sci. Technol. 2014, 48, 2102–2113. [Google Scholar] [CrossRef]
- Lanau, M.; Liu, G.; Kral, U.; Wiedenhofer, D.; Keijzer, E.; Yu, C.; Ehlert, C. Taking Stock of Built Environment Stock Studies: Progress and Prospects. Environ. Sci. Technol. 2019, 53, 8499–8515. [Google Scholar] [CrossRef]
- Röck, M.; Baldereschi, E.; Verellen, E.; Passer, A.; Sala, S.; Allacker, K. Environmental modelling of building stocks—An integrated review of life cycle-based assessment models to support EU policy making. Renew. Sustain. Energy Rev. 2021, 151, 111550. [Google Scholar] [CrossRef]
- Athanassiadis, A. Economie Circulaire Dans le Secteur de la Construction à Bruxelles: État des Lieux, Enjeux et Modèle à Venir. 2017. Available online: http://www.circulareconomy.brussels/wp-content/uploads/2017/10/RAP_2017_Economie-Circulaire-Construction.pdf (accessed on 7 January 2019).
- Schiller, G.; Bimesmeier, T.; Pham, A.T.V. Method for quantifying supply and demand of construction minerals in urban regions—A case study of hanoi and its Hinterland. Sustainability 2020, 12, 4358. [Google Scholar] [CrossRef]
- Tanikawa, H.; Fishman, T.; Okuoka, K.; Sugimoto, K. The weight of society over time and space: A comprehensive account of the construction material stock of Japan, 1945–2010. J. Ind. Ecol. 2015, 19, 778–791. [Google Scholar] [CrossRef]
- Mesta, C.; Kahhat, R.; Santa-Cruz, S. Geospatial Characterization of Material Stock in the Residential Sector of a Latin-American City. J. Ind. Ecol. 2019, 23, 280–291. [Google Scholar] [CrossRef] [Green Version]
- Hu, M.; van der Voet, E.; Huppes, G. Dynamic Material Flow Analysis for Strategic Construction and Demolition Waste Management in Beijing. J. Ind. Ecol. 2010, 14, 440–456. [Google Scholar] [CrossRef]
- Han, J.; Chen, W.Q.; Zhang, L.; Liu, G. Uncovering the Spatiotemporal Dynamics of Urban Infrastructure Development: A High Spatial Resolution Material Stock and Flow Analysis. Environ. Sci. Technol. 2018, 52, 12122–12132. [Google Scholar] [CrossRef] [PubMed]
- Wang, H.; Chen, D.; Duan, H.; Yin, F.; Niu, Y. Characterizing urban building metabolism with a 4D-GIS model: A case study in China. J. Clean. Prod. 2019, 228, 1446–1454. [Google Scholar] [CrossRef]
- Miatto, A.; Schandl, H.; Forlin, L.; Ronzani, F.; Borin, P.; Giordano, A.; Tanikawa, H. A spatial analysis of material stock accumulation and demolition waste potential of buildings: A case study of Padua. Resour. Conserv. Recycl. 2019, 142, 245–256. [Google Scholar] [CrossRef]
- Heeren, N.; Fishman, T. A database seed for a community-driven material intensity research platform. Sci. Data 2019, 6, 23. [Google Scholar] [CrossRef]
- Yang, D.; Guo, J.; Sun, L.; Shi, F.; Liu, J.; Tanikawa, H. Urban buildings material intensity in China from 1949 to 2015. Resour. Conserv. Recycl. 2020, 159, 104824. [Google Scholar] [CrossRef]
- Schiller, G.; Miatto, A.; Gruhler, K.; Ortlepp, R.; Deilmann, C.; Tanikawa, H. Transferability of Material Composition Indicators for Residential Buildings: A Conceptual Approach Based on a German-Japanese Comparison. J. Ind. Ecol. 2019, 23, 796–807. [Google Scholar] [CrossRef]
- Tanikawa, H.; Hashimoto, S. Urban stock over time: Spatial material stock analysis using 4d-GIS. Build. Res. Inf. 2009, 37, 483–502. [Google Scholar] [CrossRef]
- Kleemann, F.; Lederer, J.; Rechberger, H.; Fellner, J. GIS-based Analysis of Vienna’s Material Stock in Buildings. J. Ind. Ecol. 2017, 21, 368–380. [Google Scholar] [CrossRef]
- Gontia, P.; Nägeli, C.; Rosado, L.; Kalmykova, Y.; Österbring, M. Material-intensity database of residential buildings: A case-study of Sweden in the international context. Resour. Conserv. Recycl. 2018, 130, 228–239. [Google Scholar] [CrossRef]
- Ortlepp, R.; Gruhler, K.; Schiller, G. Material stocks in Germany’s non-domestic buildings: A new quantification method. Build. Res. Inf. 2016, 44, 840–862. [Google Scholar] [CrossRef]
- Schebek, L.; Schnitzer, B.; Blesinger, D.; Köhn, A.; Miekley, B.; Linke, H.J.; Lohmann, A.; Motzko, C.; Seemann, A. Material stocks of the non-residential building sector: The case of the Rhine-Main area. Resour. Conserv. Recycl. 2017, 123, 24–36. [Google Scholar] [CrossRef]
- Arora, M.; Raspall, F.; Cheah, L.; Silva, A. Residential building material stocks and component-level circularity: The case of Singapore. J. Clean. Prod. 2019, 216, 239–248. [Google Scholar] [CrossRef]
- Kleemann, F.; Lederer, J.; Aschenbrenner, P.; Rechberger, H.; Fellner, J. A method for determining buildings material composition prior to demolition. Build. Res. Inf. 2016, 44, 51–62. [Google Scholar] [CrossRef]
- Mata, É.; Sasic Kalagasidis, A.; Johnsson, F.; Mata, E.; Kalagasidis, A.S.; Johnsson, F. Building-stock aggregation through archetype buildings: France, Germany, Spain and the UK. Build. Environ. 2014, 81, 270–282. [Google Scholar] [CrossRef] [Green Version]
- Cerezo, C.; Sokol, J.; Reinhart, C.; Al-Mumin, A. Three Methods for Characterizing Building Archetypes in Urban Energy Simulation. A Case Study in Kuwait City. 2015. Available online: http://web.mit.edu/SustainableDesignLab/publications/BS2015_KuwaitModel.pdf (accessed on 11 January 2019).
- Sousa, C.; Cerezo, C.; Pina, A.; Ferrão, P. A Method for the Generation of Multi-Detail Building Archetype Definitions: Application to the City of Lisbon. 2015. Available online: https://infoscience.epfl.ch/record/213443/files/9_SOUSA.pdf (accessed on 11 January 2019).
- Loga, T.; Stein, B.; Diefenbach, N. TABULA building typologies in 20 European countries—Making energy-related features of residential building stocks comparable. Energy Build. 2016, 132, 4–12. [Google Scholar] [CrossRef]
- Mastrucci, A.; Marvuglia, A.; Leopold, U.; Benetto, E. Life Cycle Assessment of building stocks from urban to transnational scales: A review. Renew. Sustain. Energy Rev. 2017, 74, 316–332. [Google Scholar] [CrossRef]
- Volk, R.; Stengel, J.; Schultmann, F. Building Information Modeling (BIM) for existing buildings—Literature review and future needs. Autom. Constr. 2014, 38, 109–127. [Google Scholar] [CrossRef] [Green Version]
- Rose, C.M.; Stegemann, J.A. Characterising existing buildings as material banks (E-BAMB) to enable component reuse. Proc. Inst. Civ. Eng. Eng. Sustain. 2018, 172, 129–140. [Google Scholar] [CrossRef] [Green Version]
- Copeland, S.; Bilec, M. Buildings as material banks using RFID and building information modeling in a circular economy. Procedia CIRP 2020, 90, 143–147. [Google Scholar] [CrossRef]
- Cheng, J.C.P.; Ma, L.Y.H. A BIM-based system for demolition and renovation waste estimation and planning. Waste Manag. 2013, 33, 1539–1551. [Google Scholar] [CrossRef]
- Su, S.; Li, S.; Ju, J.; Wang, Q.; Xu, Z. A building information modeling-based tool for estimating building demolition waste and evaluating its environmental impacts. Waste Manag. 2021, 134, 159–169. [Google Scholar] [CrossRef]
- Kim, Y.C.; Hong, W.H.; Park, J.W.; Cha, G.W. An estimation framework for building information modeling (BIM)-based demolition waste by type. Waste Manag. Res. 2017, 35, 1285–1295. [Google Scholar] [CrossRef] [PubMed]
- Augiseau, V.; Barles, S. Bilan de Flux de Matières de la Région Ile-de-France en 2015. Available online: https://www.researchgate.net/publication/346604865_Bilan_de_flux_de_matieres_de_la_region_Ile-de-France_en_2015 (accessed on 8 February 2021).
- Augiseau, V. La Dimension Matérielle de l’urbanisation—Flux et Stocks de Matériaux de Construction en Ile-de-France, Université Paris 1 Panthéon-Sorbonne. 2017. Available online: http://www.theses.fr/2017PA01H111 (accessed on 11 January 2019).
- Augiseau, V. Construction materials flows and stocks in Paris region: An overview. Ecocycles 2020, 6, 18–22. [Google Scholar] [CrossRef]
- Augiseau, V.; Kim, E. Inflows and Outflows from Material Stocks of Buildings and Networks and their Space-Differentiated Drivers: The Case Study of the Paris Region. Sustainability 2021, 13, 1376. [Google Scholar] [CrossRef]
- Mastrucci, A.; Marvuglia, A.; Popovici, E.; Leopold, U.; Benetto, E. Geospatial characterization of building material stocks for the life cycle assessment of end-of-life scenarios at the urban scale. Resour. Conserv. Recycl. 2017, 123, 54–66. [Google Scholar] [CrossRef]
- Cerema. Les Fichiers Fonciers, Données Foncières Pour l’Aménagement. Available online: https://datafoncier.cerema.fr/donnees/fichiers-fonciers (accessed on 4 August 2021).
- IGN BD TOPO®|Géoservices. La Modélisation 2D et 3D du Territoire et de ses Infrastructures sur l’Ensemble du Territoire Français. Available online: https://geoservices.ign.fr/bdtopo (accessed on 4 August 2021).
- ADEME. Diagnostics de Performance Energétique pour les Logements par Habitation. Available online: https://data.ademe.fr/datasets/dpe-france (accessed on 4 August 2021).
- Mailhac, A. Contribution au Développement d’une Méthodologie D’évaluation Environnementale aux Echelles Urbaines, Université de Toulouse. 2019. Available online: https://tel.archives-ouvertes.fr/tel-02889301/ (accessed on 12 October 2019).
- European Commission. Directive 2008/98/EC of the European Parliament and of the Council. Available online: https://eur-lex.europa.eu/eli/dir/2008/98/oj (accessed on 19 August 2021).
- European Commission. Commission Notice on Technical Guidance on the Classification of Waste C/2018/1447. Available online: https://eur-lex.europa.eu/legal-content/EN/TXT/?uri=uriserv:OJ.C_.2018.124.01.0001.01.ENG&toc=OJ:C:2018:124:TOC (accessed on 19 August 2021).
- European Commission. Commission Decision 2000/532/EC of 3 May 2000 (European Waste Catalog). Available online: https://eur-lex.europa.eu/legal-content/EN/ALL/?uri=celex%3A32000D0532 (accessed on 19 August 2021).
- Ministère de l’Ecologie. Décret N° 2011-610 du 31 mai 2011 Relatif au Diagnostic Portant sur la Gestion des Déchets Issus de la Démolition de Catégories de Bâtiments. 2011. Available online: https://www.legifrance.gouv.fr/loda/id/JORFTEXT000024099263/ (accessed on 19 August 2021).
- Ministère Chargé de la Construction. Formulaire de Récolement Relatif au Diagnostic Portant sur la Gestion des Déchets Issus de la Démolition; France. 2011. Available online: https://www.formulaires.service-public.fr/gf/cerfa_14498.do (accessed on 24 March 2021).
- Ministère de la Transition Ecologique. Stratégie Nationale Bas-Carbone (SNBC). Available online: https://www.ecologie.gouv.fr/strategie-nationale-bas-carbone-snbc (accessed on 12 August 2021).
- Traisnel, J.; Maïzia, M.; Roditi, D. Habitat et développement durable: Les perspectives offertes par le solaire thermique. Les Cah. CLIP 2004, 16, 3–46. [Google Scholar]
- Ministère de la Transition Ecologique. La Base de Données Sitadel2: Méthodologie|Données et Etudes Statistiques. Available online: https://www.statistiques.developpement-durable.gouv.fr/la-base-de-donnees-sitadel2-methodologie (accessed on 19 August 2021).
- ADEME. l’Exercice de Prospective de l’Adème: Vision 2030–2050. 2012. Available online: https://www.ademe.fr/sites/default/files/assets/documents/85536_vision_2030-2050_document_technique.pdf (accessed on 19 August 2021).
- Institut d’Aménagement et d’Urbanisme_Ile-de-France. Éclairage sur la Rénovation Energétique du Bâti. 2018. Available online: https://www.institutparisregion.fr/fileadmin/NewEtudes/Etude_1765/EclairageRenovEnergetiquePREE_mai2018_CordeauSpadaro.pdf (accessed on 19 August 2021).
- Horvitz, D.G.; Thompson, D.J. A Generalization of Sampling without Replacement from a Finite Universe. J. Am. Stat. Assoc. 1952, 47, 663–685. [Google Scholar] [CrossRef]
- Brown, G.P. Billingsley, Probability and measure (Wiley, 1979), pp. 532,£ 28· 95. Proc. Edinb. Math. Soc. 1983, 26, 398–399. [Google Scholar] [CrossRef] [Green Version]
- Barles, S. Urban metabolism of Paris and its region. J. Ind. Ecol. 2009, 13, 898–913. [Google Scholar] [CrossRef]
- Insee. Estimation de la Population au 1er Janvier 2021. Available online: https://www.insee.fr/fr/statistiques/1893198 (accessed on 18 May 2021).
- Insee. Définition—Unité Statistique. Available online: https://www.insee.fr/en/metadonnees/definition/c1528 (accessed on 22 June 2020).
- Région Île-de-France. Plan Régional de Prévention et de Gestion des Déchets (PRPGD). 2019. Available online: https://www.iledefrance.fr/espace-media/divers/PRPGPD/CHAPITRE-II.pdf (accessed on 18 May 2021).
- DRIEA. Documents d’Urbanisme et de Planification Sectorielle en Vigueur sur le Territoire Parisien. 2020. Available online: http://www.driea.ile-de-france.developpement-durable.gouv.fr/IMG/pdf/200206-schema_documents_en_vigueur_sur_le_territoire_parisien_janvier_2020_.pdf (accessed on 21 June 2020).
- Augiseau, V.; Kim, E. Spatial characterization of construction material stocks: The case of the Paris region. Resour. Conserv. Recycl. 2021, 170, 105512. [Google Scholar] [CrossRef]
- Direction Régionale de l’Equipement d’Ile-de-France. Déchets du BTP: Plan de Gestion Pour Paris et la Petite Couronne. 2004. Available online: http://www.driea.ile-de-france.developpement-durable.gouv.fr/IMG/pdf/planppcpt_cle0ab4e8.pdf (accessed on 7 August 2020).
- Conseil Régional Ile de France. PREDEC—Plan Régional de Prévention et de Géstion des Déchets Issus des Chantiers du Bâtiment et des Travaux Publics. 2015. Available online: https://www.iledefrance.fr/sites/default/files/medias/2019/05/predec_adopte2015.pdf (accessed on 13 July 2020).
- Rouvreau, L.; Michel, P.; Serrand, M.; Montfort Climent, D.; Jayr, E. Projet ANR ASURET Analyse de Flux de Matière du Secteur de la Construction à l’Echelle de l’Ouvrage et du Territoire; BRGM: Orléans, France, 2012; p. 13. Available online: http://infoterre.brgm.fr/rapports/RP-61849-FR.pdf (accessed on 26 January 2019).
- Liu, Q.; Cao, Z.; Liu, X.; Liu, L.; Dai, T.; Han, J.; Duan, H.; Wang, C.; Wang, H.; Liu, J.; et al. Product and Metal Stocks Accumulation of China’s Megacities: Patterns, Drivers, and Implications. Environ. Sci. Technol. 2019, 53, 4128–4139. [Google Scholar] [CrossRef] [PubMed]
- POUGET. Consultants Analyse Détaillée du parc Résidentiel Existant. 2017. Available online: https://www.programmepacte.fr/sites/default/files/pdf/ranalyseparcresidentielexistantneufrenojuil17073web.pdf (accessed on 5 August 2019).
- APUR. Les Habitations à bon Marché (HBM) de la Ceinture de Paris: Étude Historique. 2017. Available online: https://www.apur.org/sites/default/files/documents/publication/documents-associes/habitations_bon_marche_ceinture_paris_historique.pdf?token=Mu_3L2OA (accessed on 5 August 2019).
- APUR. Réhabilitation des Bâtiments Construits à Paris Entre 1945 et 1974—Pratiques Actuelles, Nouveaux Enjeux. 2016. Available online: https://www.apur.org/sites/default/files/documents/publication/documents-associes/rehabilitation_batiments_annees_60.pdf?token=77hWYW_L (accessed on 5 August 2019).
- POUGET Consultants. ADEME Bâtiments Résidentiels: Typologie du Parc Existant et Solutions Exemplaires Pour la Rénovation Energétique en France. 2015. Available online: https://episcope.eu/fileadmin/tabula/public/docs/brochure/FR_TABULA_TypologyBrochure_Pouget.pdf (accessed on 5 August 2019).
- Ecole Nationale des Travaux Publics de l’Etat (ENTPE); Centre d’études Techniques de l’équipement (CETE); Maisons Paysannes de France (MPF), Cerema; Institut des Sciences Appliquées (INSA) de Strasbourg. BATAN: Modélisation du Comportement Thermique du Bâtiment Ancien Avant 1948. 2011. Available online: https://www.rehabilitation-bati-ancien.fr/sites/creba/files/fichiers/2021/09/006_BATAN_ENTPE_CETE_Est_et_Ouest.pdf (accessed on 5 August 2019).
- Agence Nationale de l’Habitat (ANAH); PACT; SOCOTEC. Les Copropriétés des Années 50 à 80: Un Parc à Enjeux. 2011. Available online: www.businessimmo.com/etudes/29132/les-coproprietes-des-annees-50-a-80-un-parc-a-enjeux (accessed on 5 August 2019).
- Energies et Avenir. Energies Demain Rénovation Energétique des Logements en Collectif à Chauffage Collectif: Performance et Potentiel des Systèmes de Chauffage à eau Chaude. 2011. Available online: https://www.effinergie.org/web/images/attach/base_doc/1405/EA_renov-batimentsFINAL.pdf (accessed on 5 August 2019).
- APUR. Analyse de la Performance Thermique des Logements Parisiens. 2011. Available online: https://www.apur.org/fr/nos-travaux/analyse-performance-thermique-logements-parisiens (accessed on 5 August 2019).
- Tribu Energie; Maisons Paysannes de France (MPF). ENRABF, Concilier Economies D’énergie et Patrimoine. 2010. Available online: http://www.rehabilitation-bati-ancien.fr/fr/espace-documentaire/enrabf-concilier-economies-denergie-et-patrimoine (accessed on 5 August 2019).
- Centre d’Etudes Techniques de l’Equipement (CETE) de l’Es; Ecole Nationale des Travaux Publics de l’Etat (ENTPE); Maisons Paysannes de France (MPF). Connaissance des Bâtiments Anciens et Economies d’Energie. 2007. Available online: https://www.rehabilitation-bati-ancien.fr/sites/creba/files/fichiers/2021/09/039_Connaissance_bati_ancien_CETE_Est.pdf (accessed on 6 August 2019).
- Graulière, P. Typologie des Bâtiments d’Habitation en France. Synthèse des Caractéristiques des Bâtiments D’habitation Existants Permettant l’Evaluation du Potentiel d’Amélioration Energétique; Ministère de l’Ecologie, de l’Energie, du Développement Durable et de la Mer: Paris, France, 2007.
- Chemillier, P.; Buttenwieser, I.; Chevet, H. Panorama des Techniques du Bâtiment: 1947–1997; CSTB/Plan Construction et Architecture: Paris, France, 1997; Volume 335, ISBN 2-86891-272-9. [Google Scholar]
- Chiffard, J.-F. Typologie Opérationnelle de l’Habitat Ancien: 1850–1948; Volue 1 de Actes de Colloques; Plan Construction: Montreuil, France, 1976. [Google Scholar]


| European Commission [67,69] | France [71] | |||
|---|---|---|---|---|
| Code | Waste Subcategory | Waste Category | Waste Subcategory | Waste Category |
| 17 01 01 | Concrete | Concrete, bricks, tiles, ceramics, and gypsum-based materials (17 01) | Concrete and stone | IW |
| 17 01 02 | Bricks | Tiles and bricks | IW | |
| 17 01 03 | Tiles and ceramics | Ceramic (tiling, earthenware, and sanitary ware) | IW | |
| 17 01 04 | Gypsum-based construction materials | Gypsum | NHW | |
| 17 01 05 | Asbestos-based construction materials | Asbestos | HW | |
| 17 02 01 | Wood | Wood, glass and plastic (17 02) | Glass without joinery | IW |
| 17 02 02 | Glass | Wood | NHW | |
| 17 02 03 | Plastics | Treated wood containing dangerous substances | HW | |
| Plastics | NHW | |||
| 17 03 01 | Asphalt containing tar | Asphalt, tar and tarred products (17 03) | Bituminous mixtures without tar | IW |
| 17 03 02 | Asphalt not containing tar | Waterproofing complex without tar | NHW | |
| 17 03 03 | Tar and tar products | Waterproofing complex containing tar | HW | |
| Bituminous mixtures containing tar | HW | |||
| 17 04 01 | Copper, bronze, brass | Metals (including their alloys) (17 04) | Metals | NHW |
| 17 04 02 | Aluminum | |||
| 17 04 03 | Lead | |||
| 17 04 04 | Zinc | |||
| 17 04 05 | Iron and steel | |||
| 17 04 06 | Tin | |||
| 17 04 07 | Mixed metals | |||
| 17 04 08 | Cables | |||
| 17 05 03 | Soil and stones containing dangerous substances | Soil (including excavated soil from contaminated sites), stones, and dredging spoil (17 05) | Soils (excluding topsoil) unpolluted | IW |
| 17 05 04 | Soil and stones other than those mentioned in 17 05 03 | Plants | NHW | |
| 17 05 05 | Dredging spoil containing dangerous substances | Topsoil | NHW | |
| 17 05 06 | Dredging spoil other than those mentioned in 17 05 05 | Soils containing hazardous substances | HW | |
| 17 06 01 | Insulation materials containing asbestos | Insulation materials (17 06) | Insulation materials | NHW |
| 17 06 02 | Other insulation materials | Insulation materials containing asbestos | HW | |
| 17 07 02 | Mixed construction and demolition waste or separated fractions containing dangerous substances | Mixed construction and demolition waste (17 07) | Mixtures of inert waste without non-hazardous waste | IW |
| 17 07 03 | Mixed construction and demolition waste other than those mentioned in 17 07 02 | Mixtures of non-hazardous waste | NHW | |
| Windows and others glazed openings | NHW | |||
| Floor coverings | NHW | |||
| Wastes from electrical and electronic equipment | NHW | |||
| Paints containing dangerous substances | HW | |||
| Heating, air conditioning, or refrigeration equipment containing hazardous refrigerants | HW | |||
| Light sources (fluorescent tubes, neon lights, discharge lamps, LED lamps) | HW | |||
| Other wastes from electrical and electronic equipment containing dangerous substances | HW | |||
| Other inert waste | IW | |||
| Other non-hazardous waste | NHW | |||
| Other hazardous waste | HW | |||
| Building Use | Low Value | High Value |
|---|---|---|
| Individual housing | 0.00825 | 0.02258 |
| Collective housing | 0.00474 | 0.01297 |
| Industrial | 0.00730 | 0.00730 |
| Office and education | 0.00212 | 0.00940 |
| Building Use | Population | Sample |
|---|---|---|
| Individual housing | 28.55% | 6.10% |
| Collective housing | 40.73% | 1.20% |
| Industrial | 6.81% | 11.00% |
| Office | 10.21% | 16.10% |
| Education | 0.64% | 7.80% |
| Other | 12.85% | -------- |
| Unknown | 0.21% | -------- |
| Total | 100.00% | 4.50% |
| Building Use | Construction Period | Sample | Population | ||||||
|---|---|---|---|---|---|---|---|---|---|
| Ground Area | Floor Area | Ground Area | Floor Area | ||||||
| Million m2 | Proportion | Million m2 | Proportion | Million m2 | Proportion | Million m2 | Proportion | ||
| Collective housing (CH) | P0 (before 1919) | 0.57 | 1.20% | 2.33 | 3.80% | 29.41 | 2.10% | 114.91 | 5.70% |
| P1 (1919–1944) | 0.17 | 0.40% | 0.64 | 1.60% | 12.77 | 0.60% | 48.77 | 2.40% | |
| P2 (1945–1970) | 0.49 | 1.00% | 2.20 | 6.30% | 48.96 | 2.00% | 219.56 | 10.90% | |
| P3 (1971–1989) | 0.54 | 1.10% | 2.42 | 6.10% | 47.66 | 2.20% | 209.08 | 10.40% | |
| P4 (1990–2004) | 1.27 | 2.60% | 4.86 | 6.00% | 46.80 | 4.40% | 189.59 | 9.40% | |
| P5 (2005–2012) | 0.84 | 1.70% | 3.12 | 3.10% | 24.33 | 2.90% | 91.00 | 4.50% | |
| P6 (2013–2019) | 0.22 | 0.50% | 0.80 | 2.30% | 17.87 | 0.70% | 63.57 | 3.20% | |
| Individual housing (IH) | P0 (before 1919) | 0.56 | 1.20% | 0.85 | 8.40% | 65.98 | 0.80% | 100.18 | 5.00% |
| P1 (1919–1944) | 0.80 | 1.70% | 1.11 | 6.10% | 48.00 | 1.00% | 69.81 | 3.50% | |
| P2 (1945–1970) | 4.82 | 10.00% | 6.92 | 7.60% | 59.65 | 6.30% | 85.53 | 4.30% | |
| P3 (1971–1989) | 9.19 | 19.10% | 11.81 | 13.60% | 106.68 | 10.80% | 137.30 | 6.80% | |
| P4 (1990–2004) | 3.99 | 8.30% | 5.52 | 5.90% | 46.50 | 5.10% | 65.52 | 3.30% | |
| P5 (2005–2012) | 1.56 | 3.20% | 2.35 | 2.50% | 19.85 | 2.20% | 30.67 | 1.50% | |
| P6 (2013–2019) | 0.25 | 0.50% | 0.41 | 1.10% | 8.42 | 0.40% | 13.49 | 0.70% | |
| Office | P0 (before 1919) | 2.76 | 5.70% | 11.90 | 4.20% | 32.78 | 10.90% | 131.77 | 6.60% |
| P1 (1919–1944) | 0.50 | 1.00% | 1.89 | 1.00% | 7.51 | 1.70% | 24.50 | 1.20% | |
| P2 (1945–1970) | 0.61 | 1.30% | 1.78 | 1.70% | 13.54 | 1.60% | 39.68 | 2.00% | |
| P3 (1971–1989) | 1.02 | 2.10% | 3.16 | 1.60% | 12.32 | 2.90% | 35.57 | 1.80% | |
| P4 (1990–2004) | 2.66 | 5.50% | 8.02 | 2.60% | 20.60 | 7.30% | 63.06 | 3.10% | |
| P5 (2005–2012) | 2.36 | 4.90% | 8.49 | 1.60% | 12.48 | 7.80% | 44.75 | 2.20% | |
| P6 (2013–2019) | 0.71 | 1.50% | 2.31 | 0.80% | 6.45 | 2.10% | 20.57 | 1.00% | |
| Industrial | P0 (before 1919) | 0.49 | 1.00% | 1.15 | 0.90% | 7.38 | 1.00% | 16.95 | 0.80% |
| P1 (1919–1944) | 0.19 | 0.40% | 0.34 | 0.50% | 3.95 | 0.30% | 7.56 | 0.40% | |
| P2 (1945–1970) | 0.53 | 1.10% | 0.97 | 1.10% | 8.80 | 0.90% | 15.59 | 0.80% | |
| P3 (1971–1989) | 1.73 | 3.60% | 3.57 | 1.70% | 13.57 | 3.30% | 30.04 | 1.50% | |
| P4 (1990–2004) | 4.22 | 8.80% | 8.62 | 3.00% | 23.50 | 7.90% | 50.25 | 2.50% | |
| P5 (2005–2012) | 3.48 | 7.20% | 7.76 | 2.40% | 18.77 | 7.10% | 42.24 | 2.10% | |
| P6 (2013–2019) | 1.17 | 2.40% | 2.80 | 1.40% | 11.08 | 2.60% | 33.46 | 1.70% | |
| Education | P0 (before 1919) | 0.08 | 0.20% | 0.26 | 0.20% | 1.27 | 0.20% | 3.58 | 0.20% |
| P1 (1919–1944) | 0.02 | 0.00% | 0.04 | 0.00% | 0.06 | 0.00% | 0.17 | 0.00% | |
| P2 (1945–1970) | 0.02 | 0.00% | 0.05 | 0.10% | 0.44 | 0.00% | 1.05 | 0.10% | |
| P3 (1971–1989) | 0.03 | 0.10% | 0.06 | 0.10% | 0.69 | 0.10% | 1.77 | 0.10% | |
| P4 (1990–2004) | 0.14 | 0.30% | 0.35 | 0.20% | 1.76 | 0.30% | 3.49 | 0.20% | |
| P5 (2005–2012) | 0.11 | 0.20% | 0.33 | 0.10% | 1.09 | 0.30% | 2.86 | 0.10% | |
| P6 (2013–2019) | 0.05 | 0.10% | 0.14 | 0.10% | 0.96 | 0.10% | 2.58 | 0.10% | |
| Total | 48.12 | 100.00% | 109.28 | 100.00% | 781.89 | 100.00% | 2010.48 | 100% | |
Publisher’s Note: MDPI stays neutral with regard to jurisdictional claims in published maps and institutional affiliations. |
© 2021 by the authors. Licensee MDPI, Basel, Switzerland. This article is an open access article distributed under the terms and conditions of the Creative Commons Attribution (CC BY) license (https://creativecommons.org/licenses/by/4.0/).
Share and Cite
Tirado, R.; Aublet, A.; Laurenceau, S.; Thorel, M.; Louërat, M.; Habert, G. Component-Based Model for Building Material Stock and Waste-Flow Characterization: A Case in the Île-de-France Region. Sustainability 2021, 13, 13159. https://doi.org/10.3390/su132313159
Tirado R, Aublet A, Laurenceau S, Thorel M, Louërat M, Habert G. Component-Based Model for Building Material Stock and Waste-Flow Characterization: A Case in the Île-de-France Region. Sustainability. 2021; 13(23):13159. https://doi.org/10.3390/su132313159
Chicago/Turabian StyleTirado, Rafaela, Adélaïde Aublet, Sylvain Laurenceau, Mathieu Thorel, Mathilde Louërat, and Guillaume Habert. 2021. "Component-Based Model for Building Material Stock and Waste-Flow Characterization: A Case in the Île-de-France Region" Sustainability 13, no. 23: 13159. https://doi.org/10.3390/su132313159
APA StyleTirado, R., Aublet, A., Laurenceau, S., Thorel, M., Louërat, M., & Habert, G. (2021). Component-Based Model for Building Material Stock and Waste-Flow Characterization: A Case in the Île-de-France Region. Sustainability, 13(23), 13159. https://doi.org/10.3390/su132313159