Article

The Spatial and Temporal Characteristics of Industry–University Research Collaboration Efficiency in Chinese Mainland Universities

1
School of Management, China University of Mining and Technology, Xuzhou 221116, China
2
Scotland Academy, Wuxi Taihu University, Wuxi 214063, China
3
Graduate School, Wuxi University, Wuxi 214105, China
4
Department of Environmental Science and Engineering, Fudan University, Shanghai 200438, China
*
Author to whom correspondence should be addressed.
Sustainability 2021, 13(23), 13180; https://doi.org/10.3390/su132313180
Submission received: 30 September 2021 / Revised: 25 November 2021 / Accepted: 26 November 2021 / Published: 28 November 2021

Abstract

:
The aim of this study was to investigate the spatio-temporal characteristics of the industry–university research (IUR) collaboration efficiency of Chinese mainland colleges and universities, from 2008 to 2018. A comparative analysis method was used to analyze the data from the Statistical Yearbook of China’s Education Funds, the Compilation of Science and Technology Statistics of Colleges and Universities, and the China Statistical Yearbook. The principal components were extracted from relevant indicators of IUR capability in colleges and universities, with a principal component analysis (PCA) method. The principal component scores and comprehensive scores of 31 provinces in mainland China were calculated. The results showed that the efficiency of IUR collaboration in Chinese colleges and universities has increased rapidly within the 11 years studied. The efficiency in the eastern region has grown faster than that in the western region, and the gap between the southern region and the northern region has also continued to widen. The results also showed that the development of IUR collaboration efficiency of colleges and universities in mainland China is unbalanced. Scientific and technological funds, and scientific and technological manpower, were excessively concentrated in the southeast. Therefore, there is large room for improvement in the overall development of IUR collaboration in Chinese colleges and universities.

1. Introduction

With the rapid increase in the quantity and the quality of Chinese colleges and universities, the function of these higher education institutions has gradually developed from talent training to scientific research and social services. The competitiveness of colleges and universities therefore depends heavily on their IUR collaboration efficiency [1]. These higher education institutions have leading roles in the national innovation system, and are responsible for innovation and knowledge distribution [2]. Companies rely heavily on graduates and research sourced from colleges and universities. They take advantages of university knowledge bases and technologies to develop products and improve production processes, enhancing their competitiveness and profitability [3].
With the in-depth development of IUR collaboration, literature of this field is growing. The current research is mainly focused on four aspects of IUR collaboration.
First, various studies have focused on the necessity and motivation of IUR collaboration. In recent years, the technology of Chinese companies has been continuously improving; however, core technological areas that are key to the national economy, such as electronics, automobile and civil aviation, still have much room for improvement. In order to meet these social needs, the upgrading of Chinese higher education systems is particularly important. With this backdrop, IUR collaboration has achieved great breakthroughs. To some degree, these breakthroughs have demonstrated that the reform of Chinese educational systems is advancing social development [4,5]. As a main source of knowledge and technology, universities play an irreplaceable role in social development and economic progress [6]. On one hand, companies can leverage research results from universities to develop products and improve production processes [7]. On the other hand, when companies meet real-life problems related to technology and the production process, colleges and universities may help find solutions. This also offers opportunities to put theories into practice, and expand the existing knowledge base [8].
Secondly, studies have also focused on the current situations, problems and measures related to IUR collaboration. An analysis of the current IUR collaboration practices has shown that although the government has advocated and formulated a series of policies to encourage IUR collaboration, most companies still prefer a lower level of cooperation, and hold a negative view towards more intensive cooperation with universities. Researchers have systematically analyzed the composition of the technical capability in Chinese companies [9,10]. Two components of technical capability were proposed: basic technology capability and technological self-renewal capability. Game theory was also used to investigate the strategic equilibrium solution, for both a ‘loose cooperation model’ and a ‘tight cooperation model’ between companies, universities and other research institutions. By comparing the net incomes of IUR collaboration under these two models, the impact of enterprise technological capability on the optimal choice of the IUR collaboration model was revealed. Finally, the nature of the impact was tested based on the survey data. Li [11] proposed to improve relevant social systems such as legal system, policy and financial support. She also suggested to encourage the actions of colleges and universities to strengthen the leading roles of the market, and improve the level of IUR collaboration by drawing on IUR collaboration experience from developed countries [11].
Thirdly, there have been a number of studies focused on the mechanisms of IUR collaboration. Some researchers have investigated four enterprise innovation modes under oligopoly market structure, including patent cooperation, cooperative research and development (RD), independent RD, and patent pool-based RD. Researchers have pointed out that technology spillover and industrial characteristics are the main drivers that influence the choice of enterprise IUR collaboration mode [12,13,14]. Li [15] and He [16] both discussed the driving factors and mechanisms of collaborative innovation. Su [17] and Kang [18] studied the regional collaborative innovation system. Schartinger et al. [19] suggested there are two indicators in the evaluation system of IUR collaborative innovation for scientific and technological enterprises, which are the level of process innovation and the level of product innovation.
The fourth aspect is education under the background of IUR collaboration. American cooperative education in 1946 was the starting point of “collaborative education” in IUR collaboration. The University of Cincinnati emphasized the relationship between theory and practice and sought ways to enrich their teaching contents and methods. The university implemented this idea through the cooperation with other practical institutions [20,21,22,23,24]. The most representative model of university–enterprise collaborative education in the world is the “dual system” in Germany. Practical learning in businesses takes up 60% of students’ time. This learning system was based on university–business cooperation and focused on skill training, applying the theory learned in university in real-world practice. Through this form of education, described as “work–study alternation”, the university and the business benefit from each other [25]. The engineering research center, and technical and further education (TAFE) in Australia are, in essence, the IUR collaborative education system guided by the government [26]. Jiang et al. [27,28] suggested that there was a “prisoner’s dilemma”, related to the cooperative training of innovative talents among industry, university and research institutes. The best solution was to build a system among university/research institutions and businesses, which should be supported by government policies and effective safeguarding measures. Zhou et al. [29], Cui et al. [30] and Huo et al. [31] have all suggested that the IUR collaborative education system in China could be classified based on leading forces: universities, enterprises, research institutions and the government. The IUR collaboration practices in the Chemical Engineering School of Zhejiang Ocean University, Chen [32] have proposed that the collaboration needs financial, legal and policy support.
In summary, the studies mentioned above are mainly focused on university–business collaborative education, the IUR collaboration model, IUR collaboration evaluation methods and IUR collaboration case studies [33]. However, these studies relied heavily on qualitative methods, rather than quantitative methods. Moreover, these studies mainly took individual universities or businesses as research subjects, and therefore there was a lack of studies at regional and national levels [34]. Moreover, there were a few studies investigating the indicators of IUR collaboration efficiency in colleges and universities [8]. There are many indicators on the development and the quality of colleges and universities, but there is no consensus on which indicators can represent IUR collaboration efficiency. Research is also lacking on the changes in the spatio-temporal distribution of the IUR collaboration efficiency of Chinese universities. Moreover, the impact of the change on the development of Chinese businesses and society is not well understood [35]. It is therefore important to investigate the development of regional IUR collaboration efficiency in universities, and find out the impact of the development on Chinese businesses and regional economies.
The aim of this study was to investigate the development trend of mainland universities, and consider the spatio-temporal changes in the IUR collaboration efficiency from 2008–2018. It also aimed to explore the impact of IUR collaboration efficiency on the development of technology industries. Taken together, this study is dedicated to providing quantitative evidence for the benefit of IUR collaboration, for both universities and businesses.
According to the aim of the study, the first hypothesis of this study was that IUR collaboration efficiency had been increasing across different regions of the country during 2008–2018. The second hypothesis was that there was a significant difference in IUR collaboration efficiency among different regions of China.

2. Materials and Methods

The data analysis in this study contains two parts. Firstly, the spatio-temporal changes in the indicators of IUR collaboration efficiency on universities in mainland China, from 2008 to 2018, were analyzed. Secondly, a principal component analysis (PCA) was used to extract the principal components from all the relevant indicators for IUR collaboration efficiency in mainland universities in each province, in 2018. The principal component score and comprehensive score of each province was calculated and ranked. The ranking of regional gross domestic product (GDP) of each province in 2018 was introduced as a reference for the IUR collaboration efficiency in each province.

2.1. Indicator Selection and Data Source

PCA was used when investigating the spatio-temporal change in the indicators of IUR collaboration efficiency. PCA requires the indicators to be independent from each other. In view of that, six main indicators were selected for comparison: the number of universities; the number of teaching and scientific research personnel; the number of achievement applications; the number of patent authorizations; income from patent transfer, and technological and funding allocation in mainland universities from 2008 to 2018.
There are many other factors that influence IUR collaboration efficiency, including fiscal and tax policies, regional economic development, industrial development conditions, the external financing environment, as well as the nature, quality and discipline construction of the universities. Thus, a more in-depth analysis of the IUR collaboration efficiency in universities in all provinces should be based on further research. This study selected 14 indicators to construct the evaluation system of IUR collaboration efficiency (as shown in Table 1), which were based on the relevant research results, expert consultation, and an in-depth evaluation of the accessibility and reliability of the data.
As seen in Table 1, the 14 indicators were classified into 4 sections (denoted as primary indicators), which were university composition, research investment, technology transfer support, and scientific and technological output. It should be noted that any individual secondary indicators should not be viewed on a standalone basis. For example, the science and technology output of universities need to be protected by law, and a patent application process is therefore necessary. The number of patents owned by a university, and the revenue from these patents, will also reflect the level of scientific output of the institution. Therefore, this study used these two measurable indicators (the number of patents authorized and the real income from patent sales) to refer to the level of science and technological output of a university.
The main data of this paper comes from the Statistical Yearbook of China’s Education Funds, the Compilation of Science and Technology Statistics of Colleges and Universities, and China’s Statistical Yearbook. The GDP data of each region was collected from the website of China National Bureau of Statistics. The main material was the Compilation of Science and Technology Statistics of Colleges and Universities (Higher Education Press), which is compiled by the Department of Science and Technology of the National Ministry of Education, and comprehensively reflects the overall status of IUR collaboration in universities. The Statistical Yearbook of China’s Education Funds (China Statistics Press) is compiled by the Finance Department of the National Ministry of Education and the Statistics Department of Social Science, Technology and Cultural Industry of the National Bureau of Statistics, which systematically reflects the source and use of national education funds. According to our research needs, we selected the data from 2008 to 2018 for analysis.

2.2. Research Methods

Principal component analysis (PCA) is a commonly used multivariate analysis method, which uses mathematical methods to reduce a large number of variables into fewer and mutually independent underlying factors that summarize the essential information contained in the variables [36], increasing the interpretability of the study results [37]. This paper adopted the PCA method to analyze and evaluate the IUR collaboration efficiency of each province in Mainland China.

3. Results

3.1. Spatio-Temporal Change

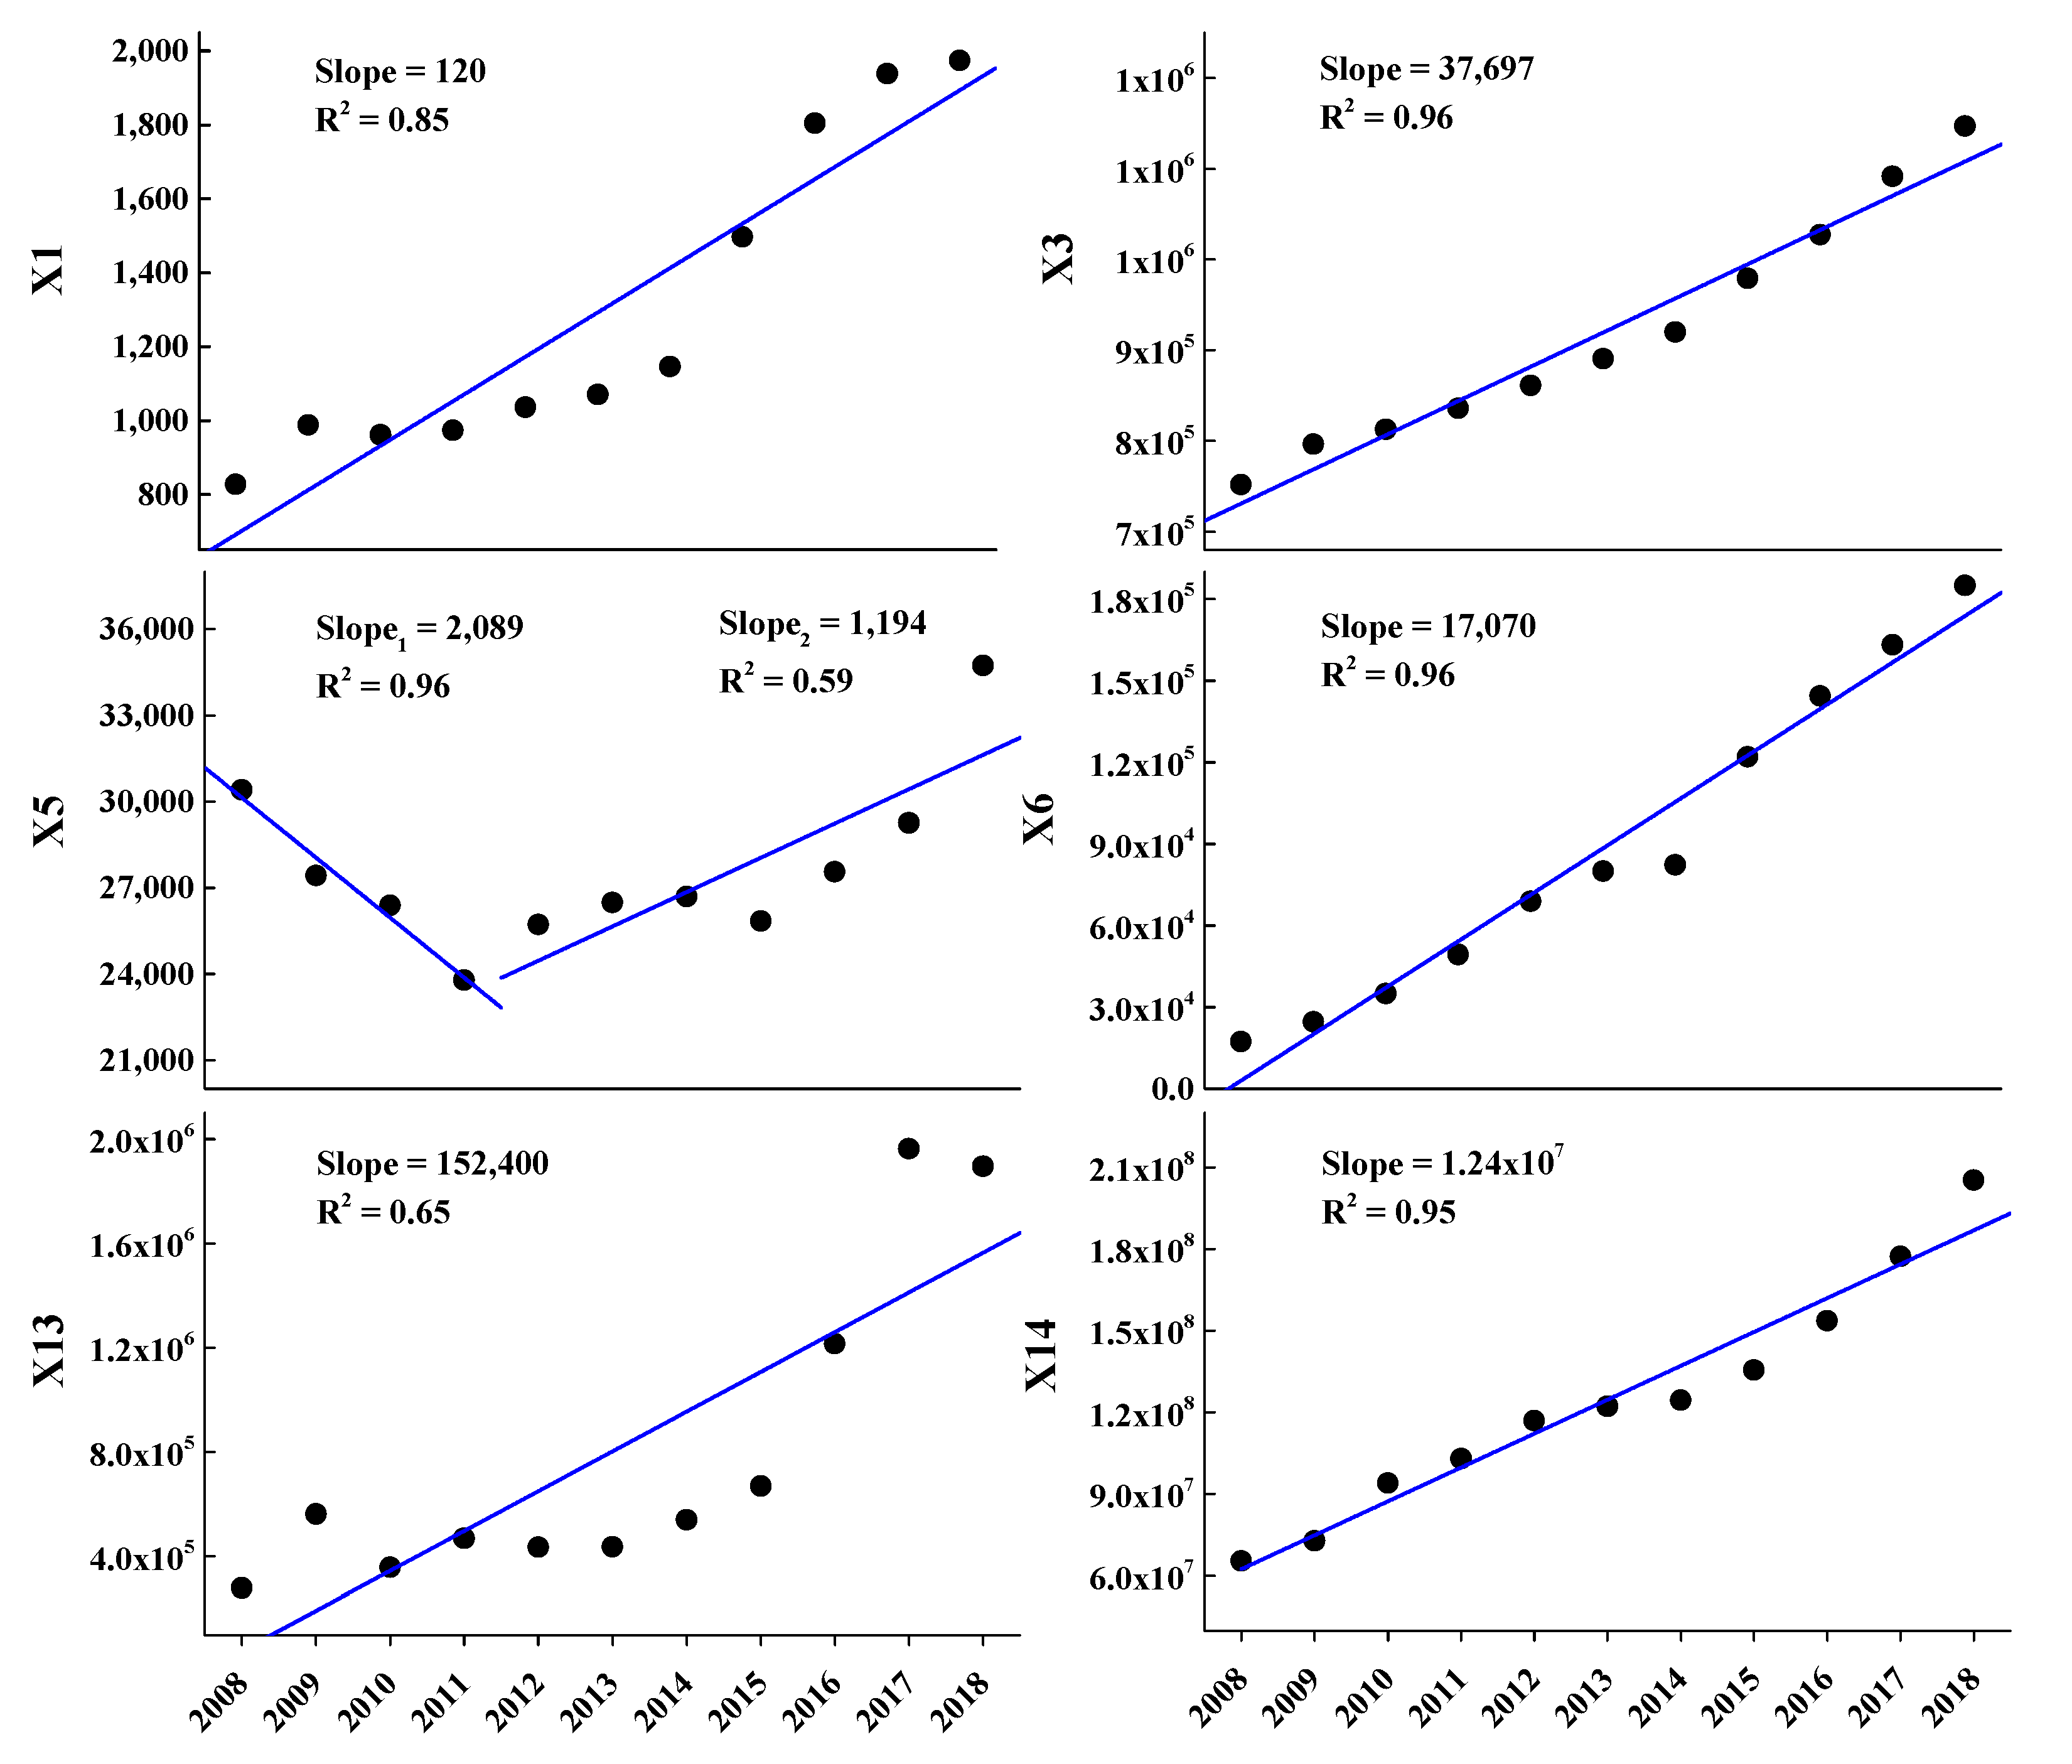
3.1.1. Temporal Change

The changes in the number of universities, teaching and scientific research personnel, achievement applications, patent authorization, annual net income from patent sales and research investment across the years, were investigated. Linear regression models were computed for the relationships between time and each variable, which are depicted in Figure 1; the slope represents how much the variable increases or decreases every year.
As can be seen from the figure, the number of colleges and universities in China has increased from 827 in 2008, to 1974 in 2018, with an average annual growth of 120. With the increase in the number of colleges and universities, the number of teaching and scientific research personnel in colleges and universities has also expanded rapidly, rising from 751,795 in 2008, to 1,147,044 individuals in 2018, with an average annual growth of 37,697.
RD achievement applications, and science and dedicated RD personnel, showed a downward trend from 2008 to 2011, with an average annual decline rate of 2089. However, this increased from 25,721 in 2012, to 34,734 individuals in 2018, with an average annual increase of 1194. It is obvious that compared with 2008, the change in dedicated RD personnel in 2018 is not large. This can be due to the fact that colleges and universities were not motivated to encourage faculties to participate in economic activities directly. Another possible reason is that colleges and universities emphasized the teaching and research responsibility of faculty members, but placed little focus on their economic activities. This would have a certain impact on the application and marketing of the research outcomes [8]. Therefore, when China’s Premier Keqiang Li presided over the executive meeting of the State Council on 5 December 2018, he introduced a series of reform measures to promote innovation, including allowing researchers to hold equity in the form of “technology shares plus cash shares”.
There are different means of technology transfers in colleges and universities, such as patent transfers and patent implementation licenses. As shown in Figure 1, the number of patent authorizations of college teachers and students was increasing. In 2008, 17,418 patents were authorized, and in 2018, 184,934 patents were authorized, with an average annual growth of 17,070.
As can be seen from the changes in the annual net income from patent sales in colleges and universities in Figure 1, the income increased slowly from 279.13 million yuan in 2008 to 669.34 million yuan in 2015, and increased rapidly in the following years to 1895.9 million yuan in 2018. The average annual growth of the net income of patent transfer in colleges and universities from 2008 to 2018 was about 152.4 million yuan. It can be seen from this that college teachers have paid more attention to the application and transfer of research outcomes than the past, when focused more on patent applications. Meanwhile, this also shows that the demand for research outcomes from colleges and universities has increased across time [38]. Government funding for scientific research in colleges and universities has also increased across the studied decade, from 65.5 billion yuan in 2008, to 205.3 billion yuan in 2018, with an average annual growth of 12.4 billion yuan.

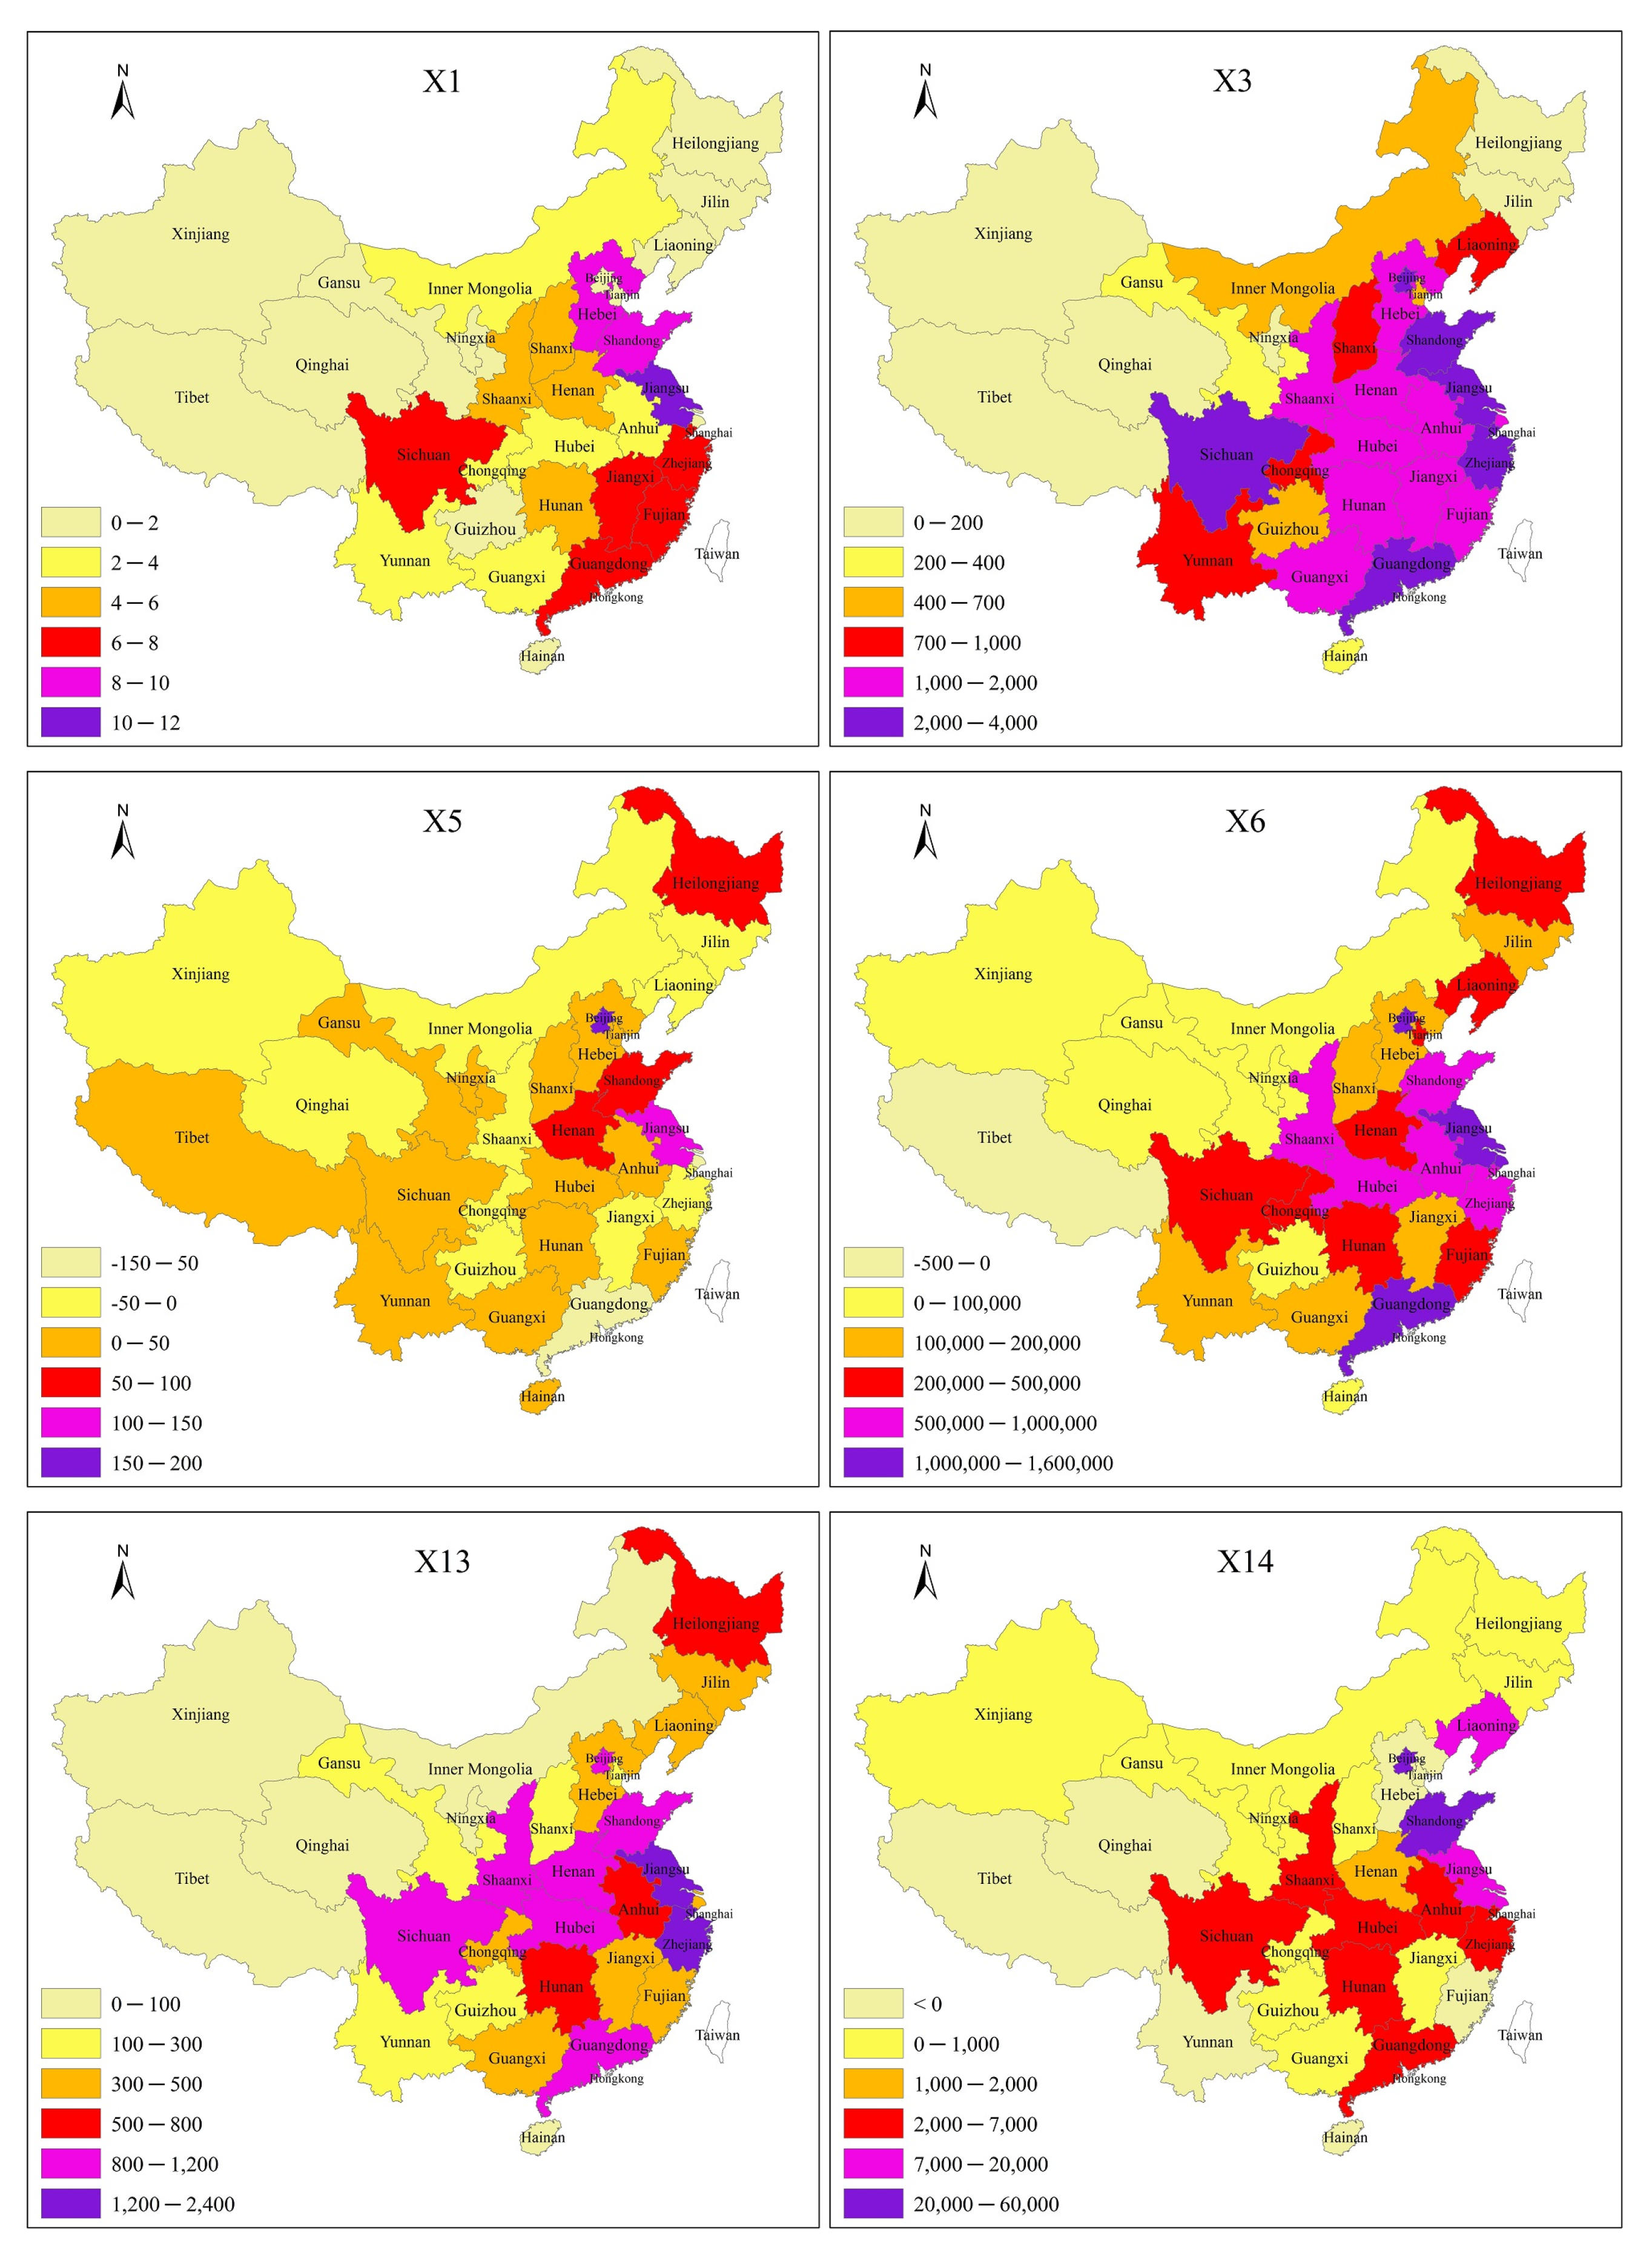
3.1.2. Spatial Change

Figure 2 demonstrates the growth rate of the six indicators related to IUR collaboration efficiency in all mainland provinces, from 2008 to 2018.
The number of colleges and universities in Jiangsu, Shandong and Hebei increased the most, with an average annual growth of 12, 10 and 9, respectively, followed by Zhejiang, Fujian and Guangdong, whereas there was little change in Tianjin, Heilongjiang, Tibet, Qinghai and Ningxia. The results reflect that eastern provinces had a higher average annual growth than western provinces in terms of the number of colleges and universities.
The average annual growth in terms of the numbers of teaching and scientific research personnel in colleges and universities were the highest in Jiangsu, Shandong and Guangdong (3375, 3154 and 2722, respectively), followed by Sichuan, Zhejiang and Beijing, and the lowest in Heilongjiang, Tibet and Qinghai.
The average annual growth of full-time research and development (RD) achievement applications and science and technology service personnel in Beijing, Jiangsu and Shandong were the highest (175, 103 and 83, respectively). There was a downward trend in some areas such as Shanghai, Guangdong and Chongqing.
The average annual growth of patent authorization in universities were the highest in Jiangsu, Zhejiang and Shandong (2282, 1223 and 1164, respectively). The numbers in Tibet, Qinghai, Ningxia, Hainan, Inner Mongolia and Xinjiang were relatively low. This showed that there were significant differences in the number of patent licenses in different mainland provinces, and the distribution was relatively uneven. The eastern provinces were holding significantly more patents than those in the central and western regions. This also showed that the scientific research achievements of eastern colleges and universities have changed from mere focus on theories, to the combination of theoretical study and application [39,40]. The average annual growth of the net income from patent transfer of colleges and universities in Beijing, Shandong, Shanghai and Jiangsu were the highest, which were 54.97 million yuan, 23.96 million yuan, 16.71 million yuan and 14.85 million yuan, respectively, whereas Fujian, Tianjin, Hebei, Yunnan and Hainan were the lowest.
The average annual growth of government funding for scientific research in colleges and universities were the highest in Beijing, Guangdong, Jiangsu and Shanghai (1.55 billion yuan, 1.53 billion yuan, 1.33 billion yuan and 1.03 billion yuan, respectively). Only Tibet showed negative growth.

3.2. Principal Component Analysis

3.2.1. Standardization of Data and Tests for Sampling Adequacy

SPSS 19.0 software was used to standardize the original data, and then test the PCA sampling adequacy with Kaiser–Meyer–Olkin (KMO) measures and Bartlett’s test of sphericity (BTS). The result of the KMO measure of sampling adequacy was 0.882, indicating that there were sufficient items for each factor. BTS was at 1005.515 (p < 0.001) (Table 2). The results from both tests showed that the data was appropriate for the purpose of principle component analysis.

3.2.2. Standardization of Data and Tests for Sampling Adequacy

It can be seen from Table 3 that the first two components accounted for 88.011% of the total variance, indicating that the two extracted principal components represented 88.011% of the information from the total 14 indicators, and were qualified to evaluate the IUR collaboration efficiency of colleges and universities in all provinces. Therefore, two principal components were extracted, namely Y1 and Y2.
According to the coefficients of the two principal components, the formula for Y1 and Y2 were obtained:
Y1 = 0.153X1 + 0.287X2 + 0.275X3 + 0.277X4 + 0.273X5 + 0.294X6 + 0.282X7 + 0.282X8 + 0.274X9 + 0.273X10 + 0.272X11 + 0.259X12 + 0.26X13 + 0.25X14
Y2 = 0.648X1 − 0.192X2 + 0.181X3 − 0.083X4 + 0.254X5 − 0.138X6 − 0.251X7 − 0.237X8 + 0.022X9 + 0.023X10 + 0.086X11 + 0.075X12 + 0.359X13 − 0.402X14
It can be seen from the above formula that in the principal component Y1, the absolute values of the coefficients of science and technology fund allocation (X6), number of graduate students (X2), RD fund allocation (X7), RD fund expenditure (X8), full-time research and development personnel (X4), and teaching and scientific research personnel (X3), are greater than those of the other variables, so the principal component Y1 is a comprehensive summary of the above six indicators. Y1 represents the comprehensive embodiment of science and technology funds and science and technology manpower in colleges and universities, which shows that it is essential to investigate IUR collaboration efficiency in colleges and universities through these indicators. The government should not only increase the investment in science and technology and RD funds in colleges and universities, but also build a talent platform and improve the training system of postgraduates [41].
In the formula for principal component Y2, the absolute values of the coefficients of the number of universities (X1), the annual net income from patent sales (X14), the number of patent authorizations (X3), and the full-time personnel of RD achievement application and scientific and technological services (X5) are large. This indicates that the principal component Y2 mainly reflects the RD and outcome application ability of colleges and universities in all provinces. The development of IUR collaboration is inseparable from the output of scientific and technological achievements and the technological services to the society. Only by reasonably transforming the research outcomes from colleges and universities into production, can we promote regional industrial development and enhance innovation ability [42,43,44].

3.2.3. Principal Component Score and Comprehensive Score

Table 4 demonstrates the principal component scores of Y1 and Y2, and the comprehensive scores Y (Y = 0.77593Y1 + 0.10418Y2). The Y1 values were high in Beijing, Jiangsu, Shanghai, Guangdong and Hubei, indicating the efficiency in using government investment, and the science and technology manpower of colleges and universities in the above five provinces, were at the forefront of the country.
Y2 values were high in Jiangsu, Henan, Shandong and Hebei, indicating that the universities in the four provinces were high in RD and application ability, and that the government investment has been utilized efficiently. Surprisingly, Beijing and Shanghai, who used to have absolute advantages in economics and policy support, scored lower in Y2. On one hand, Shanghai and Beijing are cities and have fewer colleges than other provinces, such as Henan, Jiangsu and Shandong. On the other hand, there are great differences in the quality of colleges and universities in those provinces. Beijing and Shanghai have most high-quality universities, which employ a large number of RD personnel and graduate students. Furthermore, RD output from universities in Shanghai and Beijing tend to have broader outreach than local universities.
According to the comprehensive score, both Beijing and Jiangsu had scores higher than five. It can be seen that the two provinces have absolute advantages in scientific research and IUR collaboration. As the political and cultural center of China, Beijing has unique geographical advantages in the process of development, while Jiangsu has superior overall economic levels, complete establishment of industries and various high-quality universities. Compared with Beijing, the development in Jiangsu is more balanced. Jinagsu not only ranked second in the comprehensive score, but also ranked second and first in Y1 and Y2 principal components, respectively. The western regions such as Xinjiang, Ningxia, Qinghai and Tibet had low comprehensive scores of principal components. Hainan Province was the only eastern province with lower scores. This shows that the efficiency of IUR collaboration in the region is not only determined by regional economic conditions, but also related to local leading industries. The leading industries of Hainan Province are tourism and service industries. Therefore, its universities are low in IUR collaboration efficiency, and its comprehensive score is the third lowest among all mainland provinces in the country.
The development of Chinese colleges and universities is inseparable from China’s GDP growth. With the increase in GDP, the government and social capitals can invest more flexibly in colleges and universities which, in turn, promote the growth of regional economies and technologies. According to the comparison between the GDP ranking and the IUR collaboration ranking of each province in 2018, it can be found that 65% of the provinces had the regional IUR collaboration efficiency rankings equivalent to their GDP rankings (the difference between the two ranks were less than 3). Among them, Shandong, Zhejiang, Henan, Fujian and Inner Mongolia ranked significantly lower than their GDP ranking in the country (see the red ranking numbers in Table 4). Except Inner Mongolia, the economic conditions of the above regions are among the top in the country, which have potential to make additional investment in colleges and universities. On the contrary, 5 regions have significantly higher IUR collaboration rankings than their GDP rankings (see the blue ranking numbers in Table 4). They were Beijing, Shanghai, Shaanxi, Heilongjiang and Jilin, respectively. It can be inferred that, compared with other provinces, the IUR collaboration in the five provinces has been fully supported by regional economic development and government investment. However, it is also possible that the outcome of IUR collaboration has not been fully transformed into applicable technologies or methods. Therefore, these outcomes were not able to promote regional economic growth. Taking Heilongjiang Province as an example, its IUR collaboration efficiency ranked 10th in the country, but its regional GDP level ranked 23rd. On one hand, it is plausible that its regional industrial structure could not meet the IUR collaboration requirements, which suggests the need for adjustment and upgrading in the industrial structure. On the other hand, it may be that the graduates or RD personnel from colleges and universities in Heilongjiang were not willing to stay in the province, which hampered the regional economic development.

4. Discussion and Conclusions

Chinese colleges and universities have developed rapidly in the past 10 years. The number of colleges and universities, teaching staff, investment in scientific research, student training and scientific research have grown at a significantly higher speed, compared with the same development periods in European and American history. This could be due to the following factors: first, the increase in GDP and the demand for economic development. Secondly, the growth rate of national investment in higher education is much higher than the GDP growth rate, which brings sufficient financial support to the development of universities. Thirdly, colleges and universities have made great contributions to the development of their regional economies. The contribution rate of scientific progress to GDP in some provinces has even reached 59.5%, which indicates the significant contribution of scientific progress on China’s economic development [45]. In other words, the development of colleges and universities promotes the development of their respective regional economies. Comparing the U.S. with China, we can find that IUR collaboration in the U.S. started 80 years earlier. Universities have participated in technological innovation led by the government and have achieved great success. The U.S. government has offered great support to its universities in the transformation process of their scientific research systems. The advantages of American universities in scientific and technological innovation enable them to obtain financial support from multiple parties, including the federal government and state governments, who have established special funds for IUR collaboration [46].
The indicators of IUR collaboration efficiency in mainland Chinese universities have increased rapidly. The results of PCA showed that over the last decade universities have increased by 1.45 million graduate students, 85,667 full-time RD personnel, 167,516 patent authorizations and 161,676 million yuan of patent transfers. These increases were the result of national and local investments. China’s RD investment surpassed Japan for the first time in 2013, and the amount of scientific research investment ranked second in the world. Most of this scientific research investment was put into colleges and universities, which has promoted the development of colleges and universities. Compared with Sweden, the growth of China’s GDP was more effective in promoting IUR collaboration efficiency. Although Sweden has higher RD funds, in terms of their GDP level, the ability of its IUR collaboration output to serve the society is not much better than China’s, and its commercialization rate of research outcomes is low [47].
There were significant regional differences in the development speed of mainland Chinese colleges and universities. Results have shown that the main regional difference in the comprehensive strength of IUR collaboration efficiency in colleges and universities used to be between the East and the West. More recently, it was between the North and the West. There were great differences in IUR collaboration efficiency among the Southern regions (Jiangsu, Zhejiang, Guangdong, Shanghai and Shandong), the Northern and the Western regions. Sichuan, which is in the western region, had great advantages. Similarly, regional differences exist in China’s high-tech industry. The high-tech industry is mainly situated in the East Region, and the growth rate in this region is also the fastest. There is a large gap between the overall level of high-tech industry in China and the level of that in the Eastern region, which is in line with the empirical law of inverted “U”. The regional differences in the Central and Western regions are small, and tend to decrease [48].
According to the principal component scores and comprehensive scores of IUR collaboration efficiency in various regions of mainland China, the efficiency is mainly related to regional economic development. It was found that 65% of provinces had a similar regional IUR collaboration efficiency ranking to their GDP ranking (i.e., the difference between the two ranks was less than three). The top three provinces in terms of economic development were Beijing, Shanghai and Jiangsu, which also ranked highly in IUR collaboration efficiency. Beijing and Shanghai mainly rely on government investment and have advantages in talent. In comparison, the development in Jinagsu was more balanced, and this province is more efficient in the utilization of funds, offering better social services. The IUR collaboration efficiency in West China is still low, due to its relatively weak economic development. Meanwhile, there were also regions where the IUR collaboration ranking was far behind the GDP ranking, for example, Heilongjiang Province. In terms of policy, the country should continue to increase the investment in the development of colleges and universities, promoting the application of research outcomes. The government should also coordinate regional economy and IUR collaboration for their mutual benefits. Our research showed that the efficiency of IUR collaboration in developed regions was better than that in the central regions. Hubei and Jiangsu provinces were leaders in terms of IUR collaboration efficiency in the central regions and developed regions, respectively.
The results of this study have implications for policymaking related to the development of IUR collaboration in China and other countries. However, there are still some limitations to the current studies. The indicators and regional differences of IUR collaboration efficiency in Chinese mainland colleges and universities have been discussed, but the data used in this study could only reveal the change in the recent 10 years. Therefore, future research could include a wider range of years when investigating the changes in IUR collaboration efficiency. Moreover, further investigations are needed to establish the regional differences in the development of Chinese businesses, and the relationship between their development and national IUR collaboration.

Author Contributions

Conception, B.Z. and H.Z.; methodology, B.Z. and H.Z.; writing—original draft and preparation B.Z. and H.Z.; writing—review and editing, B.Z. and H.Z.; data analysis, B.Z.; statistical analysis, W.C. All authors have read and agreed to the published version of the manuscript.

Funding

This research received no external funding.

Institutional Review Board Statement

Not applicable.

Informed Consent Statement

Not applicable.

Data Availability Statement

Not applicable.

Conflicts of Interest

The authors declare no conflict of interest.

References

  1. Xia, G.; Xi, G.; Guan, J. An analysis of the patenting activities and collaboration among industry-university-research institutes in the Chinese ICT sector. Scientometrics 2014, 98, 247–263. [Google Scholar]
  2. Song, Y.; Zhang, J.; Song, Y.; Fan, X.; Zhu, Y.; Zhang, C. Can industry-university-research collaborative innovation efficiency reduce carbon emissions? Technol. Forecast. Soc. Chang. 2020, 157, 120094. [Google Scholar] [CrossRef]
  3. Zhu, Z.H.; Guo, C.J.; Xue, D.W.; Chen, J.Y. Research on the Impact of Industry-University-Research Cooperation Mode on Enterprise Innovation. J. Mudanjiang Univ. 2021, 30, 29–35. (In Chinese) [Google Scholar]
  4. Zhou, X.S. The Practics and Model Innoration of University-Industry Collaboration. J. Taiyuan Univ. Technol. 2012, 68–71. [Google Scholar]
  5. Wei, Y.Q. Research on the Mode and Counter Measures of Industry-University-Research Cooperation in Guangdong Universities; South China University of Technology: Guangzhou, China, 2020. [Google Scholar]
  6. Bellucci, A.; Pennacchio, L. University knowledge and firm innovation: Evidence from European countries. J. Technol. Transf. 2016, 41, 730–752. [Google Scholar] [CrossRef] [Green Version]
  7. Etzkowitz, H.; Webster, A.; Gebhardt, C.; Terra, B.R.C. The future of the university and the university of the future: Evolution of ivory tower to entrepreneurial paradigm. Res. Policy 2000, 29, 313–330. [Google Scholar] [CrossRef]
  8. Bai, X.J.; Zyl, B.; Jin, Z.B. Performance evaluation of China’s innovation during the industry-university-research collaboration process-an analysis basis on the dynamic network slacks-based measurement model. Technol. Soc. 2020, 62, 101310. [Google Scholar] [CrossRef]
  9. Yu, C.H. Research on The Selection of the Modes of Industry-University Collaborative Innovation Based on Firm’s Technological Capability; Dalian University of Technology: Dalian, China, 2019. [Google Scholar]
  10. Chiu, W.H.; Chi, H.R.; Chang, Y.C.; Chen, M.H. Dynamic capabilities and radical innovation performance in established firms: A structural model. Technol. Anal. Strateg. Manag. 2016, 28, 965–978. [Google Scholar] [CrossRef]
  11. Li, C.P. A comparative study on the modes of industry-university-research collaborative innovation in Chinese and foreign universities. Chin. Univ. Sci. Technol. 2017, 8, 14–17. (In Chinese) [Google Scholar]
  12. Hossain, K.; Parsons, A.J.; Rudd, C.D.; Ahmed, I.; Thielemans, W. Mechanical, crystallisation and moisture absorption properties of melt drawn polylactic acid fibres. Eur. Polym. J. 2014, 53, 270–281. [Google Scholar] [CrossRef]
  13. Madsen, J.B. Technology spillover through trade and TFP convergence: 135 years of evidence for the OECD countries. J. Int. Econ. 2007, 72, 464–480. [Google Scholar] [CrossRef] [Green Version]
  14. Costa, M.; Iezzi, S. Technology spillover and regional convergence process: A statistical analysis of the Italian case. Stat. Methods Appl. 2004, 13, 375–398. [Google Scholar] [CrossRef]
  15. Li, J.P.; Jiang, D.P.; Wang, T. Knowledge Integration in Industry-university-research institute Synergy Innovation—A Theoretical Framework. Soft Sci. 2013, 5, 136–139. [Google Scholar]
  16. He, Y.B. The theoretical model of I-U-R collaborative innovation. Stud. Sci. Sci. 2012, 30, 165–174. [Google Scholar]
  17. Su, Y.; Jiang, X.S.; Lei, J.S.; Lin, Z.Z. Research on Collaborative Evolution of Regional Innovation System. China Soft Sci. 2016, 3, 44–61. [Google Scholar]
  18. Kang, J.; Hu, Z.G. Research on triple helix synergetic innovation capability evaluation based on regional industry interaction. Sci. Res. Manag. 2014, 35, 19–26. [Google Scholar]
  19. Schartinger, D.; Rammer, C.; Fischer, M.M.; Fröhlich, J. Knowledge interactions between universities and industry in Austria: Sectoral patterns and determinants. Res. Policy 2002, 31, 303–328. [Google Scholar] [CrossRef]
  20. Farrell, M.; Ryan, S.; Langrick, B. Dip in Supervision Brian Langrick Dip in Counselling. ‘Breaking bad news’ within a paediatric setting: An evaluation report of a collaborative education workshop to support health professionals. J. Adv. Nurs. 2001, 36, 765–775. [Google Scholar] [CrossRef] [PubMed]
  21. Chang, A.; Fernandez, H.; Cayea, D.; Chheda, S.; Paniagua, M.; Eckstrom, E.; Day, H. Complexity in Graduate Medical Education: A Collaborative Education Agenda for Internal Medicine and Geriatric Medicine. J. Gen. Intern. Med. 2014, 29, 940–946. [Google Scholar] [CrossRef] [Green Version]
  22. Pugach, M.C.; Blanton, L.P. A framework for conducting research on collaborative teacher education. Teach. Teach. Educ. 2009, 25, 575–582. [Google Scholar] [CrossRef]
  23. Müller, U.; Ahamer, G.; Peters, H.; Weinke, E.; Sapper, N.; Salcher, E. Technologies and collaborative education strengthen conviviality in rural communities in the Alps and in Senegal. Multicult. Educ. Technol. J. 2013, 7, 207–227. [Google Scholar] [CrossRef]
  24. Cao, X.; Li, C. Evolutionary game simulation of knowledge transfer in Industry-University-Research cooperative innovation network under different network scales. Sci. Rep. 2020, 10, 4027. [Google Scholar] [CrossRef] [PubMed] [Green Version]
  25. Ying, Q.M.; Chen, H.; Pei, Y.L. Research on University-Enterprise Cooperation; Intellectual Property Press: Beijing, China, 2012. [Google Scholar]
  26. Laursen, K.; Salter, A. Searching high and low: What types of firms use universities as a source of innovation. Res. Policy 2017, 33, 1201–1215. [Google Scholar] [CrossRef]
  27. Chu, G.G. Research on the Model and Mechanism of Cultivating Innovative Talents by Cooperation of Industry; University and Research, Harbin Engineering University: Harbin, China, 2018. [Google Scholar]
  28. Kwon, K.S.; Martin, B.R. Synergy or separation mode: The relationship between the academic research and the knowledge-transfer activities of Korean academics. Scientometrics 2012, 90, 177–200. [Google Scholar] [CrossRef]
  29. Zhou, J.Z.; Wan, Y.G.; Gao, J. An Analysis on modes of the Cooperation Among Industry, University and Research Institute in China. Sci. Technol. Prog. Policy 2005, 3, 70–72. [Google Scholar]
  30. Huo, Y.; Wang, Y.F.; Jiang, W.D. Discussion on key issues in industry-university-research collaboration in local colleges and universities. China Adult Educ. 2008, 5, 16–17. [Google Scholar]
  31. Cui, Y.; Zhou, R.L.; Zhu, J.G. A brief analysis of the leading mode of industry-university-research collaboration. Technol. Mark. 2010, 17, 27–28. [Google Scholar]
  32. Chen, Y.; Chen, Y.; Zhao, P.J. Research on the mechanism of university-enterprise cooperation basing on “collaborative training” in application-orientated undergraduates disciplines: Taking the “industry-university-research” collaboration between school of chemical engineering in Zhejiang Ocean University and enterprise as an example. Educ. Mod. 2018, 5, 4–6. [Google Scholar]
  33. Gray, D.; Steenhuis, H.J. Quantifying the benefits of participating in an industry university research center: An examination of research cost avoidance. Scientometrics 2003, 58, 281–300. [Google Scholar] [CrossRef]
  34. Xia, H.; Weng, J. Effectiveness of industry-university-research cooperation in China: Impact of innovation input and open innovation environment. Int. J. Innov. Sci. 2021. ahead-of-print. [Google Scholar] [CrossRef]
  35. Wang, X.; Fang, H.; Zhang, F.; Fang, S. The Spatial Analysis of Regional Innovation Performance and Industry-University-Research Institution Collaborative Innovation-An Empirical Study of Chinese Provincial Data. Sustainability 2018, 10, 1243. [Google Scholar] [CrossRef] [Green Version]
  36. He, G.M. A Case-Study Course for Applied Statistics; Huazhong University of Science and Technology Press: Wuhan, China, 2013. [Google Scholar]
  37. Zhang, S.; Wang, X.; Zhang, B. The policy effects of innovative city pilot on the dual efficiency of industry-university-research knowledge flow. Technol. Anal. Strateg. Manag. 2021, 1, 1–12. [Google Scholar] [CrossRef]
  38. Anderson, T.R.; Daim, T.U.; Lavoie, F.F. Measuring the efficiency of university technology transfer. Technovation 2007, 27, 306–318. [Google Scholar] [CrossRef]
  39. Chen, F.; Wu, C.; Yang, W. A New Approach for the Cooperation between Academia and Industry: An Empirical Analysis of the Triple Helix in East China. Sci. Technol. Soc. Int. J. 2016, 21, 181–204. [Google Scholar] [CrossRef]
  40. Xia, C.Y.; Yuan, Z.H.; He, W.Y.; Zhao, J.H. An Empirical Study on Scientific Research Performance of Universities in Different Regions of China Based on PCA and Malmquist Index Method. Educ. Res. Int. 2021, 2021, 1–11. [Google Scholar] [CrossRef]
  41. Li, P. Groundwater Quality in Western China: Challenges and Paths Forward for Groundwater Quality Research in Western China. Expo. Health 2016, 8, 305–310. [Google Scholar] [CrossRef] [Green Version]
  42. Hermans, J.; Castiaux, A. Contingent knowledge transfers in university–industry R&D projects. Knowl. Manag. Res. Pract. 2017, 15, 68–77. [Google Scholar]
  43. Li-Ping, F.U.; Zhou, X.M.; Luo, Y.F. The Research on Knowledge Spillover of Industry-University-Research Institute Collaboration Innovation Network; Springer: Berlin/Heidelberg, Germany, 2013. [Google Scholar]
  44. Feng, C.; Ding, M.; Sun, B. A Comparison Research on Industry-University-Research Strategic Alliances in Countries. Asian Soc. Sci. 2010, 7, 102. [Google Scholar] [CrossRef] [Green Version]
  45. Guo, H.; Hu, J.; Yu, S.; Chen, Y. Computing of the contribution rate of scientific and technological progress to economic growth in Chinese regions. Expert Syst. Appl. Int. J. 2012, 39, 8514–8521. [Google Scholar] [CrossRef]
  46. Calero, C.; Leeuwen, T.; Tijssen, R. Research cooperation within the bio-pharmaceutical industry: Network analyses of co-publications within and between firms. Scientometrics 2007, 71, 87–99. [Google Scholar] [CrossRef] [Green Version]
  47. Ali, D.A.; Deininger, K.; Duponchel, M. Credit constraints, agricultural productivity, and rural nonfarm participation: Evidence from Rwanda. Policy Res. Work. Pap. 2014, 1–30. Available online: https://openknowledge.worldbank.org/handle/10986/17305 (accessed on 25 November 2021).
  48. Han, C.; Thomas, S.R.; Yang, M.; Ieromonachou, P.; Zhang, H. Evaluating R&D investment efficiency in China’s high-tech industry. J. High Technol. Manag. Res. 2017, 28, 93–109. [Google Scholar]
Figure 1. The temporal change of the six indicators for IUR collaboration efficiency from 2008 to 2018.
Sustainability 13 13180 g001
Figure 2. The spatial change of the six indicators of IUR collaboration efficiency from 2008 to 2018.
Sustainability 13 13180 g002
Table 1. IUR collaboration efficiency indicators.
Primary IndicatorsSecondary IndicatorsUnits
University compositionNumber of universities (X1)
Number of students (X2)
Number of teaching and research personnel (X3)
RD full time staff (X4)Person-year
Research investmentAllocation of science and technology funds (X6)Thousand yuan
Allocation of RD funds (X7)Thousand yuan
RD expenditure (X8)Thousand yuan
Technology transfer supportRD achievement application and full time technology service personnel (X5)Person-year
Allocation of RD outcome application funds (X9)Thousand yuan
RD outcome application expenditure (X10)Thousand yuan
Allocation of science and technology service funds(X11)Thousand yuan
Expenditure on science and technology services (X12)Thousand yuan
Science and technology outputNumber of patents authorized (X13)
Real income from patent sales (X14)Thousand yuan
Table 2. KMO and Bartlett’s Tests.
Kaiser–Meyer–Olkin measure of sampling adequacy (KMO)0.822
Bartlett’s test of sphericity Approx.Chi-square1005.515
Df91
Sig.0.000
Table 3. Total Variance Explained.
RankInitial EigenvaluesExtraction Sums of Squared Loadings
Total% of VarianceCumulative %Total% of VarianceCumulative %
110.86377.59377.59310.86377.59377.593
21.45810.41888.0111.45810.41888.011
30.7355.25093.261
40.5093.63796.898
50.1531.08997.987
60.1120.80198.788
70.0710.50499.291
80.0470.33899.630
90.0260.18499.814
100.0130.09099.904
110.0100.07199.975
120.0020.01299.987
130.0010.00799.994
140.0010.006100.000
Table 4. Provincial IUR Collaboration Efficiency Score in 2018.
ProvinceY1Y2YRank 1 (Y)Rank 2 (GDP)
Guangdong3.570.222.7941
Jiangsu8.612.846.9822
Shandong2.041.471.7473
Zhejiang1.510.921.2784
Henan−0.071.860.14135
Sichuan1.250.761.0596
Hubei2.880.62.357
Hunan0.80.980.73118
Hebei−0.551.39−0.28149
Fujian−1.250.44−0.921710
Shanghai4.77−1.933.5311
Beijing9.53−3.797112
Anhui−0.680.67−0.461513
Liaoning0.56−0.960.341214
Shaanxi2.360.351.87615
Jiangxi−1.560.69−1.141916
Chongqing−1.19−0.09−0.931817
Guangxi−1.730.17−1.322118
Tianjin−0.97−0.99−0.861619
Yunnan−2.26−0.04−1.762320
Inner Mongolia−2.85−0.35−2.252621
Shanxi−2.160.16−1.662222
Heilongjiang1.05−0.080.811023
Jilin−1.49−0.24−1.192024
Guizhou−2.77−0.29−2.182425
Xinjiang−3.02−0.59−2.412726
Gansu−2.77−0.49−2.22527
Hainan−3.35−0.84−2.692928
Ningxia−3.32−0.88−2.672829
Qinghai−3.37−0.91−2.713030
Tibet−3.59−1.04−2.893131
Publisher’s Note: MDPI stays neutral with regard to jurisdictional claims in published maps and institutional affiliations.

