Article

Impact of Decentralization and Rail Network Extension on Future Traffic in the Bangkok Metropolitan Region

1
Faculty of Engineering and Design, Kagawa University, Takamatsu 761-0396, Japan
2
Department of Civil Engineering & Center for Logistics Engineering Technology and Management, Faculty of Engineering, Kasetsart University, Bangkok 10900, Thailand
3
Department of Mobility Systems Engineering, Technical University of Munich, 80333 Munich, Germany
4
Center for Sustainable Development and Global Smart City, Chubu University, Kasugai 487-8501, Japan
*
Author to whom correspondence should be addressed.
Sustainability 2021, 13(23), 13196; https://doi.org/10.3390/su132313196
Submission received: 30 October 2021 / Revised: 24 November 2021 / Accepted: 26 November 2021 / Published: 29 November 2021
(This article belongs to the Special Issue Sustainable Urban Design: Urban Externalities and Land Use Planning)

Abstract

:
In many large cities in developing countries, investments in transportation infrastructure are insufficient for the growing population, resulting in chronic traffic congestion and overcrowding. The urban population of developing countries is expected to increase further toward the middle of this century, and urban planning and transportation policies that foresee future population changes and economic growth are necessary to make these cities more sustainable. Bangkok is one of the most congested metropolitan areas in the world, and transport projects such as the extension of the public transportation system are being implemented. However, due to the monocentric urban structure, both road and rail traffic is extremely congested during peak hours, which impedes some economic activities and personal interaction. In this study, we simulate the impact of urban and transportation measures in Bangkok from today to 2050. In addition to the expansion of the planned rail transit network, we evaluate the effects of a land use scenario in which sub-centers are established to develop a polycentric urban structure. The impact of alternative zoning and transportation policies and projects in Bangkok is discussed. Although this study is focused on Bangkok, the findings are assumed to be transferable to other large cities in developing countries.

1. Introduction

Many large cities in developing countries continue to suffer from chronic traffic congestion and overcrowding due to inadequate investment in transportation infrastructure for their growing populations [1]. Urban populations in developing countries are expected to increase further towards the middle of the century [2], and in order to make these cities more sustainable, urban planning and transportation policies need to anticipate future population changes and economic growth. Due to its high density and inadequate road system, Bangkok is one of the most congested metropolitan areas in the world [3,4], and measures such as extending public transportation are underway [5]. However, due to its monocentric urban structure, both roads and railroads are extremely congested during peak hours, interfering with economic activities and daily life.
Bangkok metropolitan region (BMR), covering the 7762 square-kilometer area with the registered population in 2021 of 11 million persons and 5.9 million households [6], comprises Bangkok (the country’s capital governed by the Bangkok Metropolitan Administration: BMA) and five surrounding provinces, namely, Nonthaburi, Pathum Thani, Samut Prakan, Samut Sakhon, and Nakhon Pathom. BMR is rather a monocentric city with a large urban core in the center where high density commercial and residential areas are concentrated. The population of Bangkok is expected to increase by about 35% between 2015 and 2035 [2], and continue to grow at least until 2050 [7]. The chronic traffic congestion on the roads and the congestion of public transportation during peak hours leads to long delay times, which impedes economic growth and reduces the quality of life for the people. The traffic congestion would cause an economic loss of more than 11 billion Thai Baht (approximately 180 million USD) per year [8].
Modal shift from road transport to railway is one of the effective countermeasures to the road congestion. Being endorsed by the Commission for the Management of Land Traffic in 2010, the Mass Rapid Transit Master Plan (M-Map) designates a railway network of 12 lines with a total length of 509 km covering the urbanized area of BMR [6]. Among the 12 railway lines, five of them are heavy urban railway lines, two heavy suburban railway lines, airport rail link, and four feeder railway lines. As of September 2021, 7 railway lines of 208 km are in operation: dark green, light green, blue, purple, dark red, and light red lines. The additional three lines of 99.4 km are under construction and scheduled to open by 2023: orange, yellow, and pink lines. The preparation of the rest lines is currently at different stages. The complete network is scheduled in 2029, when the total ridership is forecasted to be 7,680,000 person-trips/day and the public transport mode share will reduce to 39.2% (from 45.3% in 2008) [9].
In addition to the mass transit network development, the Ministry of Transport’s 20-year strategic plan (2017 to 2036) aims the transport development towards green and safe, efficient, and inclusive transportation system. The action plan in Bangkok Metropolitan region includes bus improvement, road network development, travel demand management measures to reduce car traffic, traffic safety improvement, transit-oriented development, electric-vehicles (EV) promotion, accessible transport for elderly and disable people, etc. The key performance indices to be accomplished in 2036 include a reduction of greenhouse gases emission by 20% from the base scenario, a reduction of energy consumption by 15% from the base scenario, a reduction of logistic cost to 11.9% of GDP (was 14.2% in 2015), a share of cargo transport by rail of 10% (was 1.4% in 2015), public transport mode share of 50.36% (was 31.28% in 2015), etc.
Recently, the government has started to develop the second mass rapid transit master plan (M-Map2) [9] where additional railway lines are being considered and to be proposed. The development of these railways is expected to reduce congestion on the roads and improve the reliability of travel time, thereby improving the environment for economic activities, as road traffic is expected to be shifted to rail use.
The development of railways will improve access from the suburbs to the city center. However, as the city continues to grow and most urban functions are concentrated in central areas, traffic volumes flowing into the city center will increase. The provision of more railway services alone is expected to be insufficient to effectively reduce congestion, due to the growth of the area. According to the draft Bangkok comprehensive plan (4th revision), Bangkok is envisioned to be polycentric in which the main central business district (CBD), is designed to be surrounded by several urban nodes, so-called urban sub-centers and sub-urban sub-centers [10]. Centers and sub-centers would be linked by the railway network. Such city structure would provide a better job and housing balance. One of the sub-centers being planned is Minburi sub-center. It is located approximately 23 km to the east of the city center, and it is the terminal station of the orange and pink railway lines, being under construction. This makes travel in the east-west corridor through Bangkok CBD very convenient and possible within a short travel time. The land use regulations in the Minburi area were changed from the low- and medium-density residential in the previous plan to the commercial land in the soon-to-be enacted 4th revision BMA land use plan. More variety of commercial and residential development is allowed such as office buildings, high-rise condominiums, hotels, a large-scale shopping mall, or mixed-use development. The area is expected to be a new employment center where workers could live nearby and conveniently travel to the CBD by rail.
For this reason, the decentralization of urban core functions and the formation of sub-centers are analyzed. The formation of such sub-centers is expected to spatially decentralize commuter and business traffic and alleviate traffic congestion [11]. Theoretical study also indicates that the job decentralization will achieve the city-wide welfare gains [12]. However, if the polycentric development is not linked to the development of rail infrastructure, the sub-centers will be best accessible by automobiles, which likely will lead to more road traffic congestion.
This study analyzes the impact of the development of railway network and sub-centers on travel time in the Bangkok metropolitan area in 2050 using a microsimulation land use and transportation model. The purpose of this study is to discuss the direction of urban and transportation policies that can improve the future transportation situation based on the analytical results.

2. Literature Review

In order to alleviate road congestion in large cities, a vast amount of research and practice has been conducted around the world, and various approaches have been taken to this problem. Already in the 1960s, it was recognized that road transport alone could not adequately meet the traffic demands of such large cities [13,14,15,16]. Therefore, mass transit system [17] and land use [18] policies have been incorporated into the development of transportation systems.
Clearly, neither modal shift nor the integration of land use and transportation are direct measures to control the road congestion, either in research or in practice. People’s travel behaviors are influenced by a variety of factors, including transportation fares [19,20,21], travel time and frequency [22], transit time [23], road pricing [24], gasoline prices [25,26], and psychological factors [27]. Therefore, the impact of public transport policies on transport demand depends on the situation, which consists of physical and perceptual attributes [28]. The former attributes, such as travel time, network connectivity, and fares, can be directly observed, while the latter attributes, such as comfort, safety, and convenience, can be measured by passenger responses. Of course, all of these factors can influence mode choice behavior, but a comprehensive study of these factors would require considerable effort and cost. In developing countries, such studies are limited, and analysis usually has to be done under data limitations, so the analytical models are sometimes primitive.
The interaction between transportation and land use has been considered as one of the main determinants of transportation demand. A number of Land Use Transportation Integration (LUTI) models have been developed and applied in policy practice to assess the impact of transportation infrastructure and development in urban areas (as review papers, [18,29,30,31]). The basic idea of the LUTI model is the interaction between travel behavior and choice of activity location. Mobility behaviors such as trip generation, destination choice, and transportation mode choice are determined by the level of service of the transportation system and the location of activities such as residence, work, and leisure, along with personal attributes. On the other hand, the choice of location for these activities is influenced by accessibility, which is determined by the level of service of the transportation system. In such analyses, the location of business activity is sometimes given a priori, because the self-organizing nature of the location of activity caused by agglomeration economies makes it difficult to represent the observed spatial patterns. While theoretical studies have attempted to explain and represent polycentric urban forms in the field of new economic geography [12,32,33], the formation of subcenters is not only determined by the market, but is also influenced by policies, planning, and a variety of other constraints. Those factors are not often taken into account in theoretical models [34,35,36]. Several studies have been conducted to analyze the impact of pre-defined sub-centers on traffic. Polycentricity is expected to reduce road congestion because it can shift some of the travel demand concentrated in urban centers to sub-centers [37,38,39,40,41], while some researchers believe that decentralization increases travel distances due to cross-commuting [42,43,44]. A statistical analysis of Chinese cities shows that polycentricity is negatively related to congestion, but the relationship becomes weaker with urban population [45].
It is easy to imagine that the impact of transportation and land use factors on travel demand depends not only on their scale, but also on their quality and configuration. For example, if a given subcenter is located in an area with poor transportation infrastructure, it will cause severe congestion. On the other hand, if a subcenter is located adjacent to an accessible rail transit station, people can use railway to get to the subcenter, thus reducing road traffic congestion.
Therefore, in order to assess the impact of policies such as transit service provision and development of sub-centers, it is necessary to consider detailed conditions and situations such as transportation systems and locations of urban activities. In this study, we adopted a microsimulation land use and transportation model, which is a powerful tool for reflecting and analyzing detailed urban and transportation conditions.

3. Data

The target area in this study was Bangkok Metropolitan Region (BMR) as mentioned above. Figure 1 shows the target area. Table 1 summarizes the data used in this study.
The population, households, employees, and transportation-related data around 2015 were the same as in Ref. [46]. A list of the data presented in Reference [46] is reproduced in Table 1 for reference.
It should be noted that this study was conducted under data constraints. As shown in the table, the sample size of the household travel survey is not sufficient to represent the origin-destination travel patterns in the metropolitan area. In the aforementioned literature, we proposed a method of incorporating other relevant data, such as population and number of workers by zone, to estimate OD patterns, destination choice models, and mode choice models. In this paper, a brief explanation is given in Section 4.2. See [46] for details.

4. Methodology

In this study, we analyze the effects of land use and transportation policies and projects in Bangkok in 2050 with agent-based simulation models, namely the land use model SILO [47] and the traffic assignment model MATSim [48]. Land use and transportation interact with each other in the long term, as the location of households and firms defines origins and destinations of most trips, while the levels of congestion affect location choice of households and firms.
We first use the integrated model SILO/MATSim to represent the changes of the population of the BMR during the period 2015–2050. Next, we simulate the travel demand in 2015 and 2050. We calculate the traffic volume by transportation mode under different scenarios (job redistribution and public transportation extension), and assign it to the network using MATSim, to calculate the travel distance, travel time and speed, among other indicators.

4.1. SILO

The agent-based land use model SILO (Simple Land Use Orchestrator) simulates changes of a synthetic population [47]. SILO microscopically represents the relocation of households and demographic events, such as aging, having a child, marriage/divorce or death, among others. For relocation, the choices of households depend on accessibility, costs or quality of the candidate dwellings. The travel time to work by mode of each household worker is considered explicitly. SILO is tightly integrated with MATSim (see Section 4.3), to represent the land use/transport feedback cycle [49].
SILO is applied to the metropolitan area of Bangkok. A synthetic population for the base year (2015) was generated using the data from the Household Travel Survey and the Census. In subsequent years (2015–2050), the synthetic population was estimated based on the fertility, mortality, and migration rates assumed by SILO, in line with the population scenarios presented in Section 5. Every 10 years, trips to work are simulated in MATSim. After that, travel times are updated and fed back to the relocation model.

4.2. Trip Distribution and Modal Share Estimation

The OD traffic volume by transportation mode is estimated based on the model in [46]. In this paper, we have developed a transportation choice model and a destination choice model for each gender and age group. The mode choice model parameters are estimated based on Household Travel Survey (HTS) data, but due to data constraints, the model uses only the travel time as an explanatory variable. The destination choice model is based on a variant of the gravity model that satisfies the trip generation constraint. Although the OD patterns are not observed in the data, a likelihood function is established from both the OD patterns estimated by the gravity model, the Fratar method and the distance distribution observed by the HTS. The parameters are estimated to maximize the likelihood function. This estimate does not reflect the home-schooling or working from home, which are seen during pandemics. For details, please refer to [46].

4.3. MATSim

MATSim is an agent-based transport simulation framework that can be used as a Dynamic Traffic Assignment (DTA) model. Given a set of daily plans of the agents, it simulates route choices in both the road and public transport networks. The workflow of MATSim is based on an evolutionary algorithm. At every iteration, agents score their plans (based on travel time and arrival time and duration to activities). Agents who are unsatisfied change their plans (e.g., change routes) in the next iteration. The process is repeated until further improvements of the scoring are not relevant. Using this approach, MATSim can simulate mode choice between cars and public transportation (see [50] for an application example). However, for simplicity, in this study, MATSim has been applied separately to private cars and public transportation. This is because we want to simulate dynamic route selection behavior on a large public transportation network including all bus routes in the Bangkok metropolitan area, which requires large computational resources.
Firstly, we use MATSim as part of the integrated SILO/MATSim model to simulate trips to work and update car travel times every 10 years, as defined in Section 4.1. Secondly, we use MATSim to simulate multimodal travel demand in the base year and in 2050, under different scenarios.
Based on the OD traffic volumes and HTS data for each traffic mode created in Section 4.2, we create a daily travel plan for each agent when using private cars and public transportation and use it as input for MATSim. Other inputs include the road network, for private passenger cars, and timetable and vehicle data, for public transportation.

5. Scenarios for Transport Policy Measures

In this section, we set up scenarios for the total population, the railway network, and the sub-centers in 2050. The total population and its distribution are the output of the SILO/MATSim model, and therefore it is the same for all scenarios. We have prepared two patterns for the railway network and two patterns for job location. By analyzing the different impacts of these scenarios on traffic conditions, we will examine the effects of land use and transportation policies.
The total population of the Bangkok metropolitan area in 2050 is based on the Shared Socioeconomic Pathways (SSP)1 estimates from the reference [7]. Figure 2a shows the population from the UN World Urbanization Prospects until 2015 and the estimates from the reference [7] after 2015, adjusted so that the population in 2015 matches the population of the region in this study. Under this scenario, the population of the Bangkok metropolitan area is expected to increase from 15.1 million in 2015 to 22.3 million in 2050, an increase of 47%. The total population is used as an exogenous assumption to run the land use model SILO. Under such assumption, SILO models demographic changes and relocation of households during this period.
Figure 2b shows the urban rail lines as of 2015 (green), the planned lines shown in M-Map2 (yellow), and the assumed sub-center areas (blue zones). Note that some of the planned lines in yellow are already in operation as of 2021. The total length of urban railway lines in 2015 was 156 km, and the total length of planned lines was 874 km. The timetable of the new route is set to be the same frequency as the current route.
Based on the actual urban and transportation plans of BMR, this study selected some zones as sub-centers for the analysis. These zones are: (1) far from the current city center, (2) located along the planned railway lines, and (3) expected to have a high concentration of urban functions. We assume that the number of employees in the future will change to reflect changes in the working-age population. The growth rate of the working-age population between 2015 and 2050 is estimated to be 23%. As a result, the number of employees is assumed to increase from 7.99 million in 2015 to 9.83 million in 2050. In the sub-center scenario, we assume that 20% of the employees in all zones will relocate to the sub-centers. The spatial distribution of employee density for the BAU case in 2015 and 2050 and the sub-center scenario in 2050 is shown in Figure 3.
In the following, we analyze a combination of cases in which the urban rail network is fixed to the 2015 lines (current network scenario) and all planned lines in M-Map2 are supplied (future network scenario), as well as a case in which the distribution of employees changes with the trend (business as usual (BAU) scenario) and sub-centers are formed (sub-center scenario). The differences in traffic conditions between these scenarios will be analyzed to examine the effects of transportation and land use policies.

6. Results

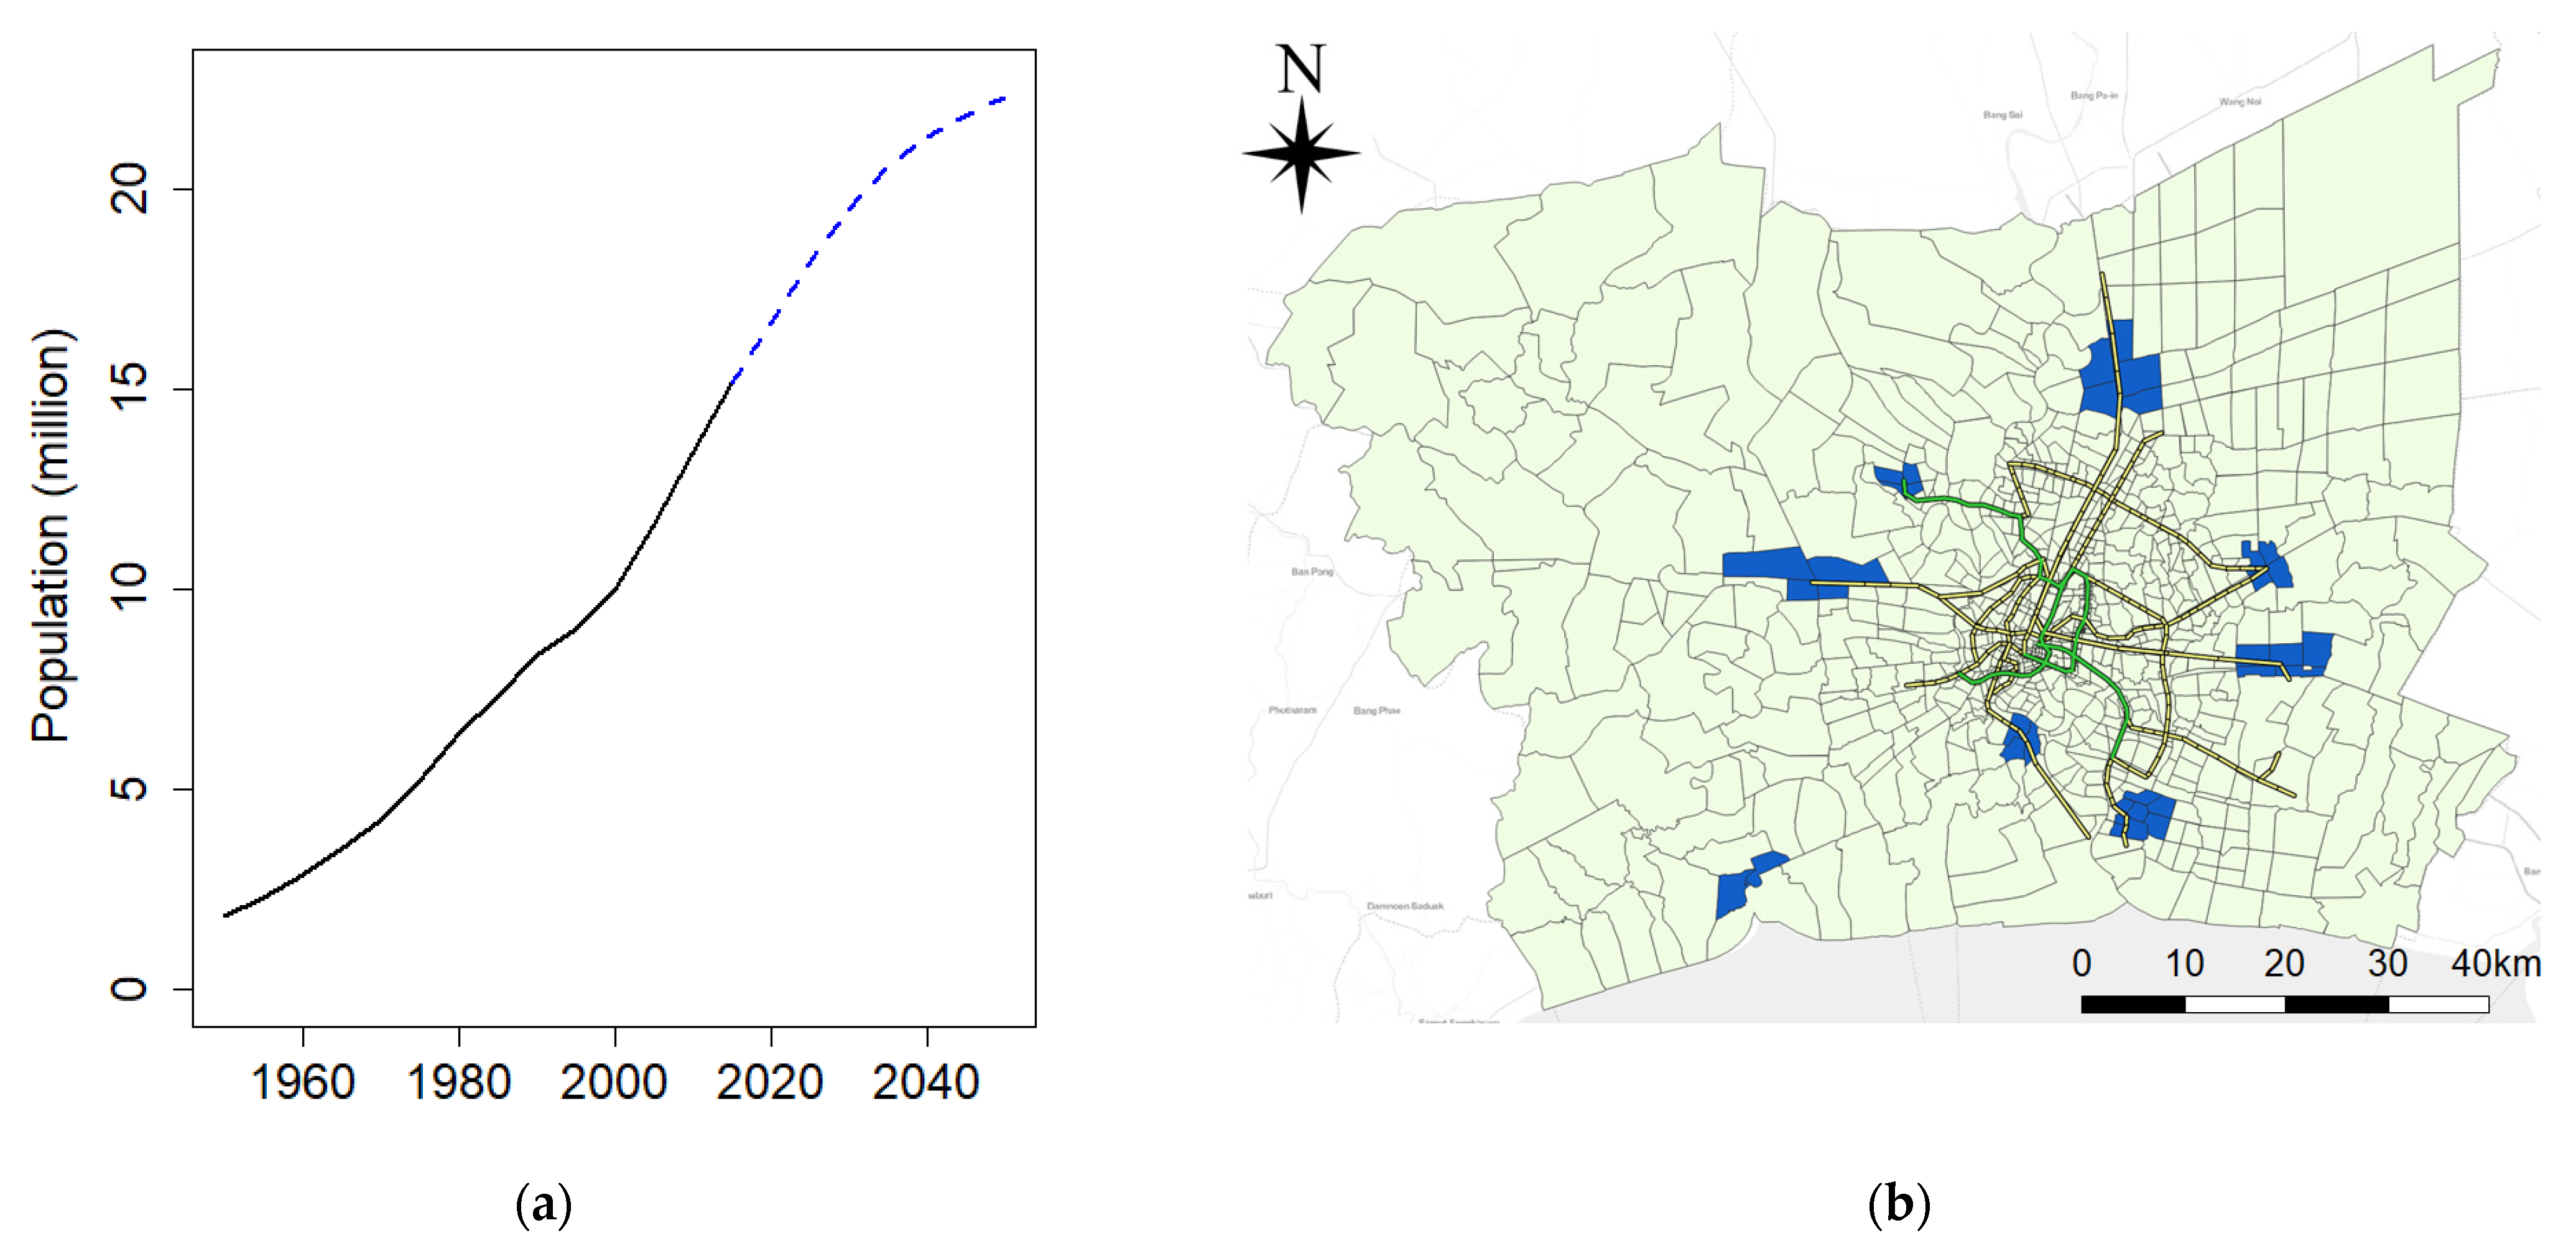
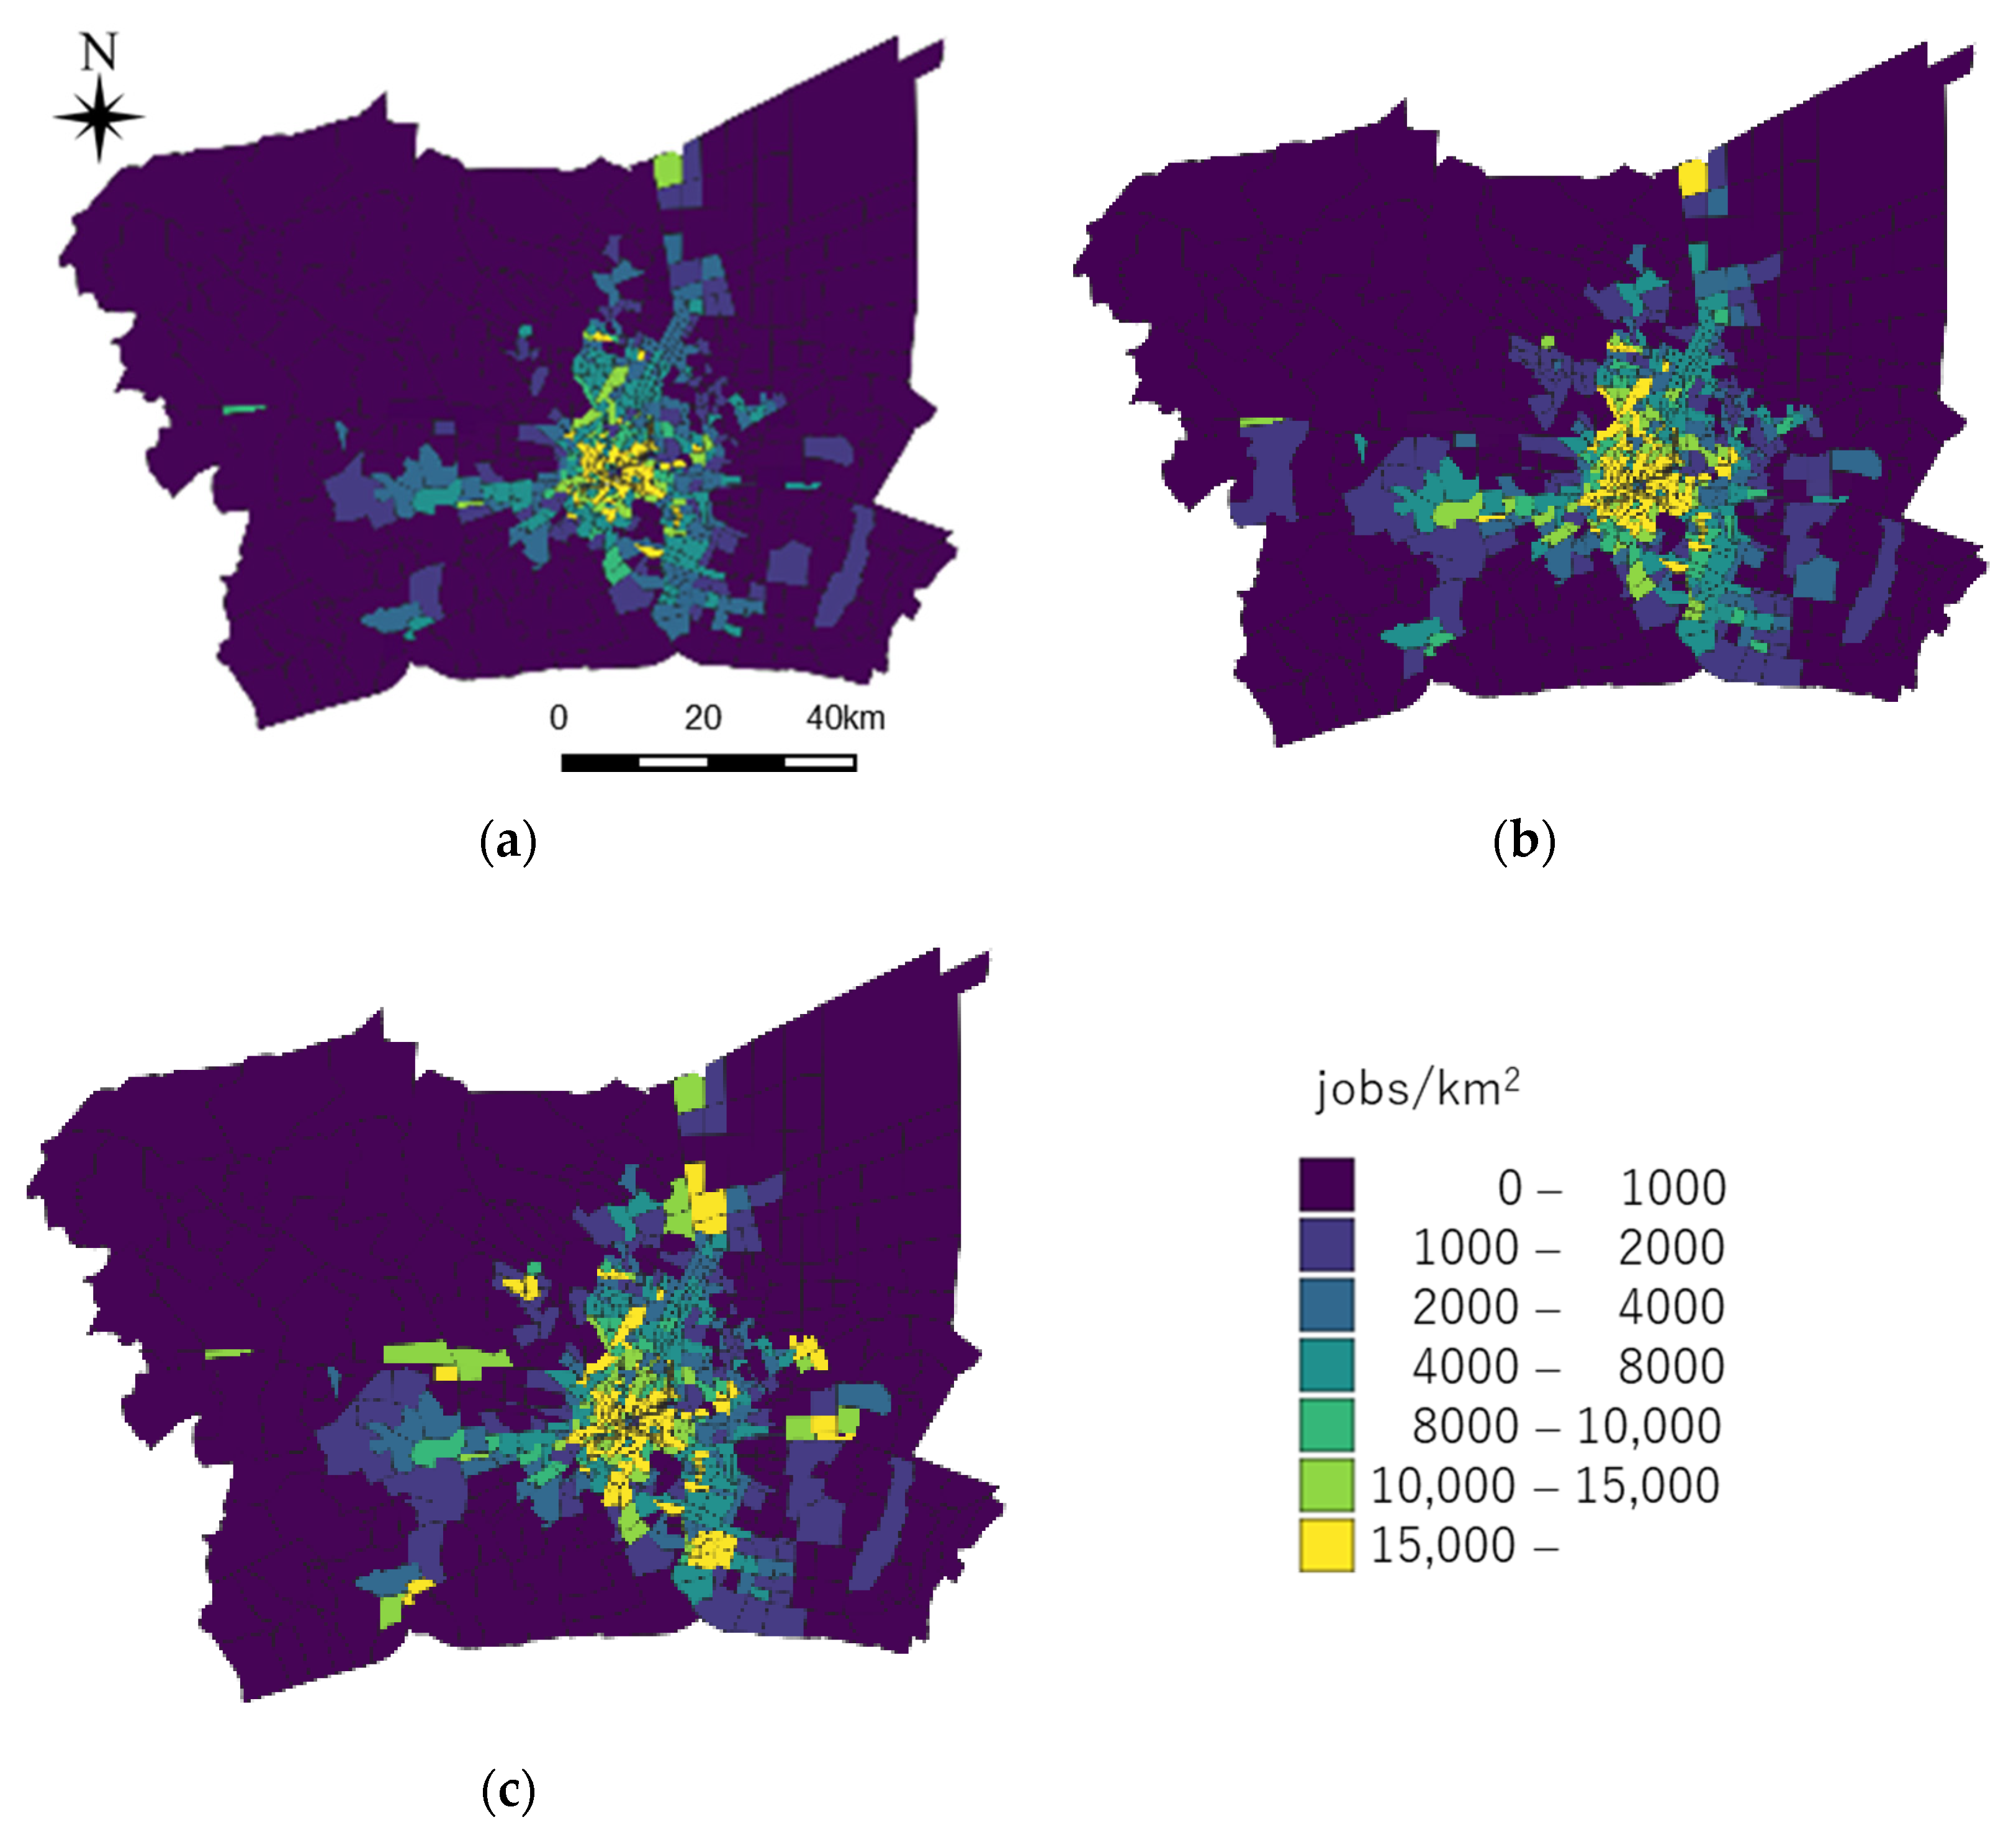
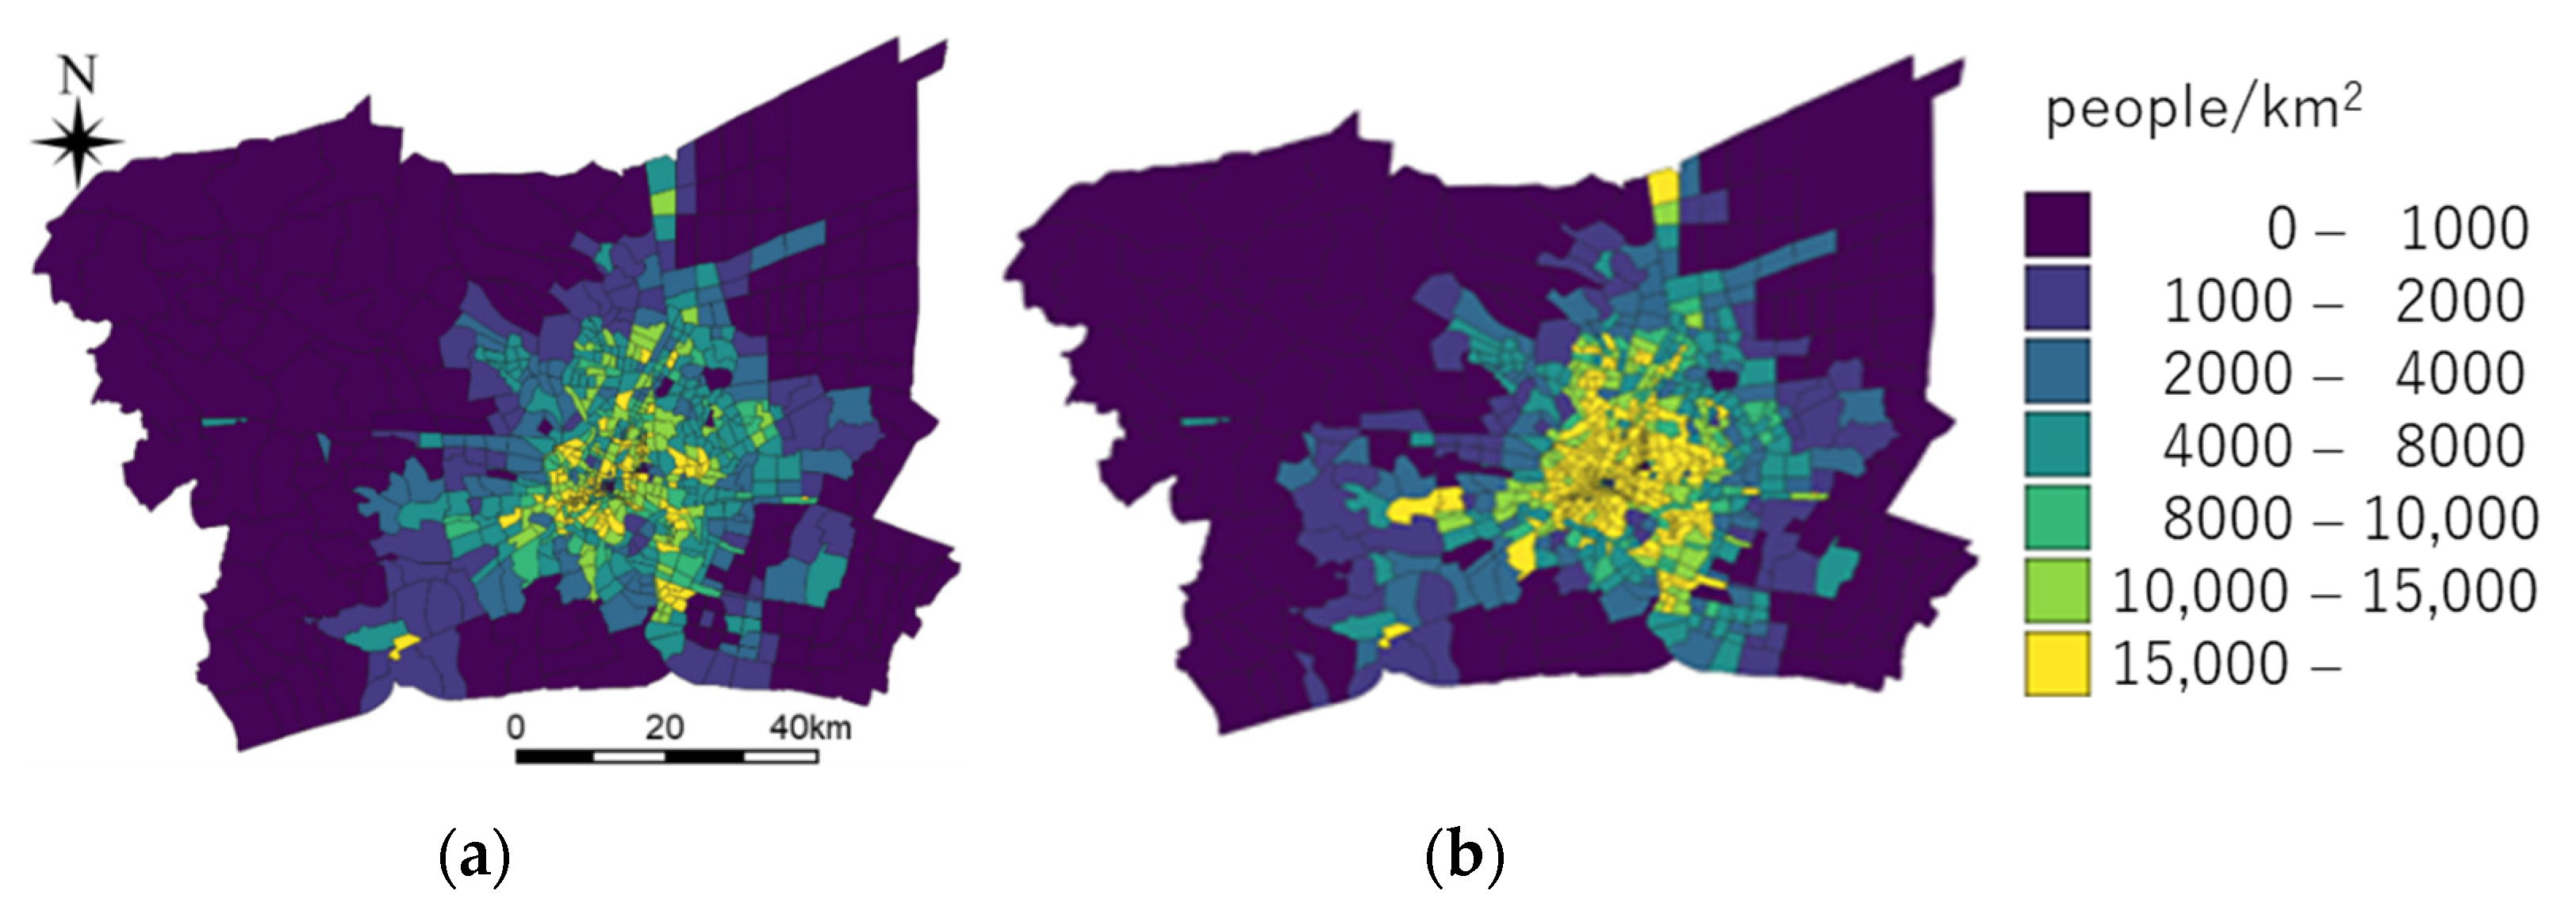
6.1. Future Population

Figure 4 shows the population of the Bangkok metropolitan area by gender and age in 2015 and SILO’s estimate of the population in 2050. Fifteen million people in 2015 are expected to increase to 22 million people in 2050. However, the number of young people under 20 years old will decrease, while the working-age population (20–59 years old) will slightly increase. On the other hand, the number of elderly people aged 60 and above is expected to increase significantly. In Bangkok, the population continues to flow in due to the many employment opportunities. If people’s life expectancy increases with the improvement of medical care, and if they continue to live in Bangkok after retirement, it is estimated that the population will rapidly age in the future.
These figures are based on estimates of fertility, mortality, and assumed migration. In this study, the total population of the Bangkok metropolitan area was given by the scenario, and the gap between the closed cohort population estimates and the total population by scenario was filled with migrants from outside the metropolitan area. The age structure of the migrants was assumed to be proportional to the age structure of the metropolitan region in the previous year. Changing these assumptions may result in different future demographic figures, but we believe that the assumptions we have made are moderate and that rapid aging, as observed in some developed countries, is likely to occur.
Figure 5 shows the spatial distribution of population density in 2015 and 2050. It can be seen that with the increase in total population, areas with very high population density are expanding in the city center, while in the suburbs, population density is increasing in zones with good access to business districts. In this study, we use the nighttime population distribution shown in Figure 5b for all scenarios.

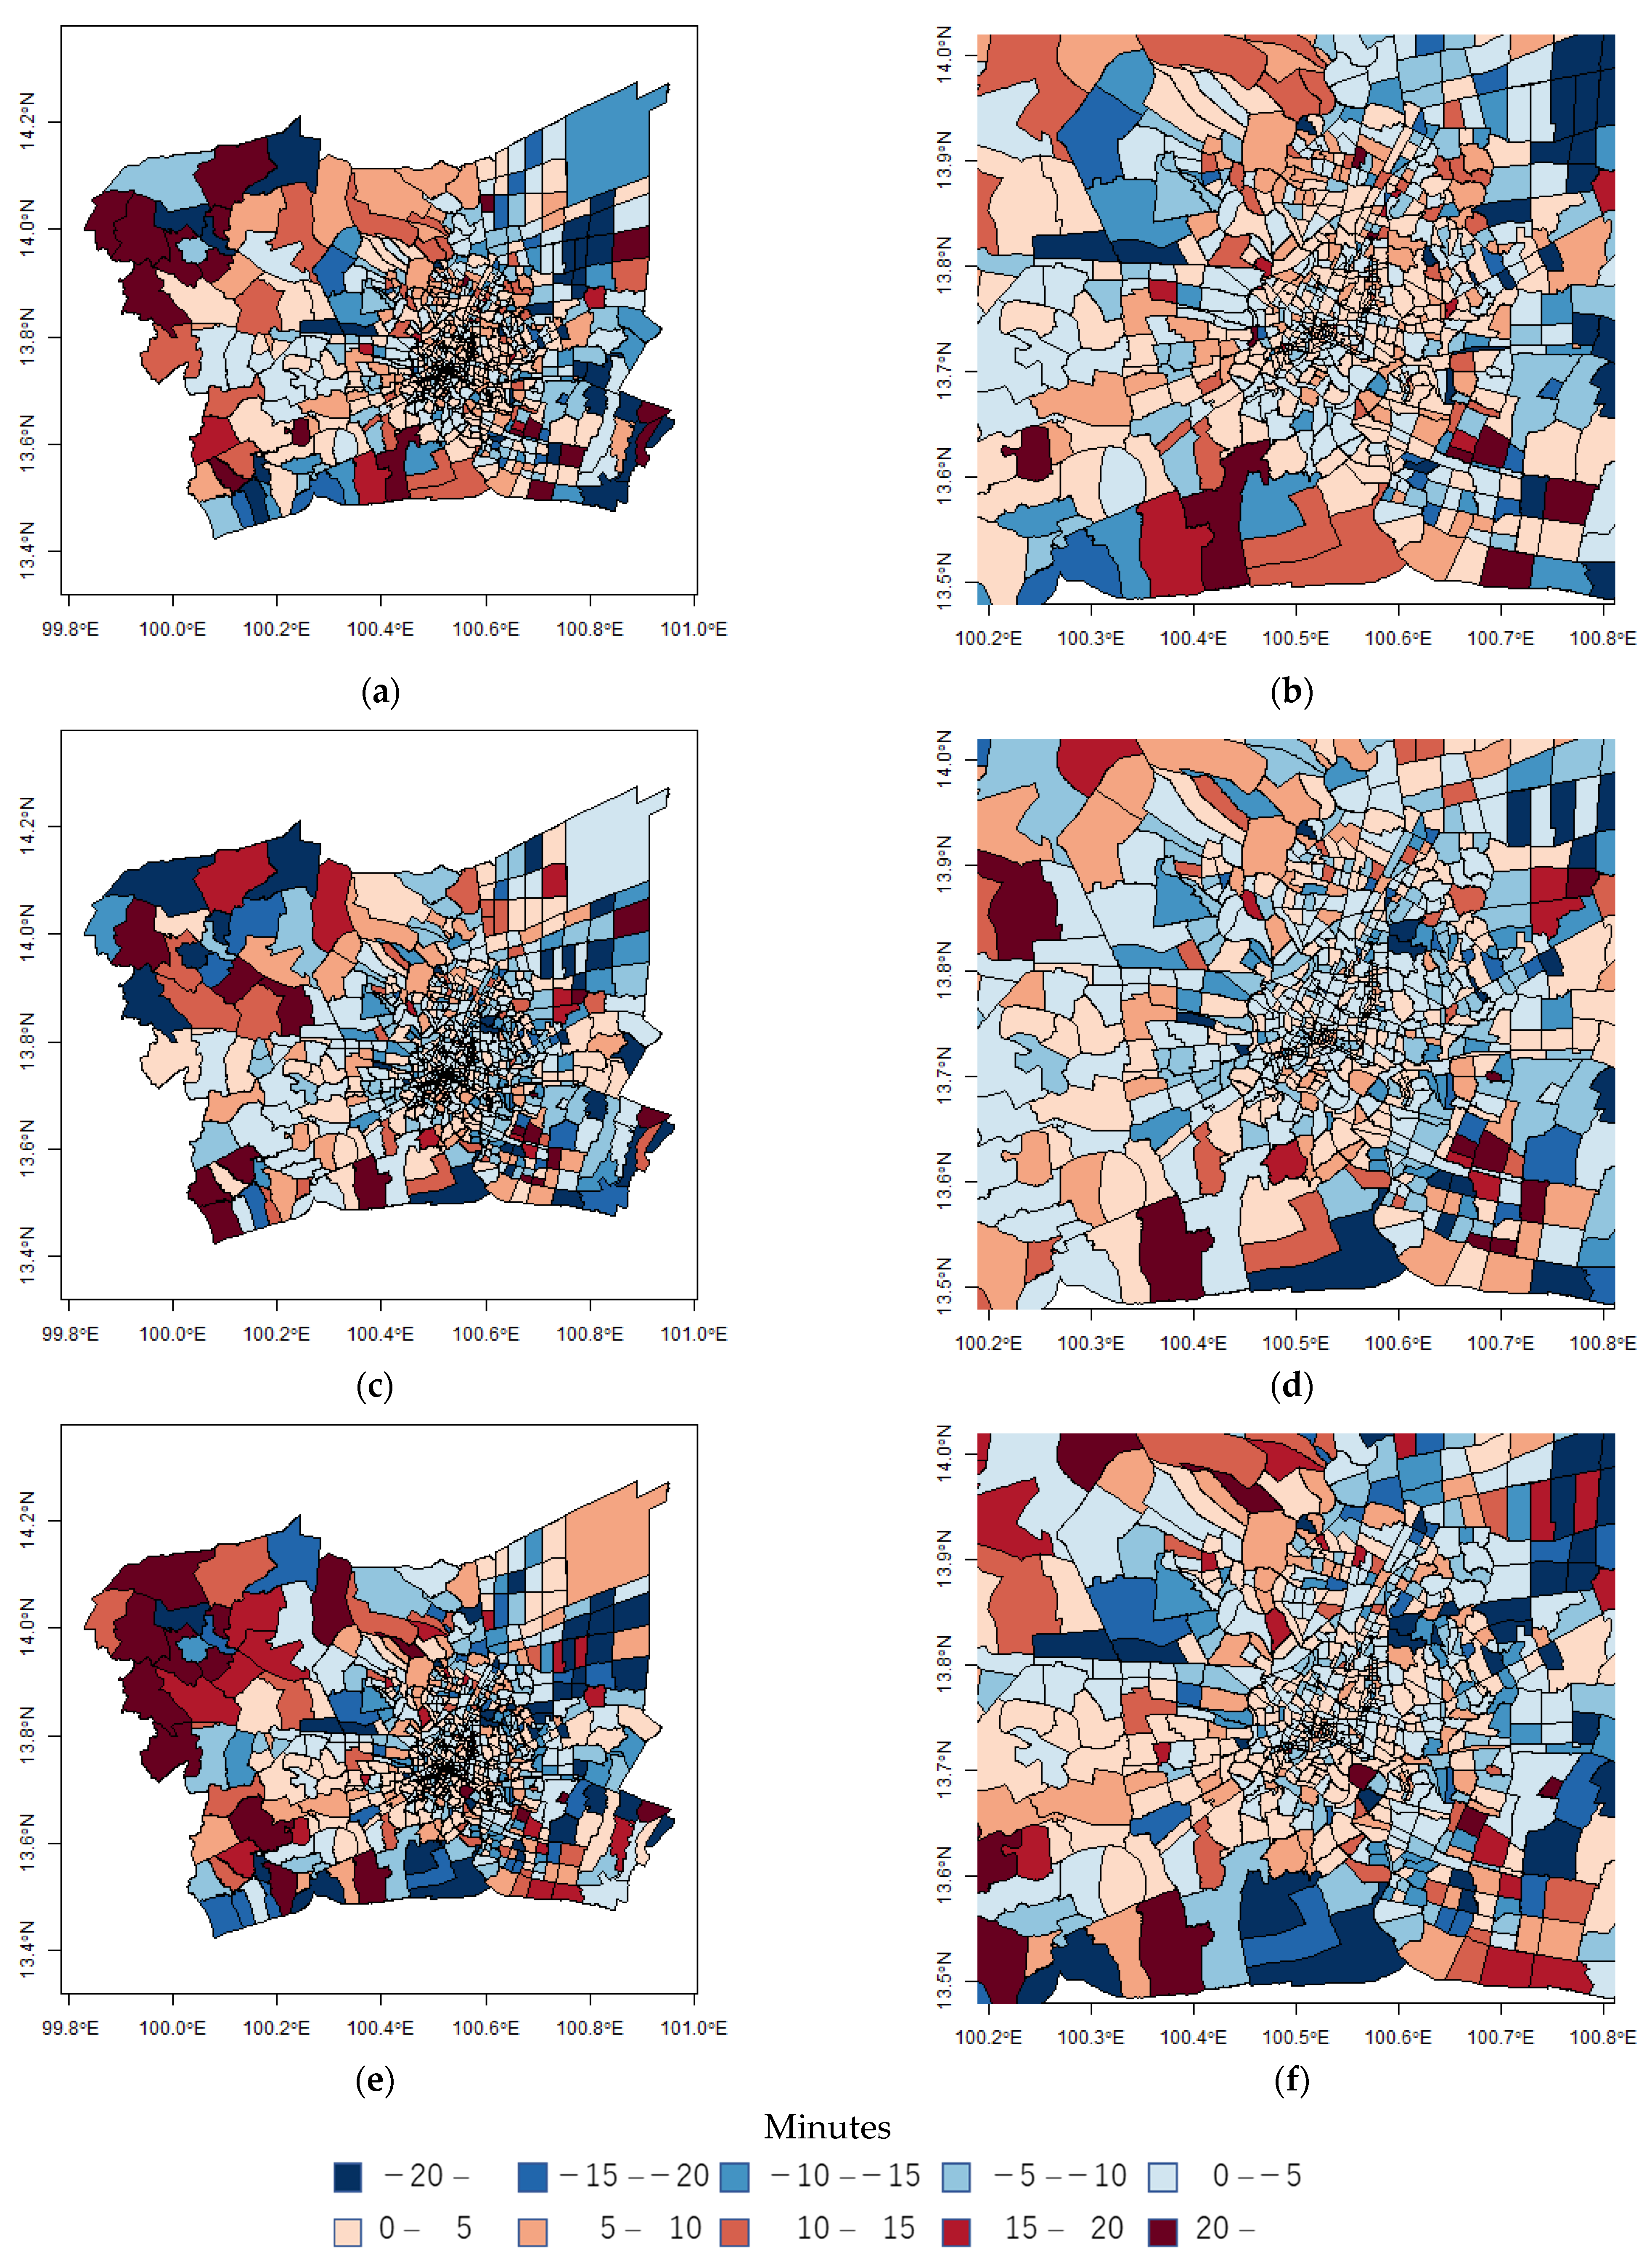
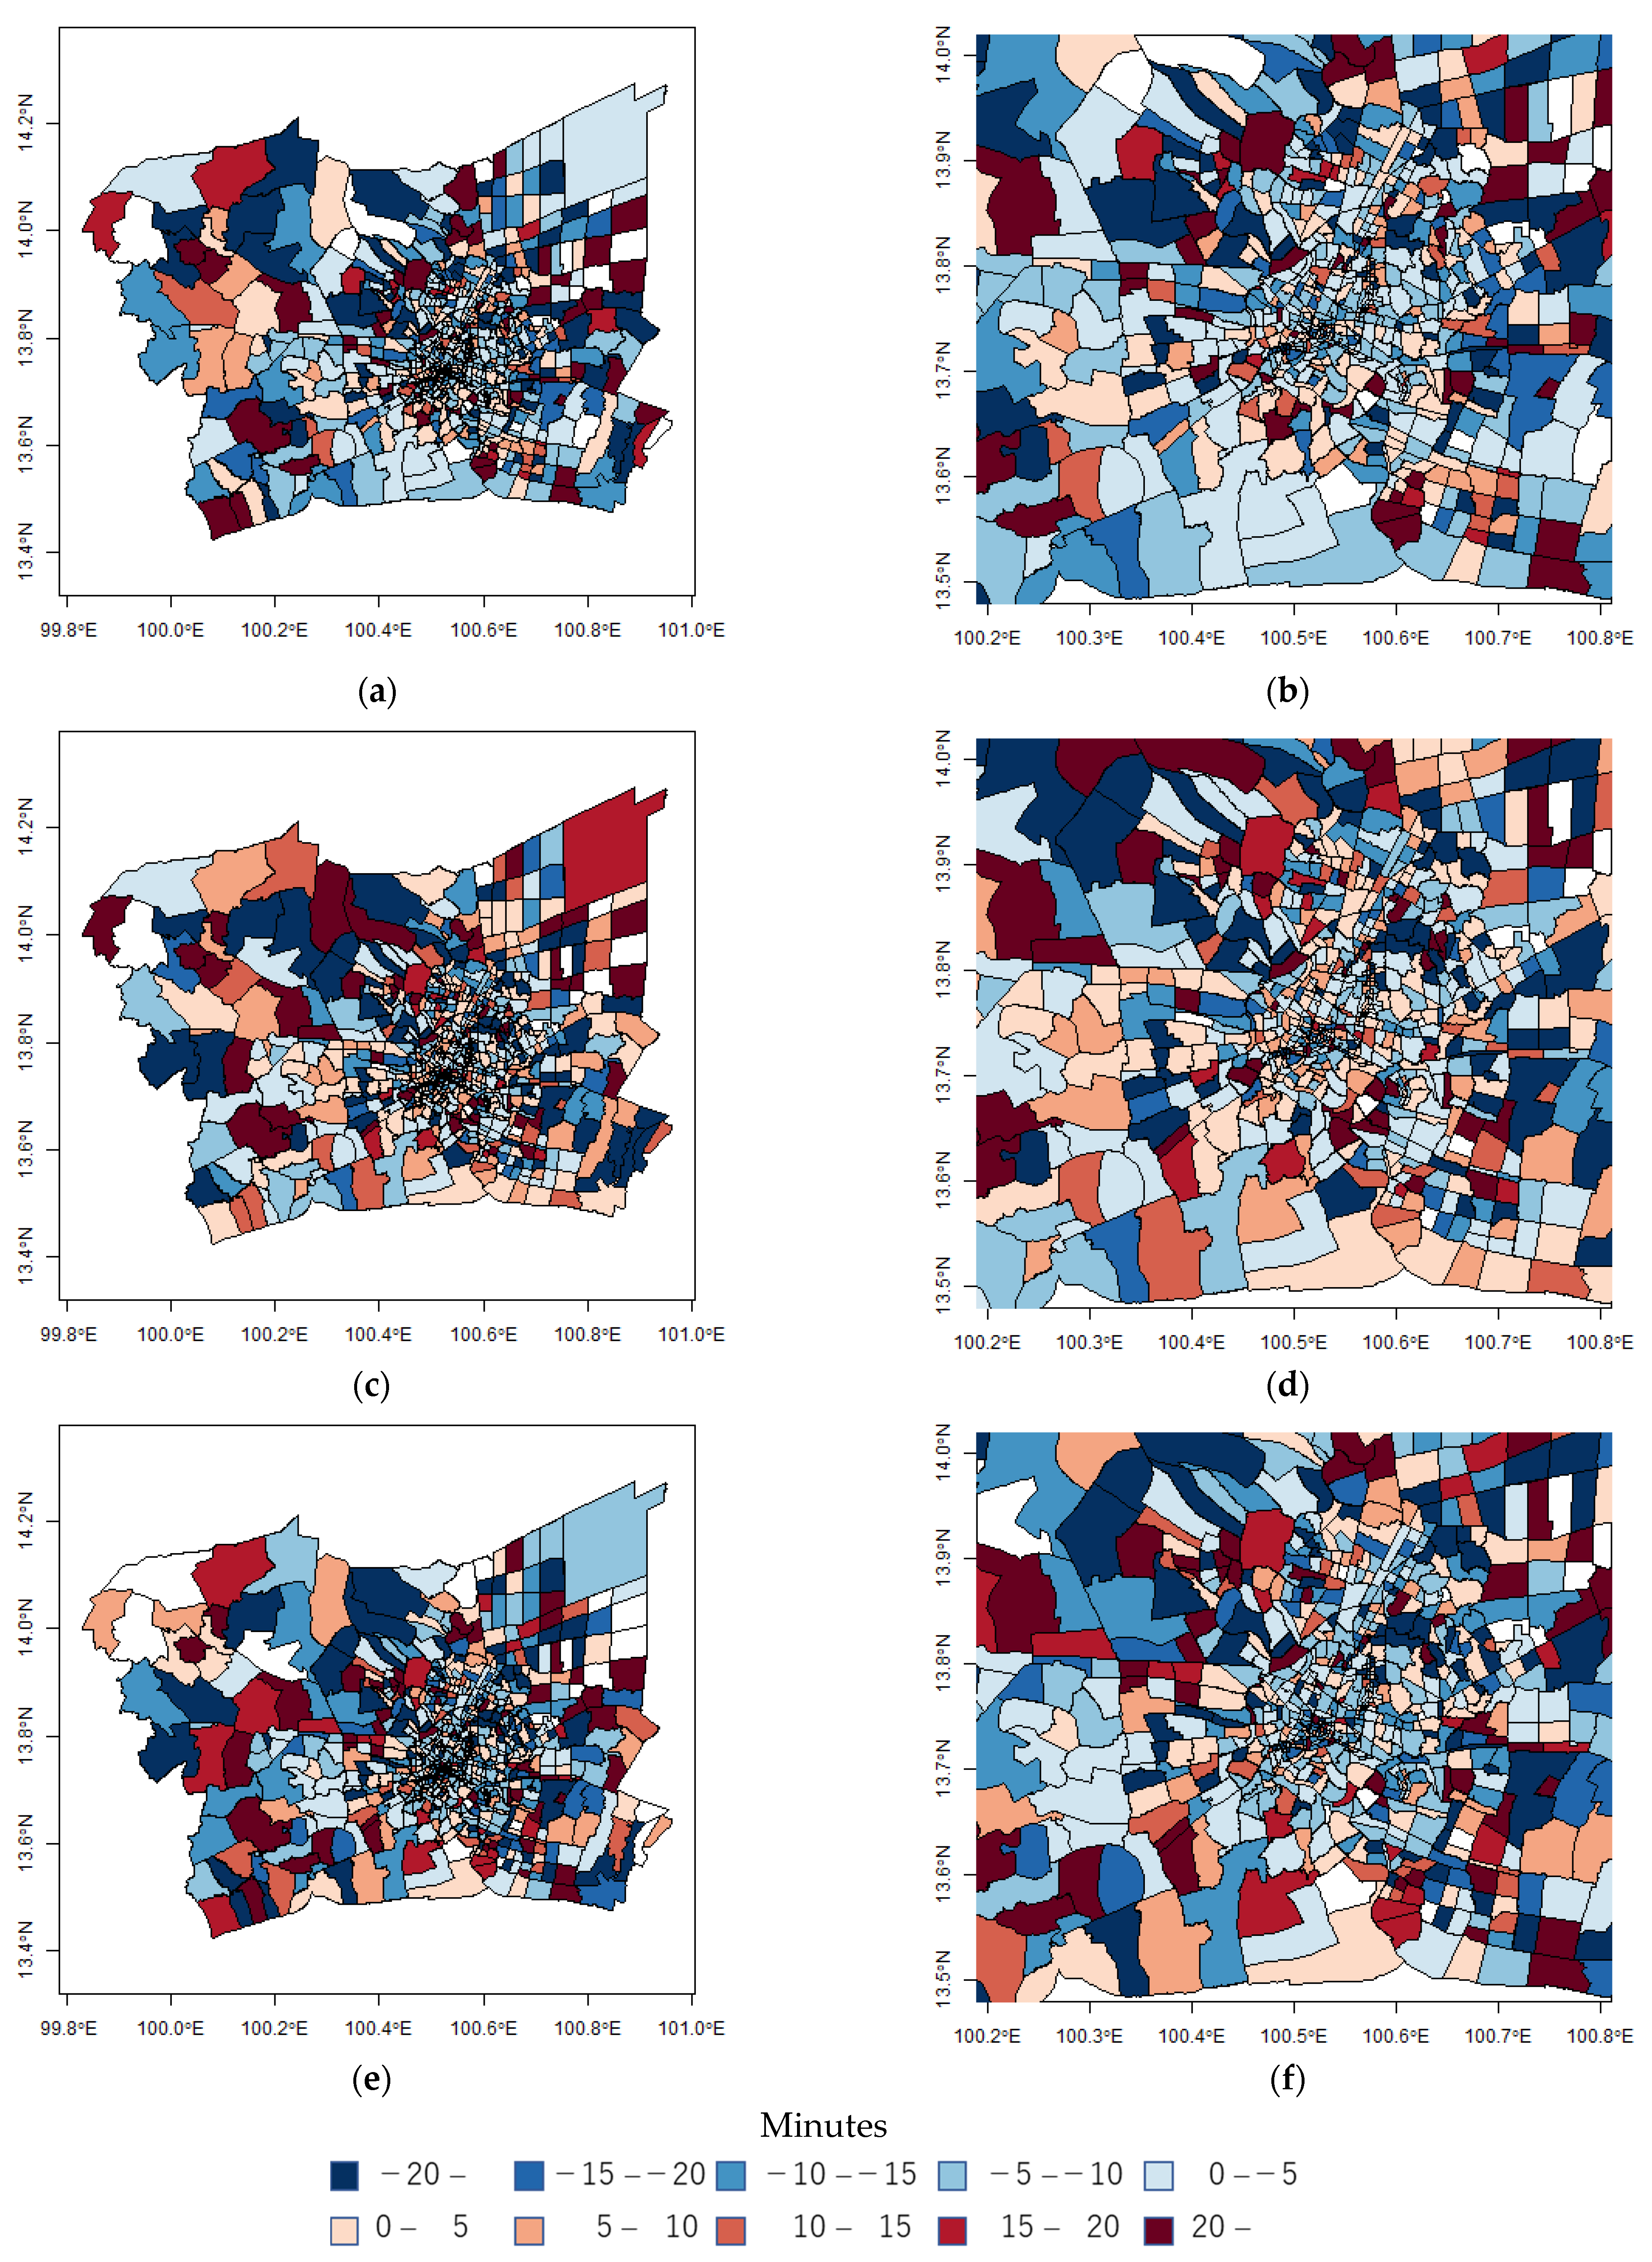
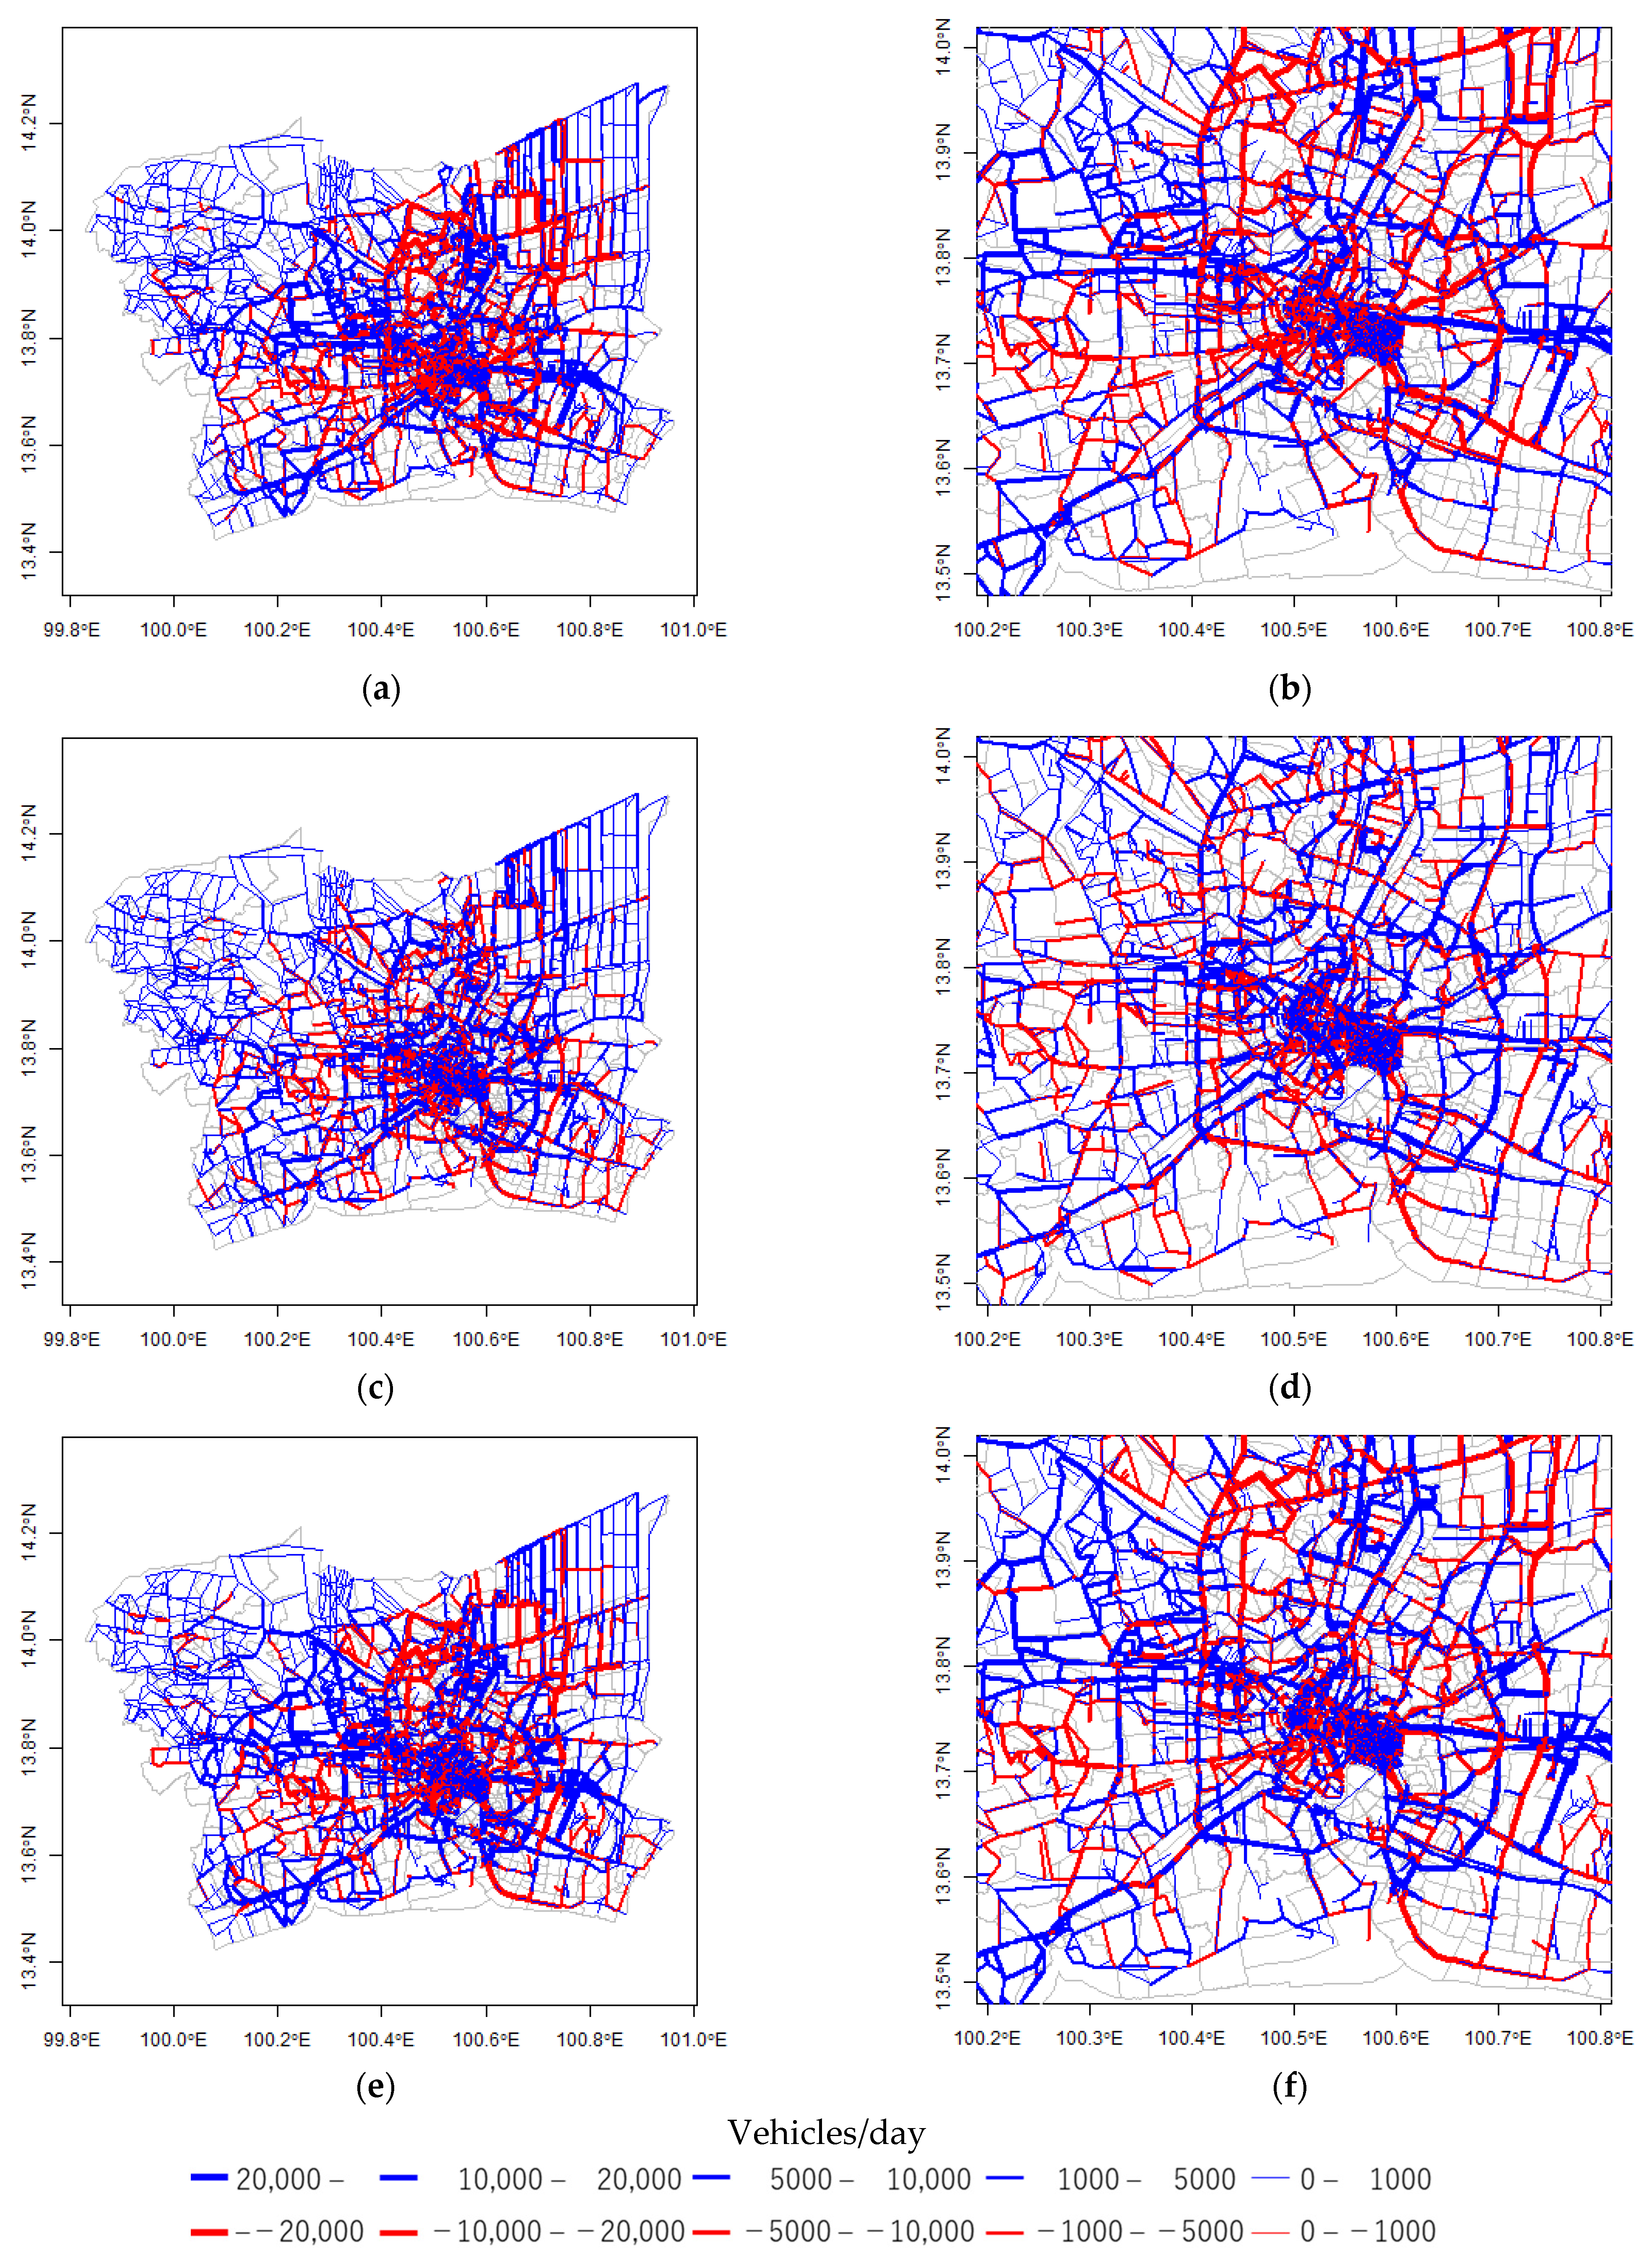
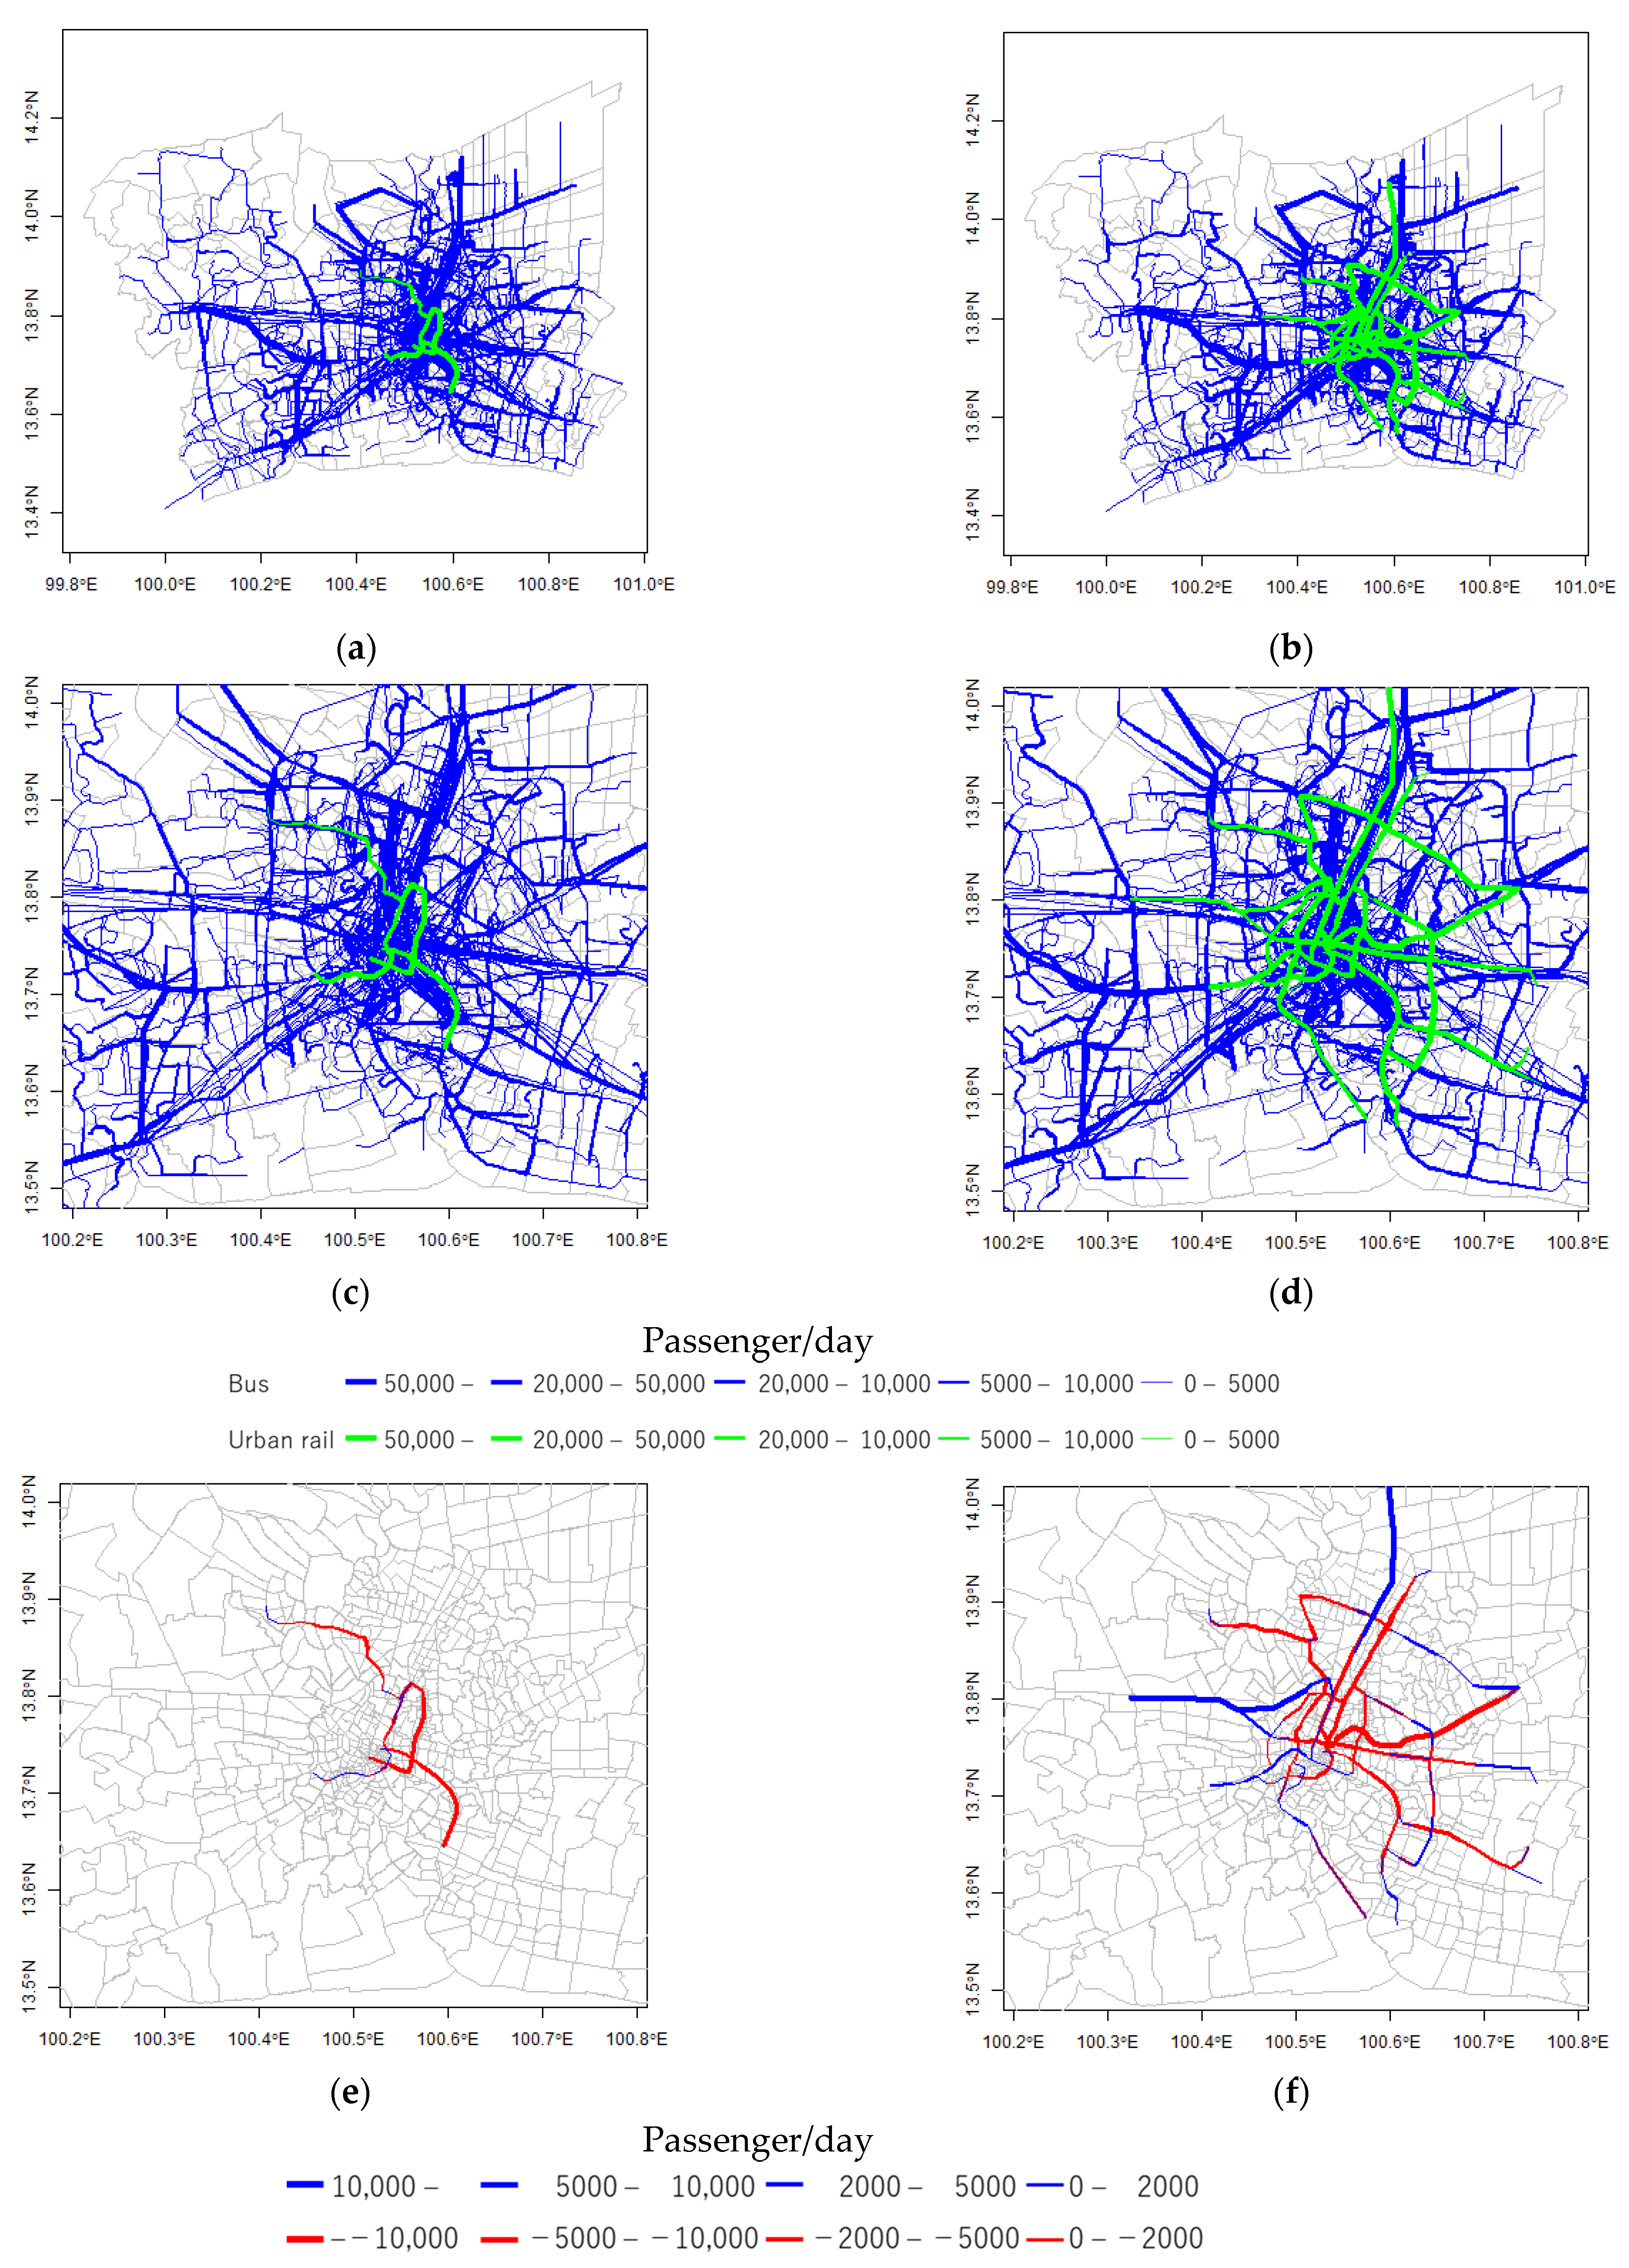
6.2. Travel Time and Congestion by Scenario

Table 2 shows the key transport indicators in 2015 and 2050 as estimated by the simulation. In the MATSim simulations here, we assume a sampling rate of 5% for road transportation and 1% for public transportation. This is a reasonable approach in agent-based modeling to economize on runtime [51]. First, between 2015 and 2050, the total distance traveled by automobiles will increase by about 40%, while the total distance traveled by public transportation will increase by about 50–70%. As shown in Figure 2, the total population will increase by 47% during the same period, but the total distance traveled by automobiles and public transportation combined will increase by 40–43% due to changes in the age structure, spatial distribution of residence and employment, and distance traveled per capita.
For public transportation, the range of increase in travel distance differs depending on the scenario. In the future network scenario, the per capita travel distance will increase due to route detours caused by transfers from buses to railways as urban railways are expanded. The rate of increase in the total distance traveled will also be higher because the number of users will increase due to the improved convenience of public transportation.
The most significant changes between 2015 and 2050 are in the time of car use and the average speed. The average speed of cars in 2015 is estimated to be 24 km/h, but in 2050 the average speed drops significantly to about 10 km/h due to the increase in traffic. For average speed, there is little difference between the scenarios. The average travel time for all scenarios in 2050 is more than double that of 2015, but travel times differ slightly among the 2050 scenarios. The future network scenario is five to six minutes longer than the current network scenario. This is due to the increased accessibility along the railroad lines as a result of the expansion of public transportation, and the increased centrality of the city center, which changes its attractiveness as a destination zone and increases travel time. On the other hand, the sub-center scenario is four to five minutes shorter than the BAU scenario. Since the total distance traveled in these scenarios is not much different, the difference can be attributed to the spatial demand shift from the congested central area to the relatively less congested sub-centers. On the other hand, the time required for public transportation will decrease slightly in 2050 compared to 2015 in both scenarios. In the future network scenario, the speed of public transportation will increase due to the concentration of the residential population around the transit-friendly areas and the extension of railways, which are faster than buses. As a result, in the future network scenario, the average travel time will decrease even though the average travel distance will increase. The average travel time in the subcenter scenario is slightly longer than in the BAU scenario. This implies that the access to the sub-center is longer in distance and a larger proportion of buses that are slower than trains.
Next, Figure 6 shows the difference in average travel time by car between the current network/BAU scenario and each scenario in 2050, by origin. Travel times are aggregated based on MATSim’s output, which reflects simulated road congestion. Figure 6a,b shows the difference between the current network/sub-center scenario and the current network/BAU scenario, with blue indicating shorter travel time in the former and red indicating shorter travel time in the latter. We can see that the travel time for the sub-center scenario is shorter in the city center and suburban areas. This reflects the fact that in the sub-center scenario, there is an increase in the number of journeys with destinations in the suburbs, where traffic congestion is relatively low, reducing the amount of traffic in the city center by dispersing traffic demand to the suburbs and, in some cases, shortening the travel distance by changing the destination from the city center to the sub-center.
Figure 6c,d shows the difference between the current network/BAU scenario and the future network/BAU scenario. The travel time in the center and suburbs of the urban area increases in the future network scenario. We estimate that the improvement of the public transportation network will increase the accessibility to the city center, which will in turn increase the amount of concentrated traffic by automobiles as well as public transportation. This means that access to the city center from distant places will increase, and at the same time, travel time will increase due to worsening traffic congestion.
Figure 6e,f shows the difference between the current network/BAU scenario and the future network/sub-center scenario. In this case, the time required in the suburbs of the metropolitan area increases. In the north and east part of the central and near suburbs, the time required decreases, while in the south part it increases. The sub-centers increase the number of trips that make them a destination. This leads to longer travel distances in the outer suburbs. In the northern near suburbs, travel distances are reduced due to the larger size of sub-centers and greater proximity to destinations than in the southern suburbs. In addition, the northern area has a relatively good railway network in the future scenario, which helps to reduce road traffic and road congestion.
Figure 7 similarly shows the average difference in travel time by car between the current network/BAU scenario and each scenario in 2050 by destination zone. Figure 7a,b show that the travel time to the city center zones is shorter and the travel time to the subcenters is longer. The difference between the current network/subcenter scenario and the current network/BAU scenario shown in Figure 7a,b shows that the travel time to the city center zone is shorter and the travel time to the sub-center is longer. This reflects the change in travel distance and congestion by destination. This result supports the fact that the concentration of traffic is shifting from the city center to the subcenter. As a result, we can see that while travel time to the city center is getting shorter and traffic congestion to the city center is easing, travel time to the subcenter is getting longer and congestion at the subcenter is getting worse.
Figure 7c,d shows the average travel time difference between the current and future network/BAU scenarios by destination zone. As explained in the case of the aggregation by origin, trips will be concentrated in the city center due to the improved accessibility provided by the future rail network. On the other hand, some zones will become relatively less attractive for travel, leaving only short trips. Thus, trips in some of the suburban zones will have shorter travel times compared to the case of the current network.
Figure 7e,f shows the difference between the current network/BAU scenario and the future network/subcenter scenario. Comparing with Figure 6e,f, we can see that the travel time in the subcenter zone is longer. It can also be seen from the comparison with Figure 7a,b that the travel time for some zones along the new rail line is longer than that for the current network. This indicates that the construction of the railroad will induce demand for car travel, which will increase the travel time and traffic volume to those zones.
Figure 8 shows the average difference in travel time by public transport for each scenario. Looking at the difference between the current network/sub-center scenario and the current network/BAU scenario shown in Figure 8a,b, there is a mixture of zones with decreasing and increasing travel times, with no significant change in travel times for the center zones. On the other hand, travel time has decreased in the sub-centers and its adjacent zones. The demand shift of the destination from the city center to the sub-centers has contributed to the reduction in travel time.
Looking at the difference between the current network/BAU scenario and the future network/BAU scenario in Figure 8c,d, we can see that travel time decreases in many zones by future network. As the future network of urban railways will improve public transportation services, travel time will decrease or at least remain the same if the traffic OD pattern remains the same. The results shown in this figure indicate that the expansion of urban railways will affect the travel time of public transport widely. On the other hand, in the zones where travel time has increased, travel to more distant locations has increased due to the improved mobility of public transportation.
Looking at Figure 8e,f, there are many zones in the future network/sub-center scenario where the travel time will be longer than in the future network/BAU scenario. At the same time, the travel time in the zones near the sub-center is significantly reduced. This is due to the fact that the connectivity to the sub-centers by public transportation varies greatly from zone to zone due to the limited public transportation routes compared to automobiles. In the peri-urban area, there are corridor-like zones in the southwestern and northwestern parts where travel time is longer. In these zones, there is no public transportation in the direction to the sub-center, and the detour is expected to increase the travel time. On the other hand, there are zones where the travel time will be shortened only in the future network/sub-center scenario. In these areas, the combined effect of the expansion of the urban rail network and the development of the sub-centers is expected to improve the convenience of public transportation.
Figure 9 shows the aggregation of those differences by destination zone. The differences between the current network/sub-center scenario and the current network/BAU scenario are shown in Figure 9a,b. In contrast to Figure 8, travel times are shorter in many destination zones, reflecting the shift of trip destinations to the subcenter. The travel times aggregated in the sub-center zones are longer to attract longer distance trips.
In Figure 9c,d, which show the differences between the current and future network/BAU scenarios, there appears to be a spatial mix of zones where travel time decreases and zones where it increases. As the future public transportation network improves the level of service of public transportation, the attractiveness of each destination will change, as we have discussed. Some zones along the new rail lines will attract longer distance trips, so travel times in these zones will be longer than in the current network scenario.
Figure 9e,f shows the difference in the average travel times aggregated for the destination zones of the current network/BAU scenario and the future network/sub-center scenario. It can be seen that in some sub-center zones, the travel time is longer in the future network/BAU scenario, while in many zones in the city center, the travel time is shorter in the scenario. This result reflects the mixed effect of railroad development and subcenter development. Therefore, this figure looks like a mixture of the former two scenarios.
Figure 10 compares the difference in road traffic volume for each scenario with the current network/BAU scenario. The blue color link in the figure indicates that the traffic volume of each scenario is higher than the current network/BAU scenario, and the red color indicates the opposite. Looking at the current network/BAU scenario in Figure 10a,b, it can be seen that there are many links in the city center where the traffic volume decreases. The traffic volume of the links in the sub-center zone is increasing, but we can see that in some places the traffic volume is decreasing significantly on the links near the sub-center zone.
Next, looking at the future network/BAU scenarios in Figure 10c,d, we can see that the traffic volume in the city center and the ring direction bypassing the city center is increasing, and there are few links where the traffic volume is decreasing. These results indicate that the expansion of the public transportation network will increase the attractiveness of the city center, promote the concentration of road traffic as well, and increase the traffic volume in the ring direction bypassing the city center.
The future network/sub-center scenarios in Figure 10e,f show that the pattern of traffic volume change in the northern suburbs is similar to that in Figure 10c, while the pattern in the central area is a mixture of increase and decrease. This is due to the existence of both the dispersion effect of the sub-centers and the concentration effect of the expansion of the public transportation network. As a result, the pattern of traffic volume change is intermediate between Figure 10a,c.
Figure 11 shows the public transport link traffic in 2050 under the BAU scenario and the difference between the BAU and sub-center scenarios for urban rail link traffic. Here, Figure 11a,c,e are the results of the current network scenario, and Figure 11b,d,f are the results of the future network scenario.
First of all, under the current urban rail network, buses are responsible for a substantial part of public transportation, while in the future network, railways cover a large part of the densely populated area in the Bangkok metropolitan area. As a result, in the current network/BAU scenario in 2050, the traffic demand of urban rail is estimated to be 2.42 million person-km/day and that of bus is estimated to be 81.15 million person-km/day, while in the future network/BAU scenario, the traffic demand of urban rail is estimated to be 19.37 million person-km/day and that of bus is estimated to be 72.88 million person-km/day.
Comparing Figure 11c,d, we can see that the future network increases the demand for some bus routes that connect to the terminals of the urban railways indicated by the green lines. In other words, the expansion of the urban rail network increases the demand for bus connections from the suburbs.
Figure 11e,f shows the difference in urban rail demand between the BAU scenario and the sub-centers scenario. The current network shown in Figure 11e is connected to only one sub-center, and the overall urban rail demand is estimated to decrease as the sub-centers developed. This reduced traffic volume will be covered by road transportation such as buses and private cars. On the other hand, in the future network scenario, urban rail demand will decrease on lines heading to the city center but will increase substantially on lines connecting to the sub-centers.

7. Discussion and Conclusions

In this study, it is estimated that traffic demand will increase substantially by 2050 due to population growth, and as a result, traffic congestion will become more serious. In particular, the average speed of automobile traffic is estimated to decrease from 24 km/h in 2015 to 10 km/h in 2050. The scenario of expansion of the urban rail network and formation of sub-centers assumed in this study contributed to increase rail demand and disperse congestion but had little effect on improving the average road speed. This reflects the fact that the expansion of the urban rail network and the formation of sub-centers alone will not reduce the overall road traffic volume under the condition of a significant increase in traffic demand.
First, as seen in Table 1, the traffic demand in person-kilometers is slightly higher in the sub-center scenario than in BAU. This suggests that the decentralization of destinations causes excess traffic demand. Although the decentralization of traffic demand contributes to alleviating congestion in the central area (Figure 6), it may worsen congestion in the suburban areas and increase the amount of travel by excess traffic. Therefore, it is necessary to guide the location of housing in response to the formation of sub-centers.
In the future network scenario, automobile traffic will increase compared to the current network scenario. In the future network scenario, accessibility to the city center will be improved, making the city center more attractive. As a result, not only public transport demand but also automobile traffic will be concentrated in the city center. As a result, congestion will worsen, detour traffic will increase, and the total distance traveled will increase.
In this analysis, we estimated the average daily ridership of urban railroads by counting the number of agents riding in each transit vehicle based on the output of MATSim. The ridership was 50 passengers per train in 2015, while it was estimated to be about 100 passengers with the current network/BAU scenario in 2050 and 170 passengers in the future network/BAU scenario in 2050. In the future network/sub-center scenario, the average number of passengers is slightly lower at 160. Before the COVID-19 outbreak, Bangkok’s urban railways were extremely crowded during the peak hours in the morning and evening, and it was common for passengers to wait for several trains on the platform until they could board a train. The estimated large increase in the average ridership of the urban railways indicates that such congestion may worsen further.
This presumed future intensification of road and rail congestion will reduce the sustainability of the city and worsen the quality of people’s lives. It will be difficult to solve these congestion problems simply by developing sub-centers or expanding the railway network as envisioned in this paper. However, if we look at the analytical results in spatial detail, we can get a hint of a solution.
First, the development of sub-centers will reduce congestion on both roads and railways in the city center. Bangkok’s urban structure is monocentric, and the city center is already densely developed, making it difficult to reserve land and space for transportation facilities. If the city center is to accommodate the increased traffic demand that will accompany future population growth, large-scale investment in transportation infrastructure and eviction to acquire land will be necessary to alleviate traffic congestion. This approach is questionable from a sustainability perspective because it requires a large input of materials and energy. On the other hand, in the area assumed to be the sub-centers, there are many agricultural lands and unused land, which can be used to develop the necessary transportation infrastructure at a relatively low cost. However, the expansion of cities will result in longer travel distances, which will consume more energy for travel.
This study found that the sub-center scenario may generate excessive traffic. One reason for this may be that the same spatial distribution of population is used for all scenarios (the output of the SILO/MATSim model). If the distribution of residential areas changes in line with the development of the sub-center, it is expected that the excess traffic will be reduced to some extent.
With the completion of the planned rail lines, the demand for urban railway is expected to increase significantly. Urban railways are faster than buses, and as the network expands, mobility within cities will be greatly enhanced. Therefore, there will be a modal shift from buses to rail along new urban rail lines. On the other hand, it is estimated that the demand for buses to reach railway stations from areas not served by railways will also increase. In this study, bus routes are fixed in all scenarios, but the reorganization of the bus network in conjunction with the development of railways may improve the convenience of public transportation in a wider area and contribute to reduce automobile use and road congestion. However, in the current situation in 2021, railway stations, trains, as well as buses are already very crowded during peak hours, and it is essential to increase the capacity by, for example, extending the length of trains. The sub-centers scenario will also have the effect of reducing the demand for railways in the city center, so there is a strong need to coordinate transportation policies with land development policies.
In the literature, the effects of transit and sub-center development have been analyzed. In Porto, it is estimated that the opening of the metro will reduce car travel by 2–3% for residents living near the stations [52]. In Beijing, it has been estimated that private car ownership will decrease by 6.6% to 7.7% among households living near subway stations [53]. However, this effect is only for those living near subway stations; in other words, the citywide impact is more modest. In our analysis, we find that the impact of the rail expansion is very marginal, ranging from a 0.15% to a 0.3% increase in trip share, due to the limited proportion of the population affected by the rail expansion.
A study that analyzed the impact of polycentricity on road congestion in about 90 Chinese cities showed that polycentric urban forms tend to reduce congestion. However, congestion worsens when the number of sub-centers increases to four or more, and it is estimated that polycentricity increases congestion in cities with a population of 6 million or more [45]. Other studies analyzing the effect of polycentricity on traffic congestion in Chinese cities have shown that polycentricity always has a significant effect on reducing congestion [54]. That study estimated the elasticity of congestion to polycentricity to be 0.687.
As discussed in Section 2, the impact of polycentricity depends on the configuration of the city. Our results show that the development of sub-centers does not significantly affect the average road speed of the entire urban area, but its impact varies spatially, as shown in Figure 6, Figure 7, Figure 8, Figure 9, Figure 10 and Figure 11. This suggests the need for more careful consideration in the integrated design of transportation and urban development.
In summary, we have shown that the expansion of urban railways and the development of employment sub-centers, as envisioned in this study, are not sufficient to alleviate traffic congestion in Bangkok, which is expected to become extremely severe in the future. However, spatially detailed analysis suggests that a combination of more sophisticated policy instruments, such as the linkage of sub-centers development with residential land development and the reorganization of the bus network in response to the rail network, can contribute to the alleviation of traffic congestion.
However, some items were not taken into account in this study, and there is room for improvement in the analysis. In this study, the spatial distribution of residential areas in 2050 is estimated by the integrated model SILO/MATSim. However, only road traffic is updated within the simulated period, and only the BAU scenario is given for the distribution of employees. For a more accurate assessment, we could estimate the location of the houses for each scenario. Additionally, the travel time estimated by MATSim could be fed back into the estimation of the modal share.
Another issue to consider is education-related traffic. In Bangkok, education-related traffic is experienced to have a significant impact on peak hour traffic. In the quest for better education, parents must take their young children to schools located far from their homes before going to work. In most cases, those schools are located in the suburbs. This is perceived as the major cause of traffic congestion. In this sense, simply changing the location of work does not directly help but creates excessive traffic. Our analysis implicitly assumes that these educational facilities will also be relocated in line with the development of the sub-center, but in practice, education-related mobility needs to be taken into account in the implementation of sub center policies.
In addition, the coordinates of the origin and destination are currently given randomly within the zone, but they could be set considering the distance from the transportation node, as addressed in the TOD concept. Urban policies also require evaluation from a more micro perspective, such as considering access transportation modes to stations. Consideration for the departure time shift to avoid congestion at peak hour [55] would also be valuable. It would also be useful to analyze the combination of these policies with other transportation policies, such as road pricing [56], park-and-ride [57], promotion of active travel modes [58], and travel demand management through education [59].
To overcome these limitations, detailed multimodal transport simulations in MATSim (such as the ones we ran for 2015 and 2050) should be performed during the intermediate years as well. More importantly, travel times and costs should be recalculated after the transport simulations and fed back into the housing relocation model of SILO. The results of this paper are valid to anticipate the effects of the scenarios, especially because they reflect the short-term transportation changes that may occur after implementing the scenarios. In addition, it should be noted that the results may not be completely accurate because the analysis was conducted under data limitations. Verifying the certainty of the results obtained by this method will also be a subject of future research.

Author Contributions

Conceptualization, M.K., V.V. and Y.H.; Data Curation, M.K. and V.V.; Formal Analysis, M.K., C.L., A.M. and R.M.; Funding Acquisition, M.K., V.V. and Y.H.; Methodology, M.K., V.V., C.L., A.M. and R.M.; Software, M.K., C.L., A.M. and R.M.; Supervision, M.K., V.V. and Y.H.; Validation, M.K., C.L., A.M. and R.M.; Writing—Original Draft, M.K., V.V., C.L. and R.M.; Writing—Review and Editing, M.K., V.V., R.M., C.L. and Y.H. All authors have read and agreed to the published version of the manuscript.

Funding

This research was funded by Science and Technology Research Partnership for Sustainable Development (SATREPS) (JST/JICA JPMJSA1704).

Institutional Review Board Statement

Not applicable.

Informed Consent Statement

Not applicable.

Data Availability Statement

Not applicable.

Acknowledgments

We thank The Office of Transport and Traffic Policy and planning Thailand and the National Statistical Office of Thailand for their kind provision of transportation and statistical data. This research is a part of Smart Transport Strategy for Thailand 4.0 project supported by the Japan Science and Technology Agency (JST) and the Japan International Coop-eration Agency (JICA).

Conflicts of Interest

The authors declare no conflict of interest. The funders had no role in the design of the study; in the collection, analyses, or interpretation of data; in the writing of the manuscript, or in the decision to publish the results.

References

  1. Dulal, H.B. Making cities resilient to climate change: Identifying “win–win” interventions. Local Environ. 2016, 22, 106–125. [Google Scholar] [CrossRef]
  2. United Nations. World Urbanization Prospects. The 2018 Revision; United Nations: New York, NY, USA, 2019. [Google Scholar]
  3. Toyota Mobility Foundation. Sathorn Model Summary Report; Chulalongkorn University: Bangkok, Thailand, 2017; Available online: https://drive.google.com/file/d/1cxOWsOAJQNZiNtjxeyp9BATVPvBN96Mj/view (accessed on 1 October 2021).
  4. Bhu-Anantanondh, N.; Kanyajit, S.; Suwannanon, A.; Sinloyma, P. Solving Bangkok’s Traffic Problems. Cosmop. Civ. Soc. Interdiscip. J. 2021, 13, 46–61. [Google Scholar] [CrossRef]
  5. Peungnumsai, A.; Miyazaki, H.; Witayangkurn, A.; Kim, S.M. A Grid-Based Spatial Analysis for Detecting Supply–Demand Gaps of Public Transports: A Case Study of the Bangkok Metropolitan Region. Sustainability 2020, 12, 382. [Google Scholar] [CrossRef]
  6. Office of Transport and Traffic Policy and Planning. Mass Rapid Transit Master Plan in Bangkok Metropolitan Region (M-Map); Ministry of Transport: Bangkok, Thailand, 2010.
  7. Kii, M. Projecting future populations of urban agglomerations around the world and through the 21st century. npj Urban Sustain. 2021, 1, 10. [Google Scholar] [CrossRef]
  8. Kasikorn Research Center. Impacts of Traffic Congestion on Bangkok’s Economy and Life (Current Issue No. 2771 Full Ed.). Available online: https://www.kasikornresearch.com/en/analysis/k-econ/economy/Pages/35760.aspx (accessed on 15 October 2021).
  9. Japan International Cooperation Agency (JICA). Data Collection Survey on The Development of Blueprint for the Second Mass Rapid Transit Master Plan (M-Map2) in The Kingdom of Thailand; Japan International Cooperation Agency; ALMEC Corp.; Oriental Consultants Global Co., Ltd.; Tokyo Metro Co., Ltd.; Creative Research and Planning Co., Ltd.: Bangkok, Thailand, 2019.
  10. Bangkok Metropolitan Administration. Draft Bangkok Comprehensive Plan: 4th Revision; Bangkok Metropolitan Administration: Bangkok, Thailand, 2019.
  11. Kanaroglou, P.S.; Higgins, C.D.; Chowdhury, T.A. Excess commuting: A critical review and comparative analysis of concepts, indices, and policy implications. J. Transp. Geogr. 2015, 44, 13–23. [Google Scholar] [CrossRef]
  12. Zhang, W.; Kockelman, K.M. Congestion pricing effects on firm and household location choices in monocentric and polycentric cities. Reg. Sci. Urban Econ. 2016, 58, 1–12. [Google Scholar] [CrossRef]
  13. Kii, M.; Nakanishi, H.; Nakamura, K.; Doi, K. Transportation and spatial development: An overview and a future direction. Transp. Policy 2016, 49, 148–158. [Google Scholar] [CrossRef]
  14. Ahmad, S.; de Oliveira, J.A.P. Determinants of urban mobility in India: Lessons for promoting sustainable and inclusive urban transportation in developing countries. Transp. Policy 2016, 50, 106–114. [Google Scholar] [CrossRef] [Green Version]
  15. Capurso, M.; Hess, S.; Dekker, T. Modelling the role of consideration of alternatives in mode choice: An application on the Rome-Milan corridor. Transp. Res. Part A Policy Pract. 2019, 129, 170–184. [Google Scholar] [CrossRef]
  16. Gao, Y.; Newman, P. Beijing’s Peak Car Transition: Hope for Emerging Cities in the 1.5 °C Agenda. Urban Plan. 2018, 3, 82–93. [Google Scholar] [CrossRef] [Green Version]
  17. Wasuntarasook, V.; Hayashi, Y. A Historic Review on Consequences of Critical Events Leading Revolution in Mass Rapid Transit in Bangkok. In Proceedings of the Eastern Asia Society for Transportation Studies, Taipei, Taiwan, 9–12 September 2013; Volume 9, pp. 9–12. [Google Scholar]
  18. Acheampong, R.A.; Silva, E. Land use–Transport interaction modeling: A review of the literature and future research directions. J. Transp. Land Use 2015, 8, 11–38. [Google Scholar] [CrossRef]
  19. Cools, M.; Fabbro, Y.; Bellemans, T. Free public transport: A socio-cognitive analysis. Transp. Res. Part A Policy Pract. 2016, 86, 96–107. [Google Scholar] [CrossRef] [Green Version]
  20. Fujii, S.; Kitamura, R. What does a one-month free bus ticket do to habitual drivers? An experimental analysis of habit and attitude change. Transportation 2003, 30, 81–95. [Google Scholar] [CrossRef]
  21. Hensher, D.A.; Stopher, P.; Bullock, P. Service quality––Developing a service quality index in the provision of commercial bus contracts. Transp. Res. Part A Policy Pract. 2003, 37, 499–517. [Google Scholar] [CrossRef]
  22. Kingham, S.; Dickinson, J.; Copsey, S. Travelling to work: Will people move out of their cars. Transp. Policy 2001, 8, 151–160. [Google Scholar] [CrossRef]
  23. Hess, D.; Yoh, A.; Iseki, H.; Taylor, B. Increasing Transit Ridership: A Survey of Successful Transit Systems in the 1990s. J. Public Transp. 2002, 5, 33–66. [Google Scholar] [CrossRef] [Green Version]
  24. Fiorio, C.V.; Percoco, M. Would You Stick to Using Your Car Even If Charged? Evidence from Trento, Italy. Transp. Rev. 2007, 27, 605–620. [Google Scholar] [CrossRef]
  25. Chen, C.; Varley, D.; Chen, J. What Affects Transit Ridership? A Dynamic Analysis involving Multiple Factors, Lags and Asymmetric Behaviour. Urban Stud. 2010, 48, 1893–1908. [Google Scholar] [CrossRef]
  26. Holmgren, J. Meta-analysis of public transport demand. Transp. Res. Part A Policy Pract. 2007, 41, 1021–1035. [Google Scholar] [CrossRef] [Green Version]
  27. Urbanek, A. Potential of modal shift from private cars to public transport: A survey on the commuters’ attitudes and willingness to switch—A case study of Silesia Province, Poland. Res. Transp. Econ. 2021, 85, 101008. [Google Scholar] [CrossRef]
  28. Redman, L.; Friman, M.; Gärling, T.; Hartig, T. Quality attributes of public transport that attract car users: A research review. Transp. Policy 2013, 25, 119–127. [Google Scholar] [CrossRef]
  29. Wegener, M. Overview of Land Use Transport Models. In Handbook of Transport Geography and Spatial Systems; Hensher, D.A., Button, K.J., Haynes, K.E., Stopher, P.R., Eds.; Emerald Group Publishing Limited: Bingley, UK, 2004; Volume 5, pp. 127–146. [Google Scholar]
  30. Hunt, J.D.; Kriger, D.S.; Miller, E.J. Current operational urban land-use–transport modelling frameworks: A review. Transp. Rev. 2005, 25, 329–376. [Google Scholar] [CrossRef]
  31. Iacono, M.; Levinson, D.; El-Geneidy, A. Models of Transportation and Land Use Change: A Guide to the Territory. J. Plan. Lit. 2008, 22, 323–340. [Google Scholar] [CrossRef]
  32. Fujita, M.; Ogawa, H. Multiple equilibria and structural transition of non-monocentric urban configurations. Reg. Sci. Urban Econ. 1982, 12, 161–196. [Google Scholar] [CrossRef]
  33. Lucas, R.E.; Rossi-Hansberg, E. On the Internal Structure of Cities. Econometrica 2002, 70, 1445–1476. [Google Scholar] [CrossRef]
  34. Huang, H.-J.; Xia, T.; Tian, Q.; Liu, T.-L.; Wang, C.; Li, D. Transportation issues in developing China’s urban agglomerations. Transp. Policy 2020, 85, A1–A22. [Google Scholar] [CrossRef]
  35. Kloosterman, R.C.; Lambregts, B. Clustering of Economic Activities in Polycentric Urban Regions: The Case of the Randstad. Urban Stud. 2001, 38, 717–732. [Google Scholar] [CrossRef]
  36. Xu, S.-X.; Liu, T.-L.; Huang, H.-J.; Wang, D.Z.W. Optimizing the number of employment subcenters to decentralize a congested city. Reg. Sci. Urban Econ. 2021, 90, 103699. [Google Scholar] [CrossRef]
  37. Giuliano, G.; Small, K.A. Is the Journey to Work Explained by Urban Structure? Urban Stud. 2016, 30, 1485–1500. [Google Scholar] [CrossRef] [Green Version]
  38. Gordon, P.; Richardson, H.W. Are Compact Cities a Desirable Planning Goal? J. Am. Plan. Assoc. 1997, 63, 95–106. [Google Scholar] [CrossRef]
  39. Gordon, P.; Wong, H.L. The Costs of Urban Sprawl: Some New Evidence. Environ. Plan. A Econ. Space 1985, 17, 661–666. [Google Scholar] [CrossRef]
  40. Levinson, D.M.; Kumar, A. The Rational Locator: Why Travel Times Have Remained Stable. J. Am. Plan. Assoc. 1994, 60, 319–332. [Google Scholar] [CrossRef]
  41. Ewing, R.; Tian, G.; Lyons, T. Does compact development increase or reduce traffic congestion? Cities 2018, 72, 94–101. [Google Scholar] [CrossRef] [Green Version]
  42. Ewing, R. Is Los Angeles-Style Sprawl Desirable? J. Am. Plan. Assoc. 1997, 63, 107–126. [Google Scholar] [CrossRef]
  43. Næss, P. Accessibility, Activity Participation and Location of Activities: Exploring the Links between Residential Location and Travel Behaviour. Urban Stud. 2016, 43, 627–652. [Google Scholar] [CrossRef]
  44. Susilo, Y.O.; Maat, K. The influence of built environment to the trends in commuting journeys in the Netherlands. Transportation 2007, 34, 589–609. [Google Scholar] [CrossRef]
  45. Li, Y.; Xiong, W.; Wang, X. Does polycentric and compact development alleviate urban traffic congestion? A case study of 98 Chinese cities. Cities 2019, 88, 100–111. [Google Scholar] [CrossRef]
  46. Kii, M.; Goda, Y.; Vichiensan, V.; Miyazaki, H.; Moeckel, R. Assessment of Spatiotemporal Peak Shift of Intra-Urban Transportation Taking a Case in Bangkok, Thailand. Sustainability 2021, 13, 6777. [Google Scholar] [CrossRef]
  47. Moeckel, R. Constraints in household relocation: Modeling land-use/transport interactions that respect time and monetary budgets. J. Transp. Land Use 2016, 10, 1. [Google Scholar] [CrossRef] [Green Version]
  48. Horni, A.; Nagel, K.; Axhausen, K.W. (Eds.) The Multi-Agent Transport Simulation MATSim; Ubiquity Press: London, UK, 2016; License: CC-BY 4.0. [Google Scholar] [CrossRef]
  49. Wegener, M. Operational urban models. J. Am. Plan. Assoc. 1994, 60, 17–29. [Google Scholar] [CrossRef]
  50. Kii, M.; Goda, Y.; Tamaki, T.; Suzuki, T. Evaluating Public Transit Reforms for Shrinking and Aging Populations: The Case of Takamatsu, Japan. Future Transp. 2021, 1, 486–504. [Google Scholar] [CrossRef]
  51. Llorca, C.; Moeckel, R. Effects of scaling down the population for agent-based traffic simulations. Procedia Comput. Sci. 2019, 151, 782–787. [Google Scholar] [CrossRef]
  52. Ibraeva, A.; Van Wee, B.; Correia, G.H.D.A.; Antunes, A.P. Longitudinal macro-analysis of car-use changes resulting from a TOD-type project: The case of Metro do Porto (Portugal). J. Transp. Geogr. 2021, 92, 103036. [Google Scholar] [CrossRef]
  53. Zhang, Y.; Zheng, S.; Sun, C.; Wang, R. Does subway proximity discourage automobility? Evidence from Beijing. Transp. Res. Part D Transp. Environ. 2017, 52, 506–517. [Google Scholar] [CrossRef]
  54. Li, X.; Mou, Y.; Wang, H.; Yin, C.; He, Q. How Does Polycentric Urban Form Affect Urban Commuting? Quantitative Measurement Using Geographical Big Data of 100 Cities in China. Sustainability 2018, 10, 4566. [Google Scholar] [CrossRef] [Green Version]
  55. Achariyaviriya, W.; Hayashi, Y.; Takeshita, H.; Kii, M.; Vichiensan, V.; Theeramunkong, T. Can Space–Time Shifting of Activities and Travels Mitigate Hyper-Congestion in an Emerging Megacity, Bangkok? Effects on Quality of Life and CO2 Emission. Sustainability 2021, 13, 6547. [Google Scholar] [CrossRef]
  56. Santos, G.; Fraser, G. Road pricing: Lessons from London. Econ. Policy 2006, 21, 264–310. [Google Scholar] [CrossRef]
  57. Marshall, S.; Banister, D. Travel reduction strategies: Intentions and outcomes. Transp. Res. Part A Policy Pract. 2000, 34, 321–338. [Google Scholar] [CrossRef]
  58. Shannon, T.; Giles-Corti, B.; Pikora, T.; Bulsara, M.; Shilton, T.; Bull, F. Active commuting in a university setting: Assessing commuting habits and potential for modal change. Transp. Policy 2006, 13, 240–253. [Google Scholar] [CrossRef]
  59. Banister, D. The sustainable mobility paradigm. Transp. Policy 2008, 15, 73–80. [Google Scholar] [CrossRef]
Figure 1. Thailand, Bangkok, and five provinces (reproduced from Reference [46]).
Sustainability 13 13196 g001
Figure 2. Population, railway and sub-centers scenario: (a) population scenario till 2050 (black solid line: observation, blue dashed line: scenario projection); (b) railway and sub-centers scenario (green line: urban railway network circa 2015, yellow line: proposed railway line in M-Map2, blue zones: assumed sub-centers based on traffic-analysis zones).
Sustainability 13 13196 g002
Figure 3. Job densities by traffic analysis zone: (a) in 2015; (b) business as usual scenario ion 2050; (c) sub-center scenario in 2050.
Sustainability 13 13196 g003
Figure 4. Population by age and gender for 2015 observation and 2050 estimation.
Sustainability 13 13196 g004
Figure 5. Population density of TAZ: (a) 2015; (b) 2050.
Sustainability 13 13196 g005
Figure 6. Spatial distribution of car travel time difference from current network/BAU scenario by departure zones: (a,b) current network/sub-center scenario; (c,d) future network/BAU scenario; (e,f) future network/sub-center scenario. (b,d,f) Magnifications of the center area of (a,c,e), respectively.
Sustainability 13 13196 g006
Figure 7. Spatial distribution of car travel time difference from current network/BAU scenario by destination zones: (a,b) current network/sub-center scenario; (c,d) future network/BAU scenario; (e,f) future network/sub-center scenario. (b,d,f) Magnifications of the center area of (a,c,e), respectively.
Sustainability 13 13196 g007
Figure 8. Spatial distribution of public transport travel time difference from current network/BAU scenario by departure zones: (a,b) current network/sub-center scenario; (c,d) future network/BAU scenario; (e,f) future network/sub-center scenario. (b,d,f) Magnifications of the center area of (a,c,e), respectively.
Sustainability 13 13196 g008
Figure 9. Spatial distribution of public transport travel time difference from current network/BAU scenario by destination zones: (a,b) current network/sub-center scenario; (c,d) future network/BAU scenario; (e,f) future network/sub-center scenario. (b,d,f) Magnifications of the center area of (a,c,e), respectively.
Sustainability 13 13196 g009
Figure 10. Car traffic difference from current network/BAU scenario: (a,b) current network/sub-center scenario; (c,d) future network/BAU scenario; (e,f) future network/sub-center scenario. (b,d,f) Magnifications of the center area of (a,c,e), respectively.
Sustainability 13 13196 g010
Figure 11. Public transport link demand and urban railway demand difference between scenarios: (a,c) current network/BAU scenario; (b,d) future network/BAU scenario; (e,f) demand difference between BAU scenario and sub-center scenario under current network and future network respectively. (c,d) Magnifications of the center area of (a,b), respectively.
Sustainability 13 13196 g011
Table 1. Data used in this study (reproduced from Reference [46]).
NameProviderDescription
Household Travel Survey (HTS)The Office of Transport and Traffic Policy and planning (OTP)Travel survey data of 18,833 households accounting for 38,054 people conducted in 2017
Traffic analysis zone (TAZ)846 zones
Public transportGTFS data for rail lines, bus routes, and ferry (2019)
Population and householdNational Statistical OfficeNumber of population and household (2010)
EmploymentNumber of employment (2014)
PopulationMapFan DB Data ModelPopulation estimates of subdistrict by age and gender (2017)
Road networkRoad link attributes (2018)
Table 2. Transportation indicators in 2015 and 2050.
20152050
Current NetworkFuture Network
BAUSub-CenterBAUSub-Center
CarNumber of trips
(million trips/day)
17.525.225.325.225.3
total travel length
(million km/day)
327458459464465
average travel distance
(km)
18.618.118.118.418.4
average travel time
(minutes)
46109104114110
average travel speed
(km/h)
2410101010
Public transportNumber of trips
(million trips/day)
6.09.49.49.59.5
total travel length
(million km/day)
5787899596
average travel distance
(km)
9.49.29.510.010.1
average travel time
(minutes)
6663656263
average travel speed
(km/h)
9991010
Publisher’s Note: MDPI stays neutral with regard to jurisdictional claims in published maps and institutional affiliations.

