Article

Impact of the Mobility Restrictions in the Palestinian Territory on the Population and the Environment

Civil and Geo-Environmental Engineering Laboratory (LGCgE), Lille University, Rue Paul Duez, 59000 Lille, France
*
Author to whom correspondence should be addressed.
Sustainability 2021, 13(23), 13457; https://doi.org/10.3390/su132313457
Submission received: 27 September 2021 / Revised: 23 November 2021 / Accepted: 2 December 2021 / Published: 5 December 2021

Abstract

:
This paper analyzes the mobility restrictions in the Palestinian territory on the population and the environment. The literature review shows a scientific concern for this issue, with an emphasis on describing mobility barriers and the severe conditions experienced by the population due to these barriers as well as the impact of mobility restrictions on employment opportunities. On the other hand, the literature review also shows a deficit in quantitative analysis of the effects of mobility restrictions on the environment, particularly on energy consumption and greenhouse gas emissions. This paper aims to fill this gap through a quantitative analysis by including data collection about mobility restrictions, using network analysis to determine the impact of these restrictions on inter-urban mobility, and analysis of the resulting energy consumption and CO2 emissions. The results show that mobility restrictions induce a general increase in energy consumption and CO2 emissions. The average value of this increase is about 358% for diesel vehicles and 275% for gasoline vehicles.

1. Introduction

This paper aims to evaluate the impact of inter-urban mobility restrictions on the Palestinian territory’s population and environment. It considers two kinds of mobility restrictions: (i) the construction of the separation wall, which resulted in road closure, and (ii) checkpoints, which cause serious disturbances in inter-urban mobility. These restrictions started around thirty years ago with the installation of permanent or temporary checkpoints [1,2,3,4,5,6,7] and the construction of a separation wall [1,2,3,4,5,8]. They caused severe disturbances in the daily life of the population, with such adverse effects as anxiety, increased physical risk, time losses, and decreased employment opportunities. They also induced a significant increase in transport route distance and time, resulting in higher energy consumption and greenhouse gas emissions. Evaluating the impact of the mobility restrictions on the population and the environment constitutes the first step of a tentative attempt to find solutions and reduce the adverse effects of these restrictions. This begins with developing awareness on the part of the population, the authorities, and the international community about the harmful impact of the restrictions. It also includes developing digital tools that provide shared real-time information that could help attenuate the impact on the population and environment.
Several scholars and international institutions have described the mobility restrictions in the Palestinian territories and analyzed their impact on the population. The World Bank has published a notebook [9] exploring the historical events and facts of the evolving mobility restrictions in the Palestinian territories, using a narrative approach. The notebook states that the physical mobility barriers have fragmented the West Bank territory into disconnected cantons. Moreover, they stifle economic activity by raising the cost of doing business and increasing uncertainty. The International Monetary Fund (IMF) [10] and the United Nations Conference on Trade and Development and (UNCTAD) [11] confirmed the impact of these barriers on economic activity. Both studies used a macroeconomic indicator-based approach and time-series data to analyze the impact of the barriers on macroeconomic performance, the labor market, and fiscal balance.
Braverman [2] argued that barriers and walls in the Palestinian territory complicate a straightforward physical task by preventing population movement. He reported that the intensified use of technology at checkpoints to control commuters dehumanized the local Palestinian community. Boussauw and Vanin [12] indicated that the mobility restrictions in the Palestinian territory created a closed social system, with adverse consequences for economic and cultural exchange. Cali and Miaari [7] analyzed the impact of mobility restrictions on employment. They showed that checkpoints reduced the employment opportunity, the number of working days, and working wages. For example, installing a checkpoint ten minutes from a Palestinian locality reduced employment opportunity and the working days by 0.14 and 0.22 percentage points, respectively. Rijke and Minca [4] made a deep analysis of daily life at a checkpoint. They highlighted the long queues and the arbitrary implementation of rules in a way that was humiliating and at times, violent towards the population. They argued that checkpoints create new political geographies, with a regime of mobility uncertainty and arbitrariness due to travel time delays.
Other scholars analyzed the impact of the mobility restrictions on different areas in the world. For example, Barka [13] reported that border crossings and checkpoints in West Africa caused waiting times for trucks ranging from 18 min to 29 min per 100 km. Hence, the cost of trading sectors in Africa is doubled compared with Asian regional trade. In addition, Reyna et al. [14] analyzed the environmental impact of mobility restrictions at the border crossing between Mexico and the United States. They showed that the highest-congestion scenario could increase by as much as 200% in vehicle volume, 460% in PM2.5 and NOx emissions, and 540% in GHGs emissions.
According to the literature review, previous researchers have focused on analyzing and quantifying the economic and social cost of the mobility restrictions in the Palestinian territories, while the environmental impact is less considered. This paper aims to fill this gap through a quantitative analysis of the impact of mobility restrictions on the environment. It contributes to this issue through research which combines (i) the collection of data on the mobility restrictions and their integration into a GIS system,; (ii) the use of network analysis to investigate the impact of the separation wall and checkpoints on route length and transport time [15]; and (iii) evaluating the impact of the mobility restrictions on energy consumption and CO2 emissions. The latter constitutes a critical environmental issue for the Palestinian territory, as the transportation sector accounts for around 72% of its CO2 emissions [16]. This paper paves the way for a methodology that can help scan the spatial and temporal adversity of the mobility restrictions and develop digital tools that will provide real-time information to attenuate the impact of these restrictions on both the population and the environment.
The paper is organized as follows: the first section outlines the methodology and material used in this research; the second section presents and discusses the application of the research methodology to the Palestinian territory; finally, the last section summarizes the primary outcomes of this research and outlines its limitation and perspectives.

2. Materials and Methods

2.1. Overview

Our evaluation of the impact of mobility restrictions on the population and the environment was based on a scientific methodology that can be reproduced and applied to other kinds of mobility restrictions, such as those related to natural or man-made disasters. The methodology includes the following three phases.
The first phase concerns data collection about the inter-urban mobility infrastructure and restrictions. Data was collected from different sources, mainly from governmental authorities and non-governmental organizations (NGOs). In the future, this could be extended to social media and mobile crowdsourcing.
The second phase uses network analysis to determine the best route [14] under two conditions: the absence of mobility restrictions and the presence of those restrictions.
The last phase analyses the impact of the mobility restrictions on (i) the population, with a focus on increases in route length and travel time, and (ii) the environment, with emphasis on the additional energy consumption and greenhouse gas emissions.
The following sections will present this methodology in detail through its application to the Palestinian territory.

2.2. Data Collection

This research was based on data related to physical infrastructure, community mobility, and mobility restrictions. The collected data were integrated into a Geographic Information System (GIS) that provided a spatial illustration to support analysis of the mobility restrictions. 
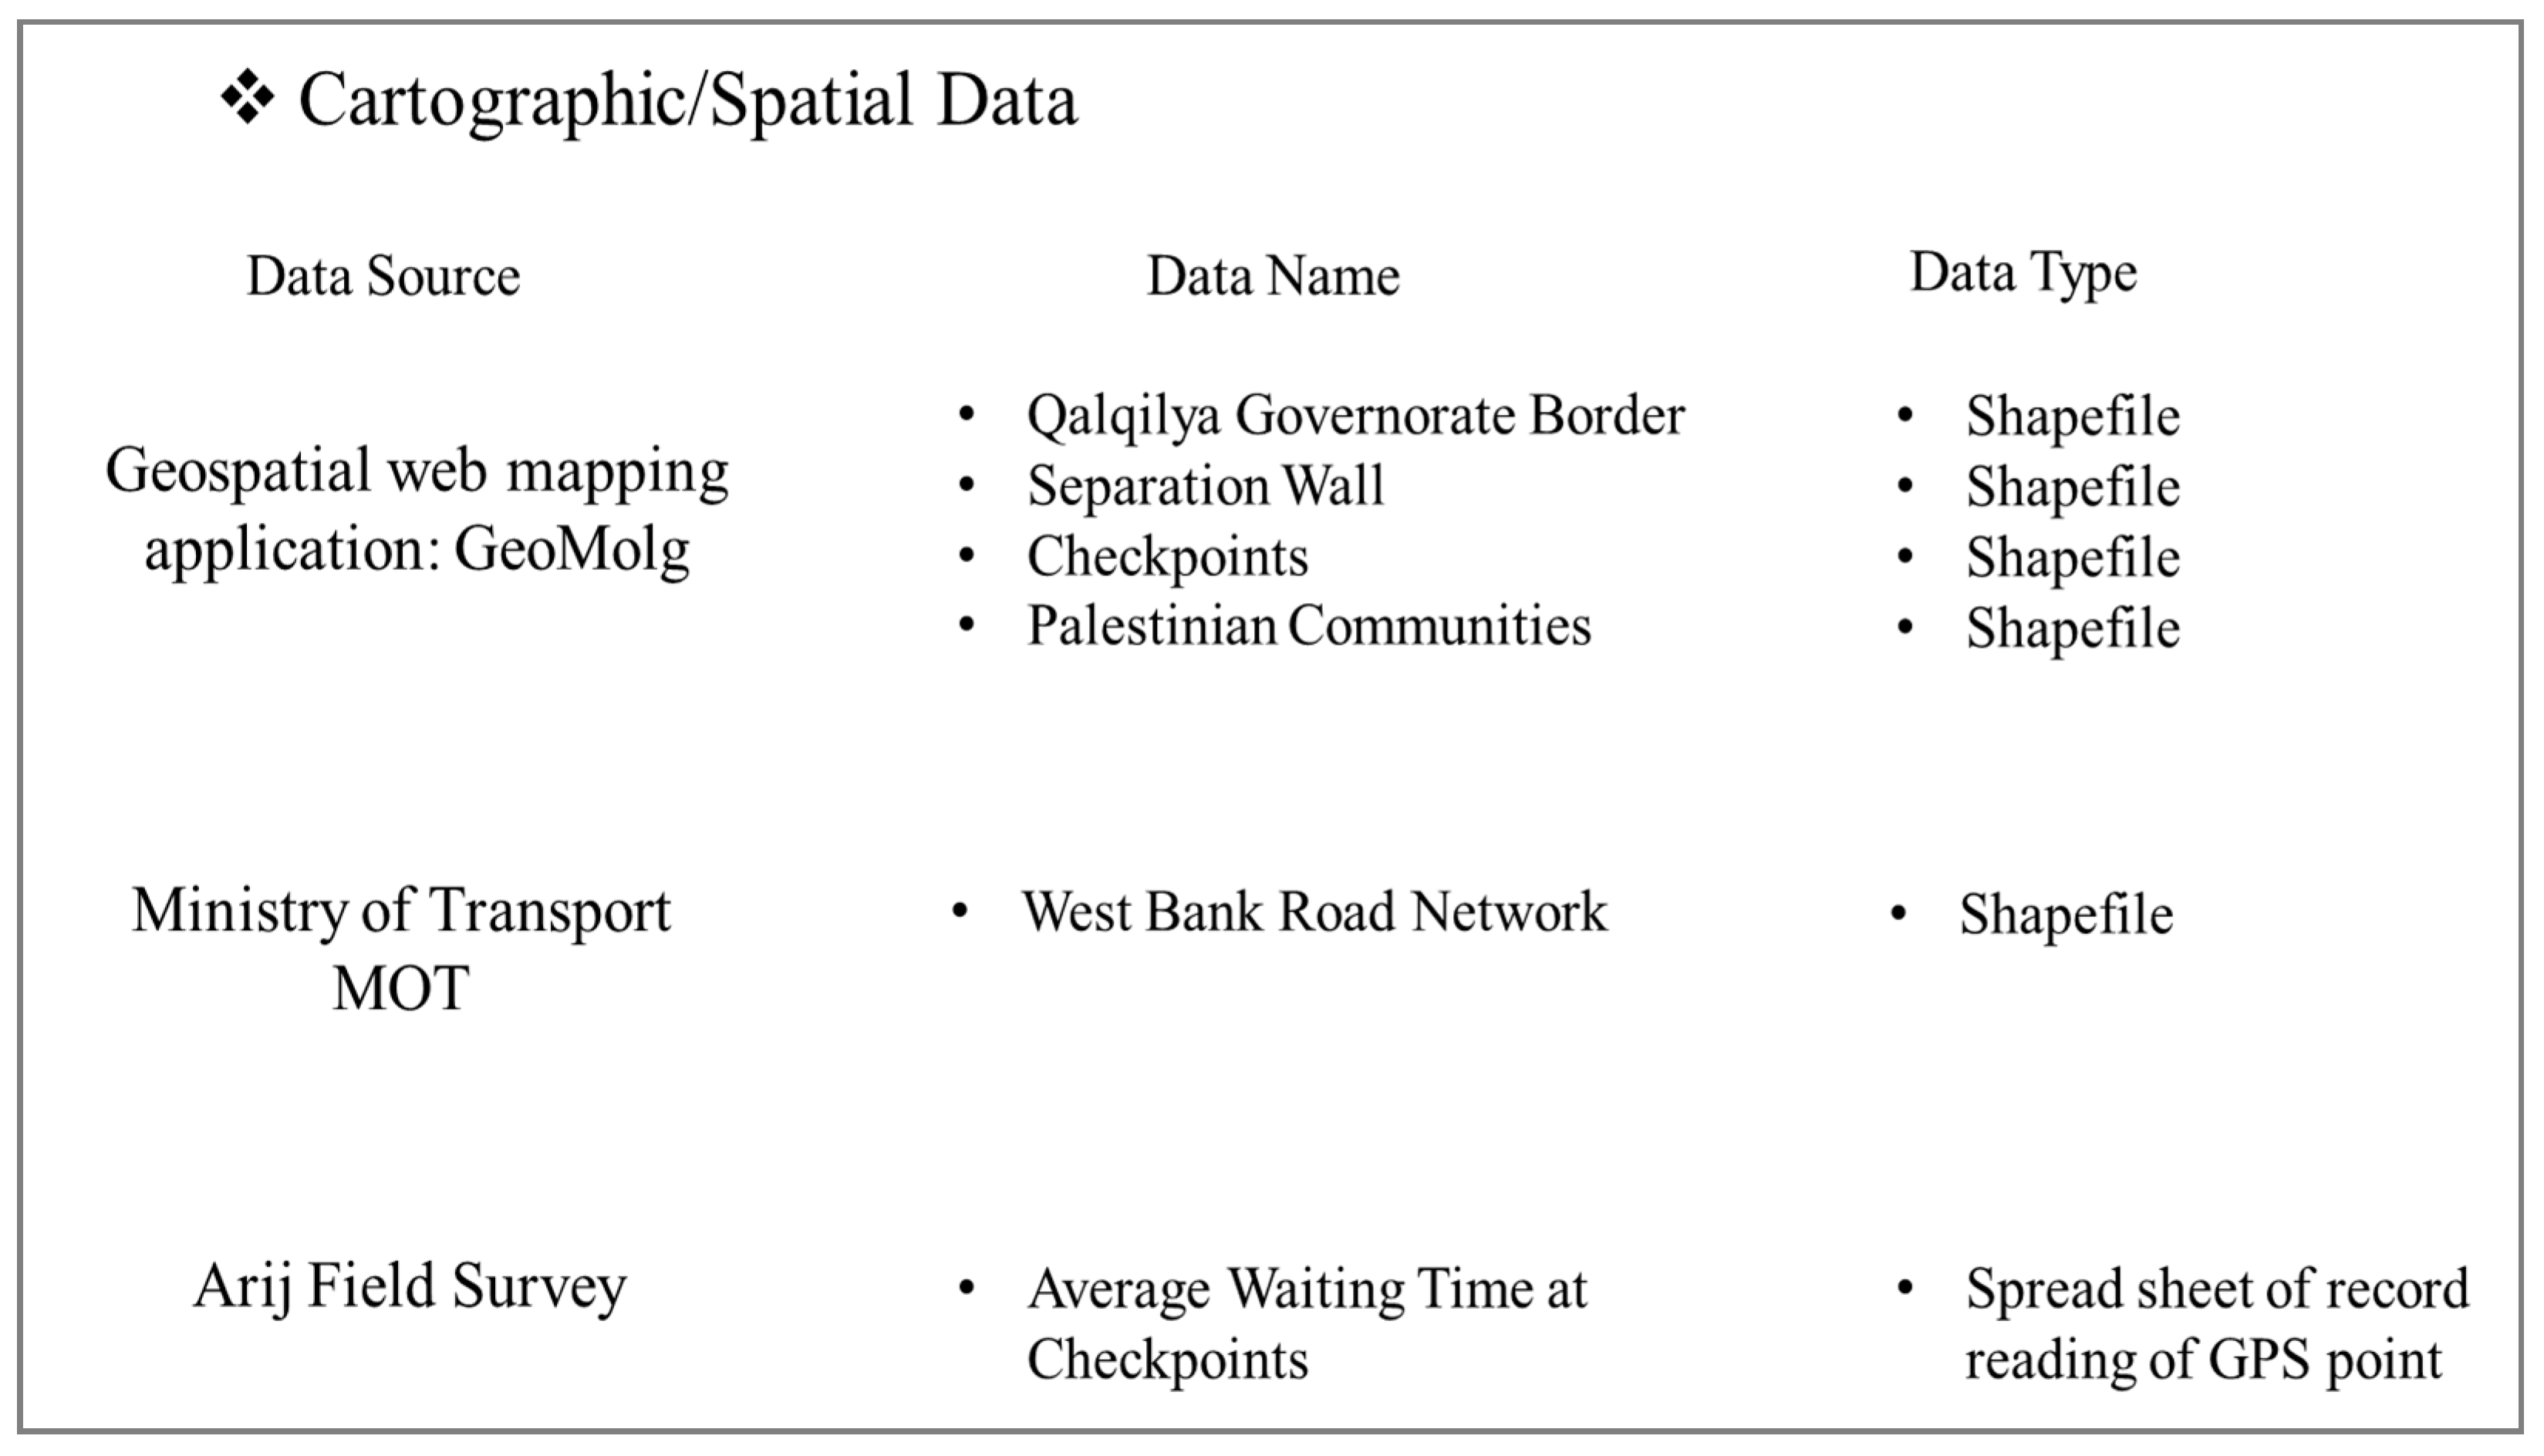
Figure 1 summarizes the types and sources of data collected. Road network data were obtained from the last updated version of the 2018 geodatabase of the Palestinian ministry of transport (MOT). The data came in a shapefile with categories including road name, number, width, and type. Mobility restriction data, including the separation wall and checkpoints, were obtained from the Geospatial web mapping application of the ministry of local government (Geomolg) [17]. Geomolg is an open-source application that provides the ability to downloading the target layer in the form of a shapefile for any location.
Due to the lack of data on community commuting, individual vehicular emissions, and waiting time due to mobility restrictions, the study used data from a field survey conducted by the Applied Research Institute-Jerusalem (ARIJ) [18]. The survey concerned checkpoints distributed in different locations in the West Bank. It employed 70 vehicles (cars, taxis, buses, and trucks) with tracking devices (GPS) for a period of 6 months (January–July 2018). More than 18 million records were registered. Table 1 summarizes the average delay time recorded in this survey at the main checkpoints in the Palestinian territory. The delay ranges from 23 to 89 min, with an average value of 49.5 min. This research was conducted with the average values, which constitute a limitation for this research. In the future, mobility data could be enhanced using crowdsourcing, including social media and mobile applications [19,20].
Most data were obtained in shapefile format in the shape of polygon or line, which includes attributes labeled in different fields (Table 2). All the shapefiles have two common fields: (i) ObjectID, a unique, non-null integer field used to identify rows in tables in a shapefile, and (ii) Shape Length, which is used to store the calculated geometry of lines or polylines lengths. For example, in the attribute of polygon data (Qalqilya governorate border and Palestinian communities), a table called “Shape Area” stores the calculated geometry of the polygon area.
The shapefile for the Palestinian communities also has the “Community Name” attribute. The separation wall shapefile includes the attribute of the “Status” of the wall (constructed, under construction, and planned). The WB Road network shapefile contains an attribute “Status” of the road segment, either paved or unpaved, and “Road Type”, to define the classification of the road network (local, regional, main, internal, and settlement).
The collected data then needed to be prepared. This phase consisted of three steps: (i) the creation of a geodatabase; (ii) the construction of the network topology; and (iii) building the network dataset.
  • Creation of Geo-database
A geo-database is the native data structure used in ArcGIS and is the primary data format used to edit and manage the data. A Geodatabase can be a personal, file, or enterprise [15]. A personal Geo-database was created using ArcGIS 10.1, which operates a database that can store, query, and manage spatial and non-spatial data and contains data on the separation wall, road network, and communities.
  • Building Network Topology
For accurate analysis, it is necessary to build a topology of the road network to discover errors in the data and correct them. This was performed by applying topology rules in order to ensure that there were no dangles in the road network, and that the roads did not intersect or overlap.
  • Building Network Dataset
Creating the road network dataset required a geodatabase containing a line feature class stored in a feature dataset. The network dataset consisted of the set of edges representing the links over which agents travel and the set of junctions which connect those edges and facilitate navigation from one edge to another.

2.3. Network Analysis: Best Route Analysis

The best route can be the quickest, shortest, or most scenic route [15]. For example, if the impedance is time, then the best route is the fastest route. Hence, the best route can be defined as the route that has the lowest impedance. In this research, the impedance is the distance, so the best route is the shortest route.
Different methods have been proposed to analyze the impact of natural or man-made events on urban mobility. For example, Huang [21] used a hazard graph model to study the spatial pattern of flood impact on urban mobility performance using space syntax theory. Ghandour et al. [22] provided a visual analysis of safety hazards on the roads network in Lebanon using spatial autocorrelation and spatial clustering theories such as the Global G method, Getis–Ord, and Hot Spot Analysis. Ahmed [15] used network analysis to identify the best route from an incident to any healthcare service providers in the Greater Cairo metropolitan area. Other models have used time-series data to predict future hazard trends on road networks. For example, [23] employed the Autoregressive Integrated Moving Average (ARIMA) model to explain and predict the trend of traffic crashes in Palestine. Finally, Dsca et al. [24] used Dijkstra’s algorithm and the Global Positioning System (GPS) to determine the accumulated cost between any two nodes of a road network. Since this method is simple and well adapted to existing data, it was used in this research. This method has been used recently by [25] to find the shortest path for tsunami evacuation. [26] highlighted the capacity of Dijkstra’s develop an algorithm to find the shortest route from a given vertex to any other vertex. Based on previous research findings [24,25,26], Dijkstra’s algorithm was used in this research because of its simplicity and ability to find the shortest route between any two locations in the Palestinian territory.

2.4. Impact of the Mobility Restrictions on Travel Time and Delay

The impact of the separation wall on the mobility between two vertexes was estimated using the difference between the route in the presence of the wall (DW) and the route without the wall (D0). The increases in the route length (IDW) and in the transport time (TDW) due to the wall were calculated as follows:
IDW = DW − D0
TDW = IDW/AvS
where AvS denotes the average traffic speed.
Checkpoints have different forms: permanent checkpoints, partial checkpoints, road gates, earth mounds, road barriers, and controlled tunnels. The time delay due to checkpoints (TDCP) was obtained from [18]. Table 1 summarizes the average values of this delay at the main Checkpoints in the Palestinian territory.

2.5. Impact of the Mobility Restrictions on the Population and the Environment

The additional travel time due to the mobility restrictions (TDtota) is equal to the sum of the time delay due to the wall (TDW) and that due to the checkpoints (TDCP):
TDtotal = TDW + TDCP
The impact on the environment concerns both energy consumption and greenhouse gas emissions. The determination of the additional energy consumption due to the separation wall (EW) was carried out as follows:
E W = i = 1 n ID Wi · ECm i  
where n designates the number of vehicles concerned by the separation wall, IDwi is the additional distance of vehicle i due to the separation wall (Equation (2)), and ECmi denotes the energy consumption per km of vehicle i.
The calculation of the energy consumption due to the checkpoints (ECP) was carried out using (Equation (5)):
E CP = i = 1 n TD CPi · ECs i  
where TDCP is the time delay at the checkpoint and ECs is the rate of energy consumption of idle or slowly moving vehicles.
The CO2 emissions due to the separation wall (CO2W) and to the checkpoints (CO2CP) were determined from the related energy consumptions as follows:
CO 2W = i = 1 n ID Wi · EC mi   ·   CO 2 F i
CO 2CP = i = 1 n D CPi · EC si   ·   CO 2 Fi
where CO2Fi is the CO2 emission factor of vehicle i, which depends on the type and energy use of the vehicle.

3. Results and Discussion

3.1. Presentation of the Case Study

The methodology presented in Section 2 was applied to the Qalqilya governorate in Palestine, which covers a total land area of 166 km2 with about 121,671 inhabitants [27,28]. According to the Palestinian Central Bureau of Statistics, this governorate has around 5752 gasoline vehicles and 7320 diesel vehicles [29]. The city of Qalqilya is the economic and administrative hub of this governorate. It is encircled by the separation wall, which constitutes a physical barrier between the city and other localities of the governorate, as illustrated in Figure 2.
According to a recent report of the Palestinian Central Bureau of Statistics and the Ministry of Transport [29], the Qalqilya governorate has around 2927 gasoline vehicles and 3717 diesel vehicles, consisting of 76.6% private cars, 15.4% trucks and commercial cars, and 5% taxis.
The Qalqilya governate suffers from about 40 checkpoints, including three earth mounds, five closed road gates, fourteen agricultural gates, one roadblock, three partial checkpoints, five tunnel checkpoints, and five watchtowers [17,18]. Figure 2 shows the localization of these checkpoints. This study focused on the Jaljoulia permanent checkpoint, which is located at the entrance of Qalqilya city. It concerns the mobility of people working in areas beyond this checkpoint and the urban center services for people living in the surrounding localities.

3.2. Impact of Mobility Restrictions on Route Length and Travel Time

3.2.1. Impact of the Separation Wall

The methodology presented in Section 2 was used to determine the best route between Qalqilya and other localities with and without the separation wall. Figure 3 shows the shortest paths determined without (Black line) and with (Green line) the separation wall. This indicates that the wall causes an increase in the length of the travel route.
Table 3 summarizes the impact of the separation wall on the length of the best route between the city of Qalqilya and 12 localities. It shows that the wall increases the route length for all localities by a distance which varies between 3.3 km (Jayyus) and 19.5 km (Ras at Tira). The average increase in the length of the traveling route is 9.2 km, compared to the average total length without the wall, which is 7.7 km.
Table 4 summarizes the impact of the separation wall on the travel time between Qalqilya city and other localities. The calculation was conducted with an average traffic speed of 50 km/h [30]. It can be observed that the wall increases the travel time for all the localities. The additional travel time varies from 4.0 min (Jayyus) to 23.4 min (Ras at Tira), with an average value of 11.1 min compared to the average transport time without the wall, which is 9.3 min.

3.2.2. Impact of the Checkpoints

According to [18], the time delay at the main checkpoint in the Qalqilya (TDCP) governate is 89 min. Table 5 provides the ratio between travel time with the checkpoint (TCP) and without the checkpoint (T0) for all the localities. This ratio varies from 5.7 (Kafr Kaddum) to 21.7 (Ras at Tira), with an average value of 12.3.
Table 6 provides the impact of the total mobility restrictions on travel time between Qalqilya city and other localities. It shows that the checkpoints account for a significant part of travel delays. It also shows that mobility restrictions lead to a substantial increase in travel time. The ratio between the travel time with mobility restrictions (TMR) and the travel time without mobility restrictions is between 5.93 (Kafr Qaddum) and 27.01 (Ras at Tira), with an average value of 14.08. The dramatic increase in travel time due to the mobility restrictions disturbs inhabitants’ mobility and access to work and health, educational, and social services. It also causes economic losses related to time loss and rise in fuel consumption.

3.3. Impact of the Mobility Restrictions on the Environment

This section presents the effects of the mobility restrictions on the environment, focusing on energy consumption and CO2 emissions.

3.3.1. Impact on Energy Consumption

The influence of the wall on energy consumption (Ew) is determined by Equation (4), using the increase in the travel distance due to the wall (IDW) (Table 3) and the average energy consumptions of gasoline and diesel vehicle in Palestine [31] (Table 7).
The energy consumption due to a checkpoint (ECP) was determined assuming that the vehicle consumes energy during 30% of the delay time at the checkpoint (TDCP = 89 min), and the average energy consumption of idle or slowly moving vehicles (Table 7) [32,33]. According to (Equation (5)), ECP = 0.8811 L.
Table 8 provides, for all of the different localities, the energy consumption of a gasoline vehicle with the wall and the checkpoint (Etotal), including the energy consumption without the wall (E0), and due to both the wall (EW) and the checkpoint (ECP). It shows that the increase in energy consumption due to the wall varies between 0.42 L (Jayyus) and 2.51 L (Ras at Tira), with an average value of 1.19 L, be compared with the average value of without the wall (E0 = 0.99 L). The ratio between the energy consumption with the wall and the checkpoint (Ttotal) to the energy consumption without mobility restrictions (E0) varies between 1.67 (Kafr Qaddum) and 8.31 (Ras at Tira), with an average value of 3.75. These results show that the mobility restrictions have a significant influence on energy consumption, which results in a substantial increase in both CO2 emissions and energy expenses for inhabitants.
Table 9 summarizes the impact of the mobility restrictions on the energy consumptions of a diesel vehicle. The energy consumption due to the checkpoint (ECP) was evaluated following the method presented in the previous section, giving ECP = 1.3083 L. These results show that the environmental impact of mobility restrictions is higher for diesel vehicles than for gasoline vehicles. The ratio between the energy consumption with the wall and the checkpoint (Ttoal) to the energy consumption without mobility restrictions (E0) varies between 2.01 (1.67 for the gasoline vehicle) and 9.81 (8.31 for the gasoline vehicles), with an average value of 4.58 (3.75 for the gasoline vehicles).

3.3.2. Impact of Mobility Restrictions on CO2 Emissions

This section will focus on CO2 emissions, as they constitute vehicles’ primary greenhouse gas emission. CO2 emissions due to the wall (CO2W) were determined using Equation (6), with the energy consumptions presented in Table 8 and Table 9 and the CO2 emissions factors used by [31] (Table 10). The CO2 emissions due to Jaljoulia checkpoint were determined using the energy consumption related to this checkpoint as defined in the previous section and the CO2 emissions factors in Table 10. Calculation using Equation (7) gave CO2CP = 2.289 and 3.877 kg CO2 for gasoline and diesel vehicles, respectively.
Table 11 summarizes the impact of the mobility restrictions on the CO2 emissions of a gasoline vehicle. It shows that the mobility restrictions cause a significant increase in CO2 emissions, which varies between 67% (Kafr Qaddum) and 731% (Ras at Tira), with an average value of 275%.
Table 12 summarizes the results obtained for diesel vehicles. It shows that the impact of the mobility restrictions on the CO2 emissions of a diesel vehicle is greater than that of a gasoline vehicle. The increase in CO2 emissions of a diesel vehicle due to the mobility restrictions varies between 101% (67% for the gasoline vehicle) and 881% (731% for the gasoline vehicle), with an average value of 358% (275% for the gasoline vehicle).

4. Conclusions

This paper has presented a quantitative analysis of the impact of the mobility restrictions in the Palestinian territory on both the population and the environment. The research was conducted for two types of mobility barriers: the separation wall and checkpoints. These physical barriers have fragmented the Palestinian territory into disconnected cantons. They result in a significant increase in the time and distance required for inter-urban transport, and consequently in energy consumption and CO2 emissions.
Research conducted with data on the Qalqilya governorate showed that the ratio between the travel time with mobility restrictions and without mobility restrictions was between 5.93 and 27.01, with an average value of 14.08. This increased travel time causes time loss, anxiety, and additional expenses for the population.
Mobility restrictions induce a significant increase in energy consumptions and CO2 emissions. The rise in energy consumption due to mobility restrictions is between 67% and 731% for gasoline vehicles, with an average value of 275%. CO2 emissions follow the same increasing trend. The impact of the mobility restrictions on diesel vehicles is even higher, with an increase in CO2 emissions is of between 101% and 881%, and an average value of 358%.
The authors are aware of the research limitations related to the use of average values for vehicles as concerns mobility restrictions. This limitation is due to a lack of detailed data about individual vehicles. In the future, similar research could be enhanced by following the methodology proposed in [34], and by the use of mobile crowdsourcing to collect detailed data about the vehicles affected by the mobility restrictions, including their type, energy consumption, and route.

Author Contributions

Conceptualization, H.A. and I.S.; methodology, H.A. and I.S.; software, H.A. formal analysis, H.A.; investigation, H.A.; writing—original draft preparation, H.A. writing—review and editing, H.A. and I.S; visualization, H.A.; supervision, I.S. All authors have read and agreed to the published version of the manuscript.

Funding

This research received no external funding.

Institutional Review Board Statement

Not applicable.

Informed Consent Statement

Not applicable.

Data Availability Statement

Data used in this research is presented in this paper.

Conflicts of Interest

The authors declare no conflict of interest.

References

  1. Weizman, E. Hollow Land: Israel’s Architecture of Occupation; VERSO: London, UK, 2007. [Google Scholar] [CrossRef]
  2. Braverman, I. Civilized Borders: A Study of Israel’s New Crossing Administration. Antipode 2011, 43, 264–295. [Google Scholar] [CrossRef]
  3. Vermote, L.; Macharis, C.; Boeykens, F.; Schoolmeester, C.; Putman, K. Traffic-restriction in Ramallah (Palestine): Participatory sustainability assessment of pedestrian scenarios using a simplified transport model. Land Use Policy 2014, 41, 453–464. [Google Scholar] [CrossRef]
  4. Rijke, A.; Minca, C. Inside Checkpoint 300: Checkpoint Regimes as Spatial Political Technologies in the Occupied Palestinian Territories. Antipode 2019, 51, 968–988. [Google Scholar] [CrossRef]
  5. Habbas, W.; Berda, Y. Colonial management as a social field: The Palestinian remaking of Israel’s system of spatial control. Curr. Sociol. 2021, 2–28. [Google Scholar] [CrossRef]
  6. Griffiths, M.; Repo, J. Women and checkpoints in Palestine. Secur. Dialogue 2021, 52, 249–265. [Google Scholar] [CrossRef]
  7. Calì, M.; Miaari, S.H. The labor market impact of mobility restrictions: Evidence from the West Bank. Labour Econ. 2018, 51, 136–151. [Google Scholar] [CrossRef] [Green Version]
  8. Gugerell, K.; Netsch, S. Planning in the face of power. Experiencing power dimensions in a visioning process in the west bank and the Gaza strip. Urban Plan. 2017, 2, 41–52. [Google Scholar] [CrossRef]
  9. World Bank. Movement and Access Restrictions in the West Bank: Uncertainty and Inefficiency in the Palestinian Economy; World Bank: Washington, DC, USA, 2007. [Google Scholar]
  10. International Monetary Fund (IMF). Macroeconomic and Fiscal Framework for the West Bank and Gaza: Sixth Review of Progress; Staff Report for the Meeting of the Ad Hoc Liaison Committee; IMF: Washington, DC, USA, 2010. [Google Scholar]
  11. UNCTAD. Developments in the Economy of the Occupied Palestinian Territory, Geneva. Report of the United Nations Conference on Trade and Development (UNCTAD). Available online: https://www.un.org/unispal/document/auto-insert-187867/ (accessed on 20 September 2021).
  12. Boussauw, K.; Vanin, F. Constrained sustainable urban mobility: The possible contribution of research by design in two Palestinian cities. Urban Des. Int. 2018, 23, 182–199. [Google Scholar] [CrossRef] [Green Version]
  13. Barka, H.B. Border Posts, Checkpoints, and Intra-African Trade: Challenges and Solutions. African Development Bank, Chief Economic Complex. 1–18 January 2012. Available online: http://www.afdb.org/fileadmin/uploads/afdb/Documents/Publications/INTRA AFRICAN TRADE_INTRA AFRICAN TRADE.pdf (accessed on 1 September 2021).
  14. Reyna, J.; Vadlamani, S.; Chester, M.; Lou, Y. Reducing emissions at land border crossings through queue reduction expedited security processing. Transp. Res. Part D Transp. Environ. 2016, 49, 219–230. [Google Scholar] [CrossRef] [Green Version]
  15. Ahmed, S.; Ibrahim, R.F.; Hefny, H.A. GIS-Based Network Analysis for the Roads Network of the Greater Cairo Area. Available online: http://ceur-ws.org (accessed on 1 September 2021).
  16. Statistics, P.C.B. Palestine in Figures 2020. Available online: http://www.pcbs.gov.ps (accessed on 20 October 2021).
  17. Geomolg. 2012. Available online: https://geomolg.ps/L5/index.html?viewer=A3.V1 (accessed on 2 May 2020).
  18. ARIJ. Assessing the Impacts of Israeli Movement Restrictions on the Mobility on People and Goods in The West Bank. 2019. Available online: http://www.arij.org/publications/special-reports/305-special-reports-2019/955-assessing-the-impacts-of-israeli-movement-restrictions-on-the-mobility-of-people-and-goods-in-the-west-bank-2019.html (accessed on 9 May 2020).
  19. Chandra, S.; Naik, R.T.; Jimenez, J. Crowdsourcing-based traffic simulation for smart freight mobility. Simul. Model. Pract. Theory 2019, 95, 1–15. [Google Scholar] [CrossRef]
  20. Salazar-Carrillo, J.; Torres-Ruiz, M.; Davis, C.A.; Quintero, R.; Moreno-Ibarra, M.; Guzmán, G. Traffic congestion analysis based on a web-gis and data mining of traffic events from twitter. Sensors 2021, 21, 2964. [Google Scholar] [CrossRef] [PubMed]
  21. Huang, K. Mapping the Hazard: Visual Analysis. IEEE Comput. Graph. Appl. 2021, 41, 26–34. [Google Scholar] [CrossRef] [PubMed]
  22. Ghandour, A.J.; Hammoud, H.; Telesca, L. Transportation hazard spatial analysis using crowd-sourced social network data. Phys. A Stat. Mech. Its Appl. 2019, 520, 309–316. [Google Scholar] [CrossRef]
  23. Hassouna, F.M.A.; Abu-Eisheh, S.; Al-Sahili, K. Analysis and Modeling of Road Crash Trends in Palestine. Arab. J. Sci. Eng. 2020, 45, 8515–8527. [Google Scholar] [CrossRef]
  24. Dcsa, P.S.; Chhillar, R.R.S. Dijkstra Shortest Path Algorithm using Global Positioning System. Int. J. Comput. Appl. 2014, 101, 975–8887. [Google Scholar]
  25. Ibarra-Espinosa, S.; Ynoue, R.; O’sullivan, S.; Pebesma, E.; De Fátima Andrade, M.; Osses, M. VEIN v0.2.2: An R package for bottom-up vehicular emissions inventories. Geosci. Model Dev. 2018, 11, 2209–2229. [Google Scholar] [CrossRef]
  26. Pratiwi, A.F.; Riyato, S.D.; Listyaningrum, R.; Aji, G.M. The Shortest Path Finder for Tsunami Evacuation Strategy using Dijkstra Algorithm. IOP Conf. Ser. Mater. Sci. Eng. 2020, 854, 012035. [Google Scholar] [CrossRef]
  27. ARIJ. Locality Profiles and Needs Assessment in the Qalqiliya Governorate. 2014. Available online: https://www.arij.org/files/arijadmin/IDRC/publications/Qalqiliya_VProfile_EN.pdf (accessed on 1 September 2021).
  28. Statistics of Palestinian Central Bureau. Palestinian Multiple Indicator Cluster Survey 2019–2020. 2021. Available online: https://www.pcbs.gov.ps/Downloads/book2552.pdf (accessed on 22 September 2021).
  29. Statistics of P Palestinian Central Bureau. Transportation and Communication Statistics in Palestine: Annual Report, 2013. 2021. Available online: https://www.pcbs.gov.ps/Downloads/book2571.pdf (accessed on 22 September 2021).
  30. Ministry of Transport (MOT). The Executive Regulations of the Traffic Law No. 5 of 2000. 2000. Available online: http://www.mot.gov.ps/wp-content/uploads/2016/04/bylaws.pdf (accessed on 15 June 2020).
  31. Hassouna, F.M.A.; Al-Sahili, K. Environmental impact assessment of the transportation sector and hybrid vehicle implications in Palestine. Sustainability 2020, 12, 7878. [Google Scholar] [CrossRef]
  32. Argonne National Laboratory. How Much Fuel Is Used for Idling ? U.S Department of Energy. 2014. Available online: http://www.transportation.anl.gov/pdfs/idling_worksheet.pdf (accessed on 3 June 2020).
  33. Errampalli, M.; Senathipathi, V.; Thamban, D. Effect of Congestion on Fuel Cost and Travel Time Cost on Multi-Lane Highways in India. Int. J. Traffic Transp. Eng. 2015, 5, 458–472. [Google Scholar] [CrossRef]
  34. Wang, X.Z. The Comparison of Three Algorithms in Shortest Path Issue. J. Phys. Conf. Ser. 2018, 1087, 022011. [Google Scholar] [CrossRef]
Figure 1. Types and sources of collected data.
Sustainability 13 13457 g001
Figure 2. Distribution of checkpoints (Qalqilya governorate) [16,17].
Sustainability 13 13457 g002
Figure 3. Impact of the wall on the best route between Qalqilya city and other localities.
Sustainability 13 13457 g003
Table 1. The Average delay time at permanent checkpoints in the West Bank [18].
CheckpointGovernorateAverage Delay Time (Minutes)
JalamehJenin29
KafriatTulakerm42
Qalqilya DCOQalqilya80
JaljouliaQalqilya89
Ni’lin workersRamallah23
MaccabimRamallah55
QalandiyaJerusalem81
Glo 300Bethlehem34
Al Jab’aBethlehem50
TarqumiyaHebron26
MeitarHebron35
Table 2. Attributes of shapefiles.
Governorate Border Palestinian CommunitiesSeparation WallWB Road Network
ObjectIDObjectIDObjectIDObjectID
Shape LengthShape LengthShape LengthShape Length
Shape AreaShape AreaStatusStatus
-Community Name-Road Type
Table 3. Impact of the wall on the best route length between Qalqilya city and other localities.
DestinationTravel Distance without the Wall D0 (km)Travel Distance with the Wall DW (km)Increase in the Travel Distance Due to the Wall IDW (km)
Kafr Laqif7.5124.5
Beit Amin6.516.510
A’zzun A’tma8.618.29.6
Jinsafut1217.55.5
Hajja8.617.38.7
Kafr Qaddum15.819.63.8
Jayyus9.212.53.3
Sanniriya616.110.1
Kafr Thulth6.512.45.9
Al-Mudawwar4.616.111.5
Ad Daba422.618.6
Ras at Tira3.623.119.5
Table 4. Impact of the wall on the travel time between Qalqilya city and other localities.
DestinationTravel Time without the Wall T0 (min)Travel Time with the Wall TW (min)Time Delays Due to the Wall TDW (min)
Kafr Laqif9.013.45.4
Beit Amin7.819.812.0
A’zzun A’tma10.321.811.5
Jinsafut14.421.06.6
Hajja10.320.810.5
Kafr Qaddum19.013.54.5
Jayyus11.015.04.0
Sanniriya7.219.312.1
Kafr Thulth7.814.97.1
Al-Mudawwar5.519.313.8
Ad Daba4.827.122.3
Ras at Tira4.327.723.4
Table 5. Impact of the checkpoints on the travel time between Qalqilya city and other localities.
DestinationTraveling Time without the Checkpoint T0 (min)Traveling Time with the Checkpoint TCP (min)Ratio TCP/T0
Kafr Laqif9.098.010.9
Beit Amin7.896.812.4
A’zzun A’tma10.399.39.6
Jinsafut14.4103.47.1
Hajja10.399.39.6
Kafr Qaddum19.0108.05.7
Jayyus11.0100.09.1
Sanniriya7.296.213.4
Kafr Thulth7.896.812.4
Al-Mudawwar5.594.517.2
Ad Daba4.893.819.6
Ras at Tira4.393.321.7
Table 6. Impact of the mobility restrictions on the travel time between Qalqilya city and localities.
LocalityTravel Time without Restrictions (T0) (Minutes)Travel Time with the Restrictions (TMR) (Minutes)TMR/T0
Kafr Laqif9103.411.48
Beit Amin7.8108.813.94
A’zzun A’tma10.32110.8410.74
Jinsafut14.41107.63
Hajja10.32109.7610.63
Kafr Qaddum18.96112.525.93
Jayyus11.041049.42
Sanniriya7.2108.3215.04
Kafr Thulth7.8103.8813.32
Al-Mudawwar5.52108.3219.62
Ad Daba4.8116.1224.19
Ras at Tira4.32116.7227.018
Table 7. Average vehicle energy consumption in Palestine [31] and average energy consumption of idle or slowly moving vehicles [32,33].
VehicleAverage Vehicle Energy Consumption in Palestine (L/km)Average Energy Consumption of Idle or Slowly Moving Vehicles (Liter/min)
Gasoline0.1290.033
Diesel0.1070.049
Table 8. Impact of mobility restrictions on energy consumption (gasoline vehicles).
LocalityE0 (L)EW (L)Etotal (L) E0 + Ew + ECPRatio Etotal/E0
Kafr Laqif0.96750.58052.42912.51
Beit Amin0.83851.293.00963.58
A’zzun A’tma1.10941.23843.22892.91
Jinsafut1.5480.70953.13862.02
Hajja1.10941.12233.11282.80
Kafr Qaddum2.03820.49023.40951.67
Jayyus1.18680.42572.49362.10
Sanniriya0.7741.30292.9583.82
Kafr Thulth0.83850.76112.48072.82
Al-Mudawwar0.59341.48352.9584.98
Ad Daba0.5162.39943.79657.35
Ras at Tira0.46442.51553.8618.31
Table 9. Impact of mobility restrictions on energy consumptions (diesel vehicles).
LocalityE0 (L)EW (L)Etotal (L) E0 + Ew + ECPRatio Etotal/E0
Kafr Laqif0.80250.48152.59233.23
Beit Amin0.69551.073.07384.41
A’zzun A’tma0.92021.02723.25573.53
Jinsafut1.2840.58853.18082.47
Hajja0.92020.93093.15943.43
Kafr Qaddum1.69060.40663.40552.01
Jayyus0.98440.35312.64582.68
Sanniriya0.6421.08073.0314.72
Kafr Thulth0.69550.63132.63513.78
Al-Mudawwar0.49221.23053.0316.15
Ad Daba0.4281.99023.72658.7
Ras at Tira0.38522.08653.789.81
Table 10. CO2 emissions factor (CO2Fi) [31].
Gasoline (gm/L)Diesel (gm/L)
25982925
Table 11. Impact of mobility restrictions on CO2 emissions (gasoline vehicles).
LocalityCO20 (g)CO2WCO2 total (g) CO20 + CO2W + CO2CPIncrease (%)
Kafr Laqif251415086311151
Beit Amin217833517819259
A’zzun A’tma288232178389191
Jinsafut402218438154103
Hajja288229168087181
Kafr Qaddum52951274885867
Jayyus308311066478110
Sanniriya201133857685282
Kafr Thulth217819776445196
Al-Mudawwar154238547685398
Ad Daba134162349863636
Ras at Tira1207653510031731
Table 12. Impact of mobility restrictions on CO2 emissions (diesel vehicles).
LocalityCO20 (g)CO2WCO2 total (g) CO20 + CO2W + CO2CPIncrease (%)
Kafr Laqif234714087582223
Beit Amin203431308991342
A’zzun A’tma269230059523254
Jinsafut375617219304148
Hajja269227239241243
Kafr Qaddum494511899961101
Jayyus287910337739169
Sanniriya187831618866372
Kafr Thulth203418477708279
Al-Mudawwar144035998866516
Ad Daba1252582110900771
Ras at Tira1127610311057881
Publisher’s Note: MDPI stays neutral with regard to jurisdictional claims in published maps and institutional affiliations.

