Article

Analyzing Cost and Schedule Growths of Road Construction Projects, Considering Project Characteristics

Post-Construction Evaluation and Management Center, Department of Construction Policy Research, Korea Institute of Civil Engineering and Building Technology, Goyang-si 10223, Korea
*
Author to whom correspondence should be addressed.
Sustainability 2021, 13(24), 13694; https://doi.org/10.3390/su132413694
Submission received: 9 September 2021 / Revised: 28 November 2021 / Accepted: 9 December 2021 / Published: 11 December 2021

Abstract

:
The development of road infrastructure is closely related to national competitiveness and presents significant socioeconomic impacts. However, road construction involves a large budget and is vulnerable to political, economic, social, and project-specific risks, which often result in cost overruns and schedule delays. Assessing the gap between the final performance and the planned performance, and providing feedback to similar projects in the future is essential for successful project planning and management. The aim of this study is to empirically analyze the cost and schedule growth of road construction projects, considering project characteristics. Using the national-level project performance data, the primary goal is to answer, “Do project characteristics influence the road project performance? If so, how different is the performance because of the project characteristics?” To this end, this study analyzes the cost and schedule growth of 423 road construction projects, considering five project characteristics: facility type, construction type, bid type, contract type, and project size. Non-parametric tests (the Mann–Whitney U test and the Kruskal–Wallis test) are used to analyze the differences between sample groups. The results demonstrate (1) better management of the performance of the highway when compared to the national and provincial roads; (2) higher schedule growth of the expansion and renovation than that of the new construction; (3) lower cost growth of the design-build method (turnkey and alternative) than the design-bid-build methods (qualification examination and lowest price); and (4) relatively larger cost and schedule growth for projects over $50 million than those of smaller projects. These results present empirical references from the Korean construction industry that can help construction-related entities (clients, design consultants, and contractors) to estimate and manage the cost and schedule buffers of future projects by considering different project characteristics. Discussions and suggestions connected with the findings are also provided. Future research will continue to shed light on the critical factors affecting the cost and schedule growth.

1. Introduction

Road infrastructure can be considered as the “blood vessels” of national territory and has significant socio-economic impacts including urbanization, industrialization, employment, and real estate development [1,2,3]. Road infrastructure reduces the logistics and production costs by indirectly supporting production activities, and increases the national competitiveness by increasing employment, income, and technological innovation through government investment expenditure [4]. Consequently, the World Economic Forum (WEF) considers the level of infrastructure development as an important factor in evaluating a country’s competitiveness [5]. The road connectivity and quality have been particularly assessed and monitored in the case of road infrastructure to provide objective information for individual countries.
According to the IHS Markit [6], the size of the Korean transportation market is approximately $36.9 billion, and is therefore the ninth largest market out of 74 countries, as of 2020. Additionally, based on the WEF’s Global Competitiveness Report 2019, Korea’s road connectivity ranks 26th out of 141 countries, and the quality of its road infrastructure ranks 9th out of 141 countries [5]. Although Korea has a well-established road infrastructure system, its road stocks (e.g., national road length per capita and land area) remain insufficient in comparison to those of the OECD countries; thus, discussions on the investment in road infrastructure are continuing [4,7].
However, road construction projects are vulnerable to political, economic, social, and project-specific risks that affect the project performance, and particularly affect the cost and schedule growths [8,9,10,11]. Typically, the factors related to the client (e.g., instructions for additional works and design modification), design consultants (e.g., design flaws and differences in the on-site conditions and design), contractors (e.g., changes in the site conditions and contract), and third parties (e.g., civil complaints and coordination with related organizations) synthetically affect the overall project performance [8,9,10,11]. The cost-effectiveness is a prerequisite because most road projects are executed by the national budget; therefore, post-construction evaluation is crucial. Under the Korean Act for Promotion of Construction Technology, the concept of post-construction evaluation assesses the gap between the final performance against the planned performance and aims to support successful project planning and management by providing the feedback performance information to similar projects in the future.
The aim of this study is to empirically analyze the cost and schedule growth of road construction projects, considering project characteristics. Over the decades, the definition and coverage of construction sustainability attributes have been widely discussed [12,13,14]. Typically, the dimension of construction sustainability can be classified into economic (e.g., effects on national economy, use of national and regional resources, enhancement in capacity of infrastructure, and cost of infrastructure construction, operation, and maintenance), environmental (e.g., climate change, air pollution, noise pollution, and public health and safety), and social (e.g., employment, public comfort, cultural heritage, and infrastructure improvement) aspects [12,13,14]. Among these dimensions, the target of this study primarily contributes to economic sustainability (monitoring effects on national economy and cost management of infrastructure planning and construction) by providing empirical performance information that enables one to estimate the cost and schedule buffers at the early stage of road projects. Empirical results drawn from the national-level project performance data are meaningful not only for selecting the proper project conditions such as bid and contract types, but also for managing the cost and schedule buffers at the project planning stage. This study proceeds in four steps. Firstly, the body of knowledge corresponding to the construction performance management is reviewed, particularly for road projects. Secondly, a detailed methodology is introduced, covering data collection, project performance indicators (cost and schedule growth), and statistical analysis methods (normality test and non-parametric tests). Thirdly, this study analyzes the performance of 423 road construction projects in terms of the cost and schedule performance. The analysis results are presented in two parts, where the first part shows the overall performance of the total sample using histograms and descriptive statistics, and the second part presents the comparative performance results based on the project characteristics (facility type, construction type, bid type, contract type, and project size). Lastly, this study discusses the implications of the results, limitations, and directions for future research.

2. Research Background

2.1. Construction Performance Management Systems at National Level

Performance evaluation and management are essential for the successful implementation of construction projects. The continuous collection of data according to the project lifecycle (e.g., planning, design, construction, and operation), evaluation of the successful or failed parts, and their effective utilization in future construction projects is crucial for project performance management [15,16]. The leading countries operate their own performance management systems to promote better, faster, and more environmentally friendly delivery of construction projects [17,18,19].
Since 1996, the Construction Industry Institute (CII) has been operating a performance assessment system based on long-term partnerships between academia and the industry [17]. The CII provides industry-specific and phased-based performance information, focusing on the industrial facilities (heavy and light industries). Particularly, this system enables distinctive performance evaluation for each of the three construction sectors (industrial, building, and infrastructure projects) and for five project phases (front-end planning, engineering, procurement, construction, and startup). The recently developed 10-10 program consists of ten input measures, which reflect the organizational capabilities (e.g., planning, leading, organizing, controlling, and human resources) and ten output measures related to the cost, schedule, and safety performance for each project [15,16]. Although the CII’s system is privately oriented and is focused on the industrial facilities, this system provides useful information for diagnoses of organizational and project-level performance.
In Japan, the Ministry of Land, Infrastructure, Transport and Tourism (MLIT) has been operating a project assessment system for public infrastructure projects, such as roads, harbors, and water management facilities, since 1998 [18]. The Japanese system has a three-step assessment process based on the project lifecycle (initial assessment upon adoption of new project delivery, reassessment after construction commencement, and post-completion assessment). In this system, the benefit–cost ratios, socio-economic changes, and environmental and safety issues are periodically assessed and monitored, facilitating the successful implementation of ongoing projects. However, this government-driven system lacks the collection and feedback mechanisms for using project-specific information (e.g., cost and schedule performance) for similar future projects.
In Korea, the Ministry of Land, Infrastructure and Transport (MOLIT) and the Korea Institute of Construction Technology (KICT) have operated a post-construction evaluation system for public infrastructure projects such as roads, railroads, harbors, and water management facilities since 2000 [19]. This system focuses on assessing the gap between the final performance and the planned performance, and also on feeding back the performance information to similar projects in the future. There are three types of performance indices that are assessed and managed in this system: (1) project performance (cost growth, schedule growth, change orders, safety accidents, and reworks), (2) project efficiency (gaps in facility-specific demands and benefit–cost ratios), and (3) ripple effect (civil complaints, defects, and regional economic and environmental effects). Hitherto, only the data from the project performance field have been primarily used, particularly regarding the cost and schedule performance; the other information will be provided by upgrading the data feedback system [20,21].
Other similar approaches can be found in the U.K. Industry Performance Report [22] and the Australian Infrastructure Audit [23]. Based on national-level project performance data, these two countries periodically provide performance analysis reports to improve industry efficiency, capability, and sustainability.
In summary, Section 2.1 introduces an example of representative countries operating construction performance management systems. Major countries including the U.S., Japan, Korea, the U.K., and Australia have made efforts to develop and stabilize their systems through various methods, thus contributing to the sustainable construction industry [15,16,17,18,19,20,21,22,23]. Among the extensive range of project performance management styles, this study focuses on road construction projects, which account for the majority of the performance data, and performs a comparative analysis of the cost and schedule growth, considering diverse project characteristics.

2.2. Approaches to Performance Analysis of Road Construction Projects

The quantitative performance analyses of road construction projects have been rarely conducted thus far, owing to difficulties in collecting large sample data on a specific facility. As stated by Sullivan et al. [24] and Moon et al. [25], most of the previous studies were focused on small sample projects, making it difficult to derive consistent results in terms of the cost and schedule performance. Therefore, many studies have used mixed building and civil projects covering diverse facilities as the analysis targets [25,26,27,28,29,30]. Although this approach is useful in comparing the performance between different facilities or project delivery systems (e.g., design-build (DB) and design-bid-build (DBB)), it remains limited in explaining the performance of a single facility.
A few studies have conducted quantitative performance analyses corresponding to road construction projects, focusing on the comparison between DB and DBB projects [31,32,33,34]. Using the Federal Highway Administration (FHWA) database, Shrestha et al. [31] analyzed 15 highway projects, including four DB projects and 11 DBB projects, and found that the average cost growth of DB projects was 9.6% lower than that of DBB projects, and the average schedule growth of DB projects was 5.3% lower than that of DBB projects. A follow-up study conducted by Shrestha et al. [32] used more samples (six DB projects and 16 DBB projects) from the Texas Department of Transportation (TxDOT), which presented slightly different results; the average cost growth for DB was 1.5% higher than that for DBB and the average schedule growth for DB was 15.4% higher than that for DBB. Minchin et al. [33] analyzed the performance of 60 highway projects (30 DB projects and 30 DBB projects) using the Florida Department of Transportation (FDOT) database, and found that DBB projects performed better than DB projects in terms of the cost performance. Tran et al. [34] analyzed 139 pairs of DB and DBB highway projects with the aid of the FDOT. Tran et al. [34] compare the performance between DB and DBB projects across five different construction types (new construction, reconstruction, resurfacing, restoration, rehabilitation (3R) projects, intelligent transportation system (ITS)-related projects, and miscellaneous construction) by analyzing 139 pairs of DB and DBB highway projects. The results of Tran et al. [34] indicate that DB projects perform better than the DBB projects overall, particularly for reconstruction and miscellaneous construction in terms of the cost growth, and for 3R projects and miscellaneous construction in terms of the schedule growth.
Table 1 shows a summary of previous studies comparing the cost and schedule performance between DB and DBB projects. As stated above, a few studies have conducted quantitative performance analyses corresponding to road construction projects, focusing on the comparison between DB and DBB projects [31,32,33,34]. These studies showed inconsistent results depending on the sample dataset used. Although the results of two studies claimed that DB performance was better than that of DBB [31,34], the results of the other two studies claimed that DBB performance was better than that of DB [32,33]. This implies that the empirical analysis of the project delivery system needs to be investigated further using various sample cases. Considering that most previous studies used small samples of less than 100 projects [31,32,33] based in the U.S. [31,32,33,34], this study can enrich the body of knowledge by providing internationally comparable results using 423 projects in countries other than the U.S. (i.e., a partial contribution to generalization). In particular, this study expands the range of project characteristics (facility type, construction type, bid type, contract type, and project size) that provide a foundation for international comparative studies.

3. Methodology

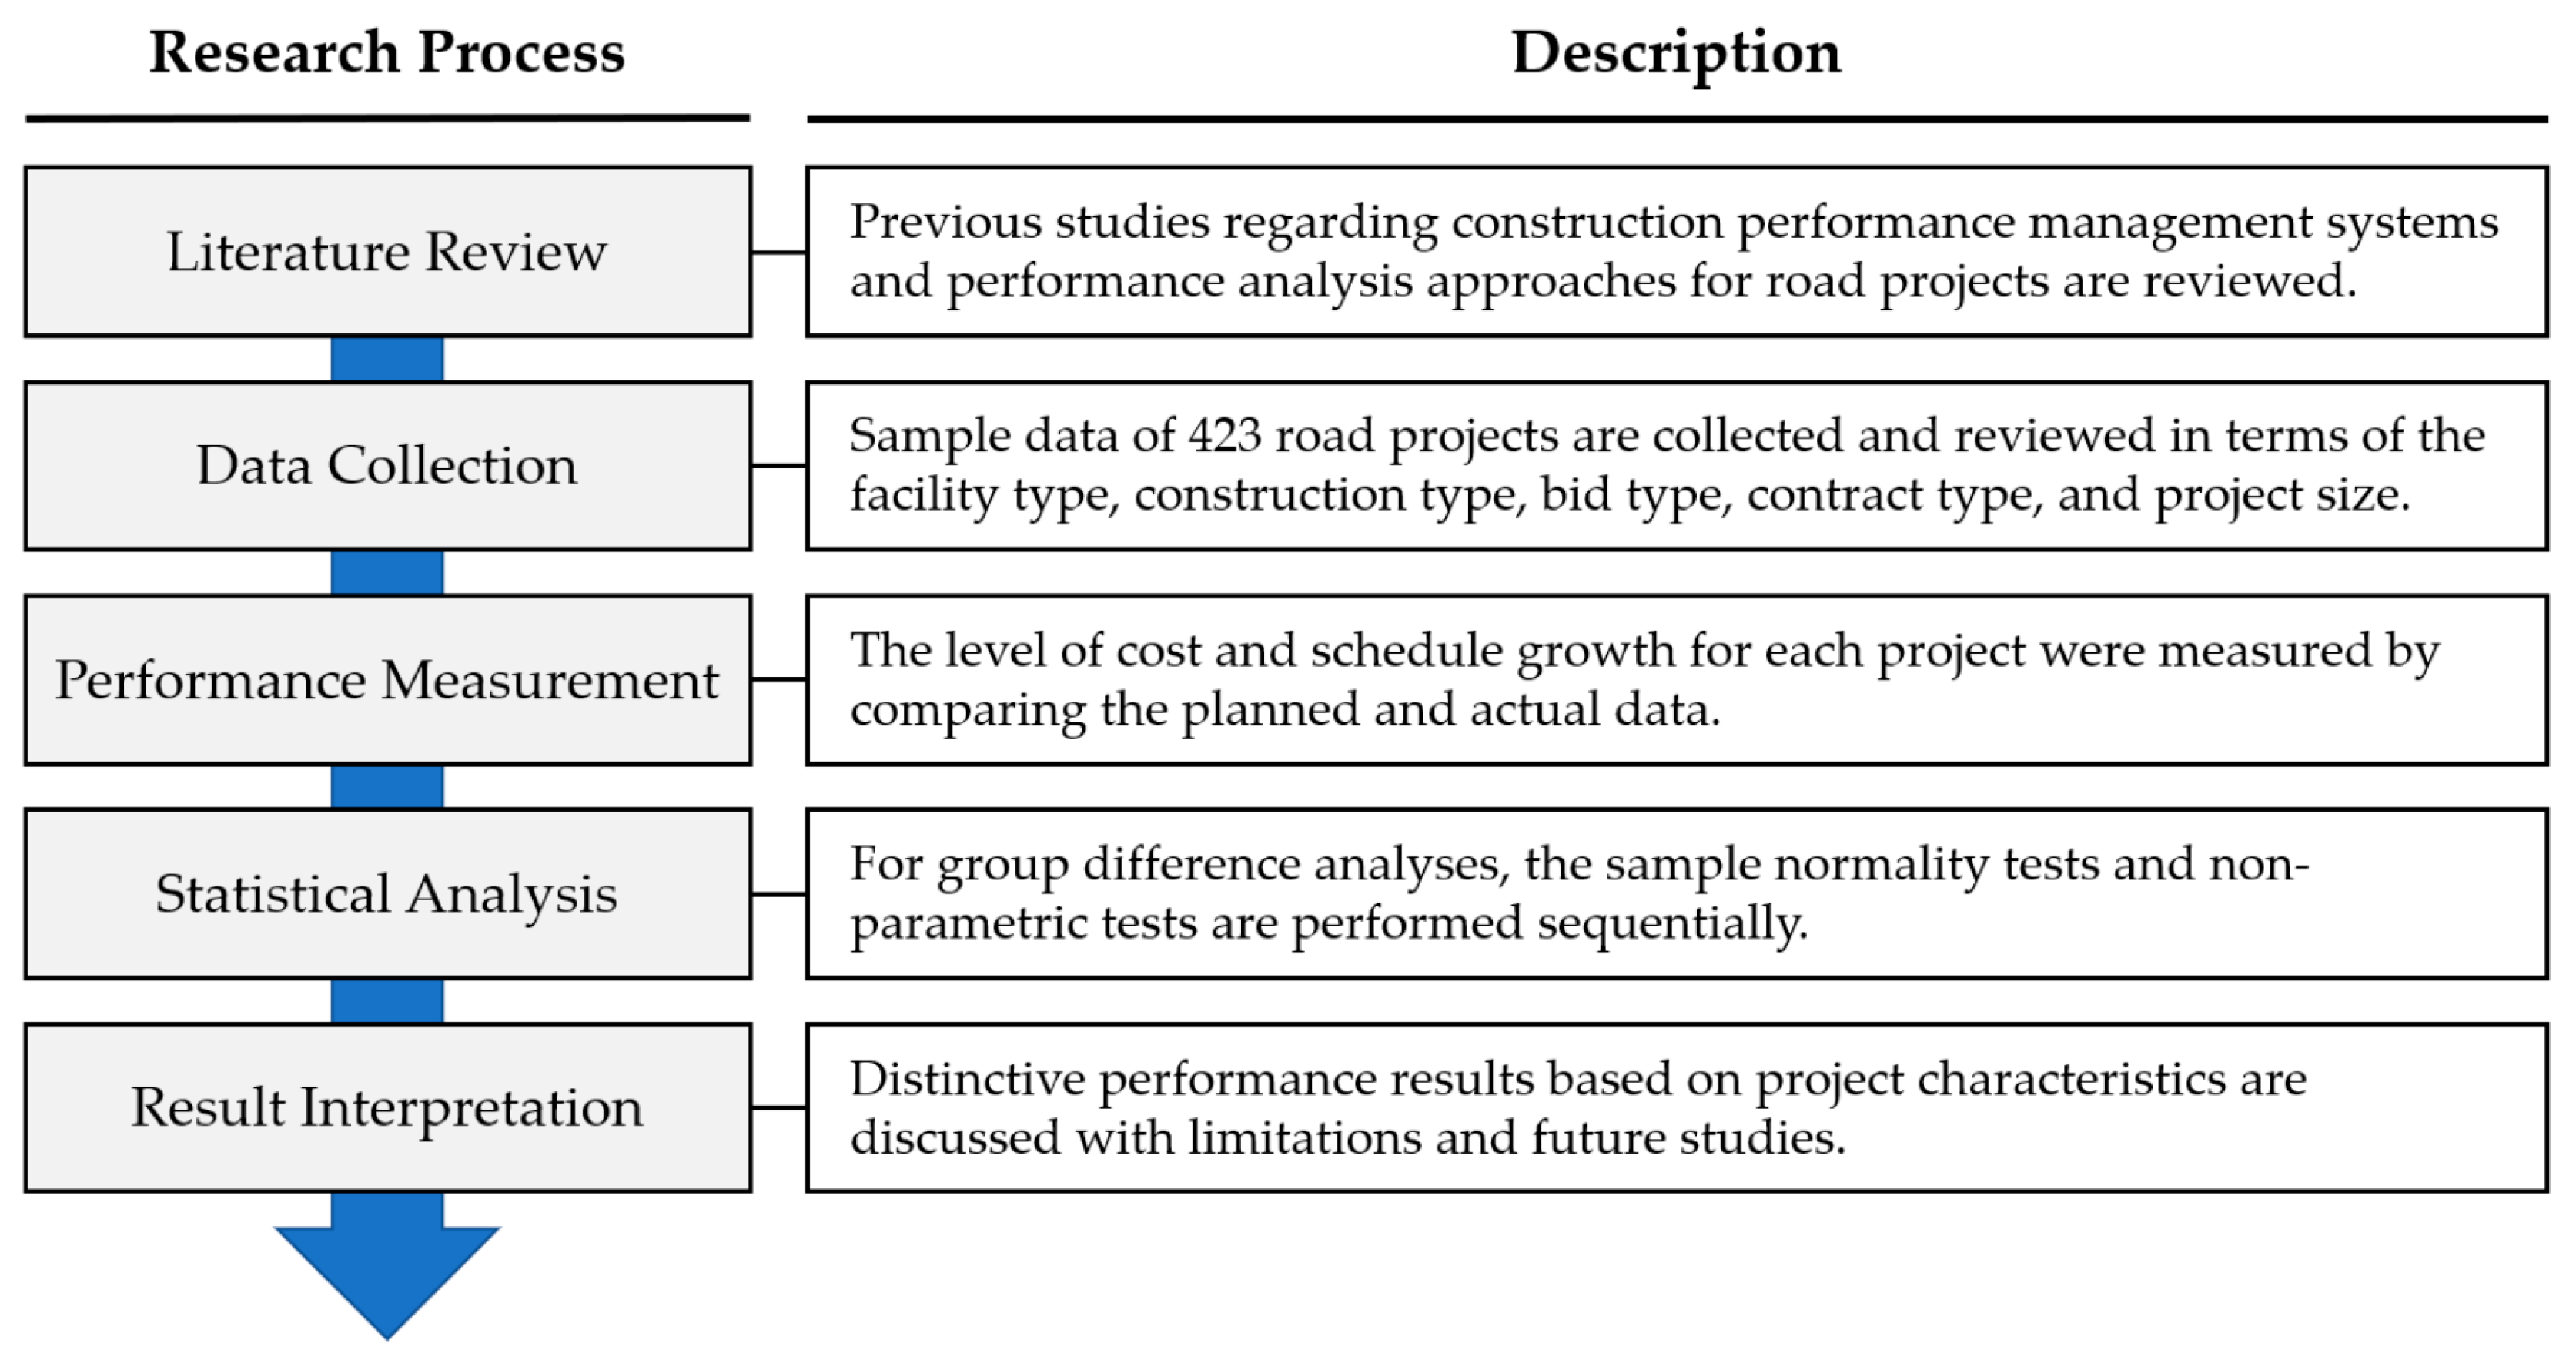
3.1. Research Process

The aim of this study is to empirically analyze the cost and schedule growth of road construction projects, considering project characteristics. The research methodology is presented in this section, which introduces detailed information regarding the data characteristics, performance measures, and analysis methods. Firstly, this study uses national-level project performance data from the post-construction evaluation database. This database includes information on phase-based project performance, such as cost, schedule, and change order. In this study, a master database of 423 road projects completed from 2001 to 2018 is created and used. Secondly, this study measures the level of cost and schedule growth for each project by comparing the planned and actual data, focusing on the cost and schedule performance. Thirdly, comparative performance analyses are performed using different project characteristics (i.e., facility type, construction type, bid type, contract type, and project size). In this process, the sample normality tests and statistical techniques for group difference analyses are performed sequentially. Lastly, distinctive performance results based on project characteristics are discussed with limitations and future studies. Figure 1 shows the overall research process and description.

3.2. Sample Data Characteristics

As shown in Table 2, the characteristics of the 423 sample projects are analyzed in terms of the facility type, construction type, bid type, contract type, and project size. According to the Post-Construction Evaluation Portal [19], the facility type is divided into three types (national road, provincial road, or highway) based on the functional purpose and management authority. The construction type is divided into two types (new or expansion and renovation) depending on whether the project is new or not. The bid type is typically divided into DBB (qualification examination and lowest price) and DB (turnkey and alternative) depending on the level of project size and technical difficulty. The DBB methods further divided into qualification examination and lowest price depending on whether the prequalification is included or excluded in the bidding process. The contract type is divided into open competition and restrictive competition depending on whether there are restrictions on the qualification for participating in a bid. In addition, to check the performance differences by project size, the 423 road projects are divided into three groups (≤USD 50 million, USD 51–100 million, or ≥USD 100 million) considering the number of samples per group. This study adopted the project classification criteria provided by the Post-Construction Evaluation Portal [19]. In Korea, the classification system for the characteristics of road construction projects is legally classified into three groups for facility type, two groups for construction type, three groups for bid type, and two groups for contract type, and is being accumulated in the Post-Construction Evaluation Portal [19]. However, because the project size and project duration are provided as a continuous scale, the 423 projects were divided into three appropriate groups, considering the distribution among groups.
Considering the facility type, the national road accounts for the majority (80.4%), followed by provincial roads (11.6%) and highways (8.0%). The national road connects major cities and national infrastructure (e.g., ports, airports, industrial complexes, and tourist destinations), which are managed by the central government (MOLIT), and the provincial road connects the local arterial road network managed by local governments [35]. The highway connects major cities with the national road through high-speed transportation and is managed by the Korea Expressway Corporation [35]. Considering the construction type, the new construction, and expansion and renovation accounted for 41.8% and 57.9%, respectively. For the bid type, the DBB methods (qualification examination and lowest price) accounted for the majority (91.4%) and the DB method (turnkey and alternative) accounted for 5.0%. For the contract type, open and restrictive competition accounted for 35.7% and 61.0%, respectively. For the project size, 86.3% of the total projects accounted for more than $50 million. The applied exchange rate is the average value of the completion period (2001–2018) of the total 423 projects (1 USD = KRW 1117.07). Lastly, for project duration, 89.6% of the total projects exceeded five years of completion.

3.3. Project Performance Measures

This study uses two metrics based on existing literature to determine the gap between the final performance and the planned performance: cost growth and schedule growth [27,28]. Cost growth is the percent change in the construction project cost in the project duration, which is the period from the contract award to completion. Similarly, schedule growth is the percent change in the construction project duration. The cost and schedule growth are calculated using Equations (1) and (2), respectively.
Cos t   growth   = F i n a l   c o n s t r u c t i o n   c o s t C o n t r a c t   a w a r d   a m o u n t   C o n t r a c t   a w a r d   a m o u n t × 100 ( % )
Schedule   growth   = F i n a l   d u r a t i o n P l a n n e d   d u r a t i o n P l a n n e d   d u r a t i o n × 100 ( % )

3.4. Analysis Methods

For the comparative performance analyses, two formal tests of sample normality are first conducted this study: Kolmogorov–Smirnov and Shapiro–Wilk tests. The null hypothesis of the sample normality tests is that the tested data are normally distributed [36,37]. If the p value of the test is less than the significance level (e.g., 0.01, 0.05, or 0.1), then the null hypothesis is rejected, indicating that the tested data do not follow a normal distribution. The significance level was set at 0.05 in this study. Consequently, among the 26 sample groups according to different project characteristics (the result of multiplying the number of 13 subsample groups shown in Table 2 by two types of project performance), only one group is observed to follow a normal distribution at a significance level of 0.05. Therefore, this study adopts non-parametric tests rather than parametric tests, to analyze the differences between the groups. Specifically, the Mann–Whitney U test is applied for two sample groups (i.e., construction type and contract type), the Kruskal–Wallis test is applied for three groups (i.e., facility type, bid type, and project size), and the Bonferroni correction method is applied for post-hoc comparisons. Although the Kruskal–Wallis test investigates the significant differences among three groups, the results of the Kruskal–Wallis test do not specify where the significant differences in project performance among groups were; thus, post-hoc comparisons were performed [38]. All statistical analyses were performed with IBM SPSS Statistics 27.0 (IBM, Armonk, NY, USA) for Windows.

4. Results

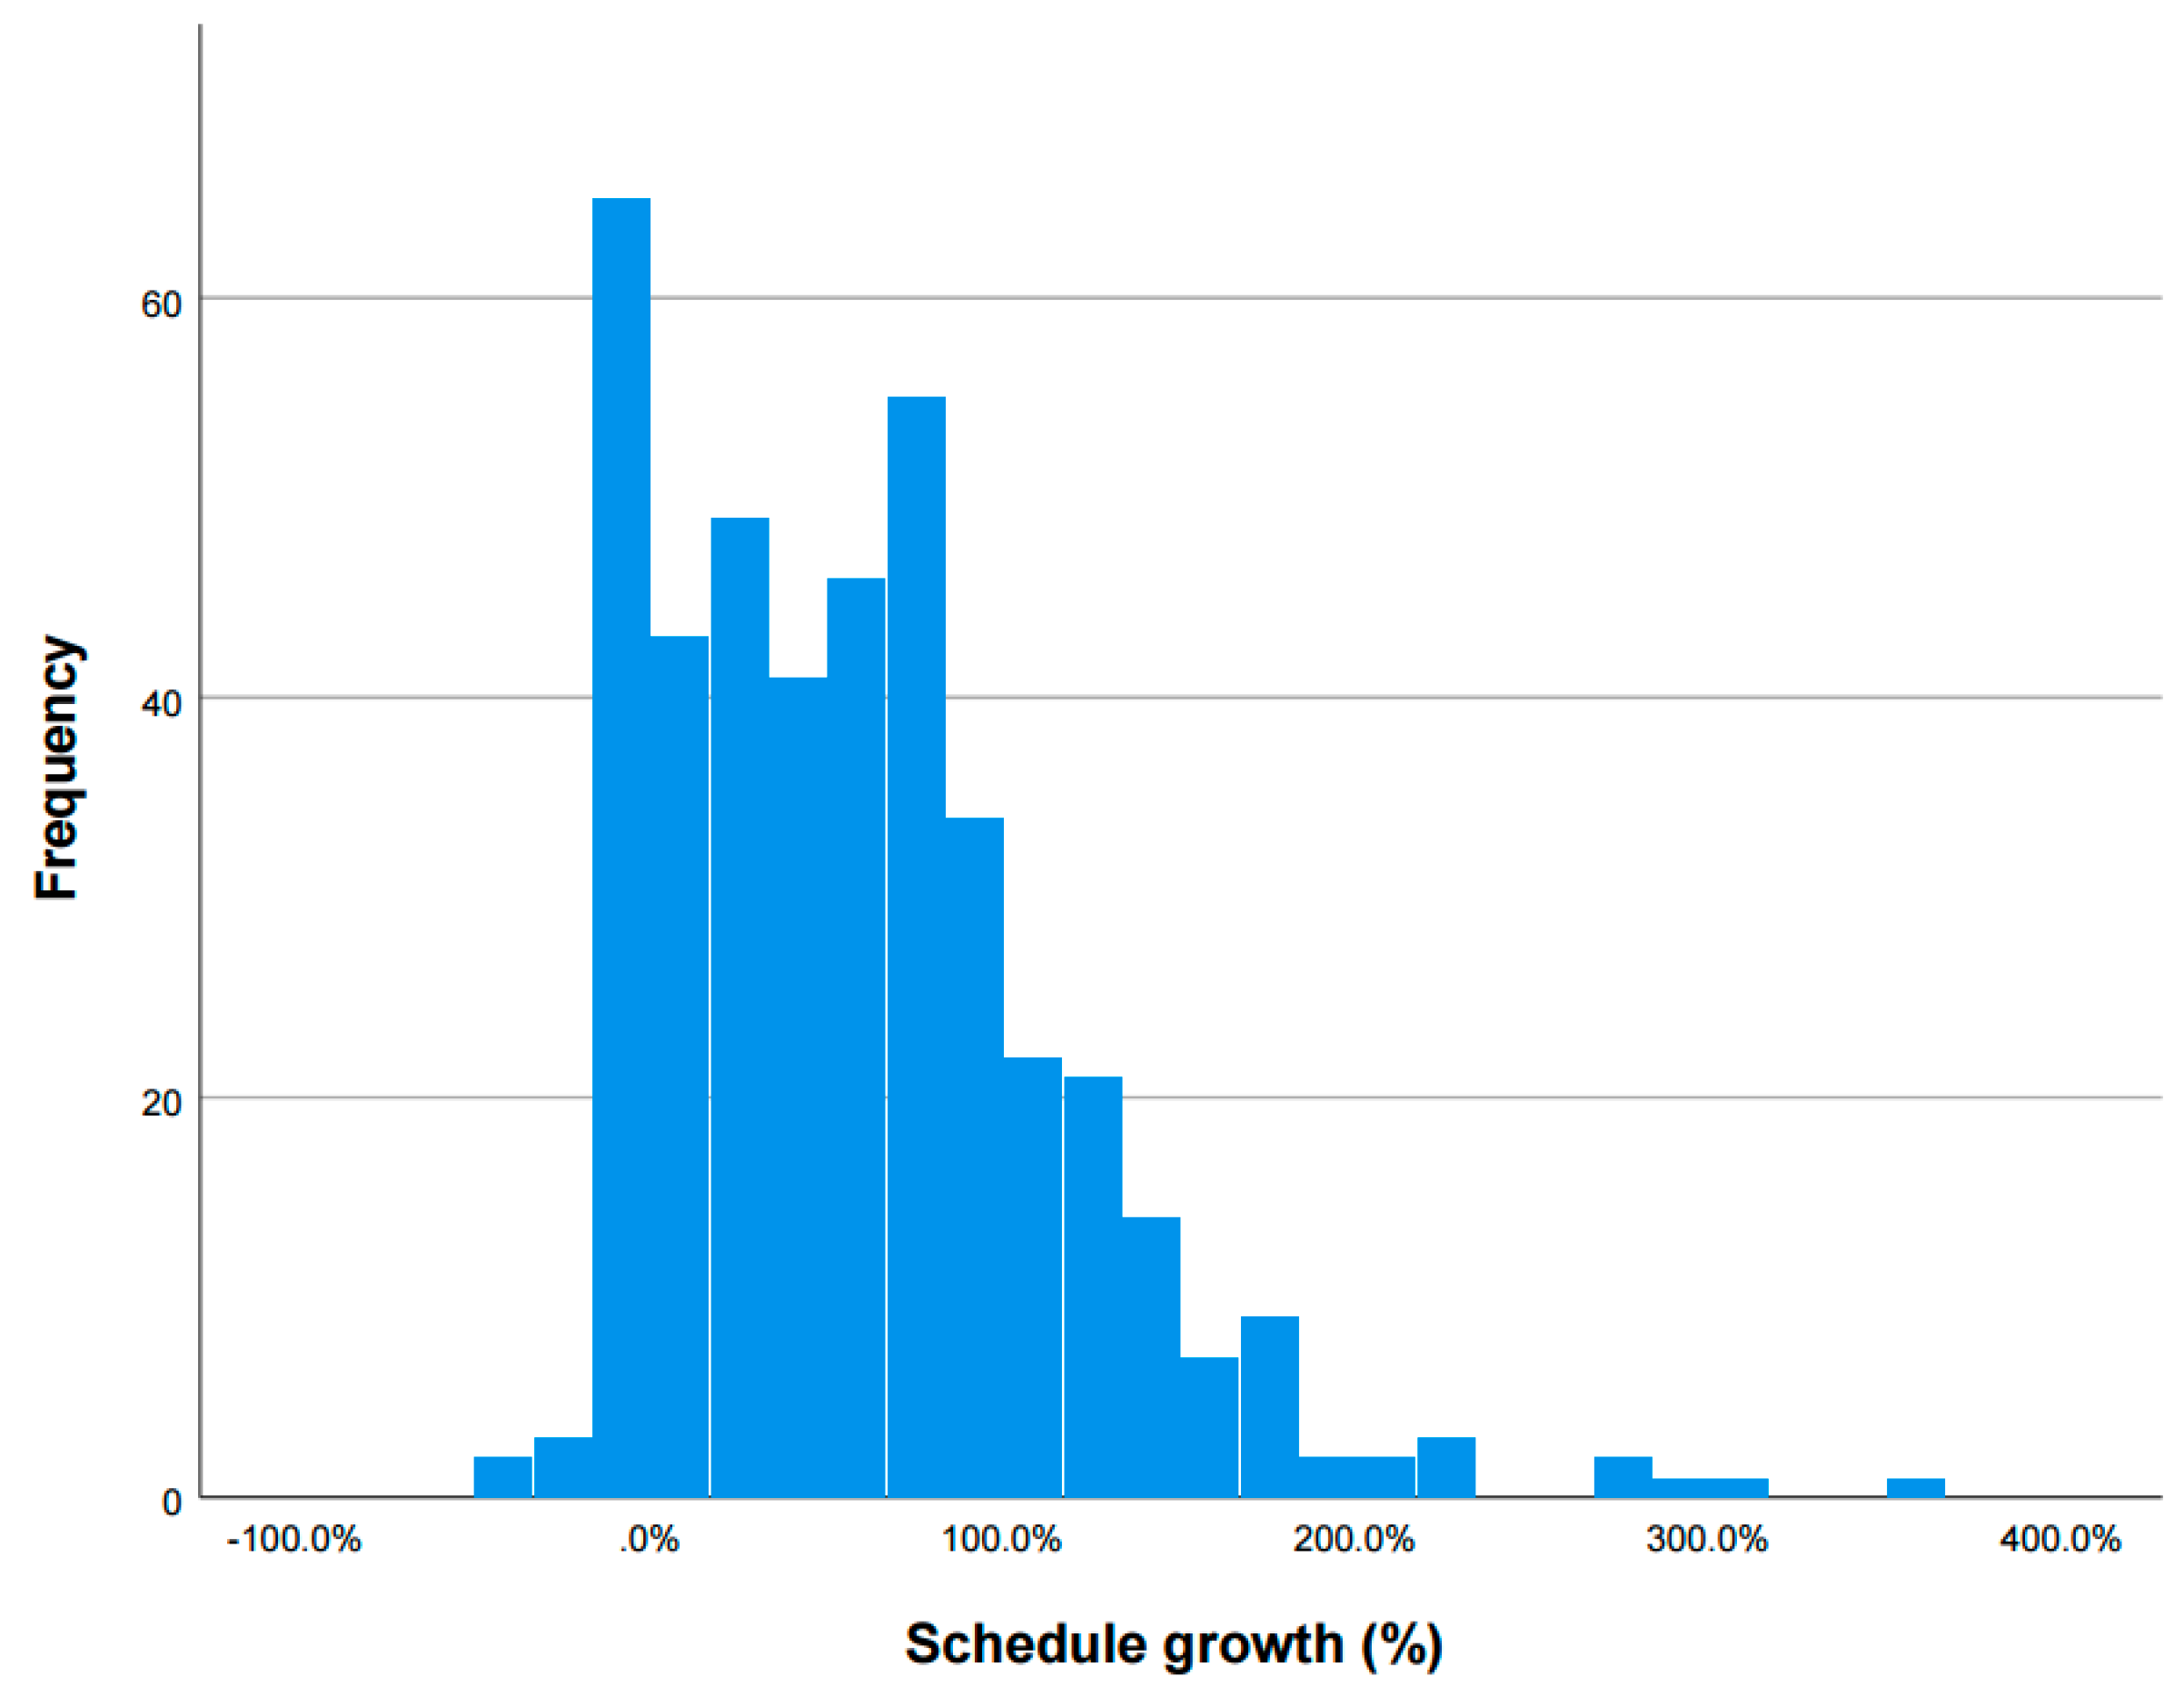
4.1. Performance Overview of the Total Sample

Figure 2 shows the overall distribution of cost growth for the 423 road projects. This is a positively skewed (i.e., right-skewed) distribution, where the mean (28.5%) is greater than the median (22.6%). The cost growth ranges from −48.2% to a maximum of 295.7%, and has an interquartile range from 13.7% (first quartile, Q1) to 35.0% (third quartile, Q3). Figure 3 presents the distribution of the schedule growth. This distribution is more spread out when compared to that of the cost growth, ranging from −37.4% to 357.9% (mean = 60.7%, median = 53.5%). Particularly, the interquartile range of the schedule growth is from 14.9% (Q1) to 89.4% (Q3), which is much wider than that of the cost growth. This implies that the performance variability of Korea’s road construction projects is generally greater in terms of the schedule growth when compared to the cost growth.
Table 3 and Table 4 present the descriptive statistics of the sample groups corresponding to the cost growth and schedule growth, respectively. Overall, similar patterns were observed for both the cost and schedule growth based on the sample characteristics. Considering the facility type, the mean and median values of the national road are the largest, followed by the provincial road and highway. Notably, the interquartile range of the schedule growth of the highway is 0.0% with a mean of −0.2%, indicating that most highway projects maintain their planned duration successfully. For the construction type, the mean and median values of expansion and renovation were slightly larger than those of the new construction. For the bid type, the distribution of the DB method (turnkey and alternative) was more stable than that of the DBB methods (qualification examination and lowest price), with the lowest mean and standard deviation (S.D.). There was no significant difference between the two groups for the contract type in terms of the cost and schedule growth. Lastly, for the project size, the mean and median values of the groups of more than $50 million were slightly larger than those of the group of relatively small projects. Because the above descriptive statistics do not indicate any statistical significance, more detailed analysis results of group differences are provided in the next section.

4.2. Performance Comparisons Based on Project Characteristics

4.2.1. Facility Type

As stated in Section 3.4, this study adopts non-parametric tests, considering the number of sample groups presented by the project characteristics. Table 5 and Table 6 present the results of the Kruskal–Wallis test based on the facility type. The test results indicate significant differences in both the cost growth ( χ 2 ( 2 ) = 11.655 , p = 0.003 ) and schedule growth ( χ 2 ( 2 ) = 71.257 , p = 0.000 ) among the three groups (Table 6). Overall, the cost and schedule growths were small in the order of highways, provincial roads, and national roads, according to the mean ranks presented in Table 5. Table 7 presents the results of post-hoc comparisons, which confirm that the cost growth of the national road was relatively large at the significance level of 0.05, and the schedule growth of the highway was remarkably low, at the significance level of 0.01. The performance of each facility may vary based on various factors, such as the functional purpose, urgency of use, and management authority. The cost and schedule performances were relatively well managed, particularly for schedule growth due to the characteristics of highways that have a high traffic volume and high urgency of transportation services.

4.2.2. Construction Type

Table 8 and Table 9 present the results of the Mann–Whitney U test based on the construction type. In terms of the mean rank, both the cost and schedule growth were smaller in the new construction than in the expansion and renovation (Table 8). Particularly, the results of the test statistics indicate a significant difference in the schedule growth ( Z = 2.773 , p = 0.006 ) between the two groups (Table 9). The schedule growth of the expansion and renovation was relatively high when compared to the new construction, owing to the addition of repair, replacement, and demolition activities on the existing facilities.

4.2.3. Bid Type

Table 10 and Table 11 present the results of the Kruskal–Wallis test based on the bid type. Overall, the cost and schedule growths corresponding to the mean rank in Table 10 were smaller in the DB method (turnkey and alternative) than in the DBB methods (qualification examination and lowest price). These results indicate that projects with the DB method outperformed those with the DBB method, demonstrating lower cost and schedule growth. The test statistics results indicate a significant difference in the cost growth ( χ 2 ( 2 ) = 6.784 , p = 0.034 ) among the three groups (Table 11). Additionally, Table 12 presents the result of post-hoc comparisons, which demonstrate that the cost growth of the DB method was smaller than that of the DBB method at a significance level of 0.05. Hitherto, the comparative studies of the performance between the DB and DBB projects have been widely performed with no absolute solution [25,31,32,33,34,39,40,41]. The empirical findings of these studies varied based on the characteristics of the target projects, such as facility type, construction type, and project size. The results of this study are consistent with those of Shrestha et al. [31] and Tran et al. [34], corresponding to the road projects, demonstrating that the cost growth of the DB method is generally lower than that of the DBB methods with statistical significance.

4.2.4. Contract Type

Table 13 and Table 14 show the results of the Mann–Whitney U test based on the contract type. There were no significant differences in either the cost of the schedule growth (Table 13), based on the statistical significance (Table 14). This can be attributed to the fact that the client selected the most appropriate contract method for the conditions and requirements of each project. In general, open competition is considered to have the advantage of a lower bid price; however, the risk of cost growth may be observed at the completion stage [42]. Restricted competition can reduce the risk of contract execution by using qualified contractors, but the risk of schedule growth may persist.

4.2.5. Project Size

Table 15 and Table 16 present the results of the Kruskal–Wallis test based on the project size. Considering the mean rank presented in Table 15, the test results indicate that the larger the project size, the higher the cost and schedule growth. Although this result was not satisfactory at the 0.05 confidence level, it is implied that the cost and schedule growth for projects over USD 50 million are relatively large, and that the project size affects the cost growth ( χ 2 ( 2 ) = 4.919 , p = 0.085 ) rather than the schedule growth. The project performance, particularly for cost performance, can be vulnerable to multidimensional risks and underestimation of the project complexity owing to the increase in the project size and complexity [43,44], thus requiring systematic management.

5. Discussion

This study’s results provide a useful empirical reference not only for selecting the proper project conditions such as bid and contract types, but also for managing the cost and schedule buffers at the project planning stage. In order to further contribute to the understanding of the road project performance, there are several issues that need to be addressed regarding the research findings.
First, regarding the facility type, significant performance differences were observed depending on the client types (i.e., the central government, local government, and the Korea Expressway Corporation), suggesting that the client is one of the important factors in explaining the cost and schedule growths. In the case of the Korea Expressway Corporation, since its foundation in 1969, it has long-standing knowledge and technology, and its own construction standards (specifications), thus its project management capability can be better than other government agencies. In addition, there are various factors related to design consultants, contractors, and third parties [8,9,10,11], which need to be investigated comprehensively. Second, regarding the construction type, the schedule growth of the road expansion and renovation was relatively high when compared to the new construction, owing to the addition of repair, replacement, and demolition activities on the existing facilities. Because the road in operation has to be partially controlled and construction often has to be conducted at night, the schedule does not proceed as smoothly as compared to the new construction. Accordingly, it can be seen that in the case of road expansion and renovation, more attention should be paid in terms of productivity management and response to unexpected situations. Third, regarding the bid type, the comparative studies of the road project performance between the DB and DBB projects have shown inconsistent results depending on the sample dataset used [31,32,33,34]. This study’s results are consistent with Shrestha et al. [31] and Tran et al. [34], demonstrating that the cost growth of the DB method is generally lower than that of the DBB methods with statistical significance. Using data of 423 projects in a non-U.S. country (Korea), this study can enrich the body of knowledge by providing internationally comparable results. Meanwhile, in developed countries, advanced project delivery systems (e.g., integrated project delivery and construction management at risk) have been utilized to overcome the fragmented nature of the construction industry [40]; however, due to institutional constraints or cultural differences, it has not been actively adopted in Korea and many other countries. In the future, with the widespread adoption of the advanced project delivery systems, comparative analyses among various types other than DB and DBB projects are required. Finally, regarding the project size, relatively larger cost and schedule growths for projects over USD 50 million were observed than those of smaller projects, due to multidimensional inherent risks and underestimation of the project complexity. Gransberg et al. [45] emphasized that traditional cost–schedule–technical dimensions should be expanded to include financing (the source of the project’s funding) and context (external factors impacting project development and progress) dimensions for complex transportation projects. Afterward, Dao et al. [46] further identified 22 complexity attributes and 34 detailed indicators (e.g., stakeholder management, project governance, fiscal planning, quality, legal, interfaces, execution targets, scope definition, and project resources) to understand and manage complex projects effectively. Moreover, most recently, Erol et al. [47] introduced a novel approach to incorporate complexity-based thinking into risk management and proposed an integrated risk assessment process to help the planning and management of mega-construction projects. Considering such research trends, tailored complexity-based approaches for road construction projects are required for future studies in terms of diagnosing complexity and analyzing the causal relationship between project complexity and performance.
Meanwhile, several studies in renowned journals have suggested factors affecting the cost and schedule performance as well as meaningful topics for future in-depth studies. Patanakul et al. [48] suggested six key characteristics of large-scale government projects by analyzing 39 public projects from the U.S., U.K., and Australia. These projects were (1) pursuing non-financial target benefits, (2) having a long-term product service life, (3) involving multiple stakeholders, (4) highly complex, (5) sensitive to political environment, and (6) following formal project management processes. Regarding the cost overruns, Siemiatycki [49] summarized traditional causes (e.g., poor prediction of future costs, changes in project scope, coordination errors and disputes, problems with project delivery system, inflation, project delays, poor project reporting and performance monitoring) and further emphasized that effective communication, widespread awareness, and dissemination of research outputs are essential to narrowing the gap between academia and practice. Regarding the schedule delays, Eriksson et al. [50] conducted an empirical study to investigate whether the flexibility-focused project management practices (collaboration, explorative learning, and adaptation) affect the schedule performance in complex infrastructure projects and verified that the flexibility-focused project management practices enhance the schedule performance. Focusing on a specific country (Zambia), Kaliba et al. [51] analyzed factors affecting cost escalation and schedule delays in road projects via interviews and questionnaire surveys. In the case of Zambia, the major causes of cost escalation were bad weather, scope changes, environmental costs, schedule delay, strikes, local government pressures, technical challenges, and inflation; and those of schedule delays were delayed payments, difficulties in financial process, contract variation, economic problems, procurement of materials and equipment, changes in drawings, and staffing problems. Qiang et al. [52] suggested three groups of factors (internal project conditions, external project conditions, and project performance objective factors) governing the selection of project delivery system and applied to China and developed countries. Among diverse stakeholders, the concepts of owner project capabilities [53] and project managers’ closing competence [54] were also highlighted and discussed in depth for project success. In addition, to scrutinize the multi-dimensionality of the project performance, Williams [55] and Yap et al. [56] developed causal loop diagrams to visualize and analyze the causal relationship among project success factors and design change factors, respectively. The above-mentioned studies provide useful insights for our follow-up studies to support successful project planning and management.

6. Conclusions and Recommendations

The development of road infrastructure is closely related to national competitiveness and presents significant socioeconomic impacts. However, road construction involves a large budget and is vulnerable to political, economic, social, and project-specific risks, which often result in cost overruns and schedule delays. Assessing the gap between the final performance and the planned performance, and providing feedback to similar projects in the future is essential for successful project planning and management. The aim of this study is to empirically analyze the cost and schedule growth of road construction projects, considering project characteristics. Using the national-level project performance data, the primary goal is to answer, “Do project characteristics influence the road project performance? If so, how different is the performance because of the project characteristics? How much do the project characteristics matter for road projects?” To this end, this study quantitatively analyzes the cost and schedule growth of 423 road construction projects, considering five project characteristics (facility type, construction type, bid type, contract type, and project size). The comparative performance analyses of road construction projects have not often been conducted, owing to the difficulties in collecting large sample data for a specific facility. The empirical results obtained from the Korean construction industry provide several useful implications for both academic and practical applications.
The performance results present distinctive features based on the project characteristics, which have not been analyzed sufficiently in the existing literature. Specifically, the results based on the facility type indicate that the cost growth of the national road was relatively large, whereas the schedule growth of the highway was relatively small. The performance of the highway was managed well when compared to the national and provincial roads, owing to its high levels of traffic and operational urgency. Considering the construction type, the schedule growth of the expansion and renovation was higher than that of the new construction, owing to additional work required for existing facilities. Regarding the bid type, the cost growth of the DB method (turnkey and alternative) was smaller than that of the DBB methods (qualification examination and lowest price), and presented superior cost-effectiveness. No significant differences were observed in either the cost or the schedule growth considering the contract type because the client selected an appropriate contract method based on the situation of each project. Regarding the project size, the cost and schedule growth for projects worth over USD 50 million were relatively large, despite the lack of statistical significance, and the project size affected the cost growth more than the schedule growth. These results present empirical references from the Korean construction industry that can help construction-related entities (clients, design consultants, and contractors) to estimate and manage the cost and schedule buffers of future projects by considering different project characteristics. Considering that most of the previous studies used small samples of less than 100 projects [31,32,33] based in the U.S. [31,32,33,34], this study could enrich the body of knowledge by providing internationally comparable results using 423 projects in countries other than the U.S. (i.e., a partial contribution to generalization). In particular, this study expanded the range of project characteristics (facility type, construction type, bid type, contract type, and project size), providing a foundation for international comparison studies. The results obtained in this study can contribute to successful project planning and management as part of the post-construction evaluation and management by feeding back the performance information to similar future projects at an early stage.
Despite the contributions of this study, it faces certain limitations which must be addressed in future studies. This study presents empirical results which indicate the difference in the cost and schedule growths based on the project characteristics; however, the results do not provide detailed information on the cause of these differences. Therefore, future studies must analyze and determine the multi-dimensional factors affecting the cost and schedule growth. Additionally, this study focuses only on the performance of road construction projects in a single country (Korea), which implies that the results of this study need to be compared with those of other countries (e.g., CII in the U.S. and MLIT in Japan). International comparative studies could enhance the understanding of common and country-specific performance features to support successful project planning and management.

Author Contributions

Conceptualization, methodology, analysis, writing, K.-W.L.; interpretation, writing, K.-H.K. All authors have read and agreed to the published version of the manuscript.

Funding

This research was supported by a grant funded by the Ministry of Land, Infrastructure, and Transport (MOLIT) of the Korean government (No. 202109543290301A).

Institutional Review Board Statement

Not applicable.

Informed Consent Statement

Not applicable.

Data Availability Statement

Not applicable.

Conflicts of Interest

The authors declare no conflict of interest.

References

  1. Li, H.; Liu, Y.; Peng, K. Characterizing the relationship between road infrastructure and local economy using structural equation modeling. Transp. Policy 2018, 61, 17–25. [Google Scholar] [CrossRef]
  2. Won, S.; Cho, S.E.; Kim, S. The neighborhood effects of new road infrastructure: Transformation of urban settlements and resident’s socioeconomic characteristics in Danang, Vietnam. Habitat Int. 2015, 50, 169–179. [Google Scholar] [CrossRef]
  3. Roebeling, P.; Saraiva, M.; Palla, A.; Gnecco, I.; Teotonio, C.; Fidelis, T.; Martins, F.; Alves, H.; Rocha, J. Assessing the socio-economic impacts of green/blue space, urban residential and road infrastructure projects in the Confluence (Lyon): A hedonic pricing simulation approach. J. Environ. Plan. Manag. 2017, 60, 482–499. [Google Scholar] [CrossRef]
  4. Kim, M. An analysis on economic effects of sectoral SOC investment. Korean J. Constr. Eng. Manag. 2014, 15, 120–127. [Google Scholar] [CrossRef] [Green Version]
  5. Schwab, K. The Global Competitiveness Report 2019. World Economic Forum, 2019. Available online: https://www.weforum.org/reports/how-to-end-a-decade-of-lost-productivity-growth (accessed on 30 June 2021).
  6. IHS Markit. Global Construction Outlook. Available online: https://ihsmarkit.com/products/global-construction-service.html (accessed on 30 June 2021).
  7. Lee, J.H.; Kim, H.W.; Lee, C. Development of road-extension rate index and international comparison of road stock. J. Korean Soc. Civ. Eng. 2009, 29, 357–362. [Google Scholar]
  8. Alnuaimi, A.S.; Taha, R.A.; Al Mohsin, M.; Al-Harthi, A.S. Causes, effects, benefits, and remedies of change orders on public construction projects in Oman. J. Constr. Eng. Manag. 2010, 136, 615–622. [Google Scholar] [CrossRef]
  9. Hsieh, T.Y.; Lu, S.T.; Wu, C.H. Statistical analysis of causes for change orders in metropolitan public works. Int. J. Proj. Manag. 2004, 22, 679–686. [Google Scholar] [CrossRef]
  10. Wu, C.H.; Hsieh, T.Y.; Cheng, W.L.; Lu, S.T. Grey relation analysis of causes for change orders in highway construction. Constr. Manag. Econ. 2004, 22, 509–520. [Google Scholar] [CrossRef]
  11. Wu, C.H.; Hsieh, T.Y.; Cheng, W.L. Statistical analysis of causes for design change in highway construction on Taiwan. Int. J. Proj. Manag. 2005, 23, 554–563. [Google Scholar] [CrossRef]
  12. Fernández-Sánchez, G.; Rodríguez-López, F. A methodology to identify sustainability indicators in construction project management—Application to infrastructure projects in Spain. Ecol. Indic. 2010, 10, 1193–1201. [Google Scholar] [CrossRef]
  13. Heravi, G.; Fathi, M.; Faeghi, S. Evaluation of sustainability indicators of industrial buildings focused on petrochemical projects. J. Clean. Prod. 2015, 109, 92–107. [Google Scholar] [CrossRef]
  14. Ugwu, O.O.; Haupt, T.C. Key performance indicators and assessment methods for infrastructure sustainability—A South African construction industry perspective. Build Env. 2007, 42, 665–680. [Google Scholar] [CrossRef]
  15. Yun, S.; Choi, J.; Oliveira, D.P.; Mulva, S.P.; Kang, Y. Measuring project management inputs throughout capital project delivery. Int. J. Proj. Manag. 2016, 34, 1167–1182. [Google Scholar] [CrossRef]
  16. Yun, S.; Choi, J.; Oliveira, D.P.; Mulva, S.P. Development of performance metrics for phase-based capital project benchmarking. Int. J. Proj. Manag. 2016, 34, 389–402. [Google Scholar] [CrossRef]
  17. Construction Industry Institute (CII). Available online: https://www.construction-institute.org/ (accessed on 30 June 2021).
  18. Project Assessment System (Ministry of Land, Infrastructure, Transport and Tourism, MLIT). Available online: https://www.mlit.go.jp/tec/hyouka/public/09_public_01.html (accessed on 30 June 2021).
  19. Post-Construction Evaluation Portal (Ministry of Land, Infrastructure and Transport, MOLIT). Available online: https://www.calspia.go.kr/portal/expostEval/expostEvalSummary.do (accessed on 30 June 2021).
  20. Kim, T.Y.; Park, H.S. Effective analysis framework for construction post evaluation. J. Korean Soc. Civ. Eng. 2016, 36, 1145–1152. [Google Scholar] [CrossRef] [Green Version]
  21. Lee, K.S.; Park, H.S. Development of the qualitative model for post construction evaluation. J. Korean Soc. Civ. Eng. 2018, 38, 733–739. [Google Scholar] [CrossRef]
  22. UK Industry Performance Report. Available online: https://constructingexcellence.org.uk/kpi-reports/ (accessed on 19 October 2021).
  23. Australian Infrastructure Audit. Available online: https://www.infrastructureaustralia.gov.au/publications/australian-infrastructure-audit-2019 (accessed on 19 October 2021).
  24. Sullivan, J.; El Asmar, M.; Chalhoub, J.; Obeid, H. Two decades of performance comparisons for design-build, construction manager at risk, and design-bid-build: Quantitative analysis of the state of knowledge on project cost, schedule, and quality. J. Constr. Eng. Manag. 2017, 143, 04017009. [Google Scholar] [CrossRef]
  25. Moon, H.; Kim, K.; Lee, H.S.; Park, M.; Williams, T.P.; Son, B.; Chun, J.Y. Cost performance comparison of design-build and design-bid-build for building and civil projects using mediation analysis. J. Constr. Eng. Manag. 2020, 146, 04020113. [Google Scholar] [CrossRef]
  26. Molenaar, K.R.; Songer, A.D.; Barash, M. Public-sector design/build evolution and performance. J. Manag. Eng. 1999, 15, 54–62. [Google Scholar] [CrossRef]
  27. Ibbs, C.W.; Kwak, Y.H.; Ng, T.; Odabasi, A.M. Project delivery systems and project change: Quantitative analysis. J. Constr. Eng. Manag. 2003, 129, 382–387. [Google Scholar] [CrossRef]
  28. Perkins, R.A. Sources of changes in design-build contracts for a governmental owner. J. Constr. Eng. Manag. 2009, 135, 588–593. [Google Scholar] [CrossRef]
  29. Hwang, B.G.; Liao, P.C.; Leonard, M.P. Performance and practice use comparisons: Public vs. private owner projects. KSCE J. Civ. Eng. 2011, 15, 957–963. [Google Scholar] [CrossRef]
  30. Chen, Q.; Jin, Z.; Xia, B.; Wu, P.; Skitmore, M. Time and cost performance of design-build projects. J. Constr. Eng. Manag. 2016, 142, 04015074. [Google Scholar] [CrossRef] [Green Version]
  31. Shrestha, P.P.; Migliaccio, G.C.; O’Connor, J.T.; Gibson, G.E. Benchmarking of large design-build highway projects: One-to-one comparison and comparison with design-bid-build projects. Transp. Res. Rec. J. Transp. Res. Board 2007, 1994, 17–25. [Google Scholar] [CrossRef]
  32. Shrestha, P.P.; O’Connor, J.T.; Gibson, G.E. Performance comparison of large design-build and design-bid-build highway projects. J. Constr. Eng. Manag. 2012, 138, 1–13. [Google Scholar] [CrossRef]
  33. Minchin, R.E.; Li, X.; Issa, R.R.; Vargas, G.G. Comparison of cost and time performance of design-build and design-bid-build delivery systems in Florida. J. Constr. Eng. Manag. 2013, 139, 04013007. [Google Scholar] [CrossRef]
  34. Tran, D.Q.; Diraviam, G.; Minchin, R.E. Performance of highway design-bid-build and design-build projects by work types. J. Constr. Eng. Manag. 2018, 144, 04017112. [Google Scholar] [CrossRef]
  35. Ministry of Land, Infrastructure and Transport. Yearbook of Road Statistics 2020. Publication No. 11-1613000-000029-1. Available online: http://stat.molit.go.kr/portal/cate/statFileView.do?hRsId=59&hF (accessed on 30 June 2021).
  36. Nguyen, H.D. A Two-Sample Kolmogorov-Smirnov-Like Test for Big Data. In Communications in Computer and Information Science; Springer: Gateway, Singapore, 2017; pp. 89–106. [Google Scholar]
  37. Shapiro, S.S.; Wilk, M.B. An analysis of variance test for normality (complete samples). Biometrika 1965, 52, 591–611. [Google Scholar] [CrossRef]
  38. Osei-Kyei, R.; Chan, A.P.C. Perceptions of stakeholders on the critical success factors for operational management of public-private partnership projects. Facilities 2017, 35, 21–38. [Google Scholar] [CrossRef]
  39. Noorzai, E. Performance analysis of alternative contracting methods for highway construction projects: Case study for Iran. J. Infrastruct. Syst. 2020, 26, 04020003. [Google Scholar] [CrossRef]
  40. Ibrahim, M.W.; Hanna, A.; Kievet, D. Quantitative comparison of project performance between project delivery systems. J. Manag. Eng. 2020, 36, 04020082. [Google Scholar] [CrossRef]
  41. Franz, B.; Molenaar, K.R.; Roberts, B.A.M. Revisiting project delivery system performance from 1998 to 2018. J. Constr. Eng. Manag. 2020, 146, 04020100. [Google Scholar] [CrossRef]
  42. Lam, T.; Gale, K. Highway maintenance: Impact of framework agreements upon project financial performance. Constr. Manag. Econ. 2014, 32, 460–472. [Google Scholar] [CrossRef]
  43. Luo, L.; He, Q.; Jaselskis, E.J.; Xie, J. Construction project complexity: Research trends and implications. J. Constr. Eng. Manag. 2017, 143, 04017019. [Google Scholar] [CrossRef]
  44. Williams, T.M. The need for new paradigms for complex projects. Int. J. Proj. Manag. 1999, 17, 269–273. [Google Scholar] [CrossRef] [Green Version]
  45. Gransberg, D.D.; Shane, J.S.; Strong, K.; del Puerto, C.L. Project complexity mapping in five dimensions for complex transportation projects. J. Manag. Eng. 2013, 29, 316–326. [Google Scholar] [CrossRef]
  46. Dao, B.; Kermanshachi, S.; Shane, J.; Anderson, S.; Hare, E. Exploring and assessing project complexity. J. Constr. Eng. Manag. 2017, 143, 04016126. [Google Scholar] [CrossRef] [Green Version]
  47. Erol, H.; Dikmen, I.; Atasoy, G.; Birgonul, M.T. Exploring the relationship between complexity and risk in megaconstruction projects. J. Constr. Eng. Manag. 2020, 146, 04020138. [Google Scholar] [CrossRef]
  48. Patanakul, P.; Kwak, Y.H.; Zwikael, O.; Liu, M. What impacts the performance of large-scale government projects? Int. J. Proj. Manag. 2016, 34, 452–466. [Google Scholar] [CrossRef]
  49. Siemiatycki, M. The making and impacts of a classic text in megaproject management: The case of cost overrun research. Int. J. Proj. Manag. 2018, 36, 36–362. [Google Scholar] [CrossRef]
  50. Eriksson, P.E.; Larsson, J.; Pesämaa, O. Managing complex projects in the infrastructure sector—A structural equation model for flexibility-focused project management. Int. J. Proj. Manag. 2017, 35, 1512–1523. [Google Scholar] [CrossRef]
  51. Kaliba, C.; Muya, M.; Mumba, K. Cost escalation and schedule delays in road construction projects in Zambia. Int. J. Proj. Manag. 2009, 27, 522–531. [Google Scholar] [CrossRef]
  52. Qiang, M.; Wen, Q.; Jiang, H.; Yuan, S. Factors governing construction project delivery selection: A content analysis. Int. J. Proj. Manag. 2015, 33, 1780–1794. [Google Scholar] [CrossRef]
  53. Winch, G.; Leiringer, R. Owner project capabilities for infrastructure development: A review and development of the “strong owner” concept. Int. J. Proj. Manag. 2016, 34, 271–281. [Google Scholar] [CrossRef] [Green Version]
  54. Wen, Q.; Qiang, M. Project managers’ competences in managing project closing. Proj. Manag. J. 2019, 50, 1–15. [Google Scholar] [CrossRef]
  55. Williams, T. Identifying success factors in construction projects: A case study. Proj. Manag. J. 2016, 47, 97–112. [Google Scholar] [CrossRef]
  56. Yap, J.B.H.; Skitmore, M.; Gray, J.; Shavarebi, K. Systemic view to understanding design change causation and exploitation of communications and knowledge. Proj. Manag. J. 2019, 50, 1–18. [Google Scholar] [CrossRef] [Green Version]
Figure 1. Research process and description.
Sustainability 13 13694 g001
Figure 2. Histogram of cost growth.
Sustainability 13 13694 g002
Figure 3. Histogram of schedule growth.
Sustainability 13 13694 g003
Table 1. Studies comparing the cost and schedule performance between DB and DBB projects.
ReferencesComparison CriteriaSample Size (DB and DBB)Project Location (Country)Findings in the Cost and Schedule Performance
Mixed Building and Civil Projects (6 Studies)
Moon et al. [25]Project delivery system197 projects (82 and 117)KoreaThe cost performance of DBB was better than that of DB during project life cycle.
Molenaar et al. [26]Public-sector DB method104 projects (104 and N/A)U.S.A total of 59% of the DB projects showed less than 2% of the cost growth. A total of 77% of the DB projects showed less than 2% of the schedule growth.
Ibbs et al. [27]Project delivery system54 projects (24 and 30)Americas and Middle EastThe cost growth of DB was 7.8% higher than that of DBB. The schedule growth of DB was 2.4% lower than that of DBB.
Perkins [28]Project delivery system34 projects (14 and 20)U.S.The cost growth of DB was 3.5% lower than that of DBB during construction phase.
Hwang et al. [29]Project delivery system and industry group341 projects (89 and 252)US and 9 countriesBoth the cost and schedule performance of DB were better than those of DBB. In general, private owner projects outperform those of public owner projects in most cases.
Chen et al. [30]Project type, owner, procurement method, contract method, LEED level418 projects (418 and N/A)U.S.More than 50% of the DB projects showed cost overrun. More than 75% of the DB projects completed on time or before schedule.
Road Projects (4 Studies)
Sherestha et al. [31]Project delivery system15 projects (4 and 11)U.S.The cost growth of DB was 9.6% lower than that of DBB. The schedule growth of DB was 5.3% lower than that of DBB.
Sherestha et al. [32]Project delivery system22 projects (6 and 16)U.S.The cost growth of DB was 1.5% higher than that of DBB. The schedule growth of DB was 15.4% higher than that of DBB.
Minchin et al. [33]Project delivery system60 projects (30 and 30)U.S.The cost performance of DBB was better than that of DB, whereas no difference was observed between the two in terms of the schedule performance.
Tran et al. [34]Project delivery system and construction type278 projects (139 and 139)U.S.Both the cost and schedule performance of DB were better than those of DBB for miscellaneous construction and 3R projects. No differences were observed between the two for other construction types.
Table 2. Characteristics of sample projects.
CharacteristicsNumber of Road Construction Projects (% of Total)
Facility typeNational roadProvincial roadHighway
340 (80.4%)49 (11.6%)34 (8.0%)
Construction typeNew constructionExpansion and renovation
177 (41.8%)245 (57.9%)
Bid typeQualification
examination
Lowest priceTurnkey and alternative
284 (67.1%)103 (24.3%)21 (5.0%)
Contract typeOpen competitionRestrictive competition
151 (35.7%)258 (61.0%)
Project size
(USD million)
≤5051–100≥101
58 (13.7%)226 (53.4%)139 (32.9%)
Project duration
(year)
≤5.05.1–8.0≥8.1
44 (10.4%)218 (51.5%)161 (38.1%)
Table 3. Descriptive statistics of sample projects: Cost growth.
CharacteristicMeanS.D.Min.Q1Med.Q3Max.
Total sample28.5%28.3%−48.2%13.7%22.6%35.0%295.7%
Facility type
National road29.9%28.0%−19.7%15.0%23.4%35.9%295.7%
Provincial road24.5%35.4%−48.2%4.6%17.8%30.5%153.5%
Highway19.7%16.4%−2.2%8.8%19.3%27.2%83.1%
Construction type
New construction26.0%23.5%−19.7%11.1%21.6%34.8%153.5%
Expansion and renovation30.2%31.3%−48.2%14.6%23.4%35.1%295.7%
Bid type
Qualification examination30.0%31.2%−48.2%14.2%22.9%37.1%295.7%
Lowest price26.0%19.5%−19.7%15.1%22.0%31.7%111.9%
Turnkey and alternative16.5%10.6%−0.2%8.4%14.5%25.1%35.0%
Contract type
Open competition32.6%35.3%−19.7%15.0%23.4%38.3%295.7%
Restrictive competition26.6%23.0%−48.2%13.7%22.0%34.3%131.0%
Project size (USD million)
≤5023.1%26.4%−48.2%7.7%19.7%32.6%105.0%
51–10029.2%30.6%−19.7%14.2%22.0%34.8%295.7%
≥101~29.5%25.0%−22.7%15.4%25.1%37.1%153.5%
Table 4. Descriptive statistics of sample projects: Schedule growth.
CharacteristicMeanS.D.Min.Q1Med.Q3Max.
Total sample60.7%57.5%−37.4%14.9%53.5%89.4%357.9%
Facility type
National road66.3%53.3%−37.4%25.6%60.5%94.7%301.4%
Provincial road63.9%78.4%−4.6%3.8%51.9%80.1%357.9%
Highway−0.2%9.3%−28.6%0.0%0.0%0.0%32.3%
Construction type
New construction54.9%63.2%−37.4%0.6%43.3%84.2%357.9%
Expansion and renovation64.7%52.8%−20.0%25.5%59.1%94.1%301.4%
Bid type
Qualification examination62.3%57.7%−37.4%17.9%57.2%91.3%357.9%
Lowest price56.9%51.1%−12.8%13.7%51.5%88.8%222.1%
Turnkey and alternative42.4%50.5%−20.2%0.0%25.6%77.4%177.0%
Contract type
Open competition63.2%66.4%−20.0%13.9%53.2%87.7%357.9%
Restrictive competition60.1%50.9%−37.4%18.4%57.2%90.8%230.6%
Project size (USD million)
≤5054.2%63.0%−37.4%6.5%43.0%82.7%277.1%
51–10061.1%55.0%−27.8%20.2%52.1%83.7%301.4%
≥10162.9%59.4%−28.6%0.7%59.1%98.5%357.9%
Table 5. Kruskal–Wallis test results by facility type: Ranks.
Facility TypeCost GrowthSchedule Growth
Mean RankRankMean RankRank
National road222.013230.583
Provincial road172.822198.272
Highway168.32146.031
Table 6. Kruskal–Wallis test results by facility type: Test statistics.
StatisticCost GrowthSchedule Growth
Chi-square11.65571.257
Degrees of freedom22
Asymptotic significance0.0030.000
Table 7. Kruskal–Wallis test results by facility type: Post-hoc comparisons.
PerformanceFacility Type
(I)
Facility Type
(J)
Group Difference
(I–J)
S.E.Sigificance
Cost growthHighwayProvincial road4.49327.2881.000
HighwayNational road53.69121.9900.044
Provincial roadNational road49.19818.6810.025
Schedule growthHighwayProvincial road152.23627.2640.000
HighwayNational road184.54721.9700.000
Provincial roadNational road32.31118.6650.250
Table 8. Mann–Whitney U test results by construction type: Ranks.
Construction TypeCost GrowthSchedule Growth
Mean RankRankMean RankRanks
New construction200.881192.151
Expansion and renovation219.172225.482
Table 9. Mann–Whitney U test results by construction type: Test statistics.
StatisticCost GrowthSchedule Growth
Mann–Whitney U19,802.50018,257.500
Wilcoxon W35,555.50034,010.500
Z−1.521−2.773
Asymptotic significance (2-tailed)0.1280.006
Table 10. Kruskal–Wallis test results by bid type: Ranks.
Bid TypeCost GrowthSchedule Growth
Mean RankRankMean RankRank
Qualification examination210.273209.323
Lowest price201.472199.312
Turnkey and alternative141.291164.811
Table 11. Kruskal–Wallis test results by bid type: Test statistics.
StatisticCost GrowthSchedule Growth
Chi-square6.7843.058
Degrees of freedom22
Asymptotic significance0.0340.217
Table 12. Kruskal–Wallis test results by bid type: Post-hoc comparisons.
PerformanceBid Type
(I)
Bid Type
(J)
Group Difference
(I–J)
S.E.Sigificance
Cost growthTurnkey and alternativeLowest price60.18028.2350.099
Turnkey and alternativeQualification examination68.98926.6670.029
Lowest priceQualification examination8.80913.5641.000
Table 13. Mann–Whitney U test results by contract type: Ranks.
Construction TypeCost GrowthSchedule Growth
Mean RankRankMean RankRanks
Open competition215.682200.881
Restrictive competition198.751207.412
Table 14. Mann–Whitney U test results by contract type: Test statistics.
StatisticCost GrowthSchedule Growth
Mann–Whitney U17,866.00018,856.500
Wilcoxon W51,277.00030,332.500
Z−1.398−0.540
Asymptotic significance (2-tailed)0.1620.589
Table 15. Kruskal–Wallis test results by project size: ranks.
Project Size
(USD Million)
Cost GrowthSchedule Growth
Mean RankRankMean RankRank
~50182.121192.191
51~100211.982215.082
101~224.503215.263
Table 16. Kruskal–Wallis test results by project size: test statistics.
StatisticCost GrowthSchedule Growth
Chi-square4.9191.768
Degrees of freedom22
Asymptotic significance0.0850.413
Publisher’s Note: MDPI stays neutral with regard to jurisdictional claims in published maps and institutional affiliations.

