Article

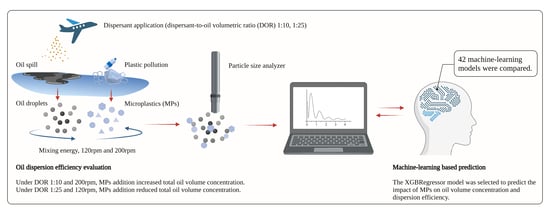
Impact of Microplastics on Oil Dispersion Efficiency in the Marine Environment

1
Department of Civil Engineering, Faculty of Engineering and Applied Science, Memorial University of Newfoundland, St. John’s, NL A1B 3X5, Canada
2
State Key Laboratory of Marine Pollution (SKLMP), School of Energy and Environment, City University of Hong Kong, Hong Kong SAR, China
3
Fisheries and Oceans Canada, Ecosystem Science, Ottawa, ON K1A 0E6, Canada
*
Author to whom correspondence should be addressed.
Sustainability 2021, 13(24), 13752; https://doi.org/10.3390/su132413752
Submission received: 29 October 2021 / Revised: 9 December 2021 / Accepted: 11 December 2021 / Published: 13 December 2021
(This article belongs to the Special Issue Sustainable Ecological Environment Restoration)

Abstract

:
Oil spill and microplastics (MPs) pollution has raised global concerns, due to the negative impacts on ocean sustainability. Chemical dispersants were widely adopted as oil-spill-treating agents. When MPs exist during oil dispersion, MP/oil-dispersant agglomerates (MODAs) are observed. This study explored how MPs affect oil-dispersion efficiency in oceans. Results showed that, under dispersant-to-oil volumetric ratio (DOR) 1:10 and mixing energy of 200 rpm, the addition of MPs increased the oil droplet size, total oil volume concentration, and oil-dispersion efficiency. Under DOR 1:25 and mixing energy of 120 rpm, the addition of MPs increased the oil droplet size but resulted in a decrease of total oil volume concentration and dispersion efficiency. Compared with the oil volume concentration, the oil droplet size may no longer be an efficient parameter for evaluating oil-dispersion efficiency with the existence of MODAs. A machine learning (ML)-based XGBRegressor model was further constructed to predict how MPs affected oil volume concentration and oil-dispersion efficiency in oceans. The research outputs would facilitate decision-making during oil-spill responses and build a foundation for the risk assessment of oil and MP co-contaminants that is essential for maintaining ocean sustainability.

Graphical Abstract

1. Introduction

Microplastics (MPs), defined as plastic particles between 1 and 5000 μm in size, have been widespread in the marine environment [1,2]. They can transfer from the seawater surface to deep-sea [3,4,5]. MP concentration on the sea surface of the Midwest Pacific Ocean was ranged from 6028 to 95,335 particles/km2 [6]. Meanwhile, a recent study suggested that almost 14 million tons of MPs resided on the seafloor of the Great Australian Bight [7]. MPs could serve as vectors for organic contaminants owing to their strong hydrophobicity and large specific surface area [8]. MPs have a strong sorption capacity to both phenanthrene and nitrobenzene, and the sorption behaviors were altered when particle size decreased [9]. Moreover, the bioaccumulation of MPs and organic co-contaminants led to potential toxic effects on marine organisms. Rainbowfish (Melanotaenia fluviatilis) could accumulate the MPs and sorbed polybrominated diphenyl ethers (PBDEs) co-contaminants to a high concentration after 21 days of exposure [10]. The larvae growth of zebrafish was negatively affected by the accumulation of the MPs and butylated hydroxyanisole (BHA) co-contaminants [11]. Moreover, MPs incorporated with halogenated contaminants posed toxic effects on the European seabass [12]. Moreover, oil spills were accidentally occurred during offshore oil production and have raised a global concern due to their severe negative impacts on ocean sustainability [13,14]. Recent studies reported the abundance of MPs in oil-contaminated regions, such as the Persian Gulf [15,16,17,18,19,20,21,22]. The MP concentration in intertidal sediments of the Persian Gulf was 36−228 particles/m2 [23,24], as it is one of the largest oil-producing regions. The interaction between MPs and oil in the marine environment is thus worth being explored.
Chemical dispersants have been widely recognized as effective marine oil spill treating agents, as they could break oil into small droplets and promote oil mitigation [25,26,27]. Oil droplet size was an important parameter to evaluate the dispersion efficiency [28,29]. Studies found that the oil droplet size could be affected by ocean conditions (e.g., mixing energy and salinity), oil properties (e.g., viscosity), and dispersant-to-oil volumetric ratio (DOR) [30]. Pan et al. [31] evaluated the impact of mixing energy on oil droplet size and found that oil droplet size decreased with mixing energy increasing. Heavy oil droplet size was larger than that of light oil during the oil-dispersion process in seawater [14]. In addition, the dosage of dispersant applied may vary (DOR of 1:10, 1:25) for the surface release during oil-spill treatment [27,28,30], which could also affect oil droplet size. Li et al. [32] found that the oil droplet size would be reduced from 600.00 to 10.00 μm by increasing DOR from 0 to 1:25. However, rare studies explored the impact of suspended particles, such as MPs, on oil droplet size in the marine environment. Understanding how the existence of MPs affects droplet size distribution of chemically dispersed oil would be meaningful for marine oil-spill response operations.
Researchers started to investigate the interactions between MPs and crude oil in oceans in 2020 [14,33,34,35]. Yang et al. [14] studied the effect of MP concentration and MP weathering degree on oil droplet size. The existence of MP/oil-dispersant agglomerates (MODAs) was confirmed for the first time. Results showed that the droplet size of light oil kept stable at 3.00–4.00 μm, but that of heavy oil rose from 12.09 to 20.10 μm with the MP concentration increasing. Feng et al. [33] studied the effect of aged MPs on oil behavior in the water–sand system and found that the heavy oil droplet size in the aqueous phase increased with the MP aging degree rising. However, there is little information regarding the effect of MPs on oil droplet size under different DORs and mixing energy levels. Moreover, in the presence of MPs, the oil droplets captured by a particle-size analyzer, such as the Laser In Situ Scattering and Transmissometry (LISST-200X), may include both droplets of oil and oil-associated MODAs. Under this circumstance, it is worth evaluating if the oil droplet size may still be an efficient parameter for evaluating oil-dispersion efficiency.
In addition to oil droplet size, the oil volume concentration in seawater was another important parameter for evaluating dispersion efficiency [36]. The most used equipment for oil volume concentration measurement was LISST-200X [31]. However, the oil volume concentration detected by LISST-200X was not representative, especially for large oil droplets. The equipment detection range was 1.00–500.00 μm, and the range was divided into 36 bins (e.g., 1.00–1.48 μm was bin #1, 1.48–1.74 μm was bin #2, etc.) [37]. The size interval rose with the bin number increasing, and the largest size interval occurred at bin #36 (420.00–500.00 μm). Under each bin, an oil volume concentration of the specific droplet size range would be obtained. For example, if the oil volume concentration at bin #36 was 3.00 μL/L, the volume concentration of all oil droplets within 420.00–500.00 μm would be 3.00 μL/L by default, which was inaccurate. Thus, it is necessary to predict the oil volume concentration within the size interval of 420.00–500.00μm (e.g., at oil droplet size of 430.00, 440.00, and 450.00 μm).
Essentially, predicting the oil volume concentration within the size interval was the interpolation, and the relationship between bins and oil volume concentration remained unknown, i.e., variables could have linear or non-linear relationships. The prediction should emphasize the occurrence of the outcome rather than the association between each variable. Machine learning (ML) has been identified as a favorable tool to realize the prediction, since they do not need to pre-specify a model structure, but instead seek the best fits in specific limits (specific to the individual algorithm) [38]. Specifically, a supervised ML could be applied to perform a regression task. Various ML regression algorithms have been generated to perform prediction, and each has advantages and disadvantages. For example, the support vector machine (SVM) is suitable for high-dimensional data but has poor noise resilience [39], and the random forest (RF) can deal with high-dimensional data with built-in feature importance metric but tends to overfit noisy regression problems [40]. In terms of oil volume concentration interpolation, multiple ML regression algorithms thus need to be screened before further evaluating the modeling performance.
This study aimed at exploring the impact of MPs on oil-dispersion efficiency at different mixing energy levels and DORs to simulate various ocean conditions (i.e., the seawater surface layer and the breaking wave) and dispersant application conditions during oil spill responses. Polyethylene (PE) MPs, a light crude oil, and Corexit 9500A dispersant were adopted to form MODAs. The surface morphology of MPs and MODA was characterized through scanning electron microscopy (SEM). Oil droplet size was determined by using LISST-200X. The oil volume concentration was used to represent oil-dispersion efficiency. Under different mixing energy levels (120 and 200 rpm) and DORs (1:10 and 1: 25), the impact of MP concentration on oil droplet size and oil volume concentration was investigated. For the first time, the applicability of oil droplet size as a parameter to evaluate oil-dispersion efficiency with the existence of MODAs was evaluated. The ML-based regression model was constructed as a new tool for the prediction of oil volume concentration under different MP concentrations. The findings would greatly facilitate evaluating how MPs affected oil-dispersion efficiency in oceans and promote the development of sustainable marine oil-spill response operations.

2. Materials and Methods

2.1. Chemicals and Materials

Polyethylene (PE) MPs with a mean size of 6.00–8.50 μm were obtained from Micro Powders Inc. (Tarrytown, NY, USA). A light crude oil (API gravity 33.20) was applied. Corexit EC9500A, the most widely used chemical dispersant, was obtained from Nalco Environmental Solutions LLC (Sugar Land, TX, USA). Sea salt was bought from Millipore Sigma (Oakville, ON, Canada). The synthetic seawater with a salinity of 34 practical salinity units (psu) was prepared by dissolving the sea salt in 1 L of deionized water. Salinity was measured by the Orion Star™ A222 conductivity portable meter (Thermo Fisher Scientific, Bedford, MA, USA). Synthetic seawater was filtered through a 0.20 μm membrane to remove suspended particles that may affect oil droplet size detection.

2.2. Experimental Design

Experiments were conducted based on the standard Baffled Flask Test (BFT) protocol [41] and the method proposed by Yang et al. [14]. The experimental process is shown in Figure 1. To study the impact of MP concentration on oil droplet size and volume concentration, a 100 μL of oil was released into 120 mL of synthetic seawater, and Corexit EC9500A was then added to achieve the DOR of 1:10 and 1:25. The 10, 20, 30, 40, 50, 70, 100, 130, or 150 mg of PE MPs was then added into the oil/dispersant/seawater mixture, representing the MP concentration of 83, 167, 250, 333, 417, 583, 833, 1083, or 1250 mg/L, respectively. The baffled flask was placed on the orbital shaker (ELMI DOS-20L) (Newbury Park, CA, USA) at 120, 150, 200, and 300 rpm to mix for 2 h [31], and kept stationary for 10 min. A 5 mL sample was collected and diluted 20 times with deionized water for oil droplet size and oil volume concentration measurement. The blank experiment was conducted without MPs addition. The BFT cannot fully represent the field tests, as it is difficult to simulate the infinite possibility of dilution in the open sea, but the BFT provides an easy and widely adopted way to compare dispersant efficiency in the laboratory.

2.3. Sample Analysis

Surface-properties characterization: The surface morphology of MPs and a selected MODA was observed by using an FEI Quanta 650 FEG SEM (Thermo Fisher Scientific, Hillsboro, OR, USA) [14]. Gold was used to coat samples to improve their conductivity before SEM tests. MP water contact angle reflected MP hydrophobicity. It was evaluated through the optical contact angle measuring and contour analysis systems (OCA 15EC) (DataPhysics Instruments, BW, Filderstadt, Germany). In brief, an 8 μL of deionized water was released onto the MP pellet, and the water contact angle was obtained by averaging the left and right contact angles of MP pellet [42,43]. The MP pellet was prepared by adding 48 mg MPs into an EQ-Die-06D-B Dry Pellet Pressing Die (MTI Corporation, Richmond, CA, USA) and pressing the MP sample under a 1-ton Arbor Press (Princess Auto, Newfoundland, and Labrador, Canada) [35].
Oil droplet size and volume concentration measurement: Oil droplet size was measured by a LISST-200X (Sequoia Scientific, Bellevue, WA, USA). Mean oil droplet size was used to represent oil droplet size. Oil volume concentration within the size range of 1.00–500.00 μm was also obtained from the LISST-200X.
Quality assurance and quality control (QA/QC): QA/QC protocols were followed to guarantee the repeatability and validation of results. All the experiments were conducted in duplicate. Standard and well-recognized methodologies were applied in this study [14,41].

2.4. Machine Learning Aided Modeling

The pipeline of building the ML regression model followed data preprocessing, meta-ML regression algorithms training, GridSearchCV, model evaluation, and selection. The experiments were conducted under two DOR sets, 1:10 and 1:25. During data preprocessing, two datasets were created for building regression models. At the DOR of 1:10 and mixing energy of 200 rpm, the oil volume concentration under nine different MP concentrations was assorted as Dataset #1 (made of 36 instances by nine features). At a DOR of 1:25 and mixing energy of 120 rpm, the oil volume concentration under seven different MP concentrations was assorted as Dataset #2 (made of 36 instances by seven features). In terms of ML regression training, 42 algorithms were selected. GridSearchCV was applied to obtain the best combination of hyperparameters, and stratified fivefold was used to split the datasets for cross-validation [44]. The training results of the 42 algorithms were plotted through the Seaborn library ranked by their R-square values. The ML algorithm with the highest R-square value led to the optimal model to perform the prediction of oil volume concentration. All models were implemented in Python V3.8 and run on GTX 2060 super GPU.

3. Results and Discussion

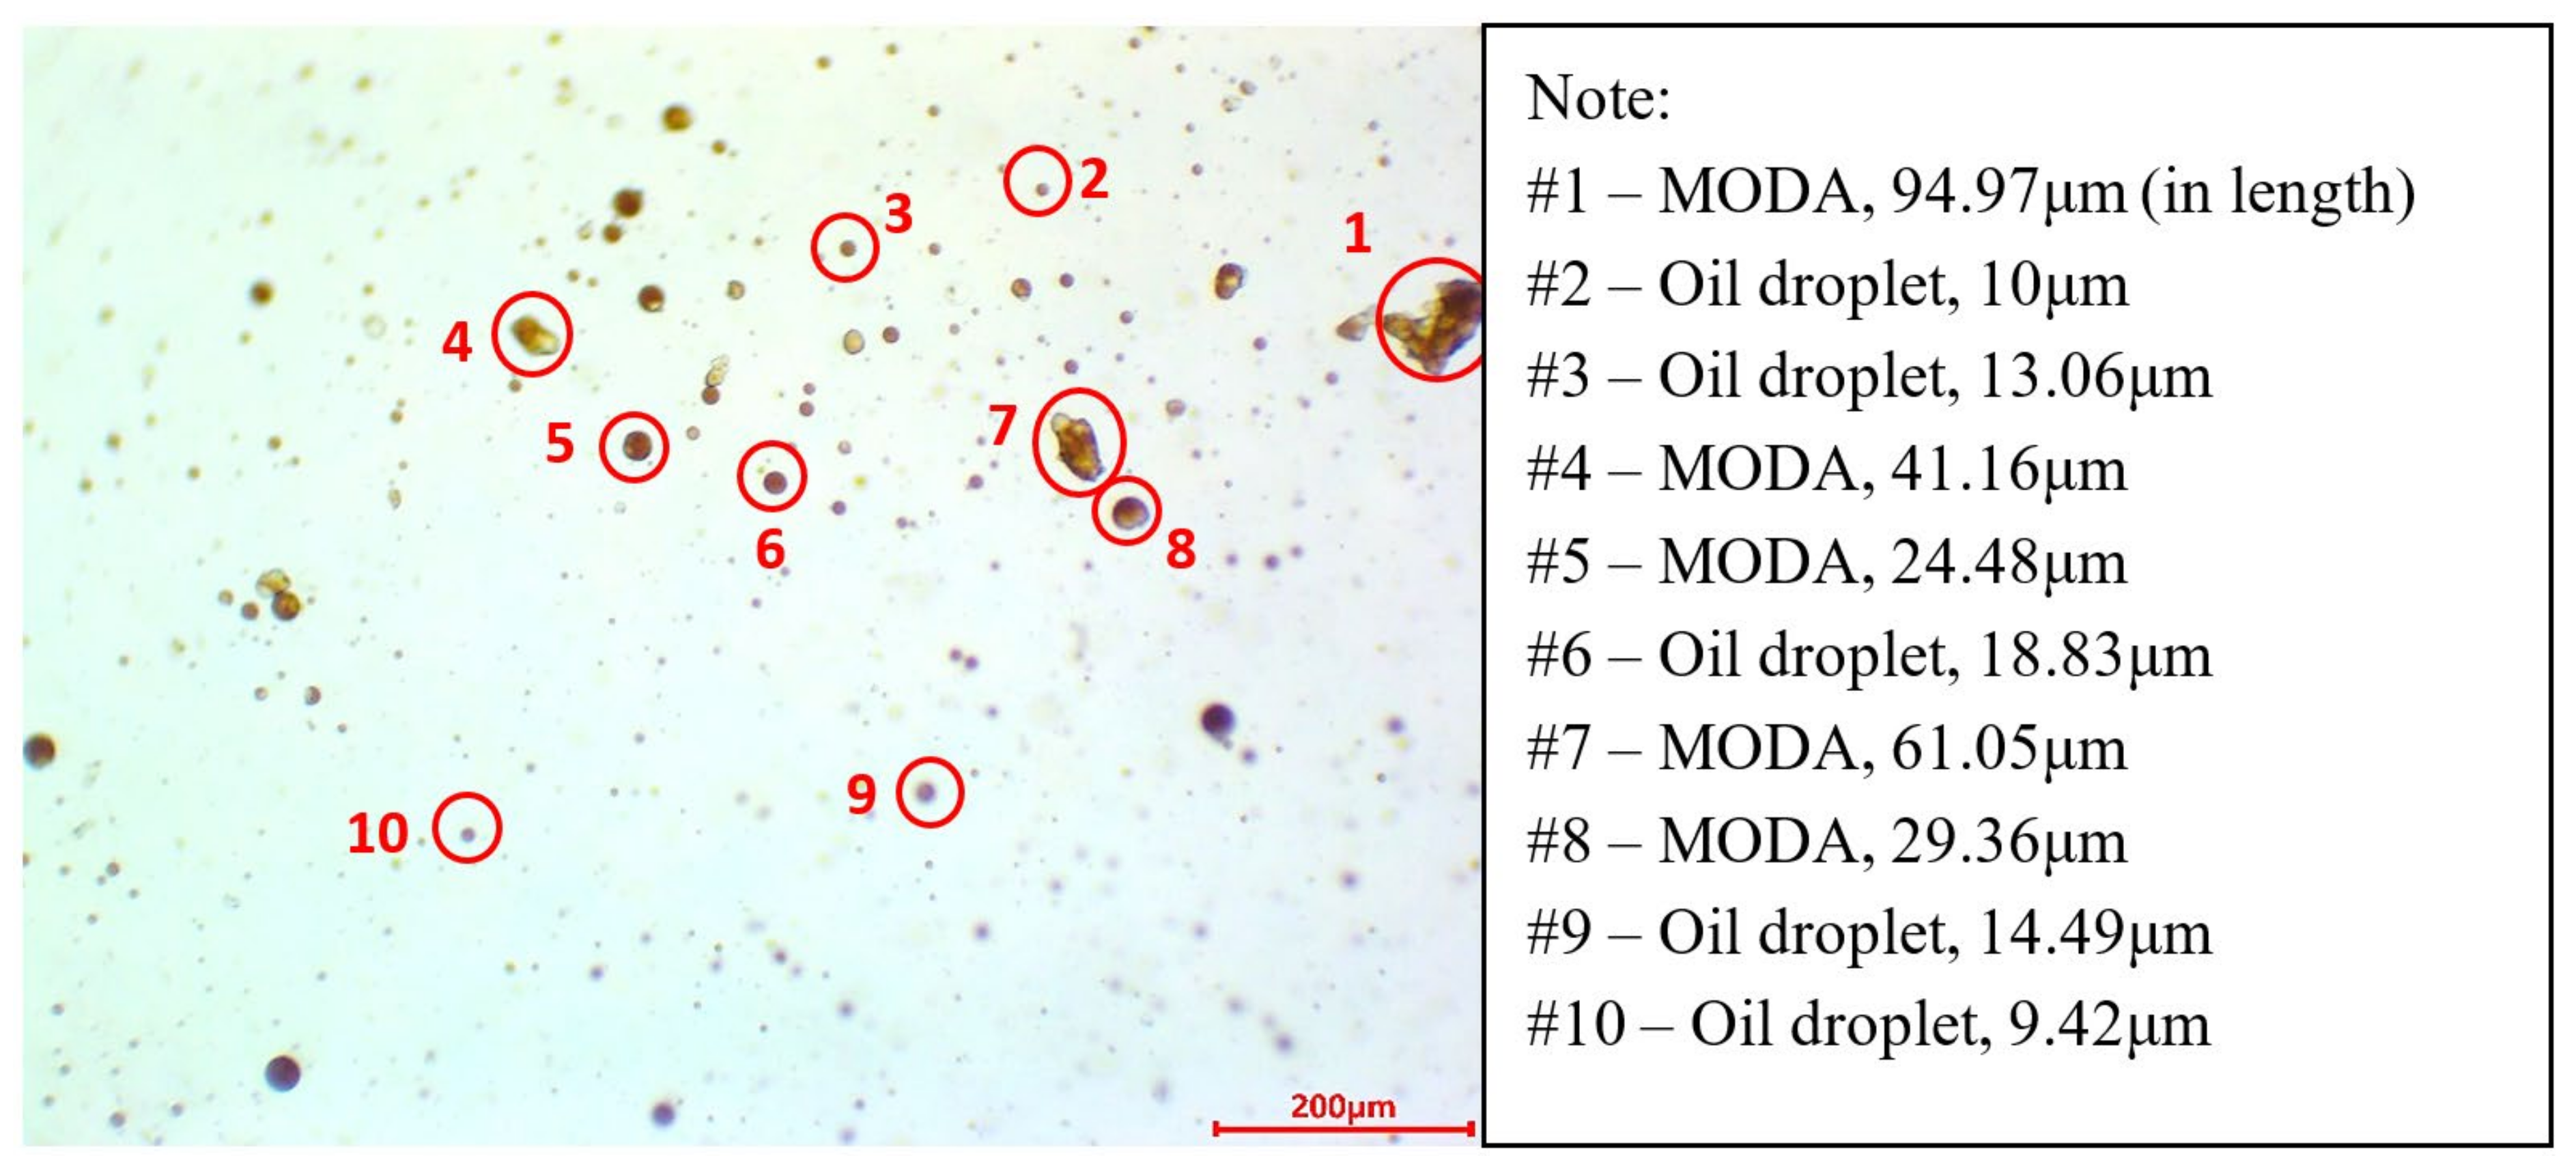
3.1. Characterization of MPs and MODA

The surface morphology of MPs and MODA was observed through an SEM. As shown in Figure 2a, the MP shape was irregular, and its size ranged from a few microns to tens of microns. The MP surface was rough and uneven with layered structures. The edge of each MP particle was clear and sharp, and the MP particle was distinct (Figure 2b). The MP morphology was similar to that in previous studies [14]. The surface morphology of MODA was completely different from MPs. In Figure 2c, the structure of MODA was firm due to the existence of a large amount of oil. MODA size was much larger than MP particles, as many MPs were agglomerated in MODA (Figure 2d). Oil-slick-covered MP surface in MODA, leading to the rounded edge of MODA.
The hydrophilicity of MPs was evaluated through the MP water contact angle. The hydrophilic particles have a water contact angle of <90° [45]. In Table 1, the water contact angle of MPs was 106.6°, indicating that MPs were hydrophobic. Since crude oil was also hydrophobic, it could contact the hydrophobic MPs in seawater to form MODA.

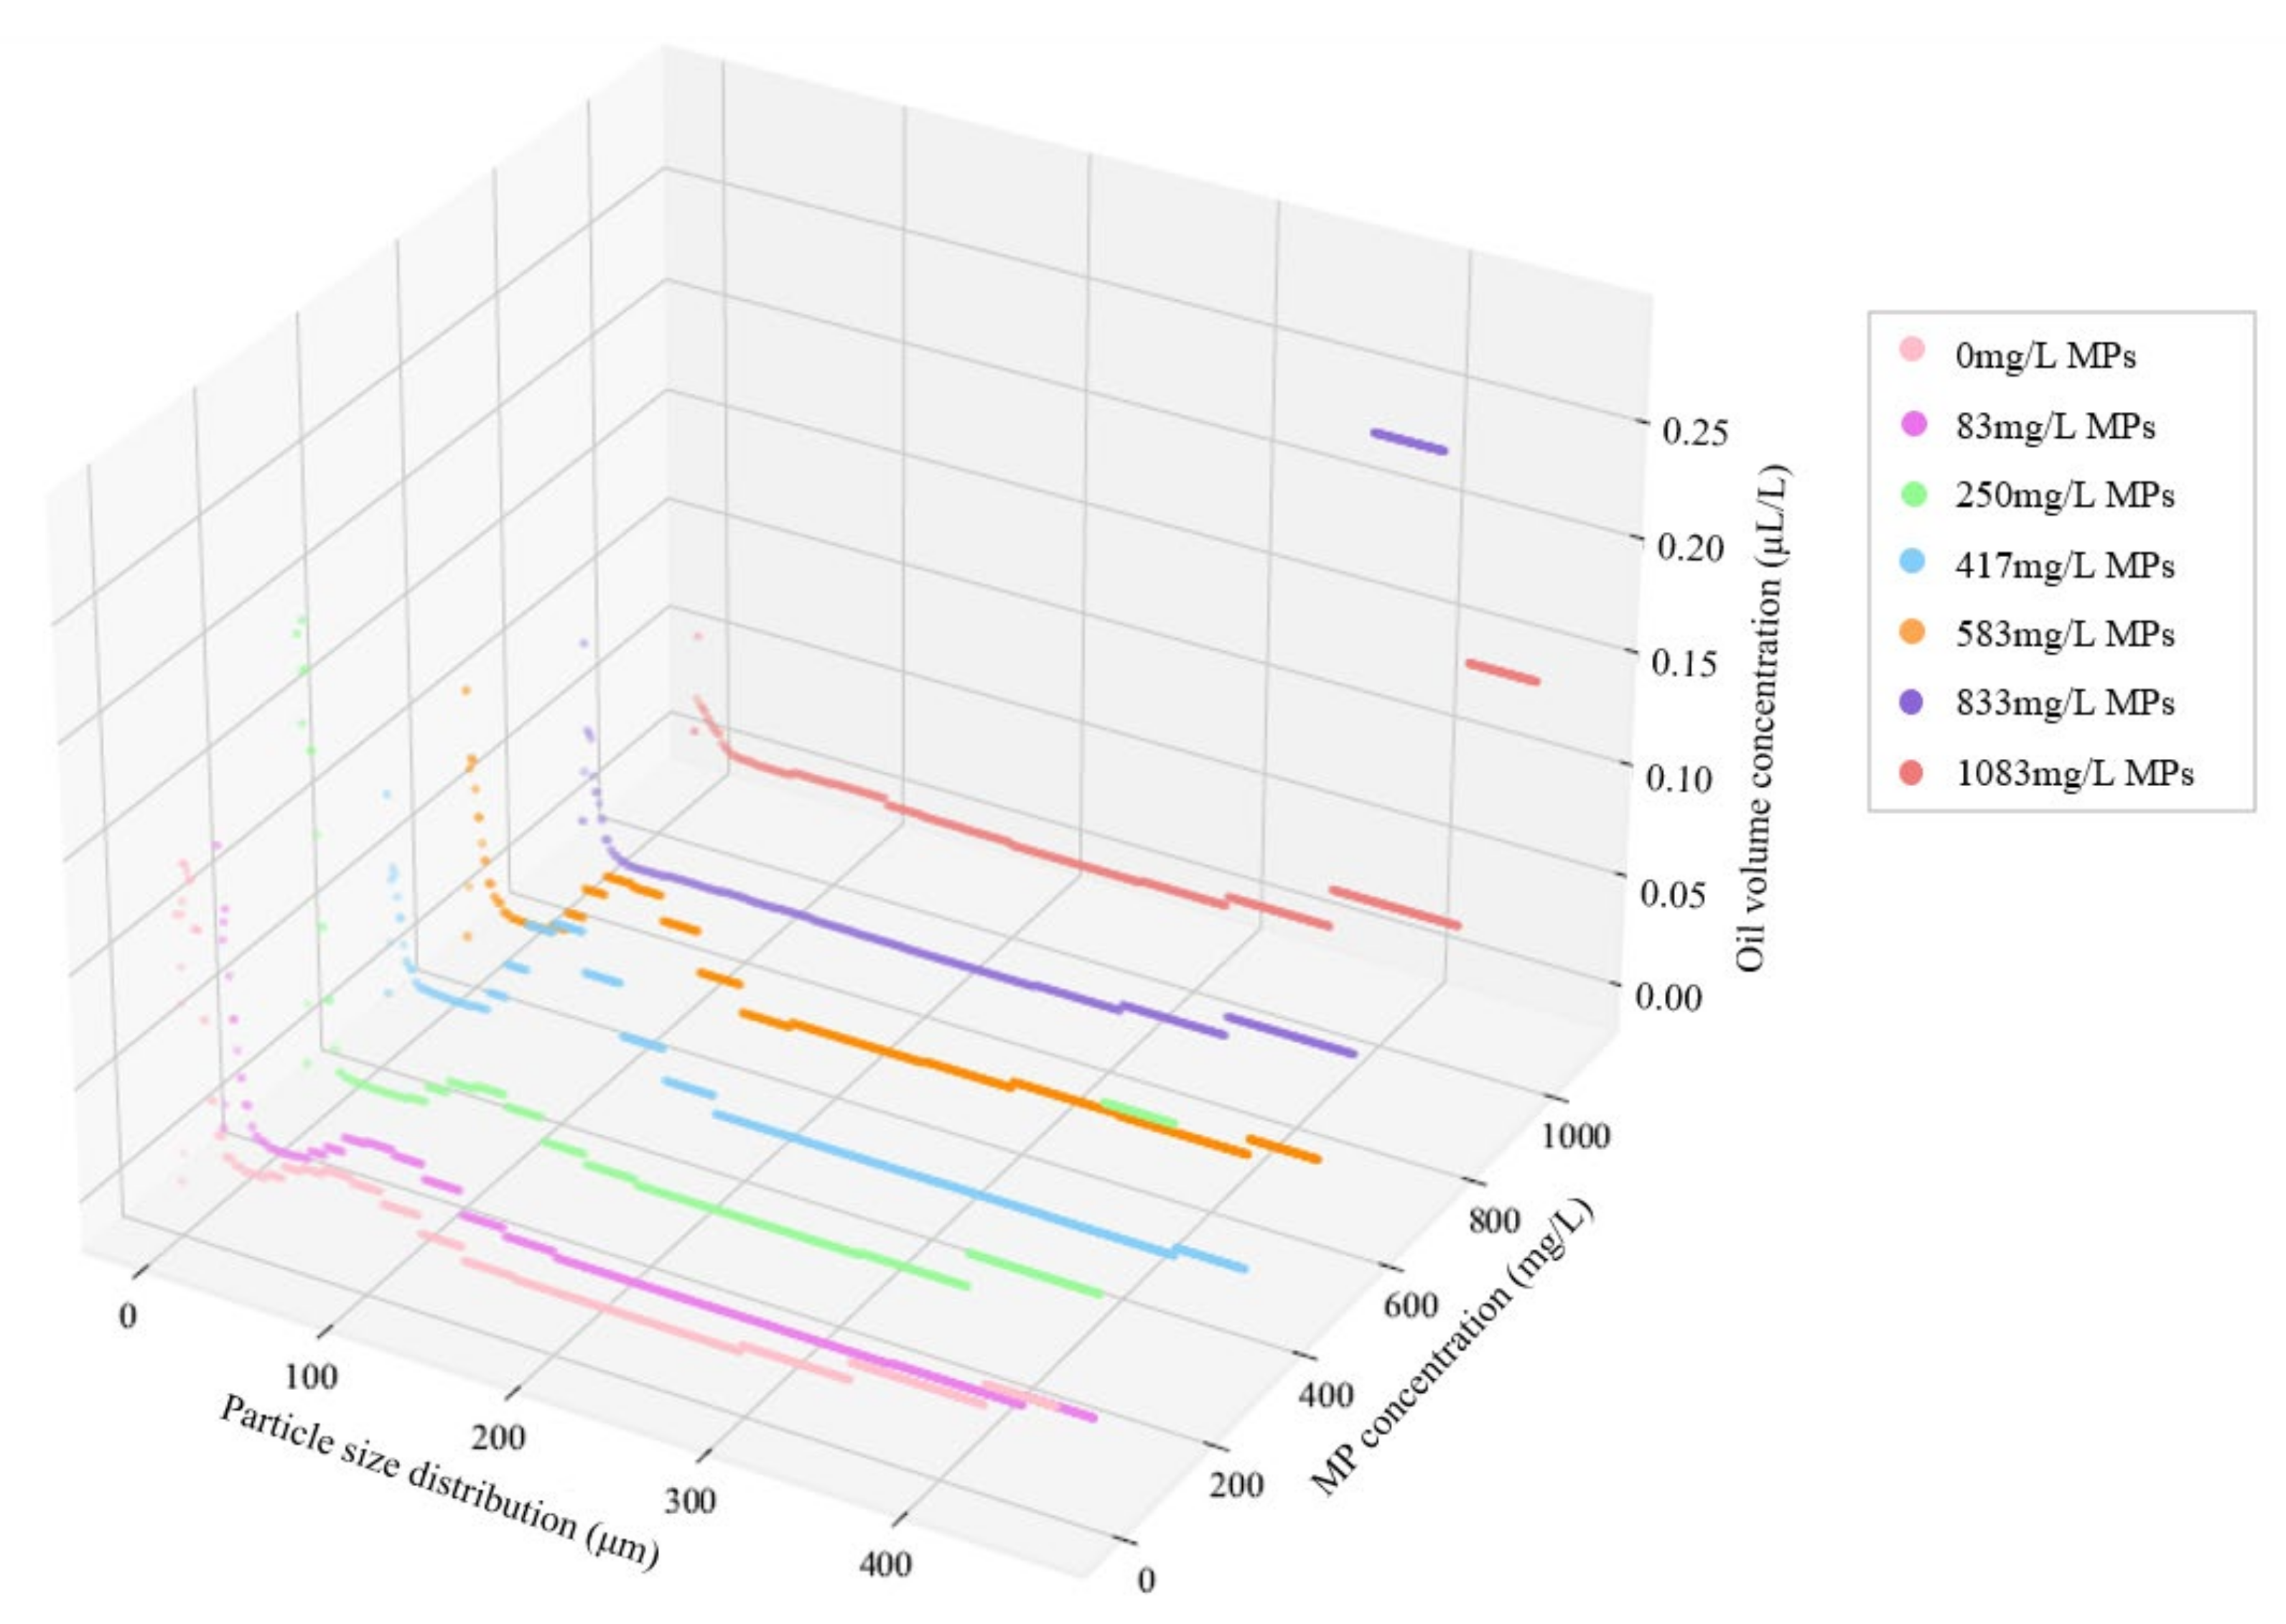
3.2. Impact of MPs on Oil Droplet Size

In the absence of MPs, the impact of DOR and mixing energy on oil droplet size was investigated. In Figure 3a, under a DOR of 1:10, the oil droplet size reached a maximum value of 4.70 ± 4.10 μm at the mixing energy of 200 rpm. Under a DOR of 1:25, the oil droplet size decreased from 8.15 ± 0.64 to 2.29 ± 0.20 μm when the mixing energy increased from 150 to 300 rpm. This indicated that lower mixing energy led to larger oil droplet sizes. In the following experiments, we preferred to select the conditions in which larger oil droplets were generated, as the size change of larger droplets could be easily observed. Therefore, under a DOR of 1:25, the mixing energy of 120 rpm was chosen to study how MPs affect oil droplet size; under a DOR of 1:10, the mixing energy of 200 rpm was adopted.
In the presence of MPs, under DOR 1:10 and mixing energy of 200 rpm, the oil droplet size decreased first and then increased (Figure 3b). By increasing the MP concentration from 0 to 417 mg/L, the oil droplet size was reduced from 4.83 ± 0.20 to 3.20 ± 0.02 μm. After 417 mg/L MPs, the maximum oil droplet size (9.96 ± 0.64μm) was reached at 533 mg/L MPs. MPs and oil could form MODA during the oil-dispersion process. The increase of oil droplet size could be attributed to the existence of MODAs in the sample, since MODAs had larger sizes than oil droplets themselves (Figure 2d). Under DOR 1:25 and mixing energy of 120 rpm, the oil droplet size was reduced first and then increased with the increasing of the MP concentration. In Figure 3b, the oil droplet size decreased from 11.05 ± 1.92 to 7.92 ± 0.29 μm when we changed the MP concentration from 0 to 250 mg/L. After adding 250 mg/L MPs, the oil droplet size increased to 19.08 ± 1.37 μm at 1083 mg/L MPs. This increase could be explained as follows. The low-energy input (120 rpm) limited the contact between oil and dispersant, and more dispersants would be used by MPs in seawater [14,35]. Therefore, large oil droplets would be formed to minimize the surface free energy of oil droplets in seawater column [46].
We further examined whether the oil droplet size could still be an efficient parameter to evaluate oil-dispersion efficiency when MODAs existed. The microscope image of an example sample (i.e., DOR of 1:10 and mixing energy of 200 rpm) indicated that oil droplets and MODAs co-existed in the sample, and the MODA size was larger than that of oil droplets (Figure 4). Thus, the “oil droplet size” measured in this study was larger than that without MPs of the same scenario (i.e., DOR of 1:10 and mixing energy of 200 rpm), since both the droplets of dispersed oil and MODAs were captured by the LISST-200X. In previous studies of oil dispersion without the existence of MPs, a greater oil droplet size means a lower dispersion efficiency [47,48]. With the addition of MPs, the oil droplet size was increased. For example, under DOR 1:10 and mixing energy of 200 rpm, the oil droplet size at 0 mg/L MPs was 4.83 ± 0.20 μm; it was then increased to 9.96 ± 0.64 μm at 583 mg/L MPs (Figure 3b). If taking the oil droplet size as a parameter of the oil-dispersion efficiency, the rise of the oil droplet size would indicate the decrease of oil-dispersion efficiency. However, in this case, the oil-dispersion efficiency actually increased as the total dispersed oil volume concentration increased from 6.08 ± 1.60 at 0 mg/L MPs to 8.72 ± 0.40 μL/L at 583 mg/L MPs (Figure 5b). Thus, we concluded that the oil droplet size might not reflect oil-dispersion efficiency when MPs existed in the marine environment.

3.3. Impact of MPs on Oil Volume Concentration

Without MPs addition, the impact of DOR and mixing energy on oil volume concentration was evaluated. As shown in Figure 5a, the total oil volume concentration largely increased with mixing energy rising. The total oil volume concentration was the sum of oil volume concentration under each particle size (from 1.21 to 459 μm). Results obtained under a DOR of 1:10 showed that the total oil volume concentration increased from 1.31 ± 0.27 to 32.55 ± 2.16 μL/L with enhanced mixing energy. Under the DOR of 1:25, the total oil volume concentration increased from 1.49 ± 0.18 to 34.93 ± 0.18 μL/L when the mixing energy rose from 150 to 300 rpm. It indicated that increasing mixing energy could facilitate oil dispersion in seawater under various DORs. The following experiments adopted the same mixing energy and DOR as the experiments regarding the effect of MPs on oil droplet size to reveal how MPs affect oil volume concentration in seawater.
With the addition of MPs, the trend of total oil volume concentration was unstable with MP concentration increasing under DOR 1:10 and mixing energy of 200 rpm. In Figure 5b, we see that, by rising the MP concentration from 0 to 417 mg/L, the total oil volume concentration decreased slightly from 6.08 ± 1.60 to 4.65 ± 0.01 μL/L. It then increased and reached the maximum value of 10.28 ± 0.39 μL/L at 833 mg/L MPs. Moreover, the total oil volume concentration at 583 mg/L MPs was also high (8.72 ± 0.40 μL/L). The increase of total oil volume concentration was caused by the existence of MODAs in the sample. As indicated in Figure 6, under 583 and 833 mg/L MPs, there were particles detected at and around 72.20 μm. According to MPs and oil droplet size distribution (the first and last column of Figure 6), there was no MP or oil droplet observed at and around 72.20 μm. We thus believed that the particles at and around 72.20 μm were MODAs. These MODAs detected at and around 72.20 μm could contribute to the total oil volume concentration. In Figure 5b, under DOR 1:25 and mixing energy of 120 rpm, the total oil volume concentration was 1.83 ± 0.50 μL/L at 0 mg/L MPs, and it decreased slightly to 0.70 ± 0.05 μL/L by increasing the MP concentration to 1083 mg/L. The reduction of total oil volume concentration in seawater was caused by MODA resurfacing as MODAs carried oil onto surface.

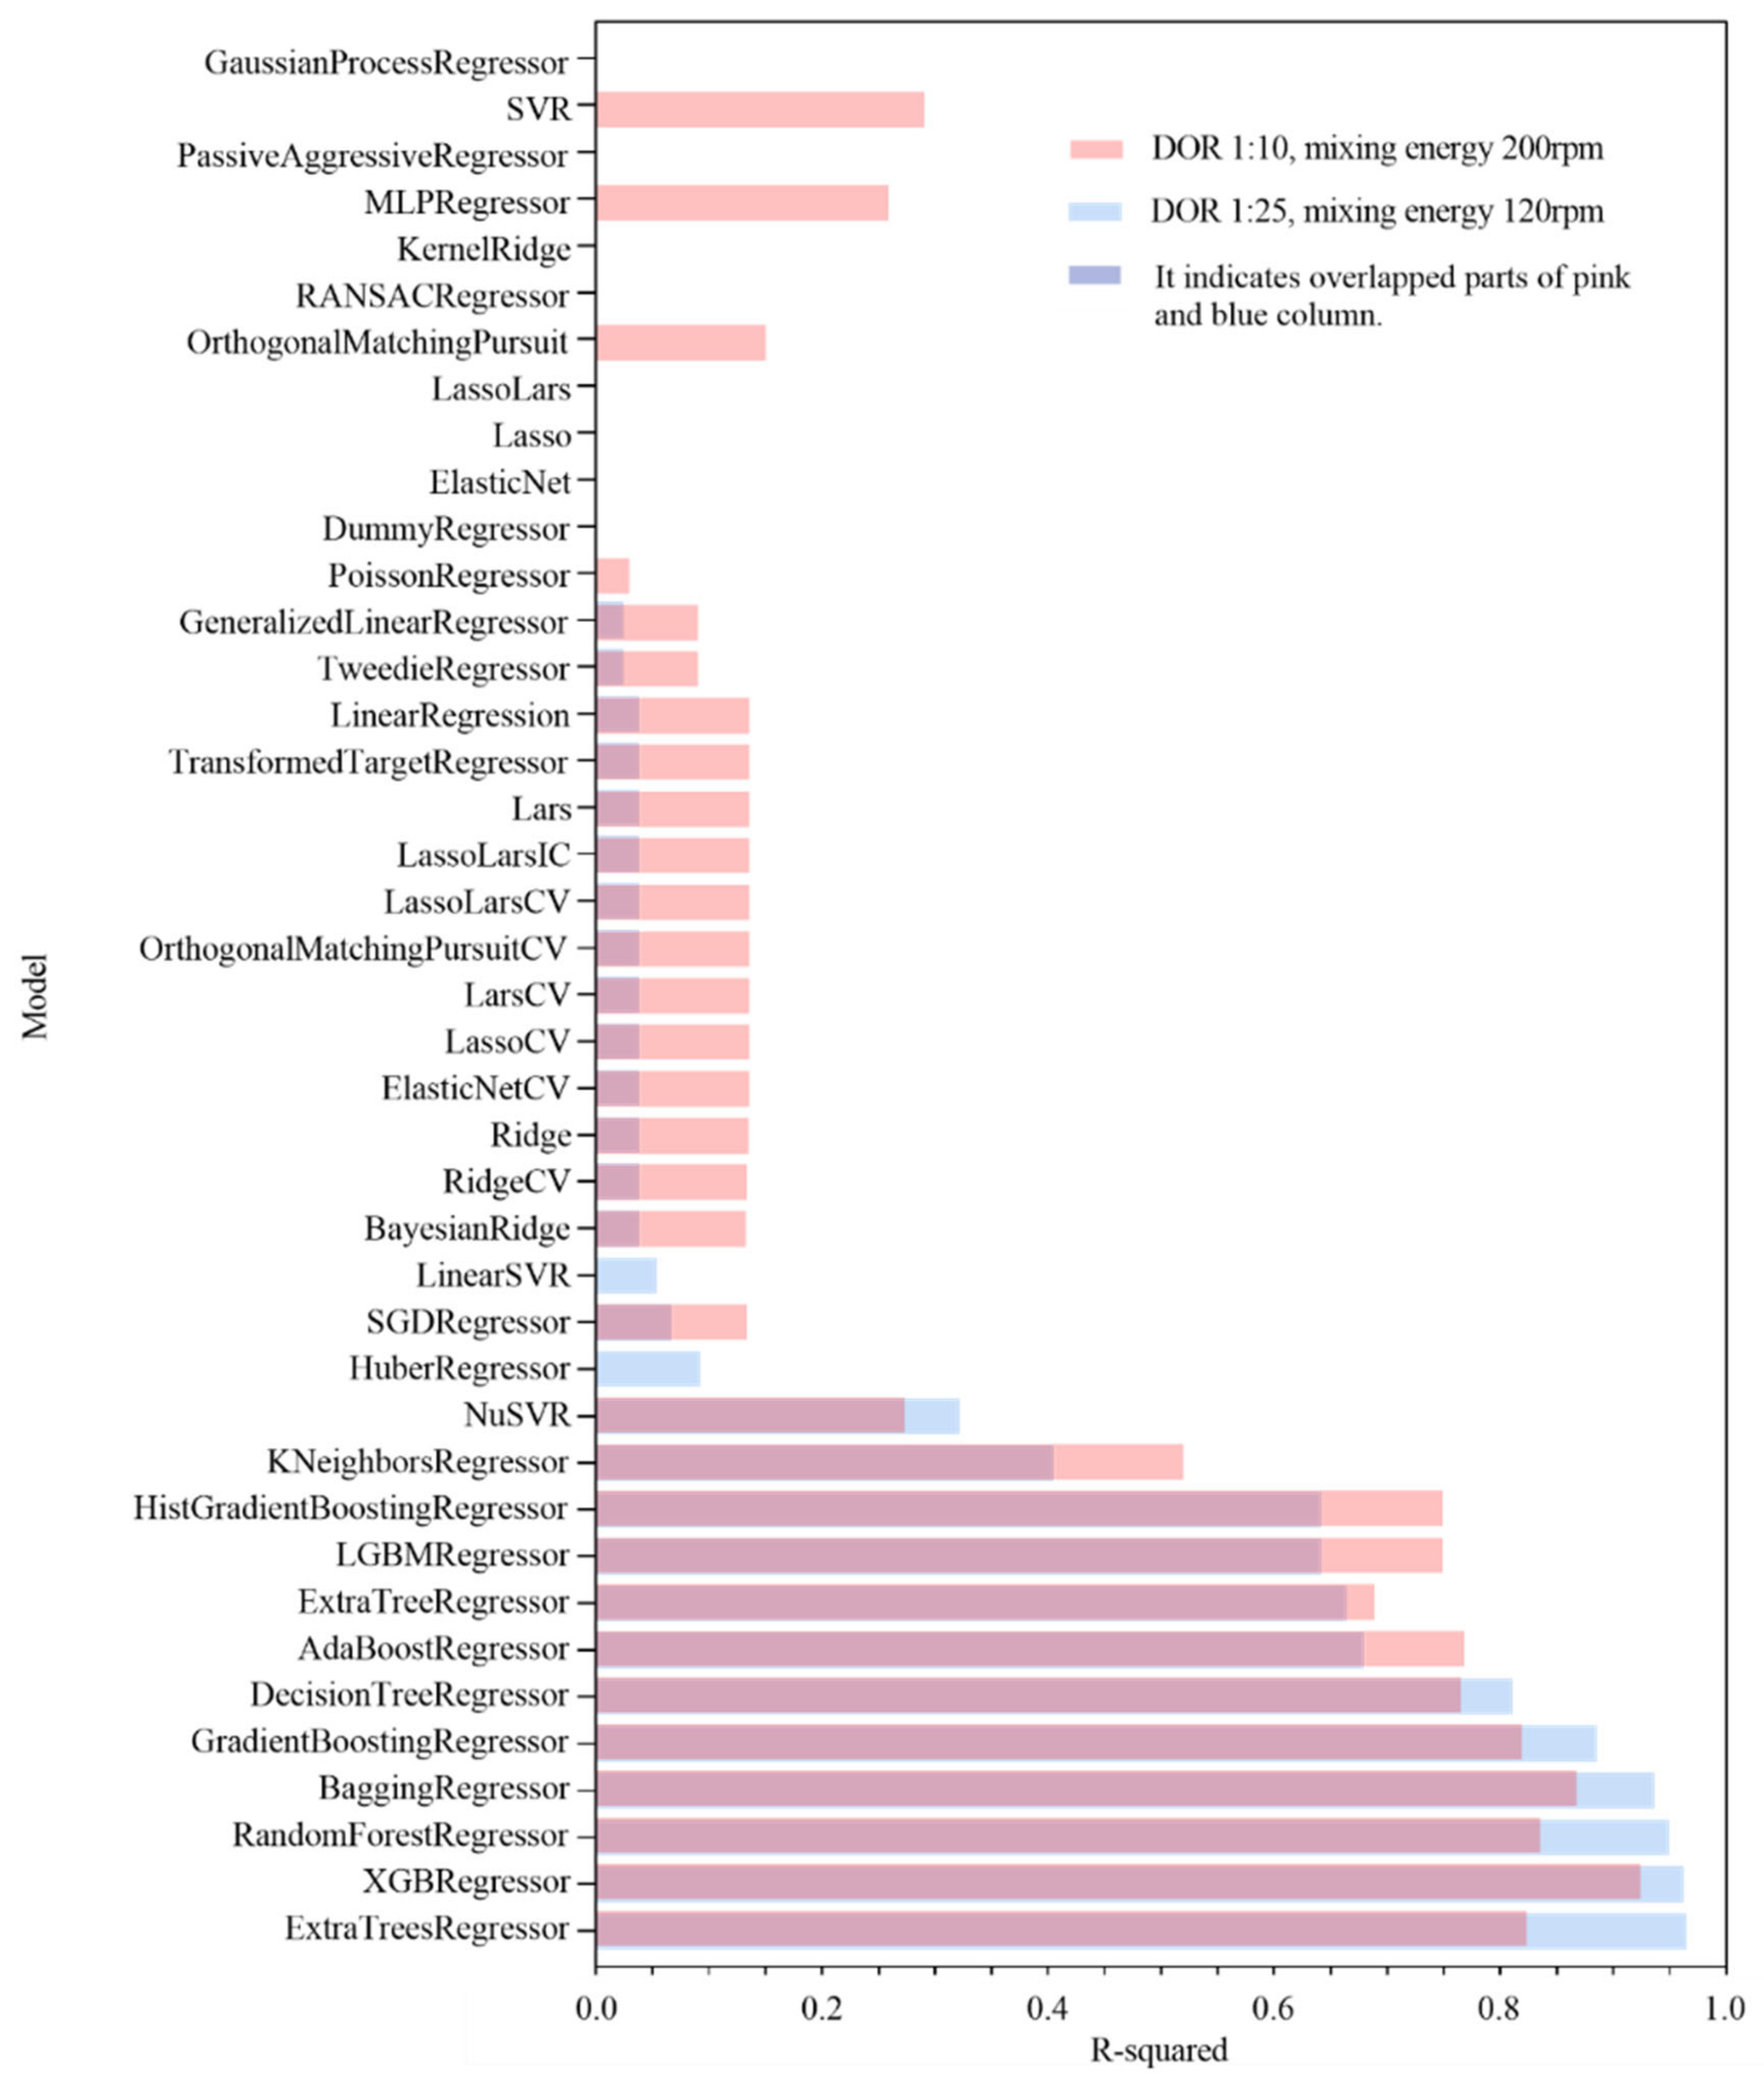
3.4. Regression Models for Oil Volume Concentration Prediction

The 42 different ML algorithms were performed to predict oil volume concentration. The performance of each algorithm was evaluated by the R-square value. The higher the R-square value, the better the performance is. In Figure 7, the R-square values of all training ML models are ranked, and we found that the XGBRegressor performed the best on both datasets, i.e., DOR 1:10 and mixing energy of 200 rpm (Dataset #1, R-square value 0.92), and DOR 1:25 and mixing energy of 120 rpm (Dataset #2, R-square value 0.96). The XGBRegressor, a scalable tree-based ML algorithm, was then used for regression in this case. Compared to other tree-based ML algorithms, such as random forest, the XGBRegressor added a new tree to complement already built ones. At each stage, it produces a weak learner based on the gradient direction of the loss function and adds it to the overall model. There are three reasons why the XGBRegressor outperformed other tree-boosting algorithms. Firstly, the regularized loss function was introduced. Secondly, the weights of each new tree could be scaled down by a specified constant, reducing the impact of a single tree on the final score. Finally, the column-sampling is comparable to random forests [49]. The hyperparameters of XGBRegressor were listed in Table 2 that indicated the best combination of the constructed regression model, which was eventually adopted for the prediction of oil volume concentration on both datasets.
The developed model was further used to predict oil volume concentration with any given MP concentration in the marine environment. The XGBRegressor developed from Dataset #2 was adopted as an example to demonstrate the prediction process. The oil droplet size distributions (range of 0 to 459 μm) with the existence of seven different concentrations of MPs were obtained by the LISST-200X and used as inputs. Figure 8 presented a 3D scatter plot of the prediction results generated by XGBRegressor. Noticeably, oil volume concentrations were obtained, with most values falling under 0.2 μL/L. Furthermore, in a bin range of 50–150 μm and MP concentration of 83, 250, 417, and 583 mg/L, the oil volume concentration showcased a bell-shaped distribution.

4. Conclusions

This study investigated the impact of MPs on oil-dispersion efficiency in the marine environment. The results showed that, under DOR 1:10 and mixing energy of 200 rpm, the oil droplet size and volume concentration decreased first and then increased with the addition of MPs. The increase in oil droplet size and volume concentration was caused by the existence of MODAs in the sample. Under DOR 1:25 and mixing energy of 120 rpm, the oil droplet size decreased first and then increased, but the total oil volume concentration decreased with the increase in MP concentration. Since the low energy input (120 rpm) limited the contact between the oil and the dispersant, larger oil droplets were formed to minimize the surface free energy of oil droplets in the seawater column. A decrease in oil volume concentration was caused by MODA resurfacing. In the presence of MPs, the oil droplets captured by the particle-size analyzer may include both droplets of oil and oil-associated MODAs. Thus, the oil droplet size may not be an efficient parameter to evaluate oil-dispersion efficiency. Moreover, the XGBRegressor model was promisingly constructed to predict the effect of MPs on oil-dispersion efficiency in oceans. This regression model may also help to fill the equipment defect for oil volume concentration prediction. This study presented important data to evaluate how MPs affect oil-dispersion efficiency in offshore oil-spill responses. Findings from this study may provide fundamental data for assessing the environmental risk of MPs and oil co-contaminants, as such data are essential for maintaining ocean sustainability.

Author Contributions

Conceptualization, M.Y. and B.Z.; methodology, M.Y. and Y.C.; software, Y.C.; validation, X.X.; formal analysis, M.Y.; investigation, M.Y.; resources, M.Y.; data curation, M.Y.; writing—original draft preparation, M.Y.; writing—review and editing, B.Z., X.X., K.L. and B.C.; visualization, M.Y.; supervision, B.Z. and B.C.; project administration, B.Z. All authors have read and agreed to the published version of the manuscript.

Funding

This research was supported by the Natural Sciences and Engineering Research Council of Canada (NSERC), Multi-Partner Research Initiative (MPRI)/Fisheries and Oceans Canada (DFO), Canada Foundation for Innovation (CFI) and Canada Research Chair (CRC) program.

Institutional Review Board Statement

Not applicable.

Informed Consent Statement

Not applicable.

Data Availability Statement

Not applicable.

Acknowledgments

The authors acknowledged Jiabin Liu from Northern Region Persistent Organic Pollutant Control (NRPOP) Laboratory for his kind support during the experiments.

Conflicts of Interest

The authors declare no conflict of interest. The funders had no role in the design of the study, in the collection, analyses or interpretation of data, in the writing of the manuscript, or in the decision to publish the results.

References

  1. Thompson, R.C.; Olsen, Y.; Mitchell, R.P.; Davis, A.; Rowland, S.J.; John, A.W.; McGonigle, D.; Russell, A.E. Lost at sea: Where is all the plastic? Science 2004, 304, 838. [Google Scholar] [CrossRef]
  2. Lin, W.; Li, X.; Yang, M.; Lee, K.; Chen, B.; Zhang, B.H. Brominated Flame Retardants, Microplastics, and Biocides in the Marine Environment: Recent Updates of Occurrence, Analysis, and Impacts. Adv. Mar. Biol. 2018, 81, 167–211. [Google Scholar]
  3. Uddin, S.; Fowler, S.W.; Uddin, M.F.; Behbehani, M.; Naji, A. A review of microplastic distribution in sediment profiles. Mar. Pollut. Bull. 2021, 163, 111973. [Google Scholar] [CrossRef] [PubMed]
  4. Kane, I.A.; Clare, M.A. Dispersion, accumulation, and the ultimate fate of microplastics in deep-marine environments: A review and future directions. Front. Earth Sci. 2019, 7, 80. [Google Scholar]
  5. Choy, C.A.; Robison, B.H.; Gagne, T.O.; Erwin, B.; Firl, E.; Halden, R.U.; Hamilton, J.A.; Katija, K.; Lisin, S.E.; Rolsky, C. The vertical distribution and biological transport of marine microplastics across the epipelagic and mesopelagic water column. Sci. Rep. 2019, 9, 7843. [Google Scholar] [CrossRef] [Green Version]
  6. Wang, S.; Chen, H.; Zhou, X.; Tian, Y.; Lin, C.; Wang, W.; Zhou, K.; Zhang, Y.; Lin, H. Microplastic abundance, distribution and composition in the mid-west Pacific Ocean. Environ. Pollut. 2020, 264, 114125. [Google Scholar] [CrossRef] [PubMed]
  7. Barrett, J.; Chase, Z.; Zhang, J.; Holl, M.M.B.; Willis, K.; Williams, A.; Hardesty, B.D.; Wilcox, C. Microplastic pollution in deep-sea sediments from the Great Australian Bight. Front. Mar. Sci. 2020, 7, 808. [Google Scholar] [CrossRef]
  8. Wang, T.; Wang, L.; Chen, Q.; Kalogerakis, N.; Ji, R.; Ma, Y. Interactions between microplastics and organic pollutants: Effects on toxicity, bioaccumulation, degradation, and transport. Sci. Total Environ. 2020, 748, 142427. [Google Scholar] [CrossRef]
  9. Wang, J.; Liu, X.; Liu, G.; Zhang, Z.; Wu, H.; Cui, B.; Bai, J.; Zhang, W. Size effect of polystyrene microplastics on sorption of phenanthrene and nitrobenzene. Ecotoxicol. Environ. Saf. 2019, 173, 331–338. [Google Scholar] [CrossRef]
  10. Wardrop, P.; Shimeta, J.; Nugegoda, D.; Morrison, P.D.; Miranda, A.; Tang, M.; Clarke, B.O. Chemical pollutants sorbed to ingested microbeads from personal care products accumulate in fish. Environ. Sci. Technol. 2016, 50, 4037–4044. [Google Scholar] [CrossRef] [PubMed]
  11. Zhao, H.-J.; Xu, J.-K.; Yan, Z.-H.; Ren, H.-Q.; Zhang, Y. Microplastics enhance the developmental toxicity of synthetic phenolic antioxidants by disturbing the thyroid function and metabolism in developing zebrafish. Environ. Int. 2020, 140, 105750. [Google Scholar] [CrossRef] [PubMed]
  12. Granby, K.; Rainieri, S.; Rasmussen, R.R.; Kotterman, M.J.; Sloth, J.J.; Cederberg, T.L.; Barranco, A.; Marques, A.; Larsen, B.K. The influence of microplastics and halogenated contaminants in feed on toxicokinetics and gene expression in European seabass (Dicentrarchus labrax). Environ. Res. 2018, 164, 430–443. [Google Scholar] [CrossRef] [PubMed] [Green Version]
  13. Ye, X.; Zhu, Z.; Merlin, F.; Yang, M.; Chen, B.; Lee, K.; Zhang, B. Ecological impact analysis of dispersants and dispersed oil: An overview. JEIL 2021, 5, 120–133. [Google Scholar] [CrossRef]
  14. Yang, M.; Chen, B.; Xin, X.; Song, X.; Liu, J.; Dong, G.; Lee, K.; Zhang, B. Interactions between microplastics and oil dispersion in the marine environment. J. Hazard. Mater. 2021, 403, 123944. [Google Scholar] [CrossRef] [PubMed]
  15. Alvarez-Zeferino, J.C.; Ojeda-Benítez, S.; Cruz-Salas, A.A.; Martínez-Salvador, C.; Vázquez-Morillas, A. Microplastics in Mexican beaches. Resour. Conserv. Recycl. 2020, 155, 104633. [Google Scholar] [CrossRef]
  16. Aliabad, M.K.; Nassiri, M.; Kor, K. Microplastics in the surface seawaters of Chabahar Bay, Gulf of Oman (Makran coasts). Mar. Pollut. Bull. 2019, 143, 125–133. [Google Scholar] [CrossRef]
  17. Al-Lihaibi, S.; Al-Mehmadi, A.; Alarif, W.M.; Bawakid, N.O.; Kallenborn, R.; Ali, A.M. Microplastics in sediments and fish from the Red Sea coast at Jeddah (Saudi Arabia). Environ. Chem. 2019, 16, 641–650. [Google Scholar] [CrossRef]
  18. Al-Salem, S.; Uddin, S.; Al-Yamani, F. An assessment of microplastics threat to the marine environment: A short review in context of the Arabian/Persian Gulf. Mar. Environ. Res. 2020, 159, 104961. [Google Scholar] [CrossRef]
  19. Aslam, H.; Ali, T.; Mortula, M.M.; Attaelmanan, A.G. Evaluation of microplastics in beach sediments along the coast of Dubai, UAE. Mar. Pollut. Bull. 2020, 150, 110739. [Google Scholar] [CrossRef] [PubMed]
  20. Castillo, A.B.; Al-Maslamani, I.; Obbard, J.P. Prevalence of microplastics in the marine waters of Qatar. Mar. Pollut. Bull. 2016, 111, 260–267. [Google Scholar] [CrossRef]
  21. Naji, A.; Azadkhah, S.; Farahani, H.; Uddin, S.; Khan, F.R. Microplastics in wastewater outlets of Bandar Abbas city (Iran): A potential point source of microplastics into the Persian Gulf. Chemosphere 2021, 262, 128039. [Google Scholar] [CrossRef] [PubMed]
  22. Saeed, T.; Al-Jandal, N.; Al-Mutairi, A.; Taqi, H. Microplastics in Kuwait marine environment: Results of first survey. Mar. Pollut. Bull. 2020, 152, 110880. [Google Scholar] [CrossRef] [PubMed]
  23. Abayomi, O.A.; Range, P.; Al-Ghouti, M.A.; Obbard, J.P.; Ben-Hamadou, R. Microplastics in coastal environments of the Arabian Gulf. Mar. Pollut. Bull. 2017, 124, 181–188. [Google Scholar] [CrossRef] [PubMed]
  24. Uddin, S.; Fowler, S.W.; Saeed, T. Microplastic particles in the Persian/Arabian Gulf–a review on sampling and identification. Mar. Pollut. Bull. 2020, 154, 111100. [Google Scholar] [CrossRef] [PubMed]
  25. Zhang, B.; Matchinski, E.; Chen, B.; Ye, X.; Jing, L.; Lee, K. Marine oil spills—Oil pollution, sources and effects. In World Seas: An Environmental Evaluation, 2nd ed.; Elsevier: Amsterdam, The Netherlands, 2019; pp. 391–406. [Google Scholar]
  26. Cai, Q.; Zhu, Z.; Chen, B.; Zhang, B. Oil-in-water emulsion breaking marine bacteria for demulsifying oily wastewater. Water Res. 2019, 149, 292–301. [Google Scholar] [CrossRef]
  27. Brakstad, O.G.; Nordtug, T.; Throne-Holst, M. Biodegradation of dispersed Macondo oil in seawater at low temperature and different oil droplet sizes. Mar. Pollut. Bull. 2015, 93, 144–152. [Google Scholar] [CrossRef]
  28. Merlin, F.; Zhu, Z.; Yang, M.; Chen, B.; Lee, K.; Boufadel, M.C.; Isaacman, L.; Zhang, B. Dispersants as marine oil spill treating agents: A review on mesoscale tests and field trials. Environ. Syst. Res. 2021, 10, 37. [Google Scholar] [CrossRef]
  29. Brandvik, P.J.; Storey, C.; Davies, E.J.; Leirvik, F. Quantification of oil droplets under high pressure laboratory experiments simulating deep water oil releases and subsea dispersants injection (SSDI). Mar. Pollut. Bull. 2019, 138, 520–525. [Google Scholar] [CrossRef]
  30. National Academies of Sciences, Engineering, and Medicine. The Use of Dispersants in Marine Oil Spill Response; The National Academies Press: Washington, DC, USA, 2020. [Google Scholar] [CrossRef] [Green Version]
  31. Pan, Z.; Zhao, L.; Boufadel, M.C.; King, T.; Robinson, B.; Conmy, R.; Lee, K. Impact of mixing time and energy on the dispersion effectiveness and droplets size of oil. Chemosphere 2017, 166, 246–254. [Google Scholar] [CrossRef]
  32. Li, C.; Miller, J.; Wang, J.; Koley, S.; Katz, J. Size distribution and dispersion of droplets generated by impingement of breaking waves on oil slicks. J. Geophys. Res. Oceans 2017, 122, 7938–7957. [Google Scholar] [CrossRef]
  33. Feng, Q.; An, C.; Chen, Z.; Yin, J.; Zhang, B.; Lee, K.; Wang, Z. Investigation into the impact of aged microplastics on oil behavior in shoreline environments. J. Hazard. Mater. 2021, 421, 126711. [Google Scholar] [CrossRef]
  34. Shan, J.; Wang, J.; Zhan, J.; Liu, L.; Wu, F.; Wang, X. Sorption behaviors of crude oil on polyethylene microplastics in seawater and digestive tract under simulated real-world conditions. Chemosphere 2020, 257, 127225. [Google Scholar] [CrossRef] [PubMed]
  35. Yang, M.; Zhang, B.; Xin, X.; Liu, B.; Zhu, Z.; Dong, G.; Zhao, Y.; Lee, K.; Chen, B. Microplastic-oil-dispersant agglomerates in the marine environment: Formation mechanism and impact on oil dispersion. J. Hazard. Mater. 2021, 127825. [Google Scholar] [CrossRef]
  36. Sequoia Scientific, Inc. LISST-200X Measures Particle Size Distribution and Concentration, and Optical VSF. Available online: http://www.sequoiasci.com/product/lisst-200x/ (accessed on 20 March 2021).
  37. Sequoia Scientific, Inc. LISST-200X Particle Size Analyzer User’s Manual. Available online: https://www.sequoiasci.com/wp-content/uploads/2016/02/LISST-200X_Users_Manual_v1_3B.pdf (accessed on 20 March 2021).
  38. Vabalas, A.; Gowen, E.; Poliakoff, E.; Casson, A.J. Machine learning algorithm validation with a limited sample size. PLoS ONE 2019, 14, e0224365. [Google Scholar] [CrossRef] [PubMed]
  39. Sheykhmousa, M.; Mahdianpari, M.; Ghanbari, H.; Mohammadimanesh, F.; Ghamisi, P.; Homayouni, S. Support vector machine vs. random forest for remote sensing image classification: A meta-analysis and systematic review. IEEE J. Sel. Top. Appl. Earth Obs. Remote Sens. 2020, 13, 6308–6325. [Google Scholar] [CrossRef]
  40. Chen, Y.; Chen, B.; Song, X.; Kang, Q.; Ye, X.; Zhang, B. A data-driven binary-classification framework for oil fingerprinting analysis. Environ. Res. 2021, 201, 111454. [Google Scholar] [CrossRef] [PubMed]
  41. Venosa, A.D.; Holder, E. Laboratory-Scale Testing of Dispersant Effectiveness of 20 Oils Using the Baffled Flask Test; US Environmental Protection Agency: Washington, DC, USA, 2011; pp. 600–699.
  42. Hossain, M.R.; Jiang, M.; Wei, Q.; Leff, L.G. Microplastic surface properties affect bacterial colonization in freshwater. J. Basic Microbiol. 2019, 59, 54–61. [Google Scholar] [CrossRef] [PubMed] [Green Version]
  43. Lebedeva, E.V.; Fogden, A. Adhesion of oil to kaolinite in water. Environ. Sci. Technol. 2010, 44, 9470–9475. [Google Scholar] [CrossRef] [PubMed]
  44. Ranjan, G.; Verma, A.K.; Radhika, S. K-nearest neighbors and grid search cv based real time fault monitoring system for industries. In Proceedings of the IEEE 5th International Conference for Convergence in Technology (I2CT), Pune, India, 29–31 March 2019; pp. 1–5. [Google Scholar]
  45. Förch, R.; Schönherr, H.; Jenkins, A.T.A. Surface Design: Applications in Bioscience and Nanotechnology; John Wiley & Sons: Hoboken, NJ, USA, 2009; ISBN 978-3-527-40789-7. [Google Scholar]
  46. Thielmann, F.; Naderi, M.; Ansari, M.A.; Stepanek, F. The effect of primary particle surface energy on agglomeration rate in fluidised bed wet granulation. Powder Technol. 2008, 181, 160–168. [Google Scholar] [CrossRef]
  47. Li, Z.; Lee, K.; King, T.; Boufadel, M.C.; Venosa, A.D. Evaluating chemical dispersant efficacy in an experimental wave tank: 2—Significant factors determining in situ oil droplet size distribution. Environ. Eng. Sci. 2009, 26, 1407–1418. [Google Scholar] [CrossRef]
  48. Song, X.; Jing, L.; Chen, B.; Zhu, Z.; Cai, Q.; Ye, X.; Zheng, X.; Hill, S.J.; Zhang, B. The effect of pressure variation on droplet size distribution of dispersed oil under simulated deep-water conditions. Heliyon 2021, 7, e06291. [Google Scholar] [CrossRef] [PubMed]
  49. Buribayev, Z.; Joldasbayev, S.; Yerkosova, A.; Zhassuzak, M. Building a system for predicting the yield of grain crops based on machine learning using the XGBRegressor algorithm. In Proceedings of the IEEE International Conference on Smart Information Systems and Technologies (SIST), Nur-Sultan, Kazakhstan, 28–30 April 2021; pp. 1–5. [Google Scholar]
Figure 1. Experimental process.
Sustainability 13 13752 g001
Figure 2. SEM images of the (a,b) MPs and (c,d) MODA.
Sustainability 13 13752 g002
Figure 3. (a) Oil droplet size without MPs, and (b) oil droplet size with MPs addition.
Sustainability 13 13752 g003
Figure 4. Microscope image of an example oil sample (i.e., DOR of 1:10 and mixing energy of 200 rpm).
Sustainability 13 13752 g004
Figure 5. (a) Total oil volume concentration without MPs. (b) Total oil volume concentration with MPs addition.
Sustainability 13 13752 g005
Figure 6. Particle size distribution under DOR 1:10 and mixing energy of 200 rpm.
Sustainability 13 13752 g006
Figure 7. Model comparison for the prediction of oil volume concentration.
Sustainability 13 13752 g007
Figure 8. Model predictions for oil volume concentration with the existence of MPs.
Sustainability 13 13752 g008
Table 1. Physiochemical properties of MPs.
MPs TypeSizeWater Contact Angle (°)Density (g/cm3)
PE MPs6.00–8.50 μm106.601.07
Table 2. Outputs of hyperparameters tuning in the XGBRegressor model.
ModelsHyperparametersValues
XGBRegressorcolsample_bytree1
importance_typegain
learning_rate0.3
max_depth6
n_estimators100
reg_lambda1
tree_methodExact
Publisher’s Note: MDPI stays neutral with regard to jurisdictional claims in published maps and institutional affiliations.

