Article

Asymmetric and Symmetric Link between Quality of Institutions and Sectorial Foreign Direct Investment Inflow in India: A Fresh Insight Using Simulated Dynamic ARDL Approach

1
Graduate School of Economics and Management, Ural Federal University, Mira 19, 620002 Ekaterinburg, Russia
2
Department of Economics, The University of Haripur, Haripur 22620, Pakistan
3
Hungarian National Bank–Research Center, John von Neumann University, 6000 Kecskemét, Hungary
4
Department of Public Management and Governance, College of Business and Economics, University of Johannesburg, Johannesburg 2006, South Africa
5
Department of Economics, Kohat University of Science and Technology, Kohat 26064, Pakistan
6
Department of Commerce, Faculty of Management Sciences, University of Kotli, Kotli 11100, Pakistan
7
Department of Business Management, College of Business and Economics, University of Johannesburg, Johannesburg 2092, South Africa
8
Department of Food Chain Management, Institute of Agribusiness, Hungarian University of Agriculture and Life Sciences, 2100 Gödöllő, Hungary
*
Authors to whom correspondence should be addressed.
Sustainability 2021, 13(24), 13760; https://doi.org/10.3390/su132413760
Submission received: 6 November 2021 / Revised: 3 December 2021 / Accepted: 6 December 2021 / Published: 13 December 2021

Abstract

:
This study explores the bicausality between institutional quality and FDI inflow both aggregated and sector-wise, i.e., the agricultural, manufacturing, and tertiary sectors in the Indian economy, by applying simulated autoregressive distributed lag (SARDL) dynamic new techniques, an extended variant of orthodox ARDL and NARDL. The study confirms that aggregated and sectorial FDI are enhanced by adequate institutional quality, and similarly, FDI promotes quality institutions. The nexus between institutional quality and FDI inflow is an inspiration for India to compete with developed economies by enhancing its institutional quality. The study observes cointegration and bidirectional causality between institutional quality and aggregated FDI.

1. Introduction

Foreign direct investment (FDI) bridges the gap between savings and investment requirements [1]. Endogenous growth theories emphasize that FDI is a crucial predictor of economic growth since it is a source of technical transfer from industrialized countries to developing countries as a result of globalization. By strengthening the skills and knowledge of workers in the host country, FDI can reduce unemployment both directly and indirectly. Many developing countries have implemented policies to ease FDI inflows and regulate FDI operations. Financial sector adjustment, structural adjustment, economic recovery, and economic partnership agreements are examples of these types of programs [2]. FDI has been increased in emerging economies since 1990, including the Association of Southeast Asian Nations (ASEAN), Sub-Saharan African countries, South Asian Association of Regional Cooperation (SAARC) members, and Central Asian economies. FDI inflows support these developing countries by improving technology, managerial skills, and increasing exports, employment, productivity, economic growth, and capital accumulation.
In the last decade, the impact of institutional quality on FDI has gained special interest in research. There exists a lot of literature in support of the idea that quality institutions enhance FDI and cause capital mobility in the international market [3,4]. However, very limited literature exists on FDI’s role in institutional quality promotion in host countries. Good quality institutions significantly enhance FDI inflow [5,6], while poor institutional arrangements such as the law and order situation, investor protectionism, political stability, government policies, and formal and informal codes of conduct have a negative impact on investment inflow.
We highlight several ways through which institutional quality attracts FDI inflow, and reversely, FDI promotes institutional quality in a host economy. Foreign investors are interested in institutional quality because it deceases the business implementation and operational costs in host countries. Meanwhile, poor institutions discourage FDI inflow, such as taxes, thus increasing the FDI opportunity cost [7,8]. Investors hesitate and are discouraged from investing in countries where red tape, nepotism, and corruption are encouraged by institutions because these are the determinants of business operational costs [9,10]. The author of [11] suggested that a lack of good governance in institutions is substituted with taxation and discourages foreign investors. In [12], it was reported that in developing countries’ red tape, substandard legal systems, and corruption significantly deter FDI inflow. The positive role of FDI in economics has turned a self-evident truth where technological, savings, and investment gaps are covered by foreign firms through the provision of technology and cash to the recipient economy. FDI provides an opportunity to local firms for learning from foreign firms either by collaborating with these firms or watching and infusing a sense of competition among local firms and institutions in order to boost the host country’s productivity. In [13], it was suggested that competition in attracting FDI has a positive contribution in FDI-aspirant countries, calls for prodigious positive change from FDI, and introduces to rival recipient countries a race to the top. FDI not only transfers innovation in productive technology, but it also improves the institutional qualities that contribute to the domestic economy. Many studies have found a corruptive relationship with economic openness [14,15,16], but very limited studies have highlighted the impact of FDI on institutional quality.
The author of [17] explored how FDI impacts institutional quality through the channeling of the market forces of demand and supply. In [18], it was pointed out that FDI has reduced corruption levels in recipient countries and has justified that this is due to good governance and better management practices from foreign investors. In [19], it was suggested that FDI induced technological innovation and institutional efficiency, which are very determinant of economic growth. Although FDI and institutional quality are very important for economic growth, there is very limited literature on the causal relationship between FDI and institutional quality. The existing literature does not clarify the relationship between FDI and institutional quality. First of all, these studies have explained the FDI and institutional quality relationship by employing aggregated data of FDI, which provide a blurred picture of FDI’s causal relationship with institutional quality. Secondly, these studies focused only on one aspect of institution quality, i.e., political risk and corruption, to explain the impact of institutional quality and FDI. Thirdly, these studies are based on cross-country analyses that lead to ambiguous results due to the existence of heterogeneity issues [20].
On these grounds, this study employs a set of indicators for evaluating the overall impact of institutional quality on sectorial FDI and, reversely, how sectorial FDI effects the quality of institutions in India with a focus on single-country analysis for the formulation of policies based on strong foundations. We have not found any empirical study on the bidirectional causality of institutional quality and sectorial FDI inflow of any sector, i.e., agriculture, industrial, and service sectors. Simulated ARDL techniques are applied in this study for the investigation of the short-run and long-run bidirectional causality of institutional quality and sector-wise FDI inflow (primary, secondary, services) in India. The simulated ARDL dynamic model overcomes the problems faced in orthodox ARDL in the exploration of short-run and long-run diverse model specifications. In [21], a novel dynamic simulated ARDL technique was devised, which we used in the current study. This innovative model can automatically stimulate, estimate, and plot graphs of positive and negative fluctuations in variables, as well as their short and long-term correlations. The ARDL model in [22], on the other hand, can only estimate the long- and short-run associations between the variables.
The study is organized as follows: Institutional quality and FDI trends in India are explained in Section 2. Section 3 shows the Literature Review. This is followed by detailed methodology, data source, and econometric models. Next, the study’s empirical results are evaluated and, finally, conclusions are presented, and some policy recommendations are suggested.

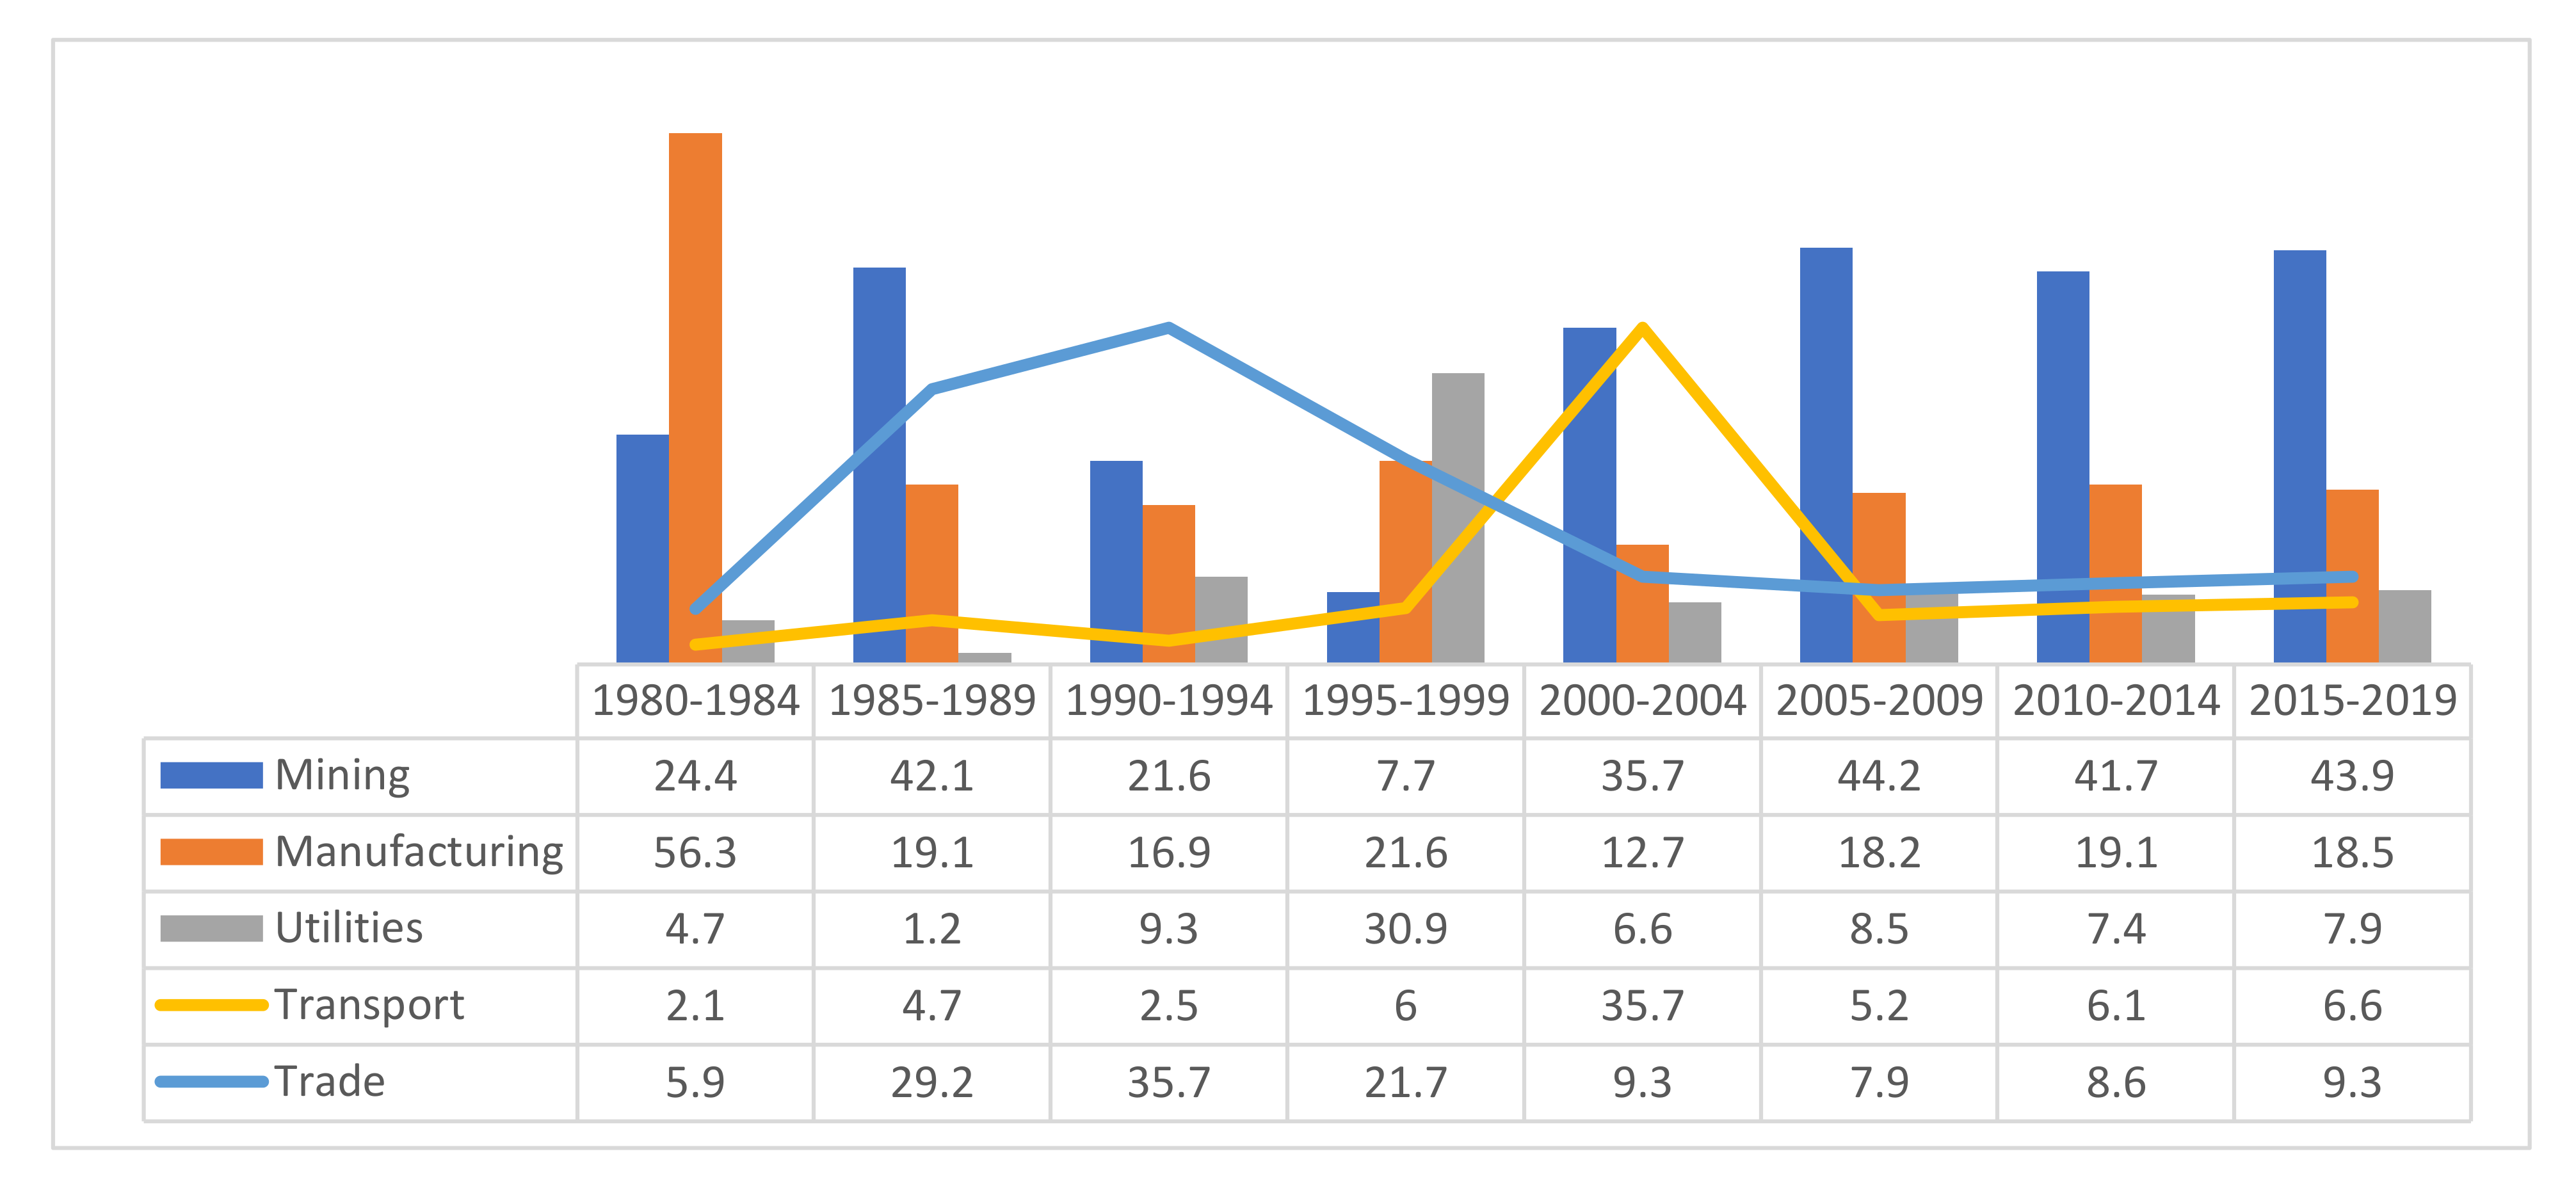
2. FDI Trends and Institutional Quality in India

This section deals with trends and the structural pattern of FDI inflows in India. The FDI inflow distribution in India has two dimensions: first, government-prevailed treatments of FDI inflow in specified sectors, and secondly, it shows preferential investment of multinational cooperation among different sectors. India, the world’s second most populous country, has great potential growth and is very suitable for FDI (see Figure 1). The institutional quality of India is good in Asian economies, which is the reason why it has achieved remarkable achievement in FDI attraction from the FY-2008 and onward [18,23,24]. FDI inflow in India has increased by 55% from USD 231.37 billion to USD 358.29 from the period 2008–2014 to 2014 to 2019 [23]. However, it still needs improvement as it is below other emerging economies such as China and Singapore, etc.
Figure 1 indicates that Indian FDI has significantly changed from one sector to another in last 30 years. In the 1980s, foreign investors were interested in investing in the manufacturing, quarrying, and mining sectors, and these sectors’ shares were greater than 80% from 1980 to 1984. The shares of these sector were dropped to 30% from 1995 to 1999 and then raised to 40% in 2000 to 2004 (see Figure 2). The radical decline in manufacturing sector FDI was initially replaced by the commerce, mining, and quarrying sectors and after that replaced by the personal services, social services, financial, communication, and transportation sectors. This proved that sectorial preferences continuously changed in Indian FDI in the last 30 years. In the same way, the pre- and post-reform distribution of sector-wise FDI (primary, secondary, and services) shows a significant variation. In the pre-reform period, the manufacturing, mining, and quarrying sectors’ shares drastically decreased, and the services sector’s shares increased. FDI shares in the services sector has increased from 2.2% to 45% from the period 1980–1994 to 1995 to 2010. The performance analysis of FDI in the pre- and post-reform index is calculated and shows relative sectorial FDI contribution in total GDP, as mentioned in Figure 2. A sector with value greater than one means that it has gained more FDI as compared to the relative economic size of that sector. We calculate as follows:
S F P I = F D I i / F D I t G D P i / G D P t
where FDIi represents i sector FDI, FDIt means total FDI, GDPI means i sector GDP, and GDPt means total GDP.
Figure 2 shows a significant variation in sectorial FDI in the pre- and post-reform periods. The sectorial performance index indicates that mining, oil, and gas (primary sector) FDI inflows have huge shares in the GDP in the pre-reform period. The manufacturing sector FDI is comparatively low in the post-reform period, and the services sector’s FDI share has increased in the total GDP. If we consider Indian institutions as social structure governance behavior of individuals, then Indian institutional quality may not be encouraging as India has experienced corruption, lack of governance, worse law and order, and political instability. Table 1 and Figure 3 shows that the average Indian institutional quality index is 5.3, with a maximum institutional quality index of 12. Similarly, India ranked low in all six selected components of institutional quality. The Standard Deviation (SD) of all these components shows that bureaucratic quality is comparatively more stable. Overall, the Indian institutional quality index is low as compared to other emerging economies (See Figure 3 and Table 1).

3. Literature Review

Many studies explored that poor institutions reduce FDI by discouraging the foreign investors [24,25,26,27]. This point of view is supported by [28] by pointing out three reasons for this: (i) firms’ productivity is increased by good governance; (ii) the cost of production is increased by poor institutions; (iii) poor government performance increases uncertainty and risk, which leads to the higher vulnerability of firms. Different variables have been used for the measurement of institutional quality’s impact on FDI inflow. Political risk is one of the proxies used for institutional quality. The authors of [29,30] explored that political factors are very important for FDI inflows. François et al. (2020) found that more FDI is attracted in a democratic setup as compared to an authoritarian government. On the other hand, [25,31,32,33] found that FDI is insignificantly affected by political factors. Other factors for studying institutional quality impact on FDI are corruption and weak execution of the contract. Corruption was used by [26] for a proxy of institutional quality and found that FDI inflow is reduced by corruption. According to their study, poor institutional quality, i.e., in the economy where corruption level is high, leads to: (i) lack of transparency in the bureaucracy of the domestic country, which increases the investment opportunity cost; (ii) dealing with issues related to bureaucracy, high value is given to domestic partners; (iii) a decline in investor protectionism leads to decreasing their intangible assets; and (iv) in case of any dispute between any foreigner investor with his domestic business partner, he is biased toward local partners. The negative impact on FDI is confirmed by the study of [34]. The author of [35] concluded that corruption has no effect on FDI. The authors of [36] studied the impact of protectionism of property rights on the behavior pattern of multinational companies, and found that institutional performance was strongly correlated with the FDI ratio to total domestic investment. The property right importance for FDI attraction has been confirmed by the study of [37].
In [20], the impact of institutional quality on FDI in developing countries nations was estimated and a positive relationship was established between institutions and FDI, as well as the fact that foreign investors prefer to invest in countries with less diverse societies and political instability. The authors of [38] use corruption and the rule of law as measures of institutional quality to examine the impact of institutional quality on FDI inflows in developing and developed nations and find that institutions have a negligible impact on FDI inflows in developing countries due to their weak institutional structures. Furthermore, in developed countries, the institutional quality has a favorable and considerable impact on FDI. Other studies look at how institutions affect FDI inflows at different phases of development. As a result, strong quality institutions in the host country are a requirement for attracting FDI inflows.
Efforts have been made by many researchers to combine various variables of institutional quality. The author of [39] analyzed different indicators and concluded that government performance, violence and political instability, rules of law, and regulatory burden have significant impact on FDI, and the voice of accountability factor is insignificant. The authors of [40], by utilizing data of World Bank, the Index of Environmental Sustainability, and the United Nations Development Program found that for inflow and outflow of FDI, governance infrastructure is one of the main variables. Data from the International Country Risk Guide (ICRG) used by [41] concluded that government performance, violence and political instability, rules of law, and regulatory burden have significant effect on FDI inflow. They found that as taxes increase, the cost of production increases, and in the same way, poor institution increases the business operational cost for foreign investor. Poor institution increases risk and uncertainty, which discourages overall investment, including FDI. For the location of FDI, the researchers used a range of institutional factors. First of all, they used a set of variables of institution developed by [42], such as transparency and accountability, non-violence, political stability, government control, no corruption, justice, and regulatory quality. Secondly, to the ICRG database indicator subset, expropriation of risk, government stability, no corruption, accountable democracy, and justice and law was added. Thirdly, the average responses of the country to the World Bank survey on the following determinants were used: (i) Courts quality; (ii) Amendments in rules, regulations, and laws; (iii) Federal government quality; and (iv) Corruption. They found that good quality institutions have a statistically significantly positive impact on FDI. Some institutional aspects have greater impact as compared to others. Unpredictable laws, absence of commitment, public policies, and extraordinary regulatory burden are important determinants of FDI. Latif [43] found FDI is positively affected by institutional quality. This study, for the first time, measured the institutional quality impact on FDI volatility. The study concluded that the existence of institutional determinants of FDI volatility was due to low economic growth, and recommended policy for FDI attraction in domestic economies by offering the “correct” macroeconomic atmosphere, which will not be effective without institutional reforms.

4. Data and Research Methodology

4.1. Data Sources

To evaluate the linkage between sectorial level FDI inflow and institutional quality during 1986–2019, we relied on the quality of institutions index (QI), a comprehensive constructed data index extracted from the International Country Risk Guide (ICRG). Our undermentioned QI comprised of six variables, such as investment profile, accountability, government stability, corruption, law and order, bureaucratic quality, and democratic values, to insure all the key extent and dimensions of QI. Indicators of Institutional quality are too correlated [44,45] and including all variables in single equation is impossible [8]. So, QI is constructed by principal component analysis (PCA) method. The objective of using this method is to combine the six institutional quality indicators into a single variable, which duplicates the original data with minimum information loss. In order to devise the QI index, we utilized diverse statistical scales for selected institutional indicators in the original form of the time series datasets, and certain variables are time invariant. Hence, institutional quality indicator transformations make it time variant, which is more appropriate for time series data analysis. For compatibility of several methods, entire variables from 0–1 are rescaled in such a way that high values indicate strong institutional quality. In doing so, PCA is employed for weight adjustment (i.e., weight given to each factor in developing the QI index). The same technique was also used by [45] in the development of their economic freedom index. Data on primary sectors of FDI inflow (FDIPR), secondary sectors of FDI inflow (FDISR), services sectors of FDI inflow, and aggregated (FDI) inflow are gathered from India Statistical Yearbook 2019. We used two proxies (i.e., for trade openness (TOP), we used Merchandise export (measure in current USD)), and for domestic investment (DI), we used the data of gross fixed capital formation, and these two proxies’ data are obtained from World Bank development indicators (WDI). Similarly, human capital index data are taken from the United Nations Development Program (UNDP). This study uses the infrastructure index (GINF), which comprises 30 indicators of qualitative and quantitative natures to cover all dimensions of infrastructure (both hard and soft), and an unobserved components model (UCM) is employed for the weight determination of each component in developing an index for infrastructure. Additionally, our infrastructure index contains four sub-indices such as energy, finance, communication, and transport. We used only the aggregated infrastructure index as a control variable. Details on the construction of this global infrastructure index are established in [46].

4.2. Econometric Methodology

Dynamic Autoregressive Distributed Lag Simulation model (SARDL) is an advanced form of orthodox ARDL, developed by [47]. There are several advantages of SARDL over the simple ARDL approach: (i) SARDL is used to overcome the issues in simple ARDL estimator for estimation in the long and short run. This novel model has the ability of stimulation, estimation, and robotic calculation of counterfactual adjustment in one explanatory variable and its effect on explained variables while keeping other control variables constant [48,49]. (ii) This model estimates, stimulates, and designs predicted graphs of negative and positive fluctuations in the indicators robotically, along with their statistical values of long- and short-run associations. (iii) SARDL estimates the symmetric and asymmetric shocks in the time series data while [22] the orthodox form of the ARDL procedure is restricted to the assessment of the linkage between dependent and independent variables in the long and short run. Furthermore, the study’s indicators are integrated at their first difference, and levels are mixes of these two, which shows the suitability of the new SARDL model dynamic. The counterfactual adjustment is explanatory and their impact on explained variables are graphically displayed. Just as in previous studies [50,51,52], the empirical findings on the basis of this new dynamic ARDL error correction equations are presented below:
Δ ln F D I = α 0 F D I + i = 1 p ψ i F D I Δ ln F D I + i = 1 p ϕ i F D I Δ ln I Q t i + i = 1 p δ i F D I Δ ln T O P t i + i = 1 p ϖ i F D I Δ ln H C A t i + i = 1 p ϖ i F D I Δ ln D I t i + i = 1 p θ F D I Δ ln G I N F + λ 1 F D I ln F D I t 1 + λ 2 F D I ln I Q t 1 + λ 3 F D I ln T O P t 1 + λ 4 F D I ln H C A t 1 + λ 5 F D I ln D I t 1 + λ 6 F D I ln G N I F t 1 + μ 1 t
Δ ln Q I = α 0 Q I + i = 1 p ψ i Q I Δ ln Q I + i = 1 p ϕ i Q I Δ ln F D I t i + i = 1 p δ i Q I Δ ln T O P t i + i = 1 p ϖ i Q I Δ ln H C A t i + i = 1 p ϖ i Q I Δ ln D I t i + i = 1 p θ Q I Δ ln G I N F + λ 1 Q I ln F D I t 1 + λ 2 Q I ln I Q t 1 + λ 3 Q I ln T O P t 1 + λ 4 Q I ln H C A t 1 + λ 5 Q I ln D I t 1 + λ 6 Q I ln G N I F t 1 + μ 1 t
Note: Δ indicates short run, ln shows natural log, μ 1 and μ 2 represent error terms, p shows variable lags, and λ represents long run. In Equation (1), FDI shows aggregated and disaggregated foreign direct investment, IQ stand for foreign direct investment, TOP presents trade openness, DI explains domestic investment, GINF represents infrastructure index, and HCA displays human capital.

5. Results and Discussions

Before observing the bidirectional causality between sectorial FDI and institutional quality in India, it is substantial to check the stationary variables of the study and whether the variables are stationary at level or first difference. If not, then the empirical findings will be spurious. The results of the descriptive statistics of the study are presented in Table 2. To find out the integration order of the variables of our interest, two diverse unit root tests (i.e., augmented Dickey–Fuller (ADF) and Phillip–Perron (PP) tests) were utilized, which are shown in Table 3. Table 3 shows that all variables of the study are stationary and integrated either at level I(0) or first difference I(1), which clearly confirmed the new dynamic simulated ARDL model procedure, constructed by [47]. The SARDL model permits to choose the different lags for regressions and regressors. Table 4 reveals the structural break in the empirical results of the data from 1986 to 2019. A structural break is an unstructured shock that has a long-term impact on the time series. Traditional testing would generally mistake the structural break for a unit root if this shock is not specifically taken into consideration [51,52]. As a result, the researchers utilized the Zivot–Andrew (ZA) unit root test, which is established after Zivot and Andrew [53]. The ZA test is a variant of the unit root test that assumes a breakpoint to be determined endogenously. As a result, the ZA test for unit root is compared to the trend’s stationary process with a structural breakpoint in slope and intercept.
Table 4 demonstrates that, with the exceptions of lnIQ and lnDIN, all of the selected variables have no unit roots in their levels, according to the ZA structural break unit root test results. The structural breaks, i.e., 2000, 2008, 2006, 2007, 2012, 2010, are reported in the indicator series such as institutional quality, disaggregated and aggregated FDI, human capital, trade openness, and infrastructure index, respectively. The majority of the breakdowns occurred between 2000 and 2012. This could be due to India’s external sector’s globalization and opening up its economy to the rest of the globe in the 2000s. Furthermore, the structural shift in 2006 can be justified by the fact that India’s trade policy underwent the most significant change in that year. Similarly, the structural change in 2008 can be justified on the grounds of financial crises across the globe. Table 2 shows, however, that all of the variables listed below are stationary at first difference I(1).
The short-run estimate and analysis evaluates the immediate influence of an explanatory variable change on the dependent variable, whereas the long-run estimation and analysis evaluates and measures the reaction and speed of adjustment from short-run disequilibrium to long-run equilibrium. For the purposes of this study, the Wald test is used to search for long-term and short-term asymmetry in all variables (see Table 5). In addition, the Wald test is used in this analysis to reveal the long-run asymmetric interaction and its importance. An advantage of the Wald test over the other two is that it only requires the estimation of the unrestricted model, which lowers the computational burden as compared to the likelihood-ratio test. We used the ARDL bound test for evaluating long-run associations in selected variables of the study, prior to examining the statistical results of the simulated dynamic ARDL bound test. The decision of rejection or acceptance of the hypothesis (i.e., both null and alternative) is based on estimated F-statistic values. The presence of a long-run linkage in the study’s variables is detected if the estimated F-statistic values are more than lower bound’s values [22]. If the estimated value of the F-statistics Narayan [54] suggested that the critical values narrated by Pesaran [21] are applicable in case of large sample size only; in case of small sample size, it is not applicable) are between the upper and lower values, then the decision will be ambiguous. The ARDL approach is comparatively more convenient than other time series techniques [22]. A simple ARDL estimator can be employed when indicators of the study are stationary at level I(0) or first difference (1). For the empirical analysis of our indicators, several lags are applies for regressors and regressions. In our empirical findings, the ARDL bound test indicates the existence of cointegration amongst selected variables shown in Table 5.
The results in Table 5 and Table 6 show the estimated ARDL bound values. The estimated values of the F-statistics are greater than upper bound values at 2.5%, 10%, and 5% levels of significance for all the indicators of the study. The Wald-based bound test’s estimated results are in Table 5 and Table 6 for long-run association. The variables, including infrastructure, institutional quality, human capital index, trade openness, and domestic investment, are introduced gradually to the cointegration analysis of the relationship between sectorial FDI and institutional quality in India. The estimated F-statistic shows significant values in Table 5 and Table 7, so alternative hypothesis (H1) is accepted, and the null hypothesis (Ho) is rejected. These empirical findings reveal a potential long-run linkage between institutional quality and sectorial-level FDI inflows. In addition to the main variables are the control variables of domestic investment, infrastructure, trade openness, and human capital index in sectorial FDI and institutional quality in India. These results approve the outcomes of [48,55]. The introduction of infrastructure, domestic investment, human capital index, and trade openness to the Equations (1) and (2) considerably improved the model’s power.
We performed several econometrics tests (such as the Breush–Godfrey LM test for serial or autocorrelation problems, the Breusch –Pagan–Godfrey for heteroscedasticity, Jarque–Bera for examination of the normal distribution of the selected time series data, and Ramsey RESET for specification problem). The empirical results of the mentioned tests are shown in Table 7. These econometrics tests were employed for robustness and reliability checks in the given model. The Breusch–Godfrey LM test’s empirical result suggest that the model is free from serial correlations issue. The empirical results of the Breusch–Pagan–Godfrey test shows that the models are free of heteroscedasticity problems. The Ramsey RESET test results suggest the correct specification good fit of the model. Finally, the Jarque–Bera test reveals that the residuals of the present models are normally distributed. The CUSUM test is presented in Figure 4 and Figure 5, which shows that the selected models are stable.
Although long-run association is a necessary condition, it is not sufficient for finding a causal relationship among variables [52,55]. The variables’ long-run relationship affirms that, at least, there must be unidirectional causality between the study’s variables without indicating causality direction [43]. So, we estimate VECM for the identification of the direction of the short-run and long-run causal relationships between institutional quality and FDI. The granger causality test results presented in Table 8 reveal the long-run and short-run causalities from aggregated FDI to institutional quality. The results show significant coefficients of error correction terms (EC) when FDI, FDIPR, FDISR, and FDITR are used as regression variables. Reversely, ECT is also significant when QI is used as a regression variable (see Table 8, lower part). From these results, it is suggested that long-run causality exists from QI to FDI and also from FDI (aggregated and disaggregated) to QI, which confirms that institutional quality is important for FDI attraction in primary, services, and secondary sectors in India.
The empirical findings of the simulated ARDL dynamic model are presented in Table 9. The simulated ARDL dynamic model is helpful in stimulation, estimation, and designing for forecasting positive and negative variations graphs in variables automatically without losing their short- and long-run coefficients (see Figure 6). All these are the priorities of the new simulated ARDL dynamic model over the classical ARDL procedure because the orthodox ARDL version is capable of assessing the short-run and long-run associations of variables of study [56,57,58]. The statistical findings of the simulated ARDL dynamic model are displayed in Table 9. Table 9’s statistical results established that institutional quality significantly positively affects aggregated and disaggregated FDI inflows in the short and long run in the Indian economy. The current empirical results are in line with the idea that institutional quality is interesting for foreign investors because it decreases the implementation cost and makes doing business easy in host countries. Meanwhile, inadequate institutions impede FDI, and its effects are similar to a tax, increasing FDI opportunity cost [7]. Investors are unwilling to invest in a country that has poor institutional quality where there is a culture of red tape, nepotism, and corruption because these factors increase business operational costs [9,48,55]. The results of other regressors, i.e., infrastructure, domestic investment, human capital, and trade openness, increase FDI in all sectors such as the primary, secondary, and services sectors in the short run and long run in India. These results are in line with those of [48,54].
Table 10 shows the effect of aggregated and disaggregated FDI on Indian institutional quality (see Figure 7). The empirical results of the study affirm that aggregated and disaggregated FDI inflows have significant positive effects on institutional quality in the long run. These empirical results are similar to the idea that FDI’s positive role in economics has become a self-evident truth where technological, savings, and investment gaps are covered by foreign firms through the provision of technology and cash to the recipient economy. FDI provides opportunity to local firms for learning from foreign firms either by doing with these firms or watching and infuse a sense of competition in local firms and institutions, which boosts host country productivity. In [13], it is suggested that competition in attracting FDI has positive contributions in FDI-aspirant countries and call for prodigious positive change of FDI and introduce to rival recipient countries a ‘race to the top’. FDI not only transfers innovation in productive technology, but it also improves the institutional quality, which contributes to the domestic economy [59]. These consequences are the most obvious in economies with low tolerance for corruption and informal business activity [34]. The results of other control variables, i.e., human capital, domestic investment, infrastructure, and trade openness have significant positive effects on institutional quality. This effect is often dual, especially regarding the trade openness and institutional factors affecting the credit cycles and trade dynamics, respectively [56,57]. These results are in line with [59] in the long run and short run for China. The same findings are also typical for developing countries with their patterns of human capital and investment potential changes influenced by institutional environment quality [45].

6. Conclusions and Policy Implication

Market connectivity is deteriorated by inadequate institutions, which create hurdles to trade potential, create frictions in markets, and impose unnecessary delays, and thus the overall cost of production is increased, which adversely affects FDI inflow in the home economy. The poor quality of institutions adversely affects the competitive edge of an economy, while the availability of good quality institutions improves its comparative advantage, both on international as well as on domestic fronts.
We used a new simulated ARDL dynamic approach on annual data from 1986–2019 to find out the long-run and short-run associations of institutional quality with FDI. The empirical results of the study affirm the existence of significant causal relationships between institutional quality and aggregated and disaggregated FDI inflow. The empirical outcome of the study suggests that the quality of institutions attracts FDI inflow in India (i.e., institutional quality has a significant and positive effect on aggregated and disaggregated FDI inflows in the short run and long run). Reversely, FDI inflow improves the quality of institutions (e.g., law and order, domestic accountability, investment profile, bureaucratic quality, political stability, and corruption). It is good news for policymakers in India who want to catch up to developed economies and to minimize the gap between India and developed economies, particularly in attracting FDI inflows. These empirical outcomes also negate the claim of [54] that Indian firms are independent of quality of domestic institutions. Rather, the results indicate that institutional quality is highly skill intensive and confident in India, and thus encouraging domestic firms’ development would be an efficient way to improve FDI inflow rate. In addition to the main variables, the explanatory control variables such as infrastructure, domestic investment, trade openness, and human capital also have positive and significant effects on the aggregated and disaggregated FDI inflow and quality of institutions, which means reformed open policy for further development in institutional quality system is also important for the enhancement of FDI inflow in India.

Author Contributions

Conceptualization, F.U.R. and E.A.; methodology, F.U.R.; software, M.A.K., formal analysis M.A.K.; validation, E.A.; investigation, F.U.R. and Z.L.; resources, Z.L. and J.P.; data curation, F.U.R. and E.A.; writing—original draft preparation, F.U.R. and E.A.; writing— review and editing, M.A.K. and Z.L.; supervision, M.A.K. and Z.L.; project administration, M.A.K. and J.P.; funding acquisition, Z.L. and J.P. All authors have read and agreed to the published version of the manuscript.

Funding

This research received no external funding.

Institutional Review Board Statement

Not applicable.

Informed Consent Statement

Not applicable.

Data Availability Statement

The data used in present study may be made available on request to the corresponding authors.

Acknowledgments

We are very thankful to the Graduate School of Economics and Management, Ural Federal University, for technical support.

Conflicts of Interest

The authors declare no conflict of interest.

References

  1. Rehman, F.U.; Ahmad, E.; Khan, M.; Popp, J.; Oláh, J. Does Trade Related Sectoral Infrastructure Make Chinese Exports More Sophisticated and Diversified? Sustainability 2021, 13, 5408. [Google Scholar] [CrossRef]
  2. Fon, R.M.; Filippaios, F.; Stoian, C.; Lee, S.H. Does foreign direct investment promote institutional development in Africa? Int. Bus. Rev. 2021, 30, 101835. [Google Scholar] [CrossRef]
  3. Contractor, F.J. The world economy will need even more globalization in the post-pandemic 2021 decade. J. Int. Bus. Stud. 2021, 1–16. [Google Scholar] [CrossRef] [PubMed]
  4. Kottaridi, C.; Giakoulas, D.; Monolopoulos, D. Escapism FDI from developed Economies: The Role of Regulatory Context and Corporate Taxation. Int. Bus. Rev. 2019, 28, 36–47. [Google Scholar] [CrossRef]
  5. Soh, K.L.; Wong, W.P.; Tang, C.F. The role of institutions at the nexus of logistic performance and foreign direct investment in Asia. Asian J. Shipp. Logist. 2021, 37, 165–173. [Google Scholar] [CrossRef]
  6. Azzimonti, M. Does partisan conflict deter FDI inflows to the US? J. Int. Econ. 2019, 120, 162–178. [Google Scholar] [CrossRef]
  7. Camarero, M.; Moliner, S.; Tamarit, C. Japan’s FDI drivers in a time of financial uncertainty. New evidence based on Bayesian Model Averaging. Jpn. World Econ. 2021, 57, 101058. [Google Scholar] [CrossRef]
  8. Chen, D.; Yu, X.; Zhang, Z. Foreign direct investment comovement and home country institutions. J. Bus. Res. 2019, 95, 220–231. [Google Scholar] [CrossRef]
  9. Cicatiello, L.; De Simone, E.; Ercolano, S.; Gaeta, G.L. Assessing the impact of fiscal transparency on FDI inflows. Socio-Econ. Plan. Sci. 2021, 73, 100892. [Google Scholar] [CrossRef]
  10. Wang, L.-H.; Lin, C.-H.; Fung, H.-G.; Kao, T.-C. Foreign direct investment and downside risk: Evidence from Taiwan. Pac.-Basin Financ. J. 2019, 57, 101114. [Google Scholar] [CrossRef]
  11. Tang, R.W. Pro-market institutions and outward FDI of emerging market firms: An institutional arbitrage logic. Int. Bus. Rev. 2021, 30, 101814. [Google Scholar] [CrossRef]
  12. Piteli, E.; Kafouros, M.; Pitelis, C.N. Follow the people and the money: Effects of inward FDI on migrant remittances and the contingent role of new firm creation and institutional infrastructure in emerging. J. World Bus. 2021, 56, 101178. [Google Scholar] [CrossRef]
  13. Nam, J.; Bon Sesay, J.; Wynne, K.; Zhang, G. Financial efficiency and accounting quality: The impact of institutional micro-factors on FDI. J. Policy Model. 2020, 42, 451–465. [Google Scholar] [CrossRef]
  14. François, A.; Panel, S.; Weill, L. Educated dictators attract more foreign direct investment. J. Comp. Econ. 2020, 48, 37–55. [Google Scholar] [CrossRef]
  15. Challe, E.; Lopez, J.I.; Mengus, E. Institutional quality and capital inflows: Theory and evidence. J. Int. Money Financ. 2019, 96, 168–191. [Google Scholar] [CrossRef]
  16. Antonietti, R.; Franco, C. From FDI to economic complexity: A panel Granger causality analysis. Struct. Chang. Econ. Dyn. 2021, 56, 225–239. [Google Scholar] [CrossRef]
  17. Gu, J. FDI characteristics, industry homogeneity, and audit fees in Japanese multinationals. J. Multinatl. Financ. Manag. 2021, 61, 100678. [Google Scholar] [CrossRef]
  18. Kellard, N.M.; Kontonikas, A.; Lamla, M.J.; Maiani, S.; Wood, G. Risk, financial stability and FDI. J. Int. Money Financ. 2020, 120, 102232. [Google Scholar] [CrossRef]
  19. Slesman, L.; Abubakar, Y.A.; Mitra, J. Foreign direct investment and entrepreneurship: Does the role of institutions matter? Int. Bus. Rev. 2021, 30, 101774. [Google Scholar] [CrossRef]
  20. Heavilin, J.; Songur, H. Institutional distance and Turkey’s outward foreign direct investment. Res. Int. Bus. Financ. 2020, 54, 101299. [Google Scholar] [CrossRef]
  21. Jordan, S.; Philips, A.Q. Cointegration testing and dynamic simulations of autoregressive distributed lag models. Stata J. 2018, 18, 902–923. [Google Scholar] [CrossRef] [Green Version]
  22. Pesaran, M.H.; Shin, Y.; Smith, R.J. Bounds testing approaches to the analysis of level relationships. J. Appl. Econom. 2001, 16, 289–326. [Google Scholar] [CrossRef]
  23. Reddy, K.S. Pot the ball? Sovereign wealth funds’ outward FDI in times of global financial market turbulence: A yield institu-tions-based view. Cent. Bank Rev. 2019, 19, 129–139. [Google Scholar] [CrossRef]
  24. Srivastava, S. The role of foreign direct investment in India’s services exports: An empirical investigation. Singap. Econ. Rev. 2006, 51, 175–194. [Google Scholar] [CrossRef]
  25. Asiedu, E.; Dynamics, A.V.-M. Discount factors and thresholds: Foreign investment when enforcement is imperfect. Macroecon. Dyn. 2000, 4, 1–21. [Google Scholar] [CrossRef] [Green Version]
  26. Campos, J.; Lien, D.; Pradhan, S. The impact of corruption on investment: Predictability matters. World Dev. 1999, 27, 1059–1067. [Google Scholar] [CrossRef]
  27. Gastanaga, V.; Nugent, J.B.; Pashamova, B. Host country reforms and FDI inflows: How much dif-ference do they make? World Dev. 1998, 26, 1299–1314. [Google Scholar] [CrossRef]
  28. Liu, H.; Islam, M.; Khan, M.; Hosain, M.I.; Pervaiz, K. Does financial deepening attract foreign direct investment? Fresh evidence from panel threshold analysis. Res. Int. Bus. Financ. 2020, 53, 101198. [Google Scholar] [CrossRef]
  29. Aust, V.; Morais, A.I.; Pinto, I. How does foreign direct investment contribute to Sustainable Development Goals? Evidence from African countries. J. Clean. Prod. 2020, 245, 118823. [Google Scholar] [CrossRef]
  30. Ali, F.; Fiess, N.; MacDonald, R. Climbing to the top? Foreign direct investment and property rights. Econ. Inq. 2010, 49, 289–302. [Google Scholar] [CrossRef] [Green Version]
  31. Ades, A.; Di Tella, R. Rents, Competition, and Corruption. Am. Econ. Rev. 1999, 89, 982–993. [Google Scholar] [CrossRef]
  32. Ahmad, M.; Alam, S.; Butt, M.; Haroon, Y. Foreign direct investment, exports, and domestic output in Pakistan. Pak. Dev. Rev. 2003, 42, 715–723. [Google Scholar] [CrossRef] [Green Version]
  33. Alfaro, L.; Kalemli-Ozcan, S.; Volosocych, V. Capital Flows in a Globalized World: The Role of Policies and Institutions. In Capital Controls and Capital Flows in Emerging Economies: Policies, Practices, and Consequences; University of Chicago Press: Chicago, IL, USA, 2007; pp. 19–72. [Google Scholar]
  34. Fuentelsaz, L.; Garrido, E.; Maicas, J.P. The effect of informal and formal institutions on foreign market entry selection and performance. J. Int. Manag. 2020, 26, 100735. [Google Scholar] [CrossRef]
  35. Jung, J. Institutions and Telecommunications Investment. Inf. Econ. Policy 2020, 50, 100849. [Google Scholar] [CrossRef]
  36. Lakshmi, G.; Saha, S.; Bhattarai, K. Does corruption matter for stock markets? The role of heterogeneous institutions. Econ. Model. 2021, 94, 386–400. [Google Scholar] [CrossRef] [PubMed]
  37. Athreye, S.; Saeed, A.; Baloch, M.S. Financial crisis of 2008 and outward foreign investments from China and India. J. World Bus. 2021, 56, 101190. [Google Scholar] [CrossRef]
  38. Buchanan, B.G.; Le, Q.V.; Rishi, M. Foreign direct investment and institutional quality: Some empirical evidence. Int. Rev. Financ. Anal. 2012, 21, 81–89. [Google Scholar] [CrossRef]
  39. Bhagwati, J.N. In Defence of Globalization; Oxford University Press: Oxford, UK, 2007. [Google Scholar]
  40. Globerman, S.; Shapiro, D. Global Foreign Direct Investment Flows: The Role of Governance Infrastructure. World Dev. 2002, 30, 1899–1919. [Google Scholar] [CrossRef]
  41. Uddin, M.; Chowdhury, A.; Zafar, S.; Shafique, S.; Liu, J. Institutional determinants of inward FDI: Evidence from Pakistan. Int. Bus. Rev. 2019, 28, 344–358. [Google Scholar] [CrossRef]
  42. Dang, D.A. How foreign direct investment promote institutional quality: Evidence from Vietnam. J. Comp. Econ. 2013, 41, 1054–1072. [Google Scholar] [CrossRef]
  43. Abdel-Latif, H. FDI response to political shocks: What can the Arab Spring tell us? J. Behav. Exp. Financ. 2019, 24, 100233. [Google Scholar] [CrossRef]
  44. Zhang, M.; Li, G.; Mu, H.L.; Ning, Y.D. Energy and energy efficiencies in the Chinese transportation sector, 1980–2009. Energy 2011, 36, 770–776. [Google Scholar] [CrossRef]
  45. Rehman, F.U.; Noman, A.A.; Ding, Y. Does infrastructure increase exports and reduce trade deficit? Evidence from selected South Asian countries using a new Global Infrastructure Index. J. Econ. Struct. 2020, 9, 1–23. [Google Scholar] [CrossRef] [Green Version]
  46. Rehman, F.; Ding, Y.; Noman, A.A.; Khan, M.A. The nexus between infrastructure and export: An empirical evidence from Pakistan. Glob. J. Emerg. Mark. Econ. 2020, 12, 141–157. [Google Scholar] [CrossRef]
  47. Jordan, S.; Philips, A.Q. Dynamic simulation and testing for single-equation cointegrating and stationary autoregressive distributed lag models. R J. 2019, 10, 469. [Google Scholar] [CrossRef] [Green Version]
  48. Sarkodie, S.; Strezov, V.; Weldekidan, H.; Asamoah, E.F.; Owusu, P.A.; Doyi, I.N.Y. Environmental sustainability assessment using dynamic autoregressive-distributed lag simulations—Nexus between greenhouse gas emissions, biomass energy. Sci. Total Environ. 2019, 668, 318–332. [Google Scholar] [CrossRef] [PubMed]
  49. Khan, M.A.; Ahmed, M.; Popp, J.; Oláh, J. US Policy Uncertainty and Stock Market Nexus Revisited through Dynamic ARDL Simulation and Threshold Modelling. Mathematics 2020, 8, 2073. [Google Scholar] [CrossRef]
  50. Ketteni, E.; Kottaridi, C. The impact of regulations on the FDI-growth nexus within the institution-based view: A nonlinear specification with varying coefficients. Int. Bus. Rev. 2019, 28, 415–427. [Google Scholar] [CrossRef]
  51. Rehman, F.; Ding, Y.; Noman, A.A.; Khan, M.A. China’s outward foreign direct investment and exports diversification: An asymmetric analysis. J. Chin. Econ. Foreign Trade Stud. 2020, 13, 45–69. [Google Scholar] [CrossRef]
  52. Rehman, F.; Ding, Y. The nexus between outward foreign direct investment and export sophisti-cation: New evidence from China. Appl. Econ. Lett. 2019, 27, 357–365. [Google Scholar] [CrossRef]
  53. Zivot, E.; Andrews, D.W.K. Further Evidence on the Great Crash, the Oil-Price Shock, and the Unit-Root Hypothesis. J. Bus. Econ. Stat. 2002, 20, 25–44. [Google Scholar] [CrossRef]
  54. Narayan, P.K. The saving and investment nexus for China: Evidence from cointegration tests. Appl. Econ. 2005, 37, 1979–1990. [Google Scholar] [CrossRef]
  55. Gupta, S.; Kumar, N. Time varying dynamics of globalization effect in India. Port. Econ. J. 2020, 1–17. [Google Scholar] [CrossRef]
  56. Bahmani-Oskooee, M.; Mohammadian, A. Who benefits from euro depreciation in the euro zone? Empirica 2019, 46, 577–595. [Google Scholar] [CrossRef]
  57. Bahmani-Oskooee, M.; Ratha, A. The J-Curve: A literature review. Appl. Econ. 2004, 36, 1377–1398. [Google Scholar] [CrossRef]
  58. Lucarelli, S.; Andrini, F.U.; Bianchi, A. Euro depreciation and trade asymmetries between Germany and Italy versus the US: Industry-level estimates. Appl. Econ. 2018, 50, 15–34. [Google Scholar] [CrossRef]
  59. Rehman, F.U.; Khan, M.A.; Pervaiz, K.; Liaqat, I. The causal, linear and nonlinear nexus between sectoral FDI and infrastructure in Pakistan: Using a new global infrastructure index. Res. Int. Bus. Financ. 2020, 52, 101129. [Google Scholar] [CrossRef]
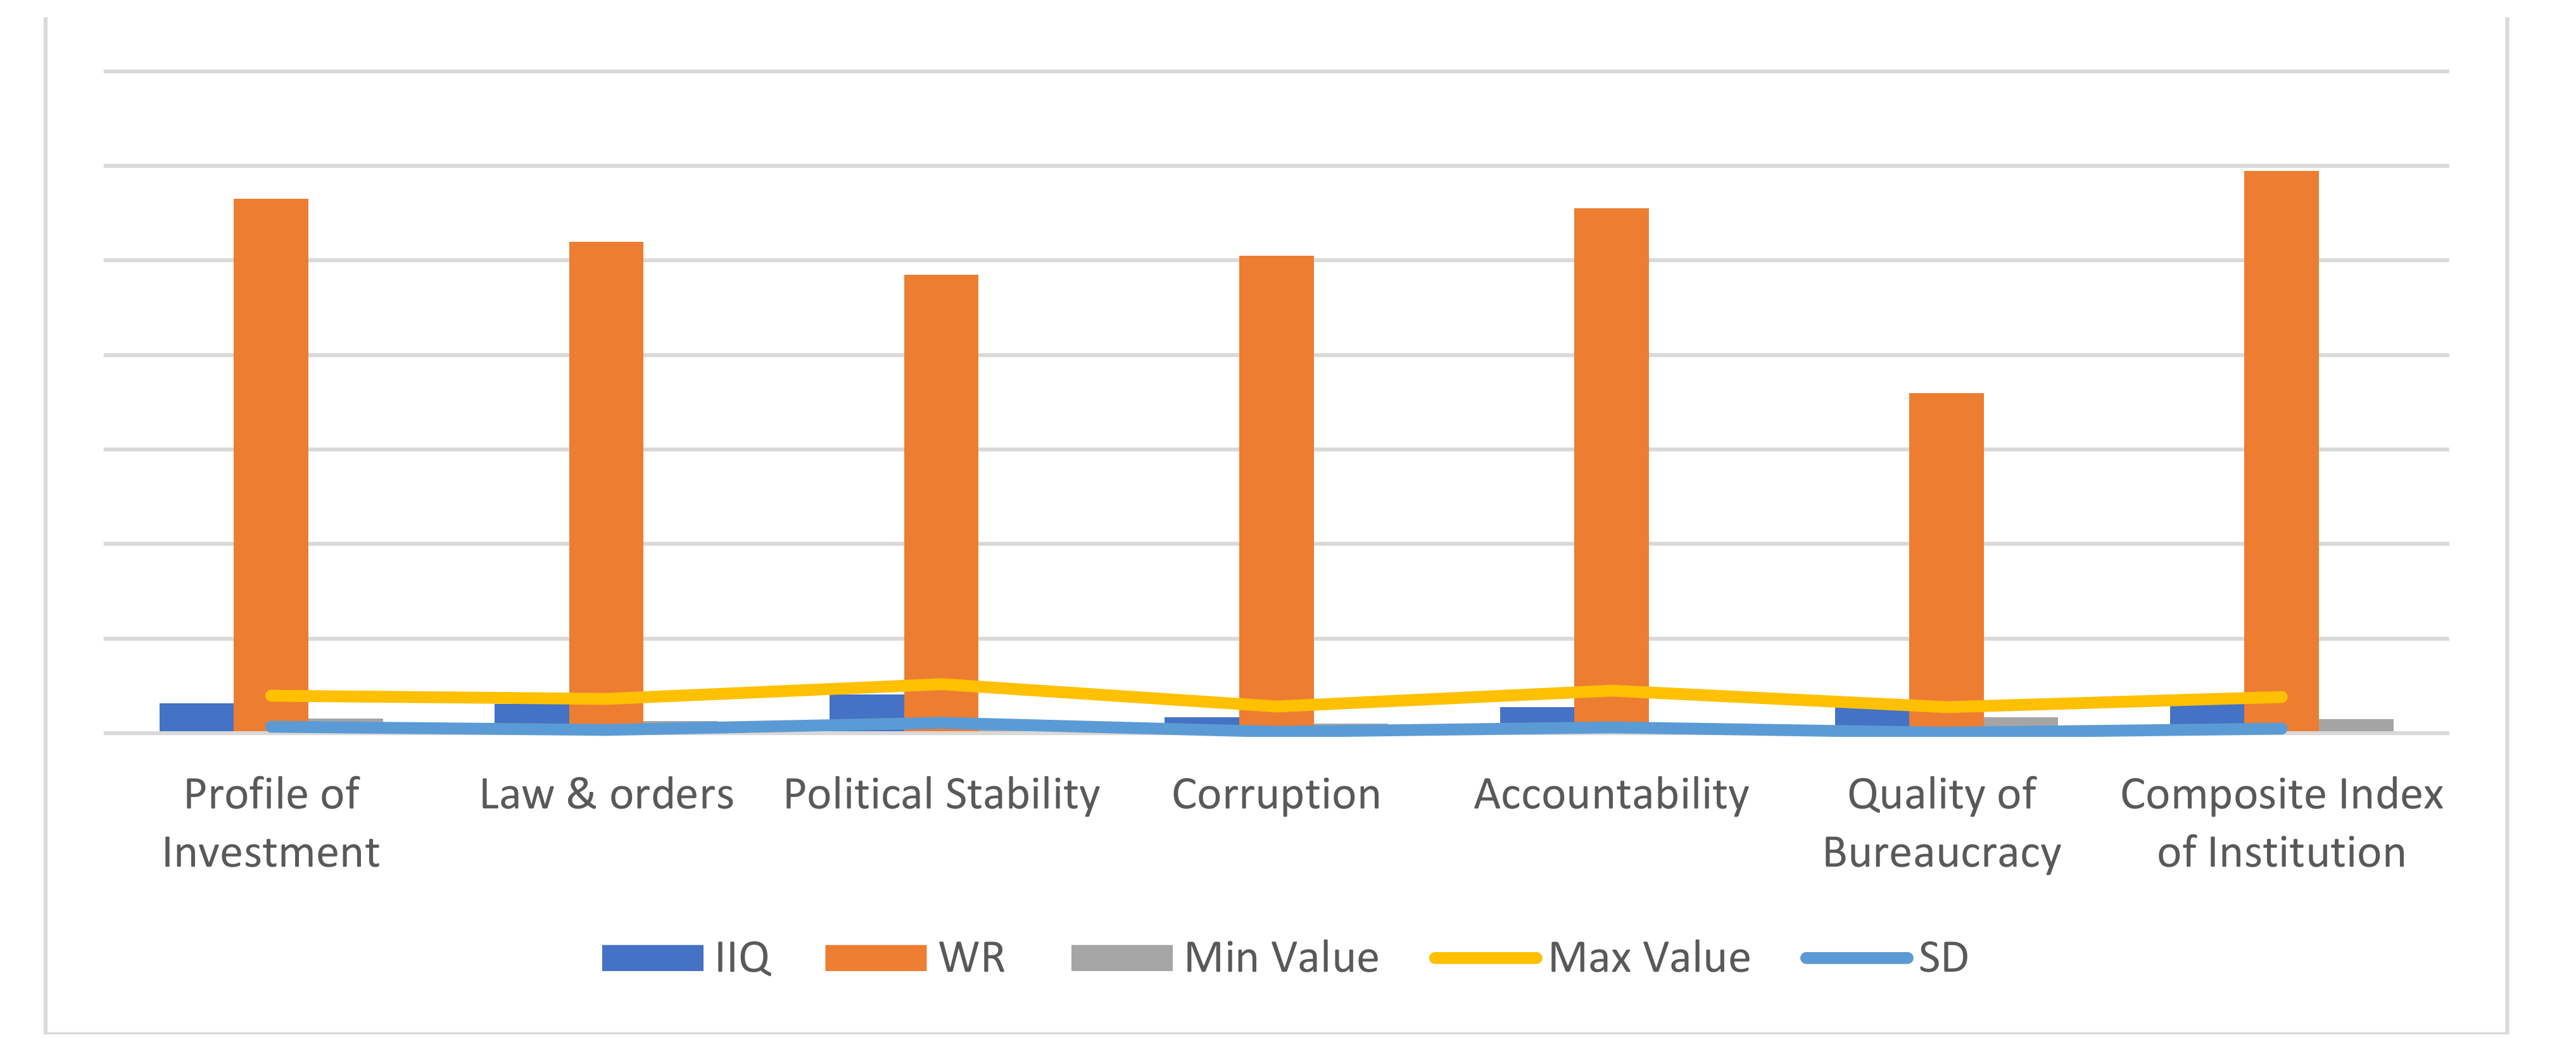
Figure 1. Percentage of various economic groups in total FDI. Source: Authors own calculations.
Sustainability 13 13760 g001
Note: Mining: quarrying, oil, and gas mining; Manufacturing: manufacturing; Utilities: power and utilities; Trade: Commerce and trade; Transport: transport, communications, storage, social, personal, and financial services.
Figure 2. Sector-wise performance index of FDI. Source: Authors own calculations.
Sustainability 13 13760 g002
Figure 3. Indian quality of institution index (1980–2019). Source: Authors own calculations. IIQ stands for institutional quality index; GR: Global Ranking.
Sustainability 13 13760 g003
Figure 4. CUSUM test (FDI to Institutional Quality).
Sustainability 13 13760 g004
Figure 5. CUSUM test (Institutional Quality to FDI).
Sustainability 13 13760 g005
Figure 6. Response of FDI to 10% ± shock in lnIQ.
Sustainability 13 13760 g006
Figure 7. Response of institutional quality to 10% ± shock in aggregated and disaggregated FDI, respectively.
Sustainability 13 13760 g007aSustainability 13 13760 g007b
Table 1. Indian Quality of Institution Index (1980–2019).
IIQWR Min ValueMax ValueSD
Invest.Profile6.311133.117.931.42
Law and orders6.171042.57.310.67
Political8.16972.4710.372.19
Corruption3.411011.975.70.31
Accountability5.531111.058.971.17
Bureaucracy 6.73723.315.510.10
Total Index of Institution6.611192.917.690.98
Source: Authors own calculations. IIQ stands for institutional quality index; GR: Global Ranking.
Table 2. Descriptive statistics.
VariablesObsMeanSt.DevMinMax
QI300.0961.048−1.7141.846
FDIPR30117.348147.104−3.689564.13
FDISR30647.094346.24119.691483.40
FDITR30641.273997.95−183.103859.50
FDI301546.101482.788271.905591
TOP300.330.0380.2540.388
HCA3053.591.3855.2156.60
DIN30−0.6280.063−0.768−0.447
GINF30−0.6740.235−1.93−0.32
Table 3. Results of unit root.
ADF TestDF-GLS Test
VariablesI(0)I(1)I(0)I(1)
QI−1.279−4.395 ***1.392−5.128 ***
FDIPR−5.689 ***−5.344 ***−5.892 ***−5.351 ***
FDISR−1.483−3.753 **−1.583−3.935 ***
FDITR−2.551−3.224 **−2.702−3.368 ***
FDI−2.852−3.362 **−2.971 *−3.542 ***
TOP−2.402−6.346 ***−2.538−6.157 ***
HCA−3.697 **−4.425 ***−2.583−4.948 ***
DIN−5.578 ***−6.383 ***−5.803 ***−6.38 ***
GINF−1.982−5.358 ***−1.542−5.483 ***
*, **, *** signifies 10%, 5%, and 1% significance levels, respectively.
Table 4. Zivot–Andrews results.
VariablesI(0)BreakI(1)Break
QI−2.542005−4.94 ***2000
FDIPR−6.345 ***2003−6.47 ***2008
FDISR−2.732010−4.54 **2007
FDITR−3.452008−5.29 ***2006
FDI−3.252008−5.41 ***2012
TOP−3.112013−6.52 ***2006
HCA−2.631998−4.71 **2006
DIN−5.92 ***2009−6.29 ***2012
GINF−2.752003−4.52 **2010
**, *** signifies 10%, 5%, and 1% significance levels, respectively.
Table 5. ARDL cointegration bounds test and ECT (−1).
QI to Aggregated and Disaggregated FDI
FDI
[1]
FDISR
[2]
FDIPR
[3]
FDITR
[4]
VariablesF-statECTF-StatECTF-StatECTF-StatECT
FDI/QI4.84 *−2.132.38−2.117.49 ***−2.497.67 **−2.80
FDI/QI/GINF3.08−2.351.75−3.555.67 **−2.515.27 **−2.91
FDI/QI/GINF/HCA3.86 *−6.21 ***3.31−5.58 ***12.51 ***−6.14 **2.95−4.19
FDI/QI/GINF/HCA/TOP11.8 ***−8.75 ***8.61 ***5.42 ***9.54 ***−6.16 **4.43 **−7.31 **
FDI/QI/GINF/HCA/TOP/DI7.25 ***−9.2 ***−9.67 ***4.05 *4.14 *−6.16 ***5.61 ***−7.35 ***
*, **, *** signifies 10%, 5%, and 1% significance levels, respectively.
Table 6. ARDL cointegration bounds test and ECT (−1).
Aggregated and Disaggregated FDI to QI
FDI
[1]
FDISR
[2]
FDIPR
[3]
FDITR
[4]
VariablesF−StatECTF−StatECTF−StatECTF−StatECT
QI/FDI8.32 ***−0.78 ***7.49 **−0.283.48−0.373.48−0.28
QI/FDI/GINF5.51 **−0.78 ***4.86 **−0.242.26−0.382.26−0.34
QI/FDI/GINF/HCA4.37 **−0.82 ***3.82 *−0.46 ***2.16−0.68 ***2.13−0.26 **
QI/FDI/GINF/HCA/TOP3.62 **−0.73 ***3.72 *−0.49 ***3.9 **−0.73 ***3.99 **−0.37 **
QI/FDI/GINF/HCA/TOP/DIN4.94−0.64 ***4.71 **−0.47 ***3.42 *−0.72 ***2.09−0.46 **
*, **, *** signifies 10%, 5%, and 1% significance levels, respectively.
Table 7. Diagnostic tests.
Econometric IssuesTest NamesF-Statisticsp-ValuesNull-Hypothesis Accepted/RejectedEquations
HeteroscedasticityBreusch–Pagan–Godfrey0.2610.642Accepted Equation   1
Serial CorrelationBreusch–Godfrey LM0.7960.478Accepted
NormalityJarque–Bera 4.7730.219Accepted
SpecificationRamsey RESET2.5440.142Accepted
HeteroscedasticityBreusch–Pagan–Godfrey2.1650.615Accepted Equation   2
Serial CorrelationBreusch–Godfrey LM2.9420.340Accepted
NormalityJarque–Bera0.1080.831Accepted
SpecificationRamsey RESET0.1370.756Accepted
Table 8. Results of Granger causality test.
Dependent VariablesShort Run (F-Stat)Long Run (ECT)Status
H1
Aggregated FDI to QI
D.QID.GINFD.HCAD.TOPQIGINFHCATOPAccepted
DFDI0.332.277.497 ***0.47−0.27 ***−0.45 ***−0.44 ***−0.27 ***Accepted
FDIPR to QI
DFDI0.0350.670.951 ***0.043−0.87 ***−0.83 ***−0.80 ***−0.88 ***Accepted
FDISR to QI
DFDI1.411.114.51 ***2.58 *−0.12 **−0.13 **−0.38 ***−0.17 **Accepted
FDITR to QI
DFDI0.771.951.530.28−0.30 ***−0.27 ***−0.52 ***−0.28 ***Accepted
QI to Aggregated FDI (Reverse Causality)
D.FDID.QID.HCAD.TOPFDIQIHCATOP
DQI5.98 ***0.493.65 **0.09−0.17 ***−0.25 ***−0.15 ***0.18 ***Accepted
QI to FDIPR (Reverse Causality)
DQI2.23 *0.450.493.81 **−0.91 ***0.92 ***0.95 ***0.94 ***Accepted
QI to FDISR (Reverse Causality)
DQI1.480.254.51 ***0.880.51 ***0.34 ***−0.85 ***−0.43 ***Accepted
QI to FDITR (Reverse Causality)
DQI1.062.13 *0.412.35 *−0.27 ***−0.36 ***−0.37 ***−0.56 ***Accepted
*, **, *** signifies 10%, 5%, and 1% significance levels, respectively.
Table 9. Asymmetric impact of QI on disaggregated and aggregated FDI.
VariablesFDI
[1]
FDIPR
[2]
FDISR
[3]
FDITR
[4]
Short   run   Dynamics
lnFDI 0.421 **0.1640.1380.201
(0.015)(0.285)0.163)(0.341)
lnQI 0.214 **0.1010.3930.458
(0.042)(0.295)0.274)(0.528)
lnHCA 5.58 ***1.302 **7.34 ***−8.83 *
(1.523)(0.852)(2.624)(3.725)
lnTOP 6.47 **11.293.1825.472
(1.528)(14.842)(2.264)(6.725)
lnGINF 3.47 ***3.6858.2636.581 ***
(0.328)(3.716)(9.625)(3.872)
lnDI −3.68 **−2.7912.64−11.51
(1.625)(3.726)(13.924)(9582)
Long   run   Dynamics
lnFDI 0.689 **0.207 *3.294 ***1.504 ***
(0.062)(0.074)(0.973)(0.042)
lnIQ −0.876 **2.38 ***10.27 ***7.759 ***
(0.023)(0.528)(4.827)(5.826)
lnGINF 0.937 **0.655 *0.386 *0.191
(0.064)(0.924)(0.173)(0.620)
lnTOP 4.35 **10.58 ***12.86 ***10.37 ***
(1.623)(3.825)(6.74)(7.105)
lnHCA 35.53 **10.35 **47.47 ***56.49 ***
(18.726)(5.104)(28.618)(10.815)
lnDI 1.36 *−0.83 *5.67−4.27
(0.805)(0.091)(6.810)(3.326)
Constant   −21.94 ***−66.82 ***−31.21 **−43.53 ***
(3.917)(4.325)(6.160)(5.013)
F test   PSS 7.28 ***3.27 **1.212.85
Observations 34343434
R   Square   Adj . 0.9010.9320.8930.912
Asymmetry   statistic
Asymmetries   SR 0.412 *0.141 *8.52 ***0.013
Asymmetries   LR 5.23 ***1.93 *1.45 *1.92 *
*, **, *** signifies 10%, 5%, and 1% significance levels, respectively. The values in parentheses show standard errors.
Table 10. Asymmetric impact of QI on disaggregated and aggregated FDI.
VariablesFDI
[1]
FDIPR
[2]
FDISR
[3]
FDITR
[4]
Short   run   Dynamics
lnFDI 0.421 **0.1640.1380.201
(0.015)(0.285)0.163)(0.341)
lnQI 0.214 **0.1010.3930.458
(0.042)(0.295)0.274)(0.528)
lnHCA 5.58 ***1.302 **7.34 ***−8.83 *
(1.523)(0.852)(2.624)(3.725)
lnTOP 6.47 **11.293.1825.472
(1.528)(14.842)(2.264)(6.725)
lnGINF 3.47 ***3.6858.2636.581 ***
(0.328)(3.716)(9.625)(3.872)
lnDI −3.68 **−2.7912.64−11.51
(1.625)(3.726)(13.924)(9582)
Long   run   Dynamics
lnFDI 0.689 **0.207 *3.294 ***1.504 ***
(0.062)(0.074)(0.973)(0.042)
lnIQ −0.876 **2.38 ***10.27 ***7.759 ***
(0.023)(0.528)(4.827)(5.826)
lnGINF 0.937 **0.655 *0.386 *0.191
(0.064)(0.924)(0.173)(0.620)
lnTOP 4.35 **10.58 ***12.86 ***10.37 ***
(1.623)(3.825)(6.74)(7.105)
lnHCA 35.53 **10.35 **47.47 ***56.49 ***
(18.726)(5.104)(28.618)(10.815)
lnDI 1.36 *−0.83 *5.67−4.27
(0.805)(0.091)(6.810)(3.326)
Constant   −21.94 ***−66.82 ***−31.21 **−43.53 ***
(3.917)(4.325)(6.160)(5.013)
F test   PSS 7.28 ***3.27 **1.212.85
Observations 34343434
R   Square   Adj . 0.9010.9320.8930.912
Asymmetry   statistic
Asymmetries   SR 0.412 *0.141 *8.52 ***0.013
Asymmetries   LR 5.23 ***1.93 *1.45 *1.92 *
*, **, *** signifies 10%, 5%, and 1% significance levels, respectively. The values in parentheses show standard errors.
Publisher’s Note: MDPI stays neutral with regard to jurisdictional claims in published maps and institutional affiliations.

