Article

Application of Freeze Concentration Technologies to Valorize Nutrient-Rich Effluents Generated from the Anaerobic Digestion of Agro-Industrial Wastes

1
BETA Tech Center, TECNIO Network, University of Vic—Central University of Catalonia, C/de Roda 70, 08500 Vic, Spain
2
Energy Safety Research Institute (ESRI), College of Engineering, Bay Campus, Swansea University, Swansea SA2 8EN, UK
*
Author to whom correspondence should be addressed.
Sustainability 2021, 13(24), 13769; https://doi.org/10.3390/su132413769
Submission received: 28 September 2021 / Revised: 8 December 2021 / Accepted: 9 December 2021 / Published: 13 December 2021

Abstract

:
The production of biogas through anaerobic digestion implies the generation of 90–95% of digested raw material, namely digestate. A nutrient-rich stream is generally applied to cropland to enhance yields, due to its high abundance of nutrients. Nevertheless, the intensive digestate farming brings about nutrient saturation and groundwater contamination. The application of downstream emerging technologies that focus on the recovery of nutrients from digestate have been studied, yet freeze concentration technology (FC) has never been considered for this purpose. This study evaluates the performance of FC technology applied to concentrate nitrogen (N), phosphorus (P) and potassium (K) from an effluent of a reverse osmosis unit that is treating the digestate of agro-industrial waste effluents. For this aim, two lab-scale methodological approaches were investigated, namely, progressive FC (PFC) and suspension FC (SFC), set through the utilization of different FC configurations. The concentrates obtained in both FC methods agreed with the regulations for fertilizers in terms of nutrients and metals content; meanwhile, the diluted fraction can be delivered as water for irrigation in high-density livestock areas. The application of FC solves the transportation cost side effect of livestock waste on the one hand, and soil contamination with nutrient on the other hand.

Graphical Abstract

1. Introduction

The current world population is about 7.8 billion people and has an annual growth of 81 million people [1]. According to widely cited estimates, there is a concern regarding the supply of sufficient food for this skyrocketing population growth, in which food production should be doubled by 2050 in order to feed a population of 9.3 billion [2]. In order to meet the demand of such an increasing population rate, there has been an improvement on agriculture-food systems efficiencies and the development of intensive animal production, consequently generating large quantities of livestock manure [3], among other agro-industrial wastes. In this regard, disposal of animal manure into the environment, by using it as a valuable source of organic fertilizer, is widely practiced in farmlands, especially in Europe, due to the high number of total breeding livestock units [4]. Livestock manure is identified as one of the largest sources of bio-waste, rich in nutrients, especially phosphorus (P) and nitrogen (N). Research has demonstrated that raw manure and digested manure-based fertilization are alternatives to chemical fertilization, which can not only achieve high crop yields and improve soil quality, but also promote sustainability and efficiency of agricultural ecosystems in the long term [5].
It is estimated that livestock animals produce over 1400 million tons of solid and liquid manure per annum [6], out of which pig manure represents the second largest portion produced in the E.U., with an average composition of 130–245 kg organic matter, 11 kg N, and 5.4 kg P per ton [7]. In terms of nutrients, about 9 and 1.8 million tons of N and P are excreted through livestock manure per year, respectively [5], and pig manure contributes to 30% of the total N excreted into the soil [8]. However, in the long term, excessive application of manure on soil results in losing large amounts of nutrients through gas emissions or trickling through the soil, and consequently contributes to greenhouse emissions generation in addition to soil and groundwater pollution (estimated to be over 6 million tons of N annually) [9]. To reduce adverse effects of nutrient losses in high-density livestock areas, a considerable amount of manure can be moved off by transporting it to nutrient-deficit croplands. However, the farther the destination from the production region, the more expensive and less energy effective the transportation. Therefore, it is important to continue developing suitable and innovative cost-effective technologies and management strategies to optimize the concentration of livestock manures and their valorization before their transportation to nutrient-deficit croplands and utilization for agricultural purposes.
In this regard, different technologies have already been tested (e.g., gasification, thermochemical conversion, anaerobic digestion, compaction, filtration, composting, hydrothermal carbonization, or liquefaction) and scaled-up over time to optimize the volume reduction, energy recovery, nutrient concentration, and final transportation or exportation of raw livestock waste or its digested version [10]. However, the current conventional technologies face many challenges related to energy demand and high equipment costs [11]. Compaction is considered as an economically unfeasible technology due to the high equipment cost and energy demand required for its performance [11]. Membrane technology, as another common concentrating technology, uses less energy compared to other methods but it is prone to fouling and clogging [12], therefore a high cost is associated to membranes’ maintenance and replacement [11]. Instead, evaporation is a widely used method for volume reduction that evaporates water from aqueous solutions to obtain concentrates. Evaporation was implemented for N concentration from liquid pig slurry [13]; however, several studies have reported the high energy consumption and non-entirely effectiveness of this method. Moreover, the high temperature required in the evaporation method could destroy important components and the possibility of evaporating hazardous organic compounds [14].
Meanwhile, freeze concentration (FC) technology has received increasing attention as a concentrating technique due to the quality of the products obtained during the process [15]. In general, indirect FC is mostly classified into three basic categories, namely, the progressive freeze concentration (PFC) where only a large single ice crystal is being formed, suspension freeze concentration (SFC) where small ice crystals grow large in suspension, and block freeze concentration (BFC), known as freezing-thawing of the ice crystal, differentiating in the ice crystal growth process [16]. FC process allows for removing solutes from water by freezing it until achieving a high purity of crystallized water and then separating the concentrated fluid from the ice formed. Less energy required, high separation factor, and easy availability of the equipment required for this technology are the main advantages of the FC process compared to other conventional techniques. FC applications in food and desalination industrial sectors, mainly progressive freeze concentration (PFC) and suspension freeze concentration (SFC) systems, have been widely expanded. As an example, FC process has gained popularity at an industrial scale for the purpose of fruit juice concentration [17], sweetening solutions [18], dairy processing to improve milk quality [19], as a pre-step for ice-cream production [20] and wastewater treatment [21]. Chen et al. (2019) [22] also reported a high separation efficiency of the FC process to treat seawater with 58% less energy consumption as a non-scaling and chemical-free process. Regarding valuable compounds preservation, FC technology has also been illustrated to be a highly effective process to concentrate juices [23], wine, beer, milk [19], coffee, and tea; with all flavor and aromatic components retained [16]. Recently, FC was adapted for the concentration of aqueous ionic solutions [24] and stormwater purification [25]. However, there is still scarce information available for the recovery of nutrients from animal manures, slurries or digestates through this type of technology. In a recent work conducted by Cantero et al. (2019) [26], FC system is mentioned as an option for the physical pre-treatment of manure, to convert the raw material into a more efficient form in terms of storage, transport, and capability of being employed in further treatment. Moisture contained in solid residues derived from livestock waste was reduced by 50%. It is well documented that in order to have an FC system that has a high efficiency rate, the flowrate of the inlet solution, the design of the device where the crystallization happens, and the growth speed rate of ice formation are key factors to be considered [27].
To the best of our knowledge, no prior studies have examined the application of FC technology to recover nutrients from livestock manure or its digestate, which makes it an interesting research area to be explored. Thereby, the aim of the present study is to assess the efficiency of FC technology on the recovery of nitrogen, phosphorus and potassium from an agro-industrial waste, specifically a concentrated digestate of pig slurry (main component of the digester influent) to deliver a nutrient-rich solution that could be used as a biofertilizer for agricultural purposes as well as a diluted fraction that can be applied to nitrate vulnerable zones. In addition, the assessment of FC system in terms of energy consumption as an important part of sustainable development is also investigated. The preliminary results obtained in this study pave the way for a wide research area concerning the employment of FC technology on other livestock effluents for nutrient recovery and as an environmentally friendly and cost-effective alternative to the existing concentration techniques.

2. Materials and Methods

The FC performance was investigated under two methodological approaches, a progressive freeze concentration (PFC) and a suspension freeze concentration (SFC), set through the utilization of different lab-scale FC configurations described in detail in the following sections. A multi-stage PFC and SFC was performed as illustrated in Figure 1.

2.1. Raw Material

Samples were obtained from an anaerobic digestion (AD) plant located in Catalonia (Spain), treating pig slurry and waste organic effluents from food processing industries. After the AD process, the digestate goes to a post-treatment step consisting in a solid–liquid separation (centrifugation), the liquid fraction is subjected to an extra step consisting in membrane technologies (ultrafiltration and reverse osmosis) to obtain a clean effluent that can be directly discharged to water bodies and a concentrated fraction that is currently treated as waste. The concentrated fraction is the one used in the FC studies to evaluate the feasibility to upcycle this effluent into a nutrient-rich concentrate.
The concentrate was sampled and stored at 5 °C until processing. The characterization of the sample is presented in Table 1.

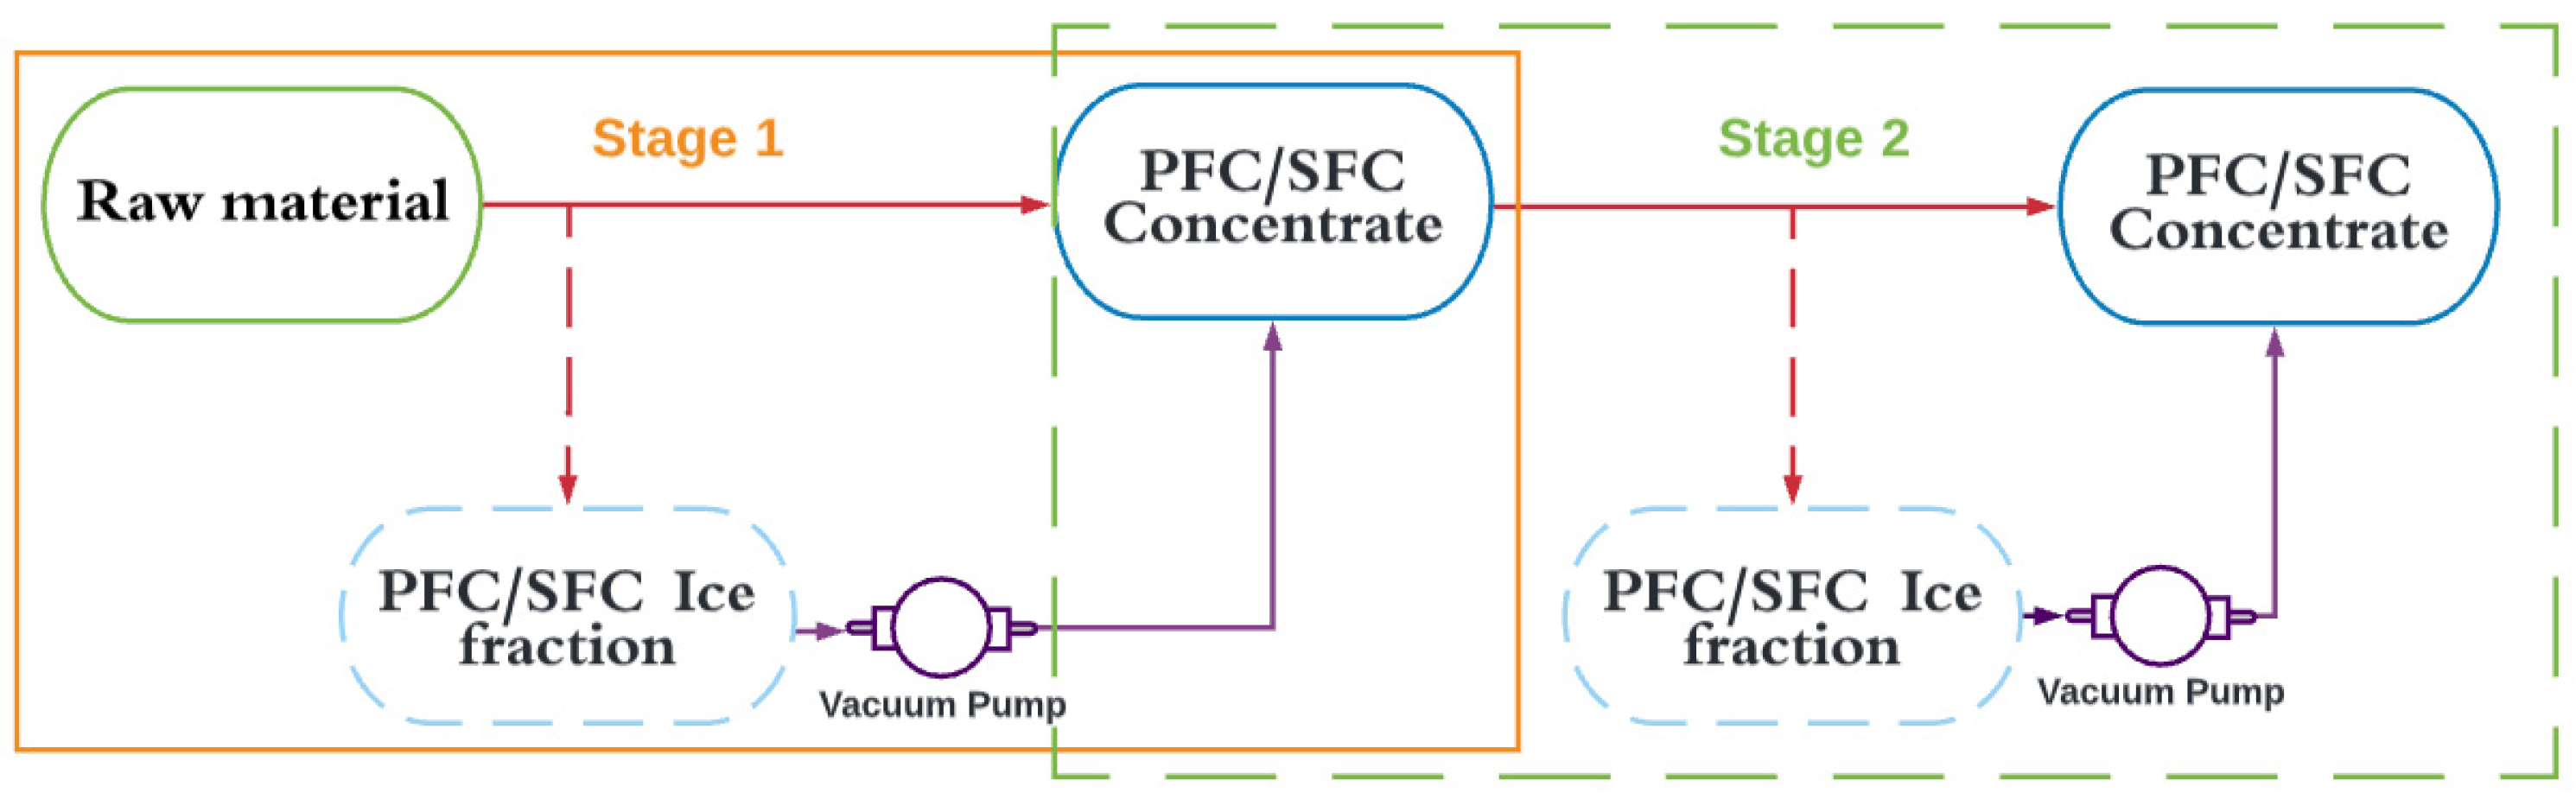
2.2. Freeze Concentration Configuration and Operation

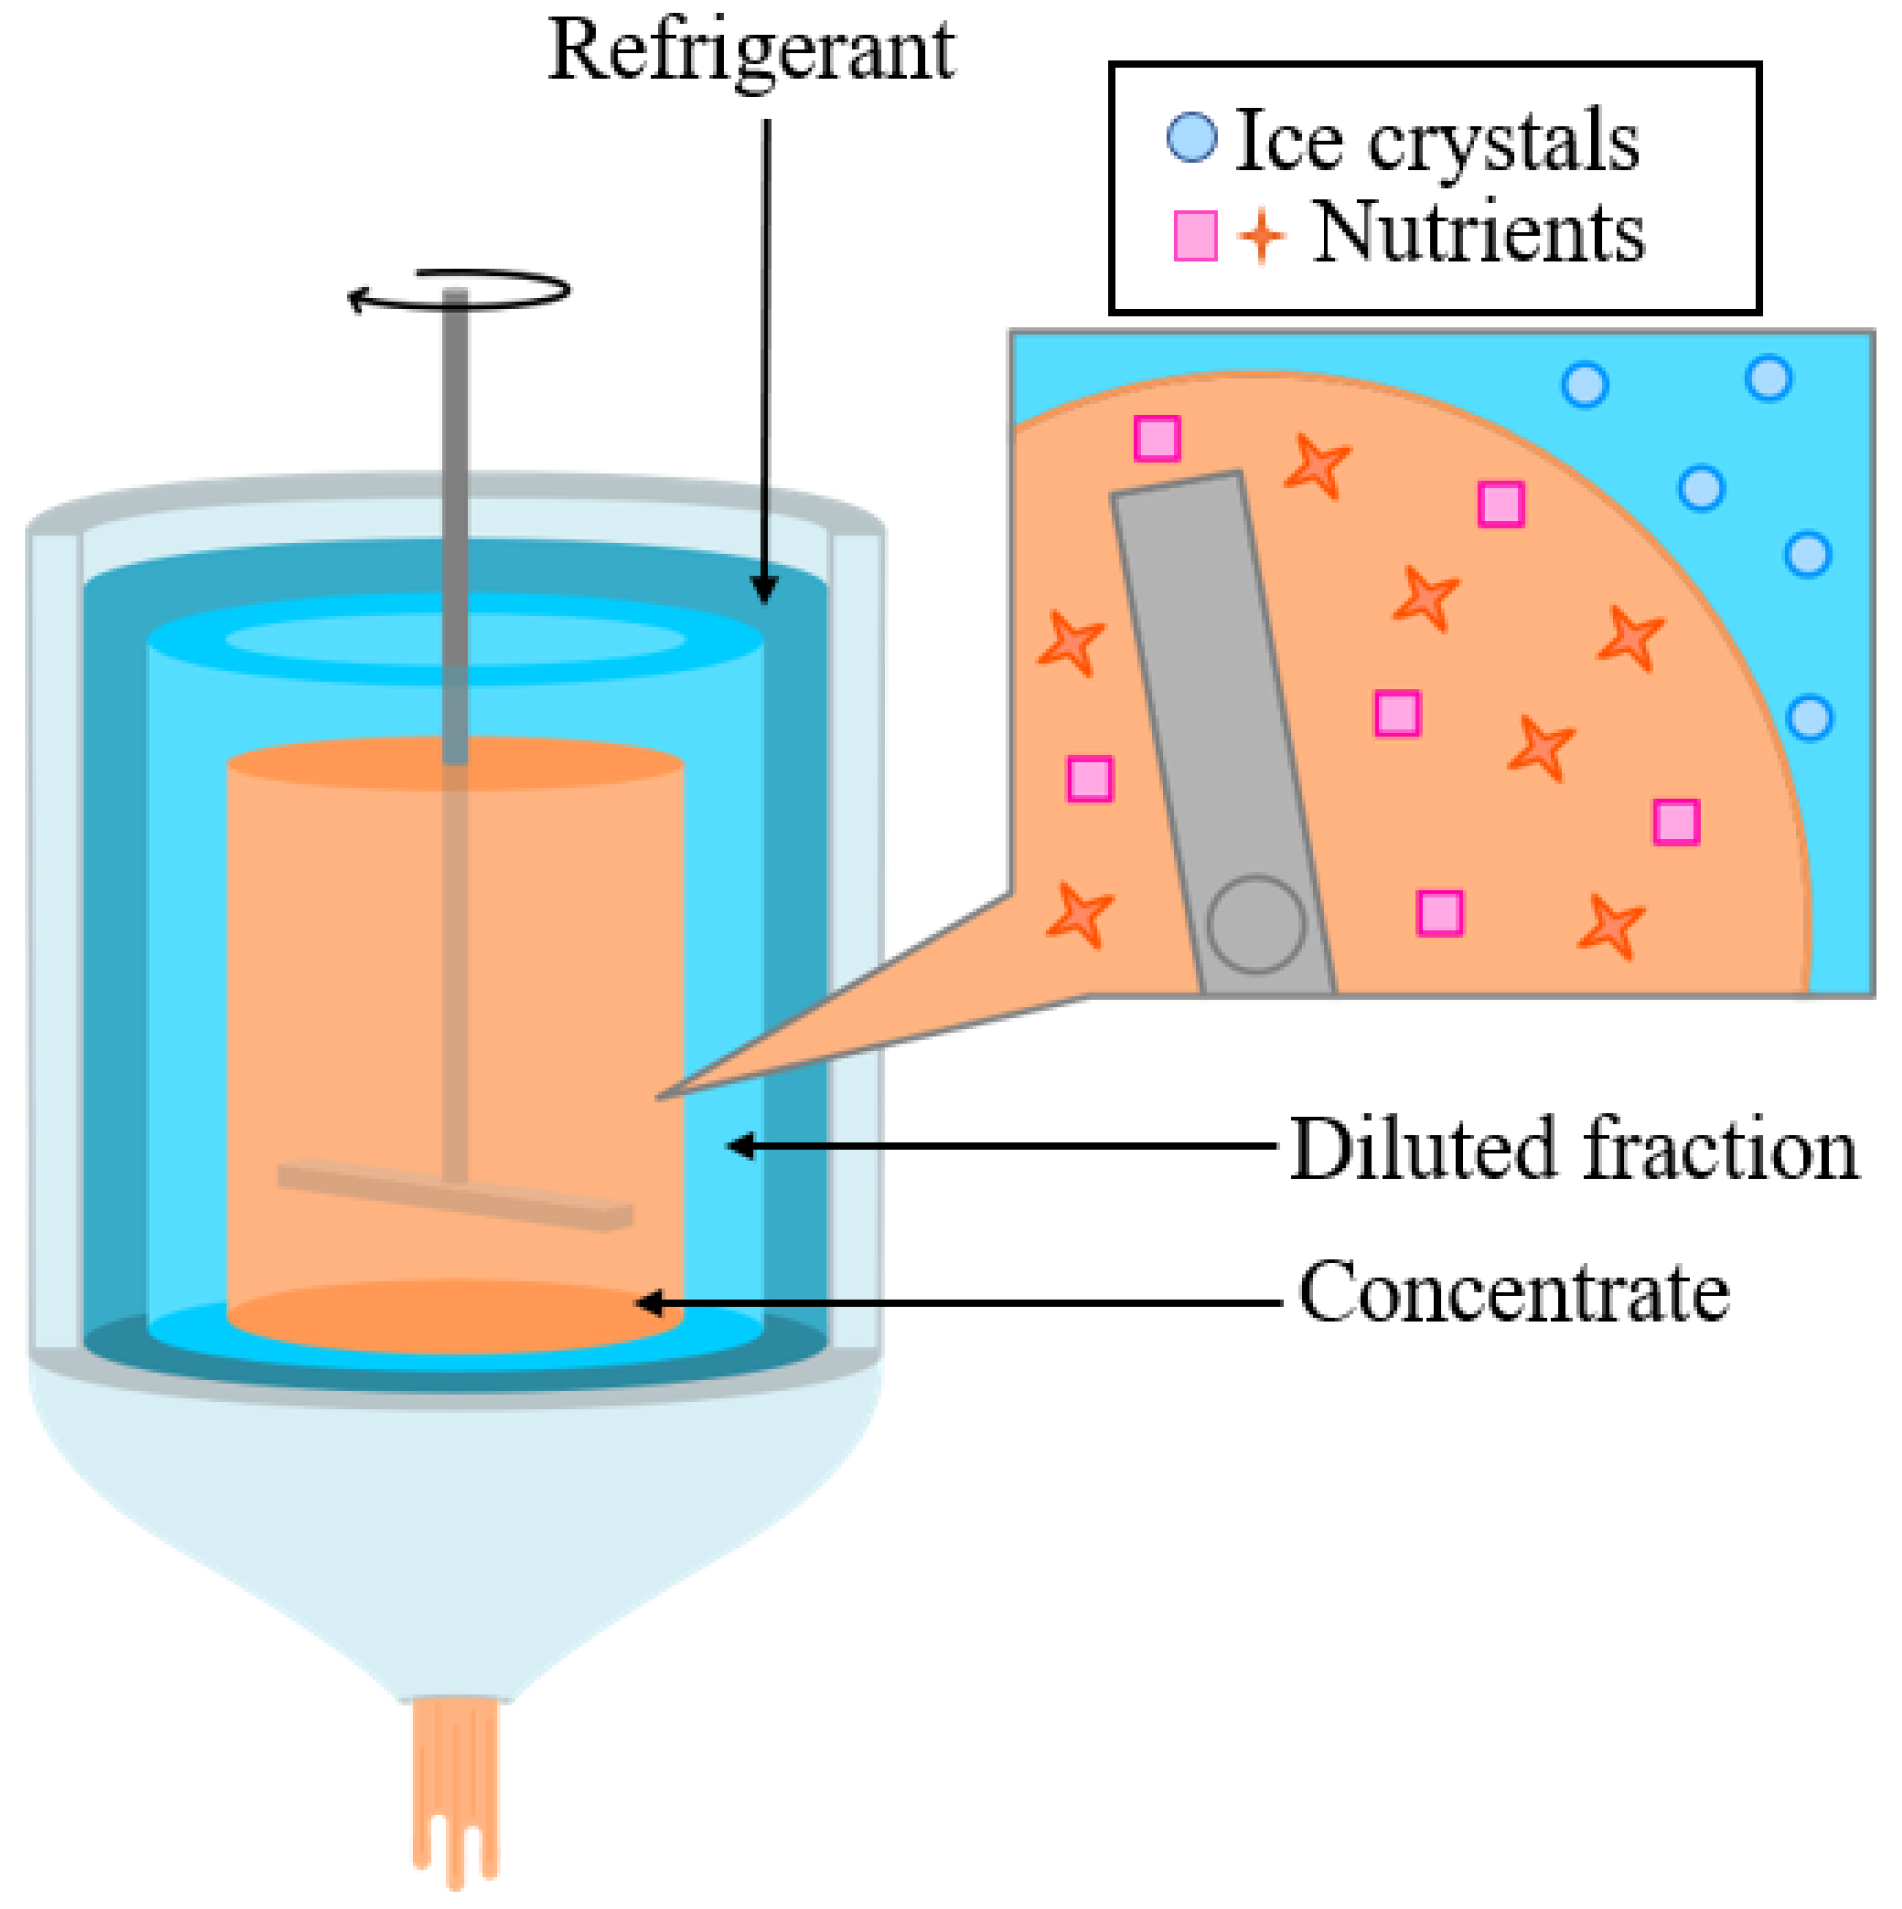
2.2.1. Progressive Freezing and Vacuum Application Procedure

The system consists of a tank that has a capacity of 2 L (internal diameter of 110 mm and 257.5 mm of height), the refrigerant circulating on a thermally isolated lateral jacket (15 mm thickness) of the tank, allowing heat transfer only towards the interior of the tank. An overhead stirring system (AM20-D ARGO Lab, IT) provided a mechanical agitation to optimize the distribution of the raw material nutrient against the surface exchange of the reactor. The cooling system consisted of a chiller (POLYSCIENCE AD20R, USA) that had propylene glycol liquid refrigerant (cooling temperature up to −20 °C) circulating through the tank jacket. Figure S1 from Supplementary Materials illustrate the laboratory set up of PFC used for this experiment.
The PFC process was carried out as follows: the tank was filled with a volume of 1.8 L of sample, once the refrigerant achieved the setpoint temperature selected to perform the test (from −5 °C to −15 °C). The agitation of the sample was activated, and the temperature began to decrease until reaching the cooling temperature of the sample. A temperature probe connected to the chiller was incorporated at the center of the tank to continuously record and display the temperature of the concentrated solution, the refrigerant temperature, and the ambient temperature.
A single large ice crystal formed through the accumulation of progressive ice layers on the cooling surface of the tank, producing the diluted fraction of the treated solution as shown in Figure 2.
Fixing the volume reduction to 50%, a preliminary screening of PFC conditions was performed, combining three temperatures of refrigerant (−5, −10 and −15 °C) with an agitation rate of 150 rpm in order to define the optimum conditions in terms of nutrient recovery to operate the process. The screening results for nitrogen concentration is given in Table S1 of the Supplementary Materials. Once the optimal conditions were set (−10 °C, 150 rpm), a sequence of two PFC cycles was performed and assessed under the same terms mentioned above. In the first stage (PFC-S1), the concentrated digestate was used as raw material; afterwards, the concentrated effluent obtained from S1 was used as the input material for the second stage of PFC (PFC-S2). The application of sequenced stages theoretically allows for obtaining higher efficiency of nutrients recovered and clean ice fractions. To extract the remaining concentrated solids trapped in the ice matrix, a suction step was performed right after the PFC process. The suction was performed by connecting a vacuum pump (WELCH model 2545c-02 B, USA) to the outlet of the reactor. The length of the experiment was set to 2 h for 50% of volume reduction. The suction period lasted 30 min using a vacuum pressure of 50 kPa. Once the FC process is terminated, the ice fraction was referred as the diluted fraction and the concentrated fraction as the concentrate.

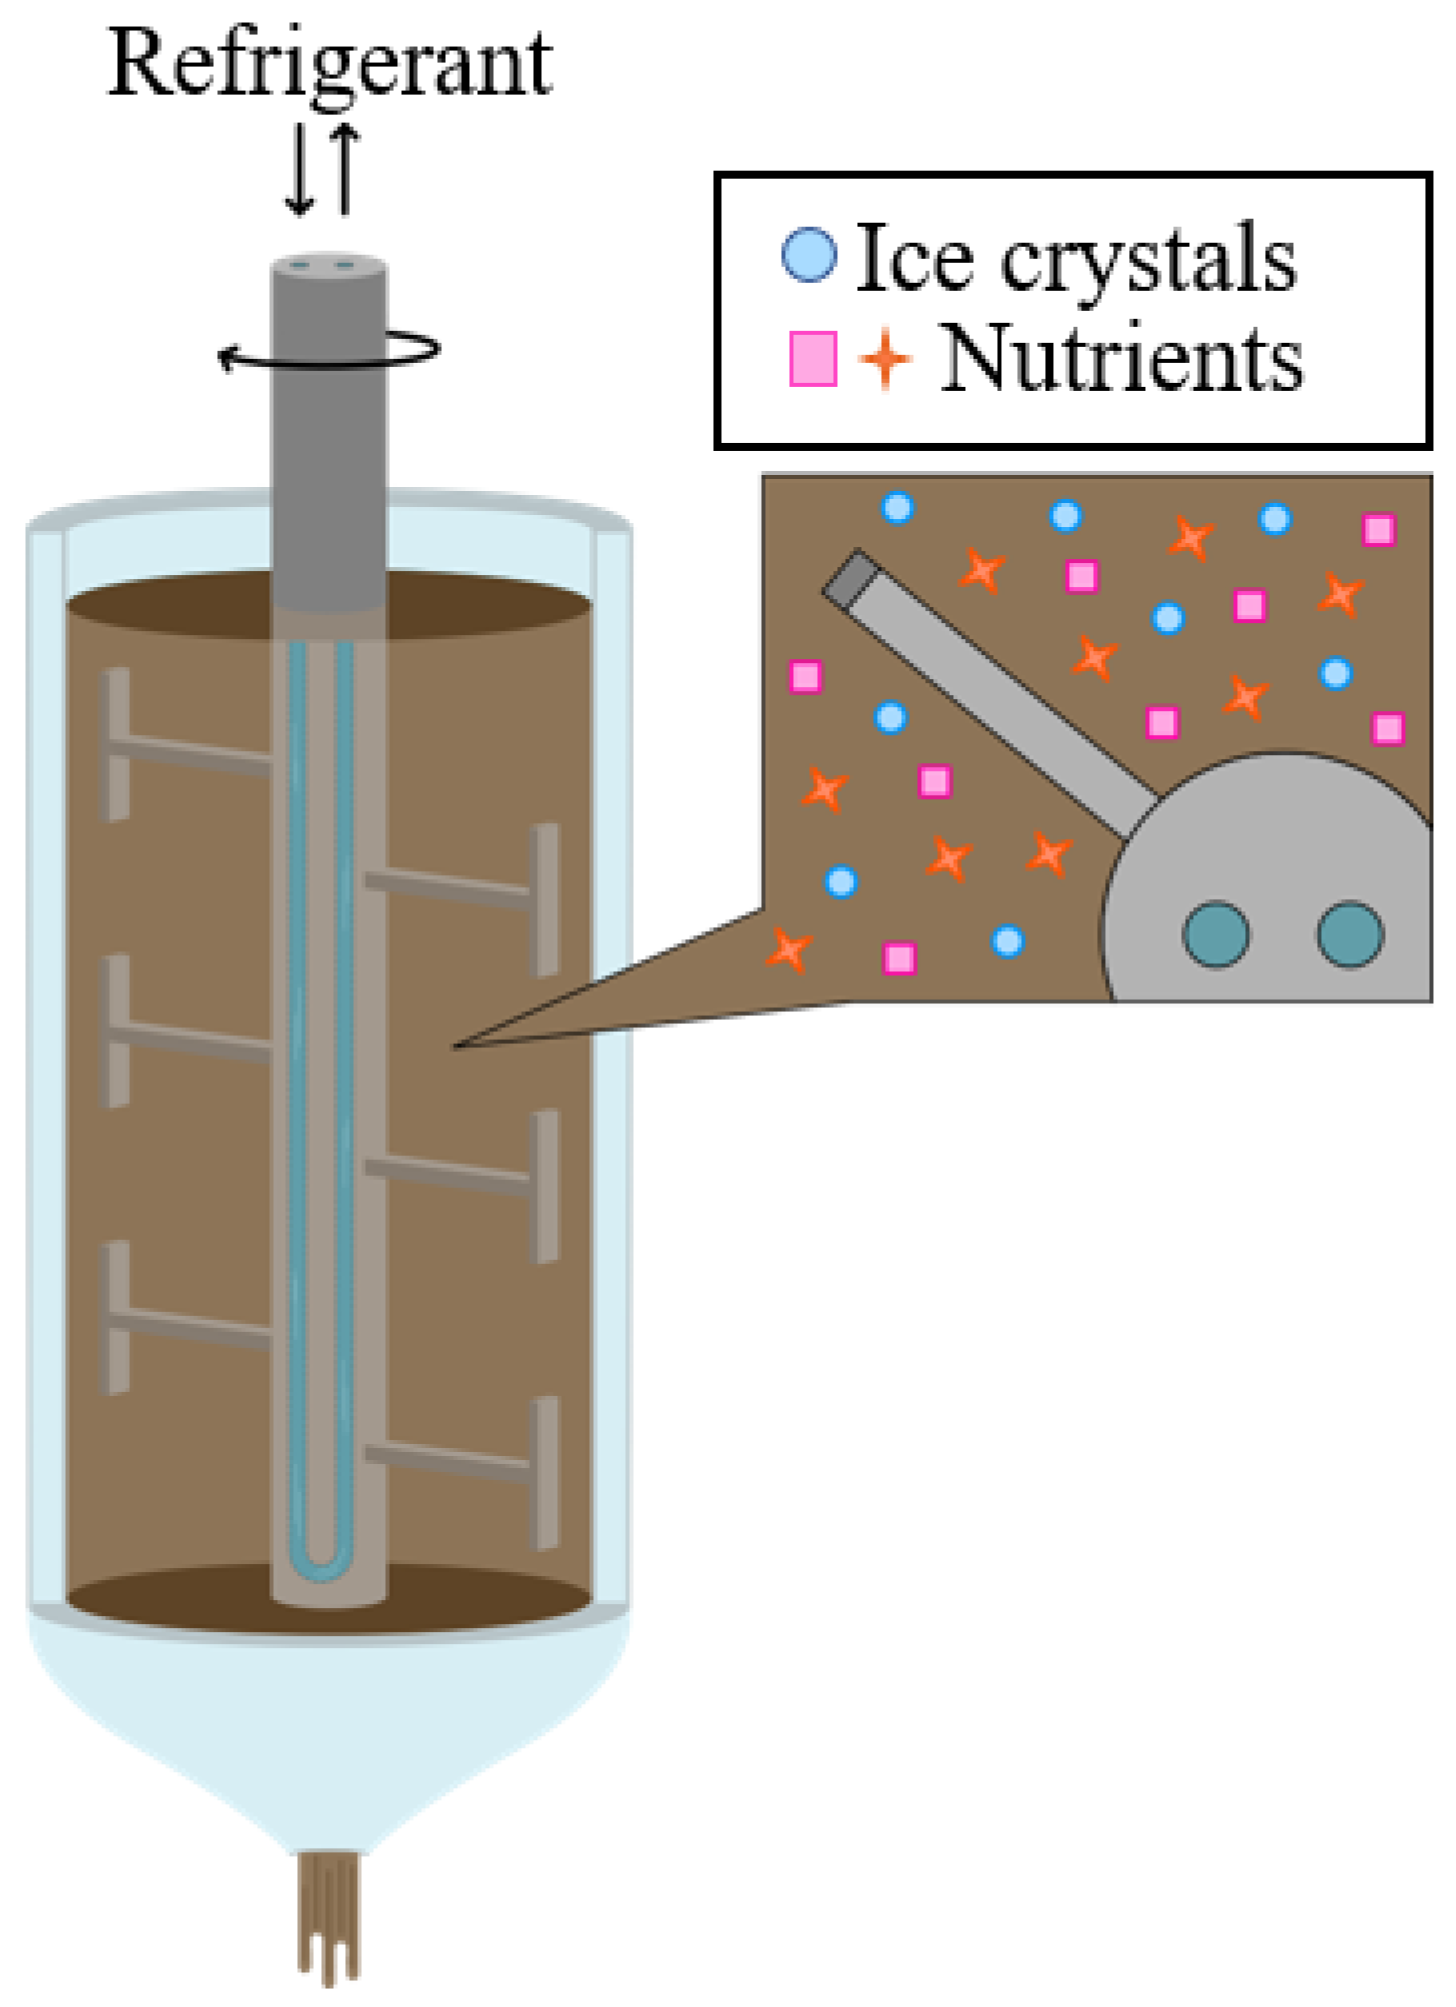
2.2.2. Suspended Freeze Concentration for Ice Granulation

The SFC or granulation test was assessed in a 3-chamber lab-scale experimental setup (FROSTY DREAM 3, AU). Each chamber independently worked and was provided with a double mixing system to form the ice granulation, thus obtaining an optimum product consistency. Both the cooling temperature and the agitation and mixing rate were set by default in the granulation device. The cooling temperature was limited to −2 °C and the agitation rate was fixed to 45 rpm. The sample was poured into the FC chamber at room temperature, which lead to the formation of bigger nucleation of ice (Figure 3) and the improvement of the vacuum performance due to the granulated structure of the frozen bulk. A sample volume of 5 L was required for each granulation test or cycle, which lasted 2.5 h to ensure a homogeneous granulation of the ice. Once the process was completed, the granulated sample was discharged towards an enclosure to apply vacuum pressure and extract the concentrated solution, similarly to the previous method (PFC). The pressure used for the vacuum suction was between 50 and 90 kPa for a period of 30 min. Analogously to the PFC, two stages were also performed for SFC, namely SFC-S1 and SFC-S2 for the first stage of SFC and the second stage of SFC, respectively.

2.3. Process Monitoring

2.3.1. Nutrient Recovery

Considering the concentrate, the nitrogen, phosphorus, and potassium recoveries were calculated as follows.
R i ( % ) = V f · C f ( i ) V in · C in ( i )
where i = (N; P; K) representing nitrogen, phosphorus or potassium, Vf (L) is the final volume of the concentrate, Vin (L) is the initial volume of the raw material, Cf(i) (g/L) is the concentration of nitrogen, phosphorus or potassium in the concentrate, Cin(i) (g/L) is the initial concentration of nitrogen, phosphorus or potassium in the raw material.

2.3.2. Mass Balance

In order to validate the obtained experimental results, a mass balance was made in each test, and for each of the nutrients (N, P and K). The mass balance (MB) was calculated as follows.
MB ( i ) =       C in ( i ) V in [ ( C f ( i ) V f ) + ( C d ( i ) V d ) ] C in ( i ) V in   ( % )
where i = (N; P; K) representing nitrogen, phosphorus or potassium, Vf (L) is the final volume of the concentrated solution, Vin (L) is the initial volume of the raw material, Cf(i) (g/L) is the concentration of nitrogen, phosphorus or potassium in the concentrated solution, Cin(i) (g/L) is the initial concentration of nitrogen, phosphorus or potassium in the raw material, Vd (L) is the volume of melted ice (diluted fraction or solution), Cd(i) (g/L) is the concentration of N, P or K in the diluted fraction.

2.3.3. Process Efficiency (PE)

The process efficiency (PE) of each concentration stage reflects the increase in concentration of nutrients (N, P, K) in the raw material in relation to the concentration remaining in the ice. The efficiencies are calculated by Equation (3):
PE ( % ) = C f ( i ) C d ( i ) C f ( i )
where i = (N; P; K) representing nitrogen, phosphorus, or potassium, Cf(i) (g/L) is the concentration of nitrogen, phosphorus or potassium in the liquid phase, Cd(i) (g/L) is the concentration of nitrogen, phosphorus, or potassium in the ice phase.

2.3.4. Yield

The concentrating yield (Y) was defined as the ratio of the mass of solute present in the separated liquid to the mass of solute present in the original solution.
Y   ( % ) = C f ( i ) V f C f ( i ) V f + C d ( i ) V d
where Vf (L) is the final volume of the concentrated solution, Cf(i) (g/L) is the concentration of nitrogen, phosphorus, or potassium in the concentrated solution, Vd (L) is the volume of melted ice (diluted fraction or solution) and Cd(i) (g/L) is the concentration of nitrogen, phosphorus, or potassium in the diluted fraction.

2.3.5. Concentration Increase

The increase (I) of a given concentration was defined as the growth of the concentration in relation to the original one.
I ( % ) = C f C i C i
where Cf (g/L) is the concentration of nitrogen, phosphorus, potassium or total solids in the final product and Ci (g/L) is the concentration of nitrogen, phosphorus, potassium or total solids in the raw material.

2.4. Physical-Chemical Analysis

2.4.1. Nitrogen, Phosphorous, Potassium Content

N content in the samples was determined according to the Kjeldhal method [28]. A total of 20 mL of sulfuric acid (96%) was added to the samples (15 mL) and digested for 3 h at 350 °C. The digested samples were then distilled, and the ammonia volatilized was retained in a boric acid solution (3%). The absorbed nitrogen in the boric acid solution is determined by titration using 0.1 N hydrochloric acid. The extracts for P and K content were prepared by digesting the samples at 100 °C with the addition of 15 mL nitric acid (65%) and 5 mL sulfuric acid (96%), then they go through a filtration and are diluted to be adjusted to the measuring range of the used equipment for the analysis [29]. The P and K content in the extracts were determined using a spectrophotometer (HACH DR 3900, Loveland, CO, USA). The K content was measured using a commercial kit (Hach LCK 228) that had a range of 5–50 mg/L, meanwhile the P content was measured using the Watanabe–Olsen method [30]. The wavelength for the reading was 695 nm for K and 882 nm for P. The dilution factor for the K was 1:50, meanwhile the extracts for P were not diluted.

2.4.2. Heavy Metals Content

The extracts for metals, namely the zinc (Zn), copper (Cu), lead (Pb), mercury (Hg), nickel (Ni) and chrome (Cr) were prepared according to the Standard Methods [29]. A 15 mL sample was digested for two hours with 5 mL of sulfuric acid (96%) and 15 mL of nitric acid (65%) for the preparation of 100 mL of extracts. The metals analysis was carried out through inductively coupled plasma optical emission spectroscopy (ICP-OES) by an external certified laboratory.

2.4.3. Electrical Conductivity pH and Solid Content

The pH, the electrical conductivity (EC), and the total and volatile solids were only measured for the characterization of the raw material. The pH was measured using a pH sensor (CYBERSCAN ion 510, Eutech Instruments, SG, Paisley, UK). The EC was determined using a conductivity meter (COND 510, XS Instruments, IT) and temperature compensation. The total solids (TS) are determined according to the Standard Methods [29].

2.5. Energy Consumption

The energy consumed in each FC stage was measured considering the pre-cooling of the reactors and the time set to achieve the cooling temperature and finally the experimental time of the freezing process. The suction of the solids from the ice structure while applying the vacuum was not assessed in terms of energy consumption, because the application of the vacuum was identical in terms of duration and pressure for both PFC and SFC. The energy consumption was calculated by the mean of the power measured using an energy meter (ZHURUI TEC-PR10, CH).

2.6. Statistical Analysis

Statistical analysis was carried out using a one-way ANOVA test, which had a significance level of 95% on SPSS software. Nutrient (N, P, K) concentrations of the concentrated and diluted fractions of the first stage of FC were compared for mass balance justification of the second stage of PFC and SFC.

3. Results

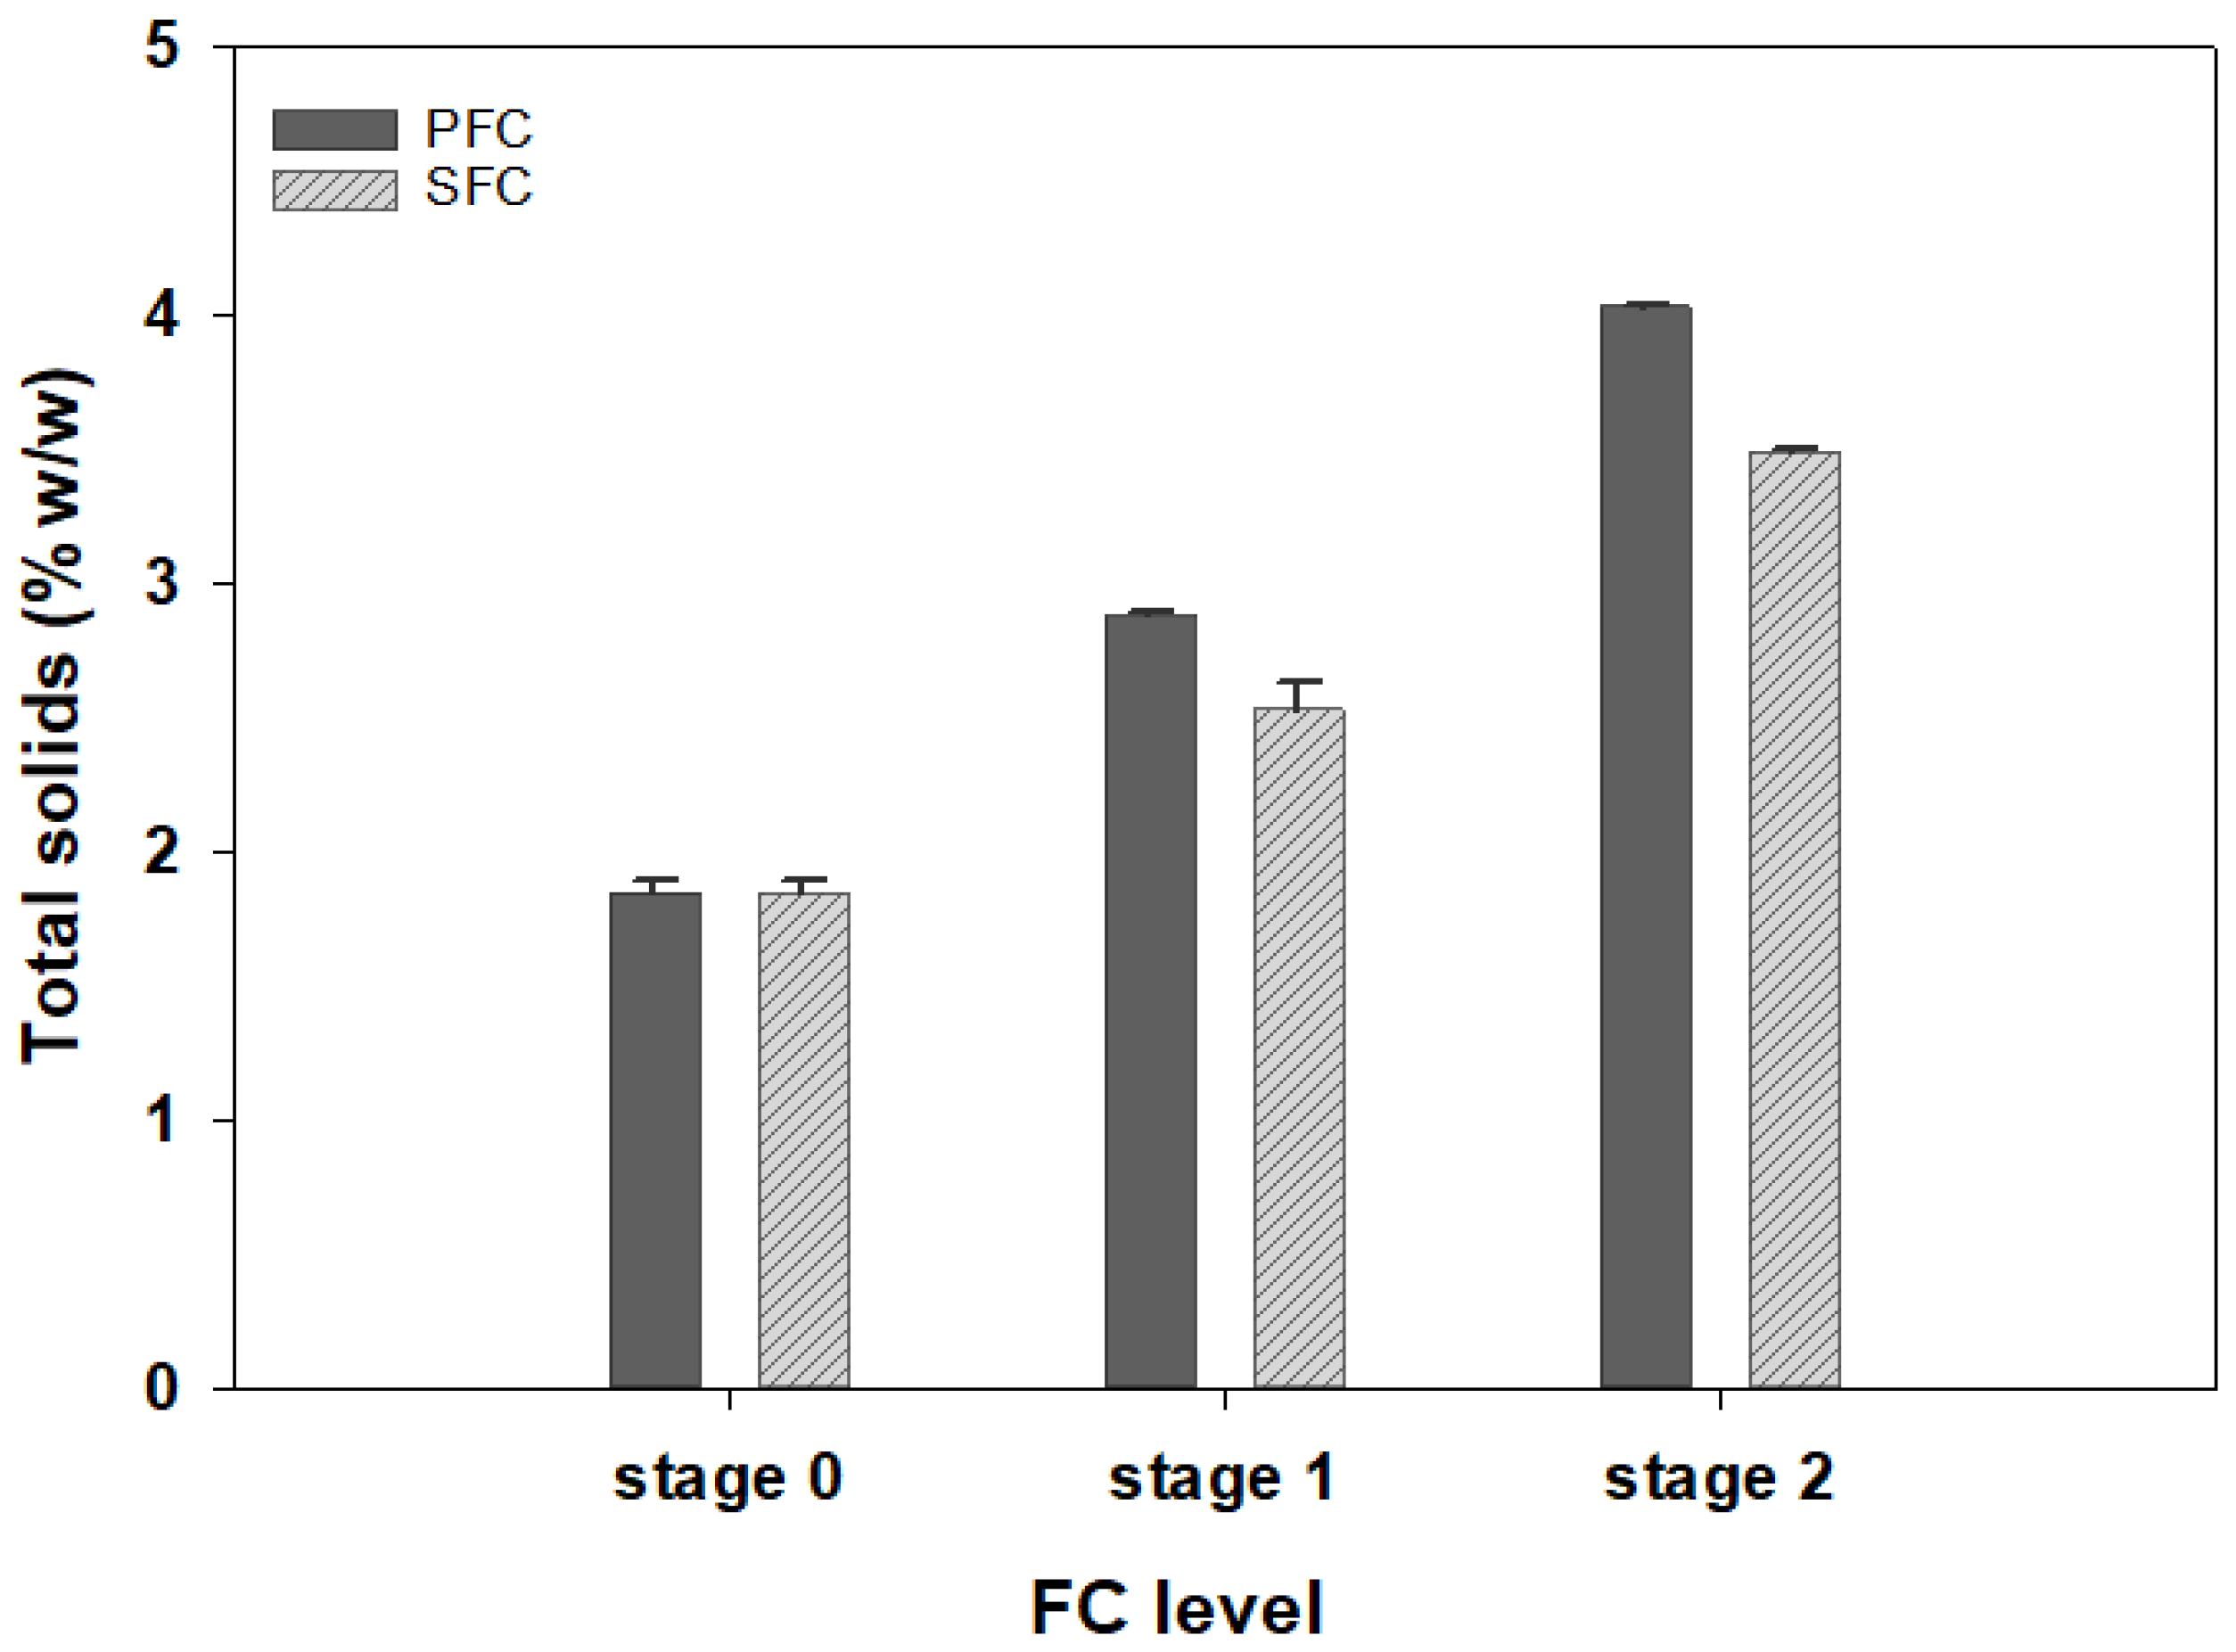
3.1. Total Solids Concentration

The distribution of the total solids in the concentrated and diluted fractions of both freezing techniques (PFC and SFC) are presented in Figure 4. Results obtained indicated a meaningful impact of the freezing process on the TS recovery. The PFC results show that 2.88 ± 0.02 wt.% (weight per cent) and 4.02 ± 0.01 wt.% of TS were obtained in the concentrate after completing S1 and S2, in comparison to the feed solution (1.84 ± 0.04 wt.%), corresponding to an increase of 56.5% in S1 and of 39.5% in S2, and a total increase of 118.5% (from feed solution to S2). Regarding SFC, a TS content of 2.53 ± 0. 1 wt.% and 3.49 ± 0.01 wt.% were obtained in the concentrate at the end of S1 and S2, corresponding to 37% increase in both stages and a total increase of 89.6%.

3.2. Nutrient Recovery

The results obtained from the application of FC in terms of nutrient (N, P, K) recoveries (Equation (1)), using SFC and PFC, is given in Table 2. The concentrations of N, P and K in the raw material, concentrate and ice fractions are given in Figure 5. In all performed FC cycles, N and P exhibited the same pattern of recovery in the concentrated fraction for both PFC and SFC. Regarding PFC, N concentration increased in the concentrate from 11.20 g L−1 (feed solution) to 14.75 g L−1 in S1 (50% of Vo) and 22.66 g/L in S2 (25% of Vo), representing a recovery of 56 and 71%, respectively, thus, the total amount of N in the concentrate counts a recovery of 40% in 25% of Vo (two stages). P concentration increased in the concentrate from 20.66 mg/L to 38.5 mg/Lin S1 and 49.93 mg/L in S2, representing a recovery of 90 and 59%, respectively; thus, the total amount of P in the concentrate shows a total recovery of 53% in 25% of Vo. Likewise, K concentration increased in the concentrate from 1974 mg/L to 2530 mg/L in S1 and 2908 mg/L in S2, respectively, representing a total recovery of 33% in 25% of Vo.
Meanwhile in SFC, the concentrations of N and P showed the same pattern (Figure 5) and similar recoveries (Table 2), counting 62 and 69% of N recovery, 88 and 53% of P recovery recorded at the end of S1and S2, respectively.
K content showed an unexpected behavior in S2 of both PFC and SFC because the concentration of K slightly increased (<100 mg/L) in PFC-S2, meanwhile in SFC-S2, K was not concentrated but rather distributed equally between the concentrated and diluted fractions.
The second stage of FC was performed using the concentrated fractions of the first stage to achieve a higher concentration of nutrients in the fraction. N showed a reverse pattern of recovery compared to P and K, because the recovery of N increased from S1 to S2, meanwhile the P and K recoveries decreased using both PFC and SFC (Table 2).
Finally, it must be highlighted that the second stage of PFC require two identical stages with a reduction of 50% to achieve 1.8 ± 0.1 L of concentrate. However, despite the use of the same freezing parameters, the concentration of nutrients was never identical. The ANOVA test performed to assess the differences on the concentrations showed no significant results (p < 0.05) but the mass balance (Equation (2)) was influenced and marked an imbalance ranging from −27 to 30% (Table 2).
From the promising results obtained, it could be concluded that low cost and highly efficient FC processes could be applied to recover significant amounts of nutrient from the concentrated digestate or other livestock effluents and can be an alternative to existing technologies for nutrient recovery.

3.3. Process Efficiency and Yield

The efficiency of each concentration stage was calculated and expressed as the increase in N, P, and K concentration in the final concentrated sample (Equation (3)). Table 3 shows the process efficiency (PE), and the yield (Y) for both FC technologies in two stages of FC. The PE of PFC in terms of N reached 74 and 91% in PFC-S1 and PFC-S2, respectively. The PE of PFC in terms of P reached 88 and 90% in PFC-S1 and PFC-S2, respectively. Likewise, the PE of PFC in terms of K reached 60 and 68% in PFC-S1 and PFC-S2, respectively. As observed, the PE increased from PFC-S1 to PFC-S2 for N, P and K, this means that an important fraction of free water remained in the concentrate of S1 to be used in S2, and that the purity of the formed ice in PFC-S2 was relatively high in relation to the concentrated fraction. Regarding the SFC, quantitatively lower PE were obtained in S1 and S2 (Table 3) and this is due to the low operating parameters used for the technique (−2 °C and 45 rpm). Additionally, the PE dropped in S2 compared to S1 in SFC, and in terms of P and K, contrary to N, they increased. Several parameters could be the reason behind the obtained behavior, as the high operating temperature (−2 °C), the low agitation rate (45 rpm) and the configuration of the SFC.
The yield during the FC process reflects the ratio of the mass of solute present in the separated liquid to the mass of solute present in the original solution (Equation (4)). A total yield of 74%, 82% and 55% of N, P and K, respectively, was reached in two stages of PFC (75% of Vo). A total yield of 75%, 64% and 62% of N, P and K, respectively, was reached in two stages of SFC. The yield obtained in PFC and SFC are relatively high (Table 3), this means that the mass of N, P and K in the concentrate and ice fraction is remarkable compared to the feed solution and that the operating conditions are steadily a major influence. The aims of the present study include examining the use of concentrated fraction as an organic nutrient-rich fertilizer for an agricultural region that has a nutrient deficiency issue, and ice fractions as irrigation water targeted for areas with high livestock density. The FC allowed an optimal distribution of nutrients into 50% of the initial volume of the feed solution, meanwhile reserving the quality of the obtained fractions in terms of nutrient content. Thus, delivering two potential customized fertilizers in terms of N, P and K content.

3.4. Energy Balance

Evaluating the economic aspects of emerging resource recovery processes is critical for their uptake and establishment in the agricultural sector. Therefore, the energy consumption of the whole process was measured in the present study as an additional parameter to assess the performance of PFC and SFC methods to recover nutrients from the raw material (concentrated digestate of pig slurry and food processing wastes). Figure 6 represents the profile of energy power used by the experimental PFC and SFC sets. Basically, the energy consumed in FC systems comes from the electrical energy required for the refrigerant recirculating pump, mixing engine, and refrigeration units. The power in the SFC case was constant during the whole process, because the operation consisted of mixing and freezing automatically without any additional modification, as illustrated in Figure 6. Meanwhile, the PFC requires a cooling period of approximately 1 h followed by a concomitant freezing and mixing during the process, which justifies the power jump in the profile of the power during the performed cycle (Figure 6). Although the power used for SFC was higher than PFC, the process length was shorter for SFC. The energy consumed was calculated by the mean of the power used and the total duration of a single cycle and marked 2230 Wh in the case of PFC and 1530 Wh in the case of SFC.

3.5. Heavy Metals Content

To be used as an organic fertilizer to the soil, the concentrated and diluted fractions obtained from the FC were quantified in terms of heavy metals content. Among the seven metals analyzed (Cr, Ni, Hg, Pb, Cd, Cu and Zn), some of them were not detected in any of the fractions, namely, the Cr (<0.01 mg/L), the Hg (<0.004 mg/L) and the Cd (<0.0005 mg/L). Lead was not detected in the raw material, however, it appeared in the diluted fractions of the SFC-S1 and PFC-S1 only, with a concentration of 0.067 mg/L and 0.207 mg/L which are equivalent to 9.311 mg/kg TS and 18.973 mg/kg TS, respectively.
The Ni concentration in the raw material was 0.520 mg/L, to be distributed after the first stage into 0.340 mg/L in the concentrate and 0.220 mg/L in diluted fraction of PFC-S1. The results obtained after PFC-S2 showed a similar distribution of the Ni in the two fractions, a concentration of 0.167 mg/L was obtained in the concentrated fraction and 0.120 mg/L in the diluted fraction of PFC-S2. The Ni content in the raw material was not concentrated as expected, however it decreased as the FC level increased, which means that the Ni content in the final concentrate (S2) was lower than in the raw material.
Regarding the Cu content, the concentration increased with the increase in the level of freezing. Starting from a concentration of 1.535 mg/L in the raw material to achieve 1.980 mg/L and 6.050 mg/L in the concentrate from S1 and S2 of PFC, respectively. Unlike the behavior of the Ni content, which was higher in the SFC, the Cu exhibited an opposite pattern, as the concentration in the concentrate of the SFC was lower than the one in PFC. The Cu content was 1.660 mg/L and 1.460 mg/L in the concentrate of SFC-S1 and SFC-S2, respectively. The final concentrations are equivalent to 150.208 mg/kg TS in the PFC-S2 and 41,806 mg/kg TS in the SFC-S2.
Likewise, the Zn showed a similar pattern of the concentration to the Cu. Starting from an initial concentration of 1.508 mg/L in the raw material, to achieve a concentration of 2.200 mg/L in PFC-S1 and 4.750 mg/L in SFC-S1 concentrated fractions. Analogously to the Cu, the concentration was less efficient in the case of the SFC, as the concentrated fractions ended up with a concentration of 1.480 mg/L and a 1.620 mg/L in the SFC-S1 and SFC-S2, respectively.

4. Discussion

4.1. Process Efficiency and Nutrient Recovery

The recovery of TS during the FC process depends highly on the freezing temperature but also on the structure of the formed ice and the separation efficiency. Jusoh et al. (2009) [31] stated that the formed ice in the cooling surface of the PFC reactor separated from the centric concentrated solution makes the separation more efficient and easier. In another study, it was reported that the major disadvantage of the SFC is the difficulty of separating the formed ice in suspension of the mother solution [11]. Thus, the application of vacuum, as an external force, is an advantage to intensify the concentrated solution by releasing impurities from the ice surface and consequently increasing the percentage of TS recovered and enhancing the separation step. Due to the novelty of the present study, there are no previous works reporting results about FC technology for the purpose of concentrating nutrients from livestock waste (e.g., raw manure, digestate or digestate concentrates). Nevertheless, the FC showed similar behavior for the recovery of TS from fruit juices, namely, orange and pineapple, with an increase of 61% and 4.5 times more than the fresh samples, respectively [32,33].

4.2. Nutrient Process Efficiency and Recovery

Quantitatively, it is noticeable that higher P than N and K could be recovered by the FC process (Table 2). An explanation of this behavior is the difference between molecular weight, structure, and size of nutrient. P has a larger molecular weight than N, which makes it easy to separate and concentrate [34]. The result of this work was similar to that reported by Jiang et al. (2015), who achieved a removal of 80% of ammonia from wastewater in 50% of formed ice [35]. A typical P recovery technique applied in livestock manure or slurry treatment processes is struvite precipitation through the addition of magnesium salts (mainly magnesium hydroxide and magnesium chloride), which allows for recovering at least 80% of inorganic P from pig slurry [36] and reduces 72% of P from swine slurries [37]. However, currently there are no additional comparable studies reporting the nutrient recovery from livestock slurry or manure using FC technology, in which the initial TS is generally high, and the matrix is complex.
The purity of formed ice during the FC process is the main parameter affecting the yield of nutrient in the concentrate, which is directly associated to the separation capacity of the two methods (PFC and SFC). Samsuri et al. (2016) reported that the difficulty of ice crystals separation in the SFC method is due to its big surface area, which makes it a complicated and expensive process compared to other concentration technologies. Thus, it is less attractive to be applied in the market [11].
Generally, the volume of ice produced by PFC process is relatively low with a high purity, but has a lower productivity compared to the SFC [11]. Moreover, the mechanical stirring (150 rpm) presented in the PFC system improves the heat transfer and the water flow and mass transfer (from concentrated fraction towards the ice fraction), thus a significant efficiency was observed in PFC system. An increase in the stirring rate in future studies should be considered in order to allow greater PE in both PFC and SFC, as this allows a better homogeneity of the solution in terms of TS inside the FC vessel. Osorio et al. (2018) also indicated this phenomenon in the FC system; their finding agrees that there is a significant correlation between higher stirring rate and increasing the mass transfer at the interface [38]. It is well documented that increasing the heat transfer will enhance the ice growth rate and create an ice layer with a higher purity, which will consequently lead to a high system efficiency [27]. In another study conducted to remove nutrients from synthetic municipal wastewater effluent, authors also reported 99.9 and 96.5% removal efficiencies of P and N in a single impurity freezing tests at −15 °C in the ice fraction [34]. Song et al. (2001) evaluated the performance of a batch freezing apparatus for separation of organic matter from livestock wastewater and demonstrated a high-quality effluent and PE of over 98% at −3 °C and 300 rpm. The difference in efficiency of the system has resulted from the selectivity of growing ice crystal based on the recovery of different resources [39]. It is important to emphasize the complex matrix of the concentrated digestate, which is challenging for the PE of the FC, yet the results obtained are promising and competitive for existing technologies.

4.3. Quality Assessment of FC Products from the Concentrated Digestate

Generally, pig slurry, digestate and concentrated digestate fractions are being used as nutrient-rich fertilizers. However, high-density livestock areas are subjected to nitrate contamination of ground water, thus, there is a limitation of Norg content that can be applied to each hectare of agricultural lands in Nitrate Vulnerable Zones, this limitation is currently 170 Kg Norg/ha annually (council of European communities 91/676/EEC) [40]. The implementation of FC can have a strong impact in how these manure nutrient-rich fractions could be managed, facilitating the use of diluted fractions near the production site (reducing the total amount of ha needed) and facilitating the nutrient exports to other agricultural areas with nutrient deficits.
An example taking into account the results obtained in the PFC trials is presented. Starting with a total amount of 22.96 g of N in the feed solution, about 12.84 g of N is being concentrated in the concentrate of PFC-S1, from which 10.19 g of N ends up in in the concentrate of PFC-S2, reflecting a two-stage recovery of 44.3% of the total initial N in only 25% of the initial volume (Vo) (Figure 7). The 75% of the remaining volume represents the sum of the ice fraction of PFC-S1 and PFC-S2 (diluted fractions). Considering the diluted fraction, 4.47 g of N was retained in the 50% of Vo and 5.38 g of N in 75% of Vo. of PFC-S1 and PFC-S2, respectively. Assuming that the N unbalance in PFC-S1 (5.65 g of N) and PFC-S2 (2.28 g of N) is being equally distributed into the concentrate and the ice fractions in the two stages, the total N distribution is as follows: 12.47 g of N in 25% Vo and 10.52 g of N in the remaining 75%.
Scaling up the obtained results for the application of FC on a volume of 1000 m3 of concentrated digestate, around 75.03 ha of agricultural lands shall be needed for the application of 1000 m3 of the raw concentrated digestate. However, if treating the same volume using FC, only 34.37 ha of lands is needed to the application of the diluted fractions of PFC-S1 and PFC-S2 (75% of Vo), which represent only 45.8% of the lands required using the raw material. Applying FC can help to solve one of the major issues in manure management, which is the lack of useful agricultural surface area in highly dense livestock populated areas. The remaining 25% of Vo could be transported to the nutrient deficit lands with a reduction of 75% of the original transportation cost.
In addition, the quality of the concentrate and ice fractions (diluted fraction) were guaranteed in terms of heavy metals content (Section 3.5). Thus, the FC technology application to concentrate nutrient from any type of livestock waste could have a double-effect consisting in the concentration of nutrient in a reduced volume, the reduction of the transportation cost from one side, and the reduction in the need of nearby agricultural lands to manage the remaining diluted fractions reducing at the same water pollution from the agricultural source, thus preventing further pollution from other hands.

4.4. Assessment of Energy Consumption

Comparing FC to membrane-based technologies (one of the most implemented to concentrate effluents and recover specific compounds), FC requires a similar or even lower operational energy consumption. Theoretically, FC also has a huge energy-saving potential compared to thermal and evaporating processes. It has been reported that FC uses 30.4% less energy than evaporation to treat wastewater and consumes less than 62% energy when combined with ice thermal storage technology and a precooling method [41]. Generally, the energy usage depends on many parameters such as the type of technology in use, the type of feed solution, the ambient temperature, the targeted recovery rate, and the cost of electricity in each region. The required investment of each technique could also vary based on the construction cost and production capacity. Pazmiño et al. (2017) [42] reported energy savings of up to 30% when utilizing a continuous system of FC, treating sucrose solutions, and integrating with the falling film technique, compared to the energy consumption of the most efficient evaporation systems. According to Attia (2010) [43], FC only requires 114 Wh of energy to produce 1 kg fresh water and to remove salt. Mtombeni et al. (2013) [44] also reported the lowest energy consumption (0.39 kWh) using freezing desalination technology to remove salts from wastewater. The result of this research shows 111.5 and 122.5 Wh of energy consumption to recover nutrients from 1 kg of a concentrated digestate of pig slurry and food waste mixture using PFC and SFC systems, respectively. However, the capital and operation costs are one of the main factors that need to be considered in separation and concentration technologies. Other separation technologies such as ammonia stripping, thermal treatment, ion exchange, and adsorption may require higher energy input and influence by pH and aeration, while FC technology is identified as an environmentally friendly separation process with easy operation and low energy consumption, and a high rejection rate [45].

4.5. Quality of FC Products in Terms of Heavy Metals Content

The heavy metals content in the obtained fractions after completing FC is assessed and quantified. The obtained concentrations of the Pb, although they are retained in the diluted fractions, are below 120 mg/kg TS, which is the concentration limit fixed by the regulation (EU) 2019/1009 for organic fertilizers [46].
Regarding Ni concentration, the concentrated and diluted fractions of the SFC showed a similar distribution of the Ni in the two fractions, however, the concentration of the concentrate in the SFC-S2 was 0.313 mg/L and was higher than the concentrate of the PFC-S2. This could be justified by the formation of the ice in both methods, as the principle of the SFC require a formation of the ice nucleation inside the mother solution [47], which facilitates the migration of the ions of the heavy metals from the formed ice to concentrate during the separation. The Ni content in the concentrates of the second stage of PFC and SFC are equivalent to 4.138 mg/Kg 8.972 mg/Kg TS in the PFC-S2 and SFC-S2, respectively. The Ni concentrations of the concentrates obtained in the two stages and for the two methods were below the maximum allowed concentration for Ni by the regulation (EU) 2019/1009 for organic fertilizers, which is fixed at 50 mg/kg of dry matter. The concentration of Ni in relation to the nitrogen content in the concentrate is valued of 0.466 mg Ni/kg N, which is much lower than the equivalent value for pig slurries in Spain, 22.94 g Ni/Kg N [48].
The final concentrations of Cu content are equivalent to 150.208 mg/kg TS in the PFC-S2 and 41.806 mg/kg TS in the SFC-S2. The concentrations of Cu obtained in two stages of FC were below the limits stated in the regulation (EU) 2019/1009 for organic fertilizers, which is fixed to 300 mg/kg of dry matter. The concentrate of PFC-S2 achieved a Cu content per kg of nitrogen of 84.507 mg Cu/kg N. The obtained value is lower than the average Cu content per nitrogen content of pig slurries in Spain, corresponding to 2650 mg Cu/kg N [48].
Finally, regarding Zn content, the given final concentrations are equivalent to 117.93 mg/kg TS and 46,389 mg/kg TS, respectively, in the PFC-S2 and SFC-S2. Thus, the concentration obtained with the raw material under study for the Zn are also below the established limit by the regulation (EU) 2019/1009 for organic fertilizers corresponding to 800 mg/kg of dry matter. Similar to the interpretations for Ni and Cu contents, the equivalence of the Zn in relation to the N content is lower than the Zn to N ratio in pig slurries, being 209.620 mg Zn/kg N and 900 mg Zn/kg N, respectively, [48].
The quality of the studied raw material as well as the products of the FC to be used as an organic fertilizer is completely guarantied with the two evaluated methods of FC. Hence, the use of either the diluted or concentrated fractions is safe for their application to the soil, as the concentrations of all the heavy metals are below the range on the regulation (EU) 2019/1009 for organic fertilizers and the limits values for concentration of heavy metals in the soil.

5. Conclusions

The implementation of the freeze concentration technology as an alternative to recover nutrients, such as nitrogen, phosphorous and potassium, from a digestate from agro-industrial waste has shown promising results. The volume reduction resulting from this low temperature concentration process improves the management of the transportation side-effect generated by the massive volumes of generated waste. The concentration of nutrients was achieved using two different freeze concentration technologies, and in both cases the concentrated fraction obtained can be delivered as a nutrient-rich fertilizer that agrees with the regulations in terms of nutrients and metals content. The diluted fraction of the FC process can be ideally introduced to irrigate soils in nutrient-rich regions or vulnerable areas due to the excess of nitrates in the soil or underground water. The investigation of freeze concentration technology will allow a wide application of the technique in livestock effluents for agriculture purposes.

Supplementary Materials

The following are available online at www.mdpi.com/article/10.3390/su132413769/s1, Figure S1: Experimental setup for the progressive freeze concentration at lab-scale, Table S1: Nitrogen concentration in the screening experiments operating at three cooling temperatures and 150 rpm.

Author Contributions

Conceptualization, I.U.-l.; investigation, I.U.-l.; supervision, M.M., E.V. and J.C.; visualization, I.U.-l.; original draft, I.U.-l. and A.D.; review and editing, M.M., E.V. and J.C.; project administration, M.M., J.C., L.L. and S.P. All authors have read and agreed to the published version of the manuscript.

Funding

The research leading to these results has received funding from the European Union’s Horizon 2020 research and innovation program under the Marie Skłodowska-Curie grant agreement No. 712949 (TECNIOspring PLUS) and from the Agency for Business Competitiveness of the Government of Catalonia. Joan Colón has received funding from the 2018 call for Ramón y Cajal Grants from the Ministry of Science, Innovation and Universities (reference RYC2018-026231-I) co-financed by the State Research Agency and the European Social Fund.

Institutional Review Board Statement

Not applicable.

Informed Consent Statement

Not applicable.

Conflicts of Interest

The authors declare no conflict of interest.

References

  1. Roser, M.; Ritchie, H.; Ortiz-Ospina, E. World Population Growth. Available online: https://ourworldindata.org/world-population-growth (accessed on 26 January 2021).
  2. OAT Agrio Co. Ltd. Transition of the World Population and Food Supply and Demand. Available online: https://www.oat-agrio.co.jp/en/about/population.html (accessed on 26 March 2021).
  3. Van Dijk, C.E.; Smit, L.A.M.; Hooiveld, M.; Zock, J.-P.; Wouters, I.M.; Heederik, D.J.J.; Yzermans, C.J. Associations between proximity to livestock farms, primary health care visits and self-reported symptoms. BMC Fam. Pract. 2016, 17, 22. [Google Scholar] [CrossRef] [Green Version]
  4. FAO. World Food and Agriculture in Statistical Yearbooks; FAO: Rome, Italy, 2019; pp. 1–254. Available online: http://www.fao.org/3/ca6463en/ca6463en.pdf (accessed on 26 March 2021).
  5. Geng, Y.; Cao, G.; Wang, L.; Wang, S. Effects of equal chemical fertilizer substitutions with organic manure on yield, dry matter, and nitrogen uptake of spring maize and soil nitrogen distribution. PLoS ONE 2019, 14, e0219512. [Google Scholar] [CrossRef] [Green Version]
  6. Foged, H.; Flotats Ripoll, X.; Bonmatí Blasi, A.; Palatsi Civit, J.; Magrí Aloy, A.; Schelde, K.M. Inventory of Manure Processing Activities in Europe; Technical Report No. I Concerning “Manure Processing Activities in Europe” to the European Commission; Directorate-General Environment: Brussels, Belgium, 2012; p. 138. [Google Scholar]
  7. De Vries, J.; Groenestein, C.; Schröder, J.; Hoogmoed, W.; Sukkel, W.; Koerkamp, P.G.; De Boer, I. Integrated manure management to reduce environmental impact: II. Environmental impact assessment of strategies. Agric. Syst. 2015, 138, 88–99. [Google Scholar] [CrossRef]
  8. Velthof, G.L.; Hou, Y.; Oenema, O. Nitrogen excretion factors of livestock in the European Union: A review. J. Sci. Food Agric. 2015, 95, 3004–3014. [Google Scholar] [CrossRef] [PubMed]
  9. Buckwell, A.; Nadeu, E. Nutrient Recovery and Reuse (NRR) in European Agriculture; RISE (Rural Investment Support for Europe), 2016; p. 92. Available online: www.risefoundation.eu (accessed on 26 March 2021).
  10. Szogi, A.A.; Vanotti, M.; Ro, K. Methods for Treatment of Animal Manures to Reduce Nutrient Pollution Prior to Soil Application. Curr. Pollut. Rep. 2015, 1, 47–56. [Google Scholar] [CrossRef]
  11. Samsuri, S.; Amran, N.A.; Yahya, N.; Jusoh, M. Review on Progressive Freeze Concentration Designs. Chem. Eng. Commun. 2015, 203, 345–363. [Google Scholar] [CrossRef]
  12. Goode, K.R.; Asteriadou, K.; Robbins, P.T.; Fryer, P.J. Fouling and Cleaning Studies in the Food and Beverage Industry Classified by Cleaning Type. Compr. Rev. Food Sci. Food Saf. 2013, 12, 121–143. [Google Scholar] [CrossRef]
  13. Bonmati, A.; Flotats, X. Pig Slurry Concentration by Vacuum Evaporation: Influence of Previous Mesophilic Anaerobic Digestion Process. J. Air Waste Manag. Assoc. 2003, 53, 21–31. [Google Scholar] [CrossRef]
  14. Jusoh, M. Development of a Novel System for Progressive Freeze Concentration Process. Ph.D. Thesis, Universiti Teknologi Malaysia, Skudai, Malaysia, 2010. [Google Scholar]
  15. Sánchez, J.; Ruiz, Y.; Auleda, J.; Hernández, E.; Raventós, M. Review. Freeze Concentration in the Fruit Juices Industry. Food Sci. Technol. Int. 2009, 15, 303–315. [Google Scholar] [CrossRef]
  16. Miyawaki, O. Water and Freezing in Food. Food Sci. Technol. Res. 2018, 24, 1–21. [Google Scholar] [CrossRef]
  17. Orellana-Palma, P.; Guerra-Valle, M.; Gianelli, M.P.; Petzold, G. Evaluation of freeze crystallization on pomegranate juice quality in comparison with conventional thermal processing. Food Biosci. 2021, 41, 101106. [Google Scholar] [CrossRef]
  18. Petzold, G.; Niranjan, K.; Aguilera, J. Vacuum-assisted freeze concentration of sucrose solutions. J. Food Eng. 2013, 115, 357–361. [Google Scholar] [CrossRef]
  19. Sánchez, J.; Hernández, E.; Auleda, J.; Raventós, M. Review: Freeze Concentration Technology Applied to Dairy Products. Food Sci. Technol. Int. 2011, 17, 5–13. [Google Scholar] [CrossRef] [PubMed]
  20. Camelo-Silva, C.; Barros, E.L.D.S.; Canella, M.H.M.; Verruck, S.; Prestes, A.A.; Vargas, M.O.; Maran, B.M.; Esmerino, E.A.; Silva, R.; Balthazar, C.F.; et al. Application of skimmed milk freeze concentrated in production of ice cream: Physical, chemical, structural and rheological properties. Food Sci. Technol. 2021. [Google Scholar] [CrossRef]
  21. Belén, F.; Sánchez, J.; Hernandez, E.; Auleda, J.; Raventós, M. One option for the management of wastewater from tofu production: Freeze concentration in a falling-film system. J. Food Eng. 2012, 110, 364–373. [Google Scholar] [CrossRef]
  22. Chen, P.; Wang, L.; Chen, X.; Mendoza, M.D.L.; Liu, Y.; Cai, L.; Zhang, L. Progressive Freezing Method for Concentrating Tetrahydrofuran (THF) Remained in Grignard Reagent Wastewater. ChemistrySelect 2019, 4, 7157–7161. [Google Scholar] [CrossRef]
  23. Raventós, M.; Hernández, E.; Auleda, J. Freeze Concentration Applications in Fruit Processing. Adv. Fruit Process. Technol. 2012, 12, 263–286. [Google Scholar] [CrossRef]
  24. Osmanbegovic, N.; Yuan, L.; Lorenz, H.; Louhi-Kultanen, M. Freeze Concentration of Aqueous [DBNH][OAc] Ionic Liquid Solution. Crystals 2020, 10, 147. [Google Scholar] [CrossRef] [Green Version]
  25. Ab Hamid, F.H.; Salim, S.A.; Shayuti, M.S.M. Optimization of progressive freeze concentration on stormwater purification via response surface methodology. Asia-Pac. J. Chem. Eng. 2020, 15, 2419. [Google Scholar] [CrossRef]
  26. Cantero, D.; Jara, R.; Navarrete, A.; Pelaz, L.; Queiroz, J.; Rodríguez-Rojo, S.; Cocero, M. Pretreatment Processes of Biomass for Biorefineries: Current Status and Prospects. Annu. Rev. Chem. Biomol. Eng. 2019, 10, 289–310. [Google Scholar] [CrossRef] [Green Version]
  27. Jusoh, M.; Yunus, R.M.; Hassan, M.A. Effect of Flowrate and Coolant Temperature on the Efficiency of Progressive Freeze Concentration on Simulated Wastewater. World Acad. Sci. Eng. Technol. 2008, 47, 75–78. [Google Scholar]
  28. Rédei, G.P. Kjeldahl Method. In Encyclopedia of Genetics, Genomics, Proteomics and Informatics; Springer: Amsterdam, The Netherlands, 2016; p. 1063. [Google Scholar] [CrossRef]
  29. APHA. Standard Methods for the Examination of Water and Wastewater. 2005. Available online: https://www.worldcat.org/title/standard-methods-for-the-examination-of-water-and-wastewater/oclc/156744115 (accessed on 26 March 2021).
  30. Watanabe, F.S.; Olsen, S.R. Test of an Ascorbic Acid Method for Determining Phosphorus in Water and NaHCO3 Extracts from Soil. Soil Sci. Soc. Am. J. 1965, 29, 677–678. [Google Scholar] [CrossRef]
  31. Jusoh, M.; Yunus, R.M.; Abu Hassan, M.A. Performance Investigation on a New Design for Progressive Freeze Concentration System. J. Appl. Sci. 2009, 9, 3171–3175. [Google Scholar] [CrossRef]
  32. Orellana-Palma, P.; Petzold, G.; Andana, I.; Torres, N.; Cuevas, C. Retention of Ascorbic Acid and Solid Concentration via Centrifugal Freeze Concentration of Orange Juice. J. Food Qual. 2017, 2017, 5214909. [Google Scholar] [CrossRef] [Green Version]
  33. Petzold, G.; Orellana, P.; Moreno, J.; Cuevas, C. Process Parameters of Vacuum-assisted Freeze Concentration. Chem. Eng. Trans. 2017, 57, 1789–1794. Available online: www.aidic.it/cet (accessed on 26 March 2021).
  34. Gu, X. Nutrients Recovery from Municipal Wastewater Effluent using Electrochemical and Freeze Concentration Approaches. Ph.D. Thesis, Lakehead University, Thunder Bay, ON, Canada, 2016. [Google Scholar]
  35. Jiang, X.; Cheng, Z.; Ma, W.; Gao, Z.; Ma, X.; Wang, R. Removal of Ammonia from Wastewater by Natural Freezing Method. Proc. Int. Conf. Chem. Mater. Food Eng. Atlantis Press 2015, 174, 177. [Google Scholar] [CrossRef] [Green Version]
  36. Schoumans, O.F.; Ehlert, P.A.I.; Nelemans, J.A.; Van Tintelen, W.; Rulkens, W.H.; Oenema, O. Laboratory Experiments, N.D. Available online: www.wageningenUR.nl/en/alterra (accessed on 26 March 2021).
  37. Burns, R.T.; Moody, L.B.; Walker, F.R.; Raman, D.R. Laboratory andIn-SituReductions of Soluble Phosphorus in Swine Waste Slurries. Environ. Technol. 2001, 22, 1273–1278. [Google Scholar] [CrossRef]
  38. Osorio, M.; Moreno, F.; Raventós, M.; Hernández, E.; Ruiz, Y. Progressive stirred freeze-concentration of ethanol-water solutions. J. Food Eng. 2018, 224, 71–79. [Google Scholar] [CrossRef]
  39. Song, Y.C.; Lee, E.K.; Han, S.K. Influence of Environmental Conditions on the Separation of Organic Matter Contained in Livestock Wastewater by Freeze Concentration. Environ. Eng. Res. 2001, 6, 261. [Google Scholar]
  40. The European Parliament and the Council of the European Union. Regulation (EU) 2019/1009 of the European Parliament and of the Council of 5 June 2019 laying down rules on the making available on the market of EU fertilising products and amending Regulation (EC) No 1069/2009 and (EC) No 1107/2009 and repealing Regulat. Off. J. Eur. Union. 2019, 2019, 1–114. Available online: https://eur-lex.europa.eu/legalcontent/EN/TXT/PDF/?uri=CELEX:32019R1009&from=EN (accessed on 26 March 2021).
  41. Ling, W.; Xu, Z. Analysis on Energy Consumption of Freezing Concentration in Wastewater Treatment. En.Cnki.Com.Cn, 2012. Available online: https://en.cnki.com.cn/Article_en/CJFDTotal-HGSZ2012S2039.htm (accessed on 26 March 2021).
  42. Pazmiño, N.V.; Raventós, S.; Yáñez, H.; Gulfo, R.; Robles, C.; Moreno, F.L.; Ruiz, Y. Continuous System of Freeze Concentration of Sucrose Solutions: Process Parameters and Energy Consumption, Allied Academies. 2017. Available online: http://www.alliedacademies.org/food-technology-and-preservation (accessed on 26 March 2021).
  43. Attia, A.A. New proposed system for freeze water desalination using auto reversed R-22 vapor compression heat pump. Desalination 2010, 254, 179–184. [Google Scholar] [CrossRef]
  44. Mtombeni, T.; Maree, J.P.; Zvinowanda, C.M.; Asante, J.K.O.; Oosthuizen, F.S.; Louw, W.J. Evaluation of the performance of a new freeze desalination technology. Int. J. Environ. Sci. Technol. 2013, 10, 545–550. [Google Scholar] [CrossRef] [Green Version]
  45. Shi, L.; Simplicio, W.S.; Wu, G.; Hu, Z.; Hu, H.; Zhan, X. Nutrient Recovery from Digestate of Anaerobic Digestion of Livestock Manure: A Review. Curr. Pollut. Rep. 2018, 4, 74–83. [Google Scholar] [CrossRef]
  46. Regulation (EU) 2019/1009 of the European Parliament and of the Council of 5 June 2019. Available online: https://op.europa.eu/en/publication-detail/-/publication/e351eb07-9713-11e9-9369-01aa75ed71a1/language-en (accessed on 26 March 2021).
  47. Petzold, G.; Aguilera, J.M. Ice Morphology: Fundamentals and Technological Applications in Foods. Food Biophys. 2009, 4, 378–396. [Google Scholar] [CrossRef]
  48. Antezana, W.; De Blas, C.; García-Rebollar, P.; Rodríguez, C.; Beccaccia, A.; Ferrer, P.; Cerisuelo, A.; Moset, V.; Estellés, F.; Cambra-López, M.; et al. Composition, potential emissions and agricultural value of pig slurry from Spanish commercial farms. Nutr. Cycl. Agroecosyst. 2016, 104, 159–173. [Google Scholar] [CrossRef] [Green Version]
Figure 1. Flowchart of the experimental setup performed through PFC and SFC in two freezing stages of the digestated manure.
Sustainability 13 13769 g001
Figure 2. Ice formation during the progressive freeze concentration.
Sustainability 13 13769 g002
Figure 3. Ice formation during suspension freeze concentration process.
Sustainability 13 13769 g003
Figure 4. Total solids evolution in the concentrated fractions of PFC and SFC.
Sustainability 13 13769 g004
Figure 5. Nitrogen, phosphorus, and potassium concentrations in the raw material, concentrated and diluted fractions for the PFC (A) and SFC (B).
Sustainability 13 13769 g005
Figure 6. Power used during the progressive freeze concentration and suspended freeze concentration.
Sustainability 13 13769 g006
Figure 7. Summary of nitrogen, phosphorus and potassium distribution into the initial volume of the raw material (Vo), concentrate and ice fraction for PFC in two-stages.
Sustainability 13 13769 g007
Table 1. Characterization of the concentrated digestate used as the raw material for the FC tests.
Total Solids (g/kg)pHConductivity (mS/m)Phosphorus (g/L)Nitrogen (g/L)Potassium (g/L)
18.1 ± 0.68.04 ± 0.0048.95 ± 0.640.0207 ± 0.00112.8 ± 0.11.97 ± 0.19
Table 2. Nutrient recovery in the concentrate and mass balance in S1, S2 and the total multi-stage process of PFC and SFC.
FC LevelNutrient Recovery (%)Mass Balance (%)
NPKNPK
PFC-S156 ± 3.090 ± 7.263 ± 5.325 ± 0.7−5 ± 0.023 ± 0.02
PFC-S271 ± 3.059 ± 1.652 ± 2.217 ± 0.1730 ± 0.7129 ± 0.33
2-Stages PFC40 ± 0.0953 ± 0.1133 ± 0.114.2 ± 0.03−1.5 ± 0.20.87 ± 0.17
SFC-S162 ± 1.888 ± 13.060 ± 3.339 ± 1.7−27 ± 6.319 ± 2.8
SFC-S269 ± 3.353 ± 1.548 ± 2.18 ± 0.316 ± 1.521 ± 2
2-Stages SFC42 ± 0.546 ± 0.1929 ± 0.60.72 ± 0.2−4.32 ± 0.094 ± 0.05
Table 3. Nitrogen, phosphorus, and potassium process efficiency and yield during the PFC and SFC multi-stages.
FC MethodFC StageProcess Efficiency (%)Yield (%)
NPKNPK
PFCS174 ± 288 ± 460 ± 181 ± 390 ± 673 ± 2
S291 ± 490 ± 468 ± 392 ± 391 ± 776 ± 2
2-stages67 ± 0.0879 ± 0.1641 ± 0.0374 ± 0.0982 ± 0.4255 ± 0.04
SFCS152 ± 154 ± 165 ± 368 ± 269 ± 275 ± 3
S266 ± 243 ± 337 ± 174 ± 163 ± 361 ± 1
2-stages34 ± 0.0223 ± 0.0324 ± 0.0350 ± 0.0243 ± 0.0645 ± 0.03
Publisher’s Note: MDPI stays neutral with regard to jurisdictional claims in published maps and institutional affiliations.

