Abstract
With the widespread use of electric vehicles, their charging power demand has increased and become a significant burden on power grids. The uncoordinated deployment of electric vehicle charging stations and the uncertainty surrounding charging behaviors can cause harmful impacts on power grids. The charging power demand during the fast charging process especially is severely fluctuating, because its charging duration is short and the rated power of the fast chargers is high. This paper presents a methodology to analyze and forecast the aggregated charging power demand from multiple fast-charging stations. Then, pattern of fast-charging power demand is analyzed to identify its irregular trend with the distribution of peak time and values. The forecasting model, based on long short-term memory neural network, is proposed in this paper to address the fluctuating of fast-charging power demand. The forecasting performance of the proposed model is validated in comparison with other deep learning approaches, using real-world datasets measured from fast-charging stations in Jeju Island, South Korea. The results show that the proposed model outperforms forecasting fast-charging power demand aggregated by multiple charging stations.
1. Introduction
Advances in battery technologies and the electrification of transport, a wide range of electric vehicles (EVs), and government supports have led to an increase in EV presence in the world. Globally, over 3 million EVs were sold in 2020, and the accumulated number of EVs exceeded 11 million [1]. The extensive deployment of EVs causes higher charging power demand and requires many EV charging stations. With financial support from the government in many countries, the EV charging infrastructure has been increased in public and private areas. In 2020, the number of EV chargers for light-duty vehicles estimated by the Internal Energy Agency was about 10.1 million, of which, 8% are publicly accessible chargers. In addition, nearly 400,000 publicly accessible fast chargers were installed globally in 2020.
However, several obstacles still remain, preventing the widespread use of EVs and EV charging infrastructures. High battery prices and limited driving range are considered to be an important barrier even though the price of materials in Li-based batteries has been gradually decreased and the performance of batteries for EV has been improved [2,3]. Although the advanced fast charging technique has been developed and many charging infrastructures have been installed in the public area, the long charging time of batteries and low accessibility are still challenges facing owners of EVs [4].
Furthermore, the uncoordinated deployment of EV charging stations and the boost in charging power demand could impact the reliability of power grids. Many researchers have regarded the EV charging power demand as an additional burden on power grids [5,6,7,8,9,10]. They have focused on the adverse effect of EV charging power demand in the grids. They have reported the that uncoordinated EV charging power demand causes the degradation of voltage profiles, overloading, harmonic distortions, and power equipment aging. To mitigate the adverse impacts on the grids due to higher EV charging power demand, various forecasting models have been developed for planning, operating, and maintaining power equipment and systems.
Load forecasting models, including EV charging power demand, are typically categorized as statistical and machine learning models [11]. Statistical time series forecasting models, such as autoregressive (AR), moving average (MA), autoregressive moving average (ARMA), and autoregressive integrated moving average (ARIMA), have widely been used for short-term load forecasting. Since these methods imply the assumption that forecasting data are linearly dependent on the historical load data, they cannot reflect the non-linear characteristics of the observed historical data. Compared with the statistical models, machine learning models, including deep neural networks, can deal with complex and non-linear characteristics of datasets. Support vector machine (SVM) and support vector regression (SVR) models are widely used in load forecasting. Deep learning approaches, such as artificial neural network (ANN), convolutional neural network (CNN), recurrent neural network (RNN), and their combinations, have been applied to electric load forecasting.
Recently, many researchers have investigated deep learning-based load forecasting models. As a variation of RNNs, a long short-term memory (LSTM) model, originally developed by Hochreiter and Schmidhuber [12], has widely been used in sequential learning. This model consists of gate units and memory cells which enable learning of long-term dependencies in time-series data [13,14,15,16,17]. Zheng et al. [13] predicted electric load profiles of a building for each 15-minute interval by using the LSTM neural network. In addition, an LSTM model with a pooling technique was presented to forecast individual residential loads [14]. A combination of CNN and RNN is suggested to forecast the hourly load [15]. Similarly, Yan et al. [16] proposed a hybrid model of CNN and LSTM for multi-step, short-term load consumption. Bouktif et al. [17] proposed a combination model of genetic algorithm and LSTM to forecast residential, commercial, and industrial electric loads. These studies highlighted the advantages of LSTM, which can learn the temporal correlations between previous and current information.
However, in spite of the advantages of LSTM in the realm of load forecasting, only few researchers have focused on the LSTM models to forecast EV charging power demand. Zhu et al. [18] suggested an application of deep learning approaches to forecasting EV charging power demand in a large EV charging station in China. Zhu et al. [19] also proposed a minute-level, short-term EV charging load forecasting, applied to a charging station case and to an official charging site. Comparative studies, including several deep learning approaches, have been conducted, and the LSTM model was evaluated as the most effective model for forecasting extra-short-term EV charging load. However, these studies analyzed only a few charging stations, and the fast charging process was not considered. Although big data technologies [20], a temporal–spatial approach using a stochastic model [21], and a queueing network [22] have been proposed as EV charging demand forecasting models, these works only presented methodologies without any comparison with real data. In addition, even though a linear regression model [23], constrained-aware polynomials [24], and SVR [25] were proposed to forecast EV charging power demand, compared with real-world datasets, these models were only validated at station-level EV load demand forecasting.
Due to the characteristics of EV charging power demand profiles, such as a wide range of fluctuation related to the EV user’s stochastic behaviors and its sequential characteristics, it is reasonable to consider LSTM neural network for forecasting EV charging power demand. Therefore, this study proposes LSTM neural network to forecast aggregated EV fast-charging power demand. To validate the proposed model, a real-world dataset measured from 244 fast-charging stations in Jeju Island, South Korea, was used. To improve forecasting performance, window sliding min–max normalization and a weights initialization method were suggested. Based on the suggested approaches, a case study was conducted to validate the proposed model compared with other deep learning approaches, such as Bi-LSTM, GRU, and RNN.
The main contributions of this paper can be summarized as follows:
- The proposed short-term forecasting model, based on deep learning approaches, covers the EV charging power demand on the aggregation level. This study diversifies the forecasting models, such as LSTM, Bi-LSTM, GRU, and RNN.
- To improve the accuracy of the proposed model, a window sliding min–max normalization is introduced as a preprocessing technique. This method is a modification version of standard min–max normalization, by scaling the data in a relatively short interval to deal with dynamics of fast-charging power demand. Forecasting results with and without the suggested technique are presented and discussed.
- The temporal data used in this study contain two critical aspects: one is the unit with active power, and the other factor is fast-charging power. Therefore, from a power system perspective, it can contribute to evaluating the impact of charging power of EVs. Moreover, it is helpful to decide to plan, operate, and maintain the power equipment and systems of substations and transmission levels in power grids. In other words, the EV charging power demand forecasting in our research is the foundation for improving the reliability of the grids by analyzing the peak load profiles due to EV fast-charging power demand.
The rest of this paper is organized as follows: the theoretical background and rationale behind the proposed model are described in Section 2. The flowchart of the proposed forecasting methodology, including the normalization and weights initialization approach, is explained in Section 3. The description of historical data, its pattern analysis, and experimental setup for implementation are presented in Section 4. The numerical results of LSTM, Bi-LSTM, GRU, and RNN are presented and analyzed in Section 5. The challenge in forecasting EV fast-charging power demand and suggested solutions are discussed in Section 6. Finally, the conclusions of this study are presented in Section 7.
2. Theoretical Background
The deep neural network is state-of-the-art in the field of machine learning, with the capability to learn the features from a large dataset. Depth in neural networks is a crucial aspect of deep learning and represents stacking multiple layers of hidden units. Therefore, deep architecture can provide significant advantages, as follows: (1) to promote the reuse of features and (2) to include more abstract features at higher layers of representations [26].
With boosting parallel computing and hardware systems, the deep learning algorithm has shown an outstanding performance in many research domains. In addition, a fast and greedy algorithm could tackle a slow learning process by finding the optimal set of parameters rapidly [27]. For these reasons, the research field used in deep learning methods has been increased progressively, including time series forecasting, natural language processing, pattern recognition, and image captioning [28].
2.1. The RNN Model
Recurrent neural network is specialized for processing sequential data. RNN includes edges connecting adjacent time steps, unlike traditional fully connected feedforward networks. The self-connected recurrent edges across several time steps form cycles in which temporal correlations between the previous state and current information are able to be established [14]. The topology of RNN is shown in Figure 1, in which a folded structure is on the left side and unfolded computational graph is on the right side.
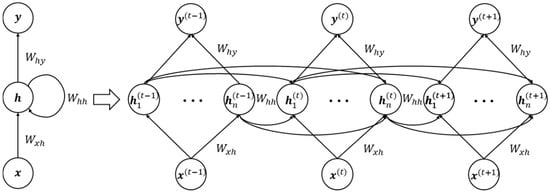
Figure 1.
The computational graph of RNN structure.
Regarding sequence data, the decision made at time step can influence the decision made at time step . Consequently, this intrinsic attribute of RNNs is suitable for the EV charging power demand forecasting problem since it has been pointed out that EV users’ charging patterns may be critical stochastic variables for the prediction of EV charging power demand at the next time intervals. The propagation formulation in RNNs at each time step is given in Equations (1)–(3).
where is the input vector and is the output vector of hidden state at each time step . is the activation function typically used by a hyperbolic tangent (tanh). and are the bias vectors, respectively. , , and are the weight matrices for the input-to-hidden layer, hidden-to-next hidden layer of the adjacent time step, and hidden-to-output layer, respectively. is the predicted values of the forecasting model, and is the actual values from EV charging stations. The total loss is obtained by the sum of the losses representing the difference between predicted values and actual values over all time steps.
2.2. The LSTM Model
Computing the gradient of standard RNNs is conducted by backpropagation through time (BPTT) algorithm during its training phase [29]. As the number of time steps increases, however, training with RNNs is confronted with the difficulty of learning long-term dependencies due to the vanishing or exploding gradient problems [30].
To solve this challenge, a long short-term memory is proposed by introducing the memory cell with standard RNNs. The augmented memory cell includes self-connection from a node, ensuring that the gradient can propagate across many time steps without vanishing or exploding. Furthermore, Gers et al. [31] proposed the forget gates with LSTM memory cell, and this architecture became a standard in most modern implementations for sequence learning. In this regard, the structure of LSTM cells is presented with its unrolled architecture, as shown in Figure 2. Furthermore, the calculation procedure at each time step of LSTM block is presented as the following formulations given in Equations (4)–(9).
where is the input sequences at time and is the output vector of the hidden state, while represents the output of the internal memory cell state at the time step. The parameter set and set are weight matrices and bias vectors, respectively. (∙) and (∙) are the activation functions used LSTM neural network. As shown in Equations (4)–(6), there are three main gates corresponding to forget, input, and output gate, respectively. These three gates, having sigmoid functions, are distinctive characteristics of the LSTM structure. The output of forget gate, labeled , represents the probabilistic value between 0 and 1 due to the sigmoid function. If the value of is close to zero, then forget the previous memory cell information. If the value of is close to one, then the previous memory cell information is kept. The role of the input gate is to determine whether new information from a previous time step will be stored or not by updating the cell state. The value of output gate contributes to delivering the present information to the next internal state. The memory cell state, denoted by , interacts with the input and forget gate to decide how much new information, , should be accepted, and how much past information, , should be maintained.
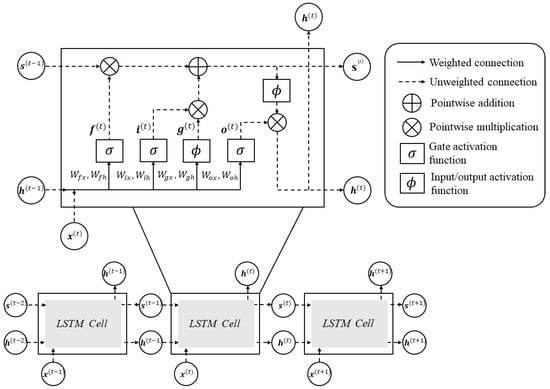
Figure 2.
The computational graph of LSTM structure.
3. Methodology
This section describes the proposed methodology for short-term EV charging power demand forecasting on the aggregation level. Figure 3 shows the details of the flowchart of the forecasting framework. This framework is briefly composed of four stages, as follows: (1) data preprocessing, (2) setting up parameters in a network, (3) network training, and (4) forecasting EV fast-charging power demand.
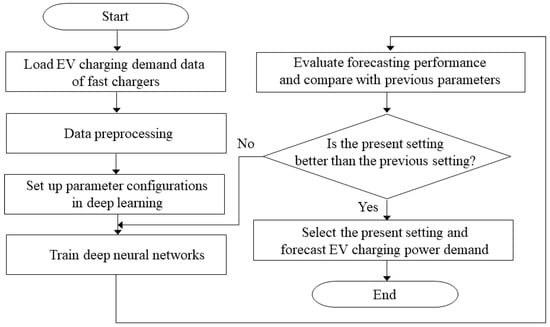
Figure 3.
Flowchart of the proposed forecasting methodology.
3.1. Overview of Forecasting Methodology
The inputs of the forecasting framework include the aggregated hourly intervals of EV charging power demand collected from fast chargers. The preprocessing stage includes data cleansing and normalization. It starts by detecting missing values and dealing with the outliers which deviate so much from a normal range. After data cleansing, data should be normalized within a specific range, in order to stabilize the gradient-based optimization problem. It is essential to select suitable network parameters to achieve the best forecasting performance. To figure out the optimal parameters set, the comparison of each experimental setting is conducted by calculating the three evaluation matrices (details in Section 5.1). Four different deep learning algorithms, including LSTM, Bi-LSTM, GRU, and RNN, are performed for forecasting the aggregated EV fast-charging power demand.
3.2. Data Normalization
The normalization procedure is crucial to forecasting problems since it can make the optimization process stable during the training period. The purpose of normalization is generally to shorten the training time and to lead to optimal convergence in neural networks. An appropriate scaling method improves the convergence of gradient-based optimization keeping the non-convex error surface more like a spherical shape.
Indeed, the min–max normalization is straightforward to apply to the original dataset. The dataset used in this study can be split into a training set, validation set, and test set and scaled to the given range of [0, 1], retaining their original scale invariance according to Equation (10). Since the LSTM recurrent network is susceptible to the data scale, many published studies, applied to LSTM for time series forecasting, have adopted the min–max normalization [18,19,32].
where is the normalized output of the given sequence , and is -th instance of . , and are the minimum value and the maximum value of , respectively.
This study proposes a window sliding min–max normalization, shortly window normalization, as the second normalization method for EV charging power demand forecasting task. The window normalization is designed to transform the input values, along with a window length. This characteristic makes the original data possible to be transformed with relatively short intervals.
Due to the distinctive LSTM topology, it is evident that time-series data should be transformed to three-dimensional data like [batch size, time step, input dimension] . , , and denote the size of batch, the number of time steps, and the length of the input sequence, respectively. The window length, , is defined by , in which normalization conducts each time. Consequently, the window normalization is able to perform going down in each row of input shape . Figure 4 shows how to apply the window sliding min–max normalization in EV charging power demand.
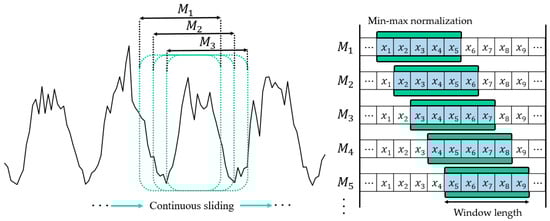
Figure 4.
The example of window sliding min–max normalization.
3.3. Initialization of Parameters in Deep Learning Approaches
The gradient matrix, with respect to the weights during BPTT, might be easily dependent on the distribution of activation outputs. Therefore, the selection of the initial distribution of weights is important in optimizing the deep learning models. In [33], the Xavier initialization method was proposed as weights initialization when the activation function is tanh. This method is presented in (11). After performing the hyper-parameter tuning tests, tanh showed slightly better performance on forecasting EV charging power demand in our deep learning model. Thus, the Xavier initialization is used as weights initialization strategy.
where is the weight matrix at a previous layer and current layer , represents the size of each layer, and represents uniform distribution.
4. Implementation
The major challenge of fast-charging power demand forecasting is severe volatility and substantial inconsistency. In contrast to the slow charging process, the charging duration of the fast charging process is quite short, and the rated power of fast chargers is relatively high. Such characteristics make fast-charging power demand forecasting more difficult than forecasting slow-charging power demand, which typically has regular patterns and stable trends. This section includes the introduction of EV charging profile, its pattern analysis, and its experimental setup for implementation.
4.1. Data Description
The dataset of EV charging power demand from fast-charging stations was collected in the whole Jeju Island area. The data used in this study is from 1 January 2018 to 31 May 2018 in hourly intervals. The number of commercial fast-charging stations considered in this study was 244, of which, the charging rated power was 50 kW. Given the interest of this study, the obtained data were aggregated to analyze the power system dynamics and reliability for a transmission level, rather than a small-sized demand scale.
Table 1 lists the classification of EV charging level and its rated values according to the Society of Automotive Engineer standard J1772 [34]. Fast chargers can generate high-power alternating current, direct current, and high rated power, and can fully recharge a battery of EV within 1 h [2,35]. In this regard, the fast-charging power can be regarded as a critical factor that influences the impact of the power system due to its high rated power, voltage, and short charging duration.

Table 1.
EV charging classification and rated value.
4.2. Data Analysis
For the analysis of aggregated EV charging power demand from fast chargers, the charging pattern is shown in Figure 5. Although EV charging pattern was aggregated, it is difficult to figure out periodic and regular characteristics. To identify the general tendency of hourly profiles, the box plot is used to express the hourly average of charging power demand in Figure 6. As shown in Figure 6, the EV charging power demand increases in the daytime and reduces in the evening. This indicates that significant energy demand occurs during 15:00–18:00 in the power system. Interestingly, the temporal tendency of fast-charging power demand differs from that of slow charging process in which power demand increases in the evening (when the EV drivers go back home after work).
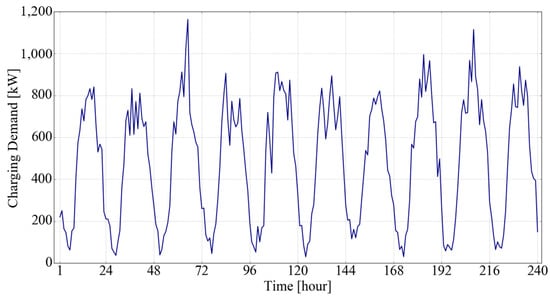
Figure 5.
The pattern of EV fast-charging power demand (10 days).
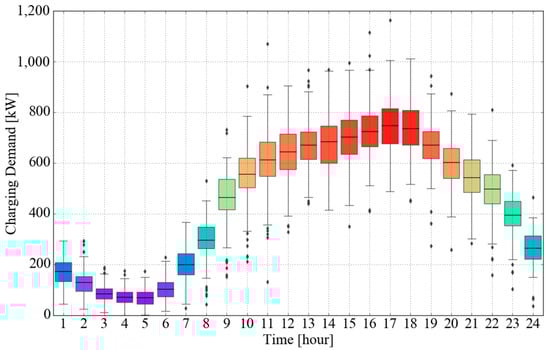
Figure 6.
The pattern of EV fast-charging power demand (hourly average).
To describe the highly irregular pattern in more detail, fast-charging power demand is added as a daily interval in Figure 7. As shown in Figure 7, it is difficult to figure out the upward, downward, or consistent trends. Furthermore, in Figure 8, the distribution of peak time and peak value seems to be spread in a wide range of time. These results indicate that it is not easy to clarify the range of peak time and peak value.
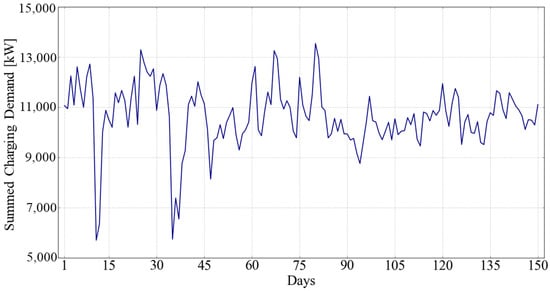
Figure 7.
Trend of daily fast-charging power demand.
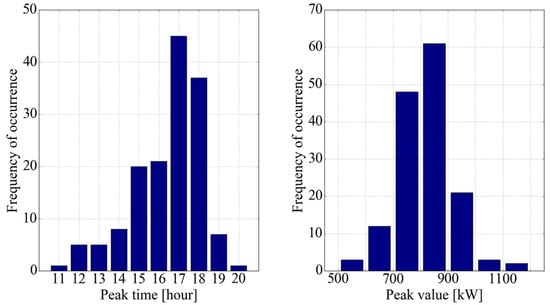
Figure 8.
Distribution of peak time and peak values.
There are three main reasons why EV fast-charging power demand pattern has high volatility and uncertainty. The first reason is related to the inherent attribute of fast charging, which requires the high charging power within a short period. It makes the charging pattern irregular and has a large number of spikes and hills. The second reason is the difficulty of expecting the charging starting time. The charging pattern of slow chargers, which are mostly equipped in residential sites, is substantially related to EV owners’ commute time. However, most fast-charging stations are publicly accessible at any time. For this reason, the uncertainty of charging starting time makes the fast-charging power pattern more complicated. The third reason is related to the geographical characteristic of Jeju Island in South Korea. Jeju Island has significant regional characteristics due to its touristic functionality and higher EV penetration rate promoted by national policies. As most EV users in Jeju Island are visitors of this region, EV fast-charging power demand patterns become more unpredictable and complicated.
4.3. Experimental Setup
The historical dataset of EV charging power demand consists of hourly interval values, and its unit is active power. The data period is 150 days (3600 data points). To split the historical data into three groups, the ratio of the training set, validation set, and test set is selected as 0.8 (from 1 January 2018 to 30 April 2018), 0.1 (from 1 May 2018 to 15 May 2018), and 0.1 (from 16 May 2018 to 30 May 2018), respectively. The training set is used for network training, the validation set is used to decide the best performing model variables, and the test set is needed to confirm forecasting accuracy, based on the evaluation matrices.
For exploring the optimal performance of forecasting EV charging power demand, four state-of-the-art deep learning algorithms, including standard LSTM, Bi-LSTM, GRU, and RNN, are considered. The hyper-parameters of these model are given in Table 2.
Table 2.
Deep learning hyper-parameters setting.
5. Experimental Results
5.1. Model Evaluation
To evaluate the performance of the proposed models, three widely used metrics were considered including the root mean square error (RMSE), the normalized mean absolute error (NMAE), and the normalized root mean square error (NRMSE). These metrics are defined as follows:
where is the number of samples, is the -th forecasting data, and is the - th, corresponding to actual data. and are the maximum and minimum values of the actual dataset, respectively.
5.2. Forecasting Results of EV Charging Power Demand
In terms of EV charging power demand forecasting, deep RNN with two hidden layers and neurons in each layer showed the best forecasting performance compared to the other case of hidden layers and neurons. The time steps considered in our case are 2, 6, and 10, and the forecasting results with different time steps are presented in Table 3. RNN typically showed the best forecasting performance in time step 2, while other deep learning models showed higher accuracy in time step 10.
Table 3.
Numerical results of EV fast-charging power demand forecasting.
The sensitivity of the different number of time steps was analyzed, and the best evaluation result occurred to time step 10. The forecasting model was implemented with 150 epochs and 50 batch sizes on each iteration. Adam optimizer showed an overall better performance with a faster training speed among different types of optimizer stochastic gradient descent (SGD), Adadelta, and RMSProp. Therefore, the proposed forecasting model was implemented using Adam with a learning rate of 1 × 10⁻³. Activation function tanh showed slightly better performance on forecasting EV charging power demand. Therefore, tanh was selected as an activation function instead of sigmoid and rectified linear unit (ReLu). The EV charging power demand forecasting model was implemented using the best performance hyper-parameters. Multiple scenarios were composed the following: (1) two different normalization methods, (2) three different time steps, and (3) four deep learning methods. For the evaluation of each scenario, RMSE, NMAE, and NRMSE were calculated on total 360 data points during test period. This study focused on identifying which scenario has the best forecasting performance, and the results are listed in Table 3.
For each deep learning method, the window sliding min–max normalization shows better performance than standard min–max normalization. Time step 10 is suitable for the LSTM, Bi-LSTM, and GRU, while the RNN shows a great forecasting performance with time step 2. In general, the proposed LSTM achieves the best forecasting performance. In this study, therefore, the best framework for EV fast-charging power demand forecasting is confirmed to be LSTM neural network with time step 10 using window sliding min–max normalization.
The comparison of forecasting results obtained by four different deep learning models with optimal hyper-parameters are illustrated in Figure 9 and Figure 10. The period shown in Figure 9 is 12 days (from 1 May 2018 to 12 May 2018), and the period shown in Figure 10 is 1 randomly selected day. Figure 9 and Figure 10 demonstrates that a deep learning model based on RNN neural network can accurately forecast the EV fast-charging power demand. LSTM model showed the best performance among deep learning models. As shown in Figure 10, the peak value occurs at 18:00, and it is accurately captured by the proposed LSTM model. Furthermore, LSTM can substantially follow the hill points of EV charging power demand much better while 11:00–12:00, 14:00–15:00, and 16:00–18:00. The forecasting results of the Bi-LSTM and GRU model slightly overlap in a given time period. The RNN model, however, seems to have a gap between forecasted and actual values.
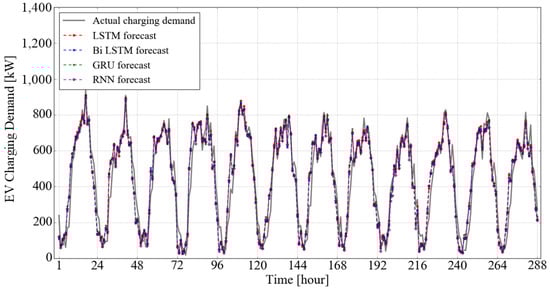
Figure 9.
Forecasted EV fast-charging power demand (12 days).
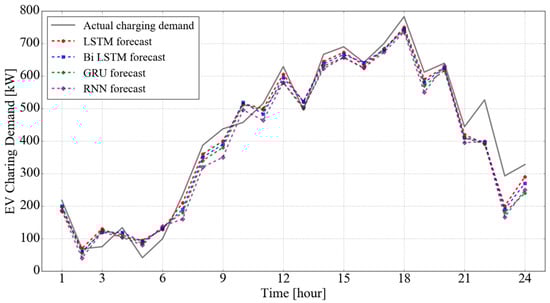
Figure 10.
Forecasted EV fast-charging power demand (single day).
The comparison of train loss and test loss curves within 150 epochs is given in Figure 11. The mean squared error (MSE) measures the average squared difference between the predicted values and actual values, and it is used as a loss function. Train loss and test loss begin in the vicinity of 0.085 and 0.012 in the LSTM model, which has the best forecasting performance. Train loss and test loss start by 0.09 and 0.018 for Bi-LSTM and GRU model similarly. In terms of the RNN model, the values of train loss and test loss begin at 0.14 and 0.03, respectively.
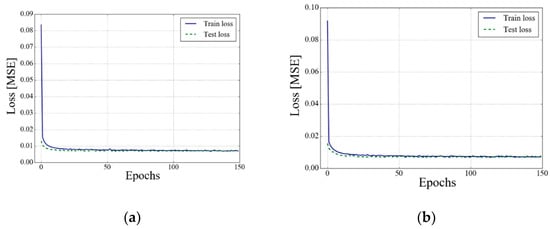
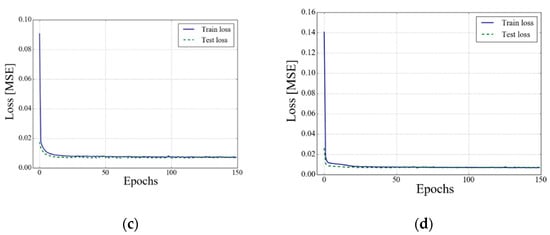
Figure 11.
Train loss and test loss curves of each deep learning method: (a) LSTM method; (b) Bi-LSTM method; (c) GRU method; (d) RNN method.
6. Discussion
The reason for the difficulty in forecasting fast-charging power demand is that it has an endogenous irregular trend, as described in Section 4.2. Our research area focuses on two factors related to 50 kW fast charging process (not a slow charging process), and publicly accessible charging station on public domain (not a privately accessible charging station). The property of charging patterns deduced from the fast charging process exhibits drastic temporal variation, such as significant peak and valley features. In addition, since the public charging station can be available to recharge the battery of EV at any time, it is difficult to predict when drastic fluctuations will occur. These factors make fast charging patterns more complex and nonstationary.
To tackle these challenges, this paper proposed the deep learning approach with the strategies for selecting the initial distribution of weights and the normalization method, taking into account the continuous sliding window technique. Using deep LSTM neural network with the Xavier initialization to reflect temporal correlations of charging characteristics leads to improved forecasting accuracy in Section 2.2 and Section 3.3. Furthermore, historical charging data was continuously normalized, with short intervals denoted by window length, as discussed in Section 3.2. This technique positively affects the training stage of deep learning, capturing the dynamic nature of fast-charging power demand.
The proposed framework enables to help an efficient power system operation, such as stability analysis and the energy management system (EMS). For example, the estimated value of integrated EV charging demand is fed into an adaptive protection system for stabilization of voltage regulation in distribution network [36]. Forecasting results can also be used to the cost-efficient EMS in which optimal scheduling of public EV charging stations is performed to minimize the cost of energy to charge the EVs [37]. Similarly, EV charging power demand is fed into optimal EMS for maximum profit, considering the dynamicity of energy price and large-scale deployment of EVs [38].
7. Conclusions
The uncoordinated deployment of EV charging stations and the increase in the power demand of EVs could influence the power system reliability. To address the unexpected impacts on power grids due to EV charging power demand, various forecasting models have been developed. However, due to the aperiodic and fluctuating characteristics of the EV fast-charging power demand, forecasting the aggregated data and the charging mode-dependent data have not been widely explored.
This study, therefore, aimed to suggest LSTM neural network to forecast the aggregated charging power demand in multiple fast-charging stations. This paper presented a framework for forecasting fast-charging power demand based on deep learning approaches and techniques, including window normalization and weights initialization. To validate the proposed forecasting model, the real-world EV dataset obtained in Jeju Island, South Korea, was used and analyzed.
The forecasting results indicate that the proposed LSTM model achieved good accuracy with RMSE of 61.63, NMAE of 5.15%, and NRMSE of 6.65% and outperformed the other deep learning models, such as Bi-LSTM, GRU, and RNN. The forecasting results could be used not only for the planning of power equipment and systems but also for their operating, to ensure the power system reliability under the increase in EV penetration.
Author Contributions
Conceptualization, M.C., G.C., J.Y. and S.B.; methodology, M.C.; formal analysis, M.C., G.C., J.Y. and S.B.; writing—original draft preparation, M.C.; writing—review and editing, S.B.; supervision, S.B.; project administration, S.B.; funding acquisition, S.B. All authors have read and agreed to the published version of the manuscript.
Funding
This work was supported by the Korea Institute of Energy Technology Evaluation and Planning (KETEP) and the Ministry of Trade, Industry & Energy (MOTIE) of the Republic of Korea (No. 20207200000010).
Institutional Review Board Statement
Not applicable.
Informed Consent Statement
Not applicable.
Data Availability Statement
Not applicable.
Conflicts of Interest
The authors declare no conflict of interest.
References
- IEA. Global EV Outlook. 2021. Available online: https://www.iea.org/reports/global-ev-outlook-2021 (accessed on 4 November 2021).
- Macioszek, E. Electric Vehicles–Problems and Issues. In Proceedings of the Transport Systems Theory and Practice, Katowice, Poland, 16–18 September 2019. [Google Scholar]
- Ling, Z.; Cherry, C.R.; Wen, Y. Determining the Factors That Influence Electric Vehicle Adoption: A Stated Preference Survey Study in Beijing, China. Sustainability 2021, 13, 11719. [Google Scholar] [CrossRef]
- Macioszek, E. E-mobility Infrastructure in the Górnos´lasko-Zagłebiowska Metropolis, Poland, and Potential for Development. In Proceedings of the 5th World Congress on New Technologies (NewTech’19), Lisbon, Portugal, 18–20 August 2019. [Google Scholar]
- Gomez, J.C.; Morcos, M.M. Impact of EV battery chargers on the power quality of distribution systems. IEEE Trans. Power Deliv. 2003, 18, 975–981. [Google Scholar] [CrossRef]
- Deb, S.; Tammi, K.; Kalita, K.; Mahnta, P. Impact of Electric Vehicle Charging Station Load on Distribution Network. Energies 2018, 11, 178. [Google Scholar] [CrossRef] [Green Version]
- Deng, Q.; Feng, C.; Wen, F.; Tseng, C.L.; Wang, L.; Zou, B.; Zhang, X. Evaluation of Accommodation Capability for Electric Vehicles of a Distribution System Considering Coordinated Charging Strategies. Energies 2019, 12, 3056. [Google Scholar] [CrossRef] [Green Version]
- Pirouzi, S.; Aghaei, J.; Niknam, T.; Khooban, M.H.; Dragicevic, T.; Farahmand, H.; Korpås, M.; Blaabjerg, F. Power Conditioning of Distribution Networks via Single-Phase Electric Vehicles Equipped. IEEE Syst. J. 2019, 13, 3433–3442. [Google Scholar] [CrossRef] [Green Version]
- Chen, W.; Zhang, L.; Pei, X. Probability Evaluation of Excess Voltage in a Distribution Network with Uneven Charging Electric Vehicle Load. J. Electr. Eng. Technol. 2021. [Google Scholar] [CrossRef]
- Pai, F.S.; Tseng, P.S. A Control Approach Integrating Electric Vehicle Charger and Dynamic Response of Demand-Side Resource Aggregators. J. Electr. Eng. Technol. 2020, 15, 1025–1034. [Google Scholar] [CrossRef]
- Kalogirou, S.A. Artificial neural networks in renewable energy systems applications: A review. Renew. Sust. Energy Rev. 2001, 5, 373–401. [Google Scholar] [CrossRef]
- Hochreiter, S.; Schmidhuber, J. LSTM can solve hard long time lag problems. In Proceedings of the Advances in Neural Information Processing Systems, Denver, CO, USA, 2–5 December 1996. [Google Scholar]
- Zheng, J.; Xu, C.; Zhang, Z.; Li, X. Electric load forecasting in smart grids using Long-Short-Term-Memory based Recurrent Neural Network. In Proceedings of the Information Sciences and Systems, Baltimore, MD, USA, 22–24 March 2017. [Google Scholar]
- Shi, H.; Xu, M.; Li, R. Deep Learning for Household Load Forecasting—A Novel Pooling Deep RNN. IEEE Trans. Smart Grid 2018, 9, 5271–5280. [Google Scholar] [CrossRef]
- He, W. Load forecasting via deep neural networks. Procedia Comput. Sci. 2017, 122, 308–314. [Google Scholar] [CrossRef]
- Yan, K.; Wang, X.; Du, Y.; Jin, N.; Huang, H.; Zhou, H. Multi-Step Short-Term Power Consumption Forecasting with a Hybrid Deep Learning Strategy. Energies 2018, 11, 3089. [Google Scholar] [CrossRef] [Green Version]
- Bouktif, S.; Ouni, A.; Serhani, M.A. Optimal Deep Learning LSTM Model for Electric Load Forecasting using Feature Selection and Genetic Algorithm: Comparison with Machine Learning Approaches. Energies 2018, 11, 1636. [Google Scholar] [CrossRef] [Green Version]
- Zhu, J.; Yang, Z.; Guo, Y.; Zhang, J.; Yang, H. Short-Term Load Forecasting for Electric Vehicle Charging Stations Based on Deep Learning Approaches. Appl. Sci. 2019, 9, 1723. [Google Scholar] [CrossRef] [Green Version]
- Zhu, J.; Yang, Z.; Mourshed, M.; Guo, Y.; Zhou, Y.; Chang, Y.; Wei, Y.; Feng, S. Electric Vehicle Charging Load Forecasting: A Comparative Study of Deep Learning Approaches. Energies 2019, 12, 2692. [Google Scholar] [CrossRef] [Green Version]
- Arias, M.B.; Bae, S. Electric vehicle charging demand forecasting model based on big data technologies. Appl. Energy 2016, 183, 327–339. [Google Scholar] [CrossRef]
- Arias, M.B.; Bae, S. Prediction of electric vehicle charging-power demand in realistic urban traffic networks. Appl. Energy 2017, 195, 738–753. [Google Scholar] [CrossRef]
- Liang, H.; Sharma, I.; Zhuang, W.; Bhattacharya, K. Plug-in electric vehicle charging demand estimation based on queueing network analysis. In Proceedings of the 2014 IEEE PES General Meeting Conference & Exposition, National Harbor, MD, USA, 27–31 July 2014. [Google Scholar]
- Cheon, S.; Kang, S.J. An Electric Power Consumption Analysis System for the Installation of Electric Vehicle Charging Stations. Energies 2017, 10, 1534. [Google Scholar] [CrossRef]
- Ahn, N.; Jo, S.Y.; Kang, S.J. Constraint-Aware Electricity Consumption Estimation for Prevention of Overload by Electric Vehicle Charging Station. Energies 2019, 12, 1000. [Google Scholar] [CrossRef] [Green Version]
- Majidpour, M.; Qiu, C.; Pota, H.R.; Gadh, R. Forecasting the EV charging load based on customer profile or station measurement. Appl. Energy 2016, 163, 134–141. [Google Scholar] [CrossRef] [Green Version]
- Bengio, Y.; Courville, A.; Vincent, P. Representation learning: A review and new perspectives. IEEE Trans. Pattern Anal. Mach. Intell. 2013, 35, 1798–1828. [Google Scholar] [CrossRef]
- Hinton, G.E.; Osindero, S.; Teh, Y.W. A fast learning algorithm for deep belief nets. Neural Comput. 2006, 18, 1527–1554. [Google Scholar] [CrossRef] [PubMed]
- Lipton, Z.C.; Berkowitz, J.; Elkan, C. A Critical Review of Recurrent Neural Networks for Sequence Learning. arXiv 2015, arXiv:1506.00019. Available online: https://arxiv.org/abs/1506.00019 (accessed on 4 November 2021).
- Werbos, P.J. Backpropagation through time: What it does and how to do it. Proc. IEEE 1990, 78, 1550–1560. [Google Scholar] [CrossRef] [Green Version]
- Bengio, Y.; Simard, P.; Frasconi, P. Learning long term dependencies with gradient descent is difficult. IEEE Trans. Neural Netw. 1994, 5, 157–166. [Google Scholar] [CrossRef] [PubMed]
- Gers, F.A.; Schmidhuber, J.A.; Cummins, F.A. Learning to forget: Continual prediction with LSTM. Neural Comput. 2000, 12, 2451–2471. [Google Scholar] [CrossRef] [PubMed]
- Kong, W.; Dong, Z.Y.; Jia, Y.; Hill, D.J.; Xu, Y.; Zhang, Y. Short-Term Residential Load Forecasting Based on LSTM Recurrent Neural Network. IEEE Trans. Smart Grid 2019, 10, 841–851. [Google Scholar] [CrossRef]
- Glorot, X.; Bengio, Y. Understanding the difficulty of training deep feedforward neural networks. In Proceedings of the Thirteenth International Conference on Artificial Intelligence and Statistics, Sardinia, Italy, 13–15 May 2010. [Google Scholar]
- Society Automotive Engineers. Available online: http://standards.sae.org/j1772_201001/ (accessed on 4 November 2021).
- Brenna, M.; Foiadelli, F.; Leone, C.; Longo, M. Electric Vehicles Charging Technology Review and Optimal Size Estimation. J. Electr. Eng. Technol. 2020, 15, 2539–2552. [Google Scholar] [CrossRef]
- Turan, M.H.; Gökalp, E. Integration Analysis of Electric Vehicle Charging Station Equipped with Solar Power Plant to Distribution Network and Protection System Design. J. Electr. Eng. Technol. 2021. [Google Scholar] [CrossRef]
- Ahmad, F.; Alam, M.S.; Shariff, S.M.; Krishnamurthy, M. A Cost-Efficient Approach to EV Charging Station Integrated Community Microgrid: A Case Study of Indian Power Market. IEEE Trans. Transp. Electrif. 2019, 5, 200–214. [Google Scholar] [CrossRef]
- Ahmad, F.; Alam, M.S.; Shariff, S.M. A Cost–Efficient Energy Management System for Battery Swapping Station. IEEE Syst. J. 2019, 13, 4355–4364. [Google Scholar] [CrossRef]
Publisher’s Note: MDPI stays neutral with regard to jurisdictional claims in published maps and institutional affiliations. |
© 2021 by the authors. Licensee MDPI, Basel, Switzerland. This article is an open access article distributed under the terms and conditions of the Creative Commons Attribution (CC BY) license (https://creativecommons.org/licenses/by/4.0/).