Article

Defining High-Quality Answers on a Chinese Tourism Q&A Platform in Terms of Information Needs

1
Department of Information Management, School of Government, Beijing Normal University, Beijing 100875, China
2
School of Management, Xi’an Jiaotong University, Xi’an 710049, China
*
Authors to whom correspondence should be addressed.
Sustainability 2021, 13(24), 13884; https://doi.org/10.3390/su132413884
Submission received: 17 November 2021 / Revised: 8 December 2021 / Accepted: 11 December 2021 / Published: 15 December 2021

Abstract

:
Travel Question and Answer (Q&A) platforms are widely used by travelers to exchange information online. This paper examined one such platform, Ctrip Q&A, to better understand the features of high-quality answers. The questions were first categorized into four types of information required by tourists (knowledge, efficiency, risk, and hedonic types) and then subdivided into more concrete elements, such as accommodation, food, and climate. The characteristics of high-quality answers on the platform were identified and a regression analysis was conducted to determine their importance. The study found that negative emotional expressions negatively impacted the quality of answers while the usefulness, richness, and amount of information had a positive effect. The usefulness of the answer content and quantity of information consistently predicted high-quality answers, whereas richness and conciseness were inconsistently related. Finally, the characteristics of high-quality answers to questions about different elements of tourism in the same category of tourist information varied significantly. This study may help travelers select and provide high-quality answers on tourism Q&A platforms. It may also assist platform operators in optimizing the features of their platforms, thereby improving user satisfaction and overall quality.

1. Introduction

As China’s economy develops, people’s living standards are increasing, reflected in both the growing demand for and consumption of tourist services. The statistics demonstrate the magnitude of this trend in economic terms. According to China’s National Bureau of Statistics, the number of tourists from mainland China reached 6.01 billion in 2019, an increase of 8.4%, year on year. Among these, the number of outbound tourists grew by 4.5% to 169.21 million. In terms of consumption, mainland China’s tourism revenue rose by 11.7% from the previous year to RMB 57.251 billion in 2019 [1].
People’s demand for and use of the internet has similarly increased due to the convenience and improvements it offers their daily lives. Under existing modes of exchanging information, people ask and search for questions on internet platforms to obtain knowledge and solve problems, a movement spawning countless online question-and-answer platforms. Theories of expectation confirmation, attribution theory, and social capital indicate that users will be motivated by various internal and external motivations to contribute content to various social media—including Q&A platforms [2,3,4,5]. In line with this, travelers increasingly seek information and help from various user-generated content (UGC) websites, obtaining travel-related content from individual consumers rather than service providers [6]. Many tourism Q&A platforms, such as TripAdvisor, Ctrip Q&A, and Mafengwo, are now popular gathering places for travelers in China and abroad. For example, nearly 1.5 billion users have accessed Ctrip Q&A, and nearly 6.2 million self-published traveler questions have been answered since its establishment in 2013. The platforms contain a wealth of questions that can be used to dig deeper into travelers’ different information needs. These Q&A platforms were established based on their ability to provide high-quality information services, which remains central to their sustainable development [7]. Understanding what makes a high-quality response—and whether this differs according to the type of information required—will benefit such platforms.
The quality of information available on platforms impacts user satisfaction and related decision making considerably [8,9]. Therefore, the present study will guide users to share and choose high-quality travel answer content and help platforms to screen for high-quality answers according to the travel information required. In this way, the quality of information on travel Q&A platforms can be optimized, enhancing user travel plans, improving their satisfaction with travel Q&A platforms, and ensuring the sustainability of the platforms themselves.

2. Related Works

2.1. Tourism Q&A Platforms

Research into tourism Q&A platforms has focused either on the information-sharing behavior of travelers or the information support provided on the platforms. For the first of these, Casalo et al. modeled and tested hypotheses based on the theories of planned behavior, technology acceptance, and social identity to explore traveler willingness to use tourism communities. Their survey data showed that perceived usefulness, perceived behavioral control, and identification with the community positively impacted user willingness to participate [10]. Ayeh et al.’s study of TripAdvisor used surveys to investigate the influence of various factors on travelers who used the platform. The results showed that the perceived credibility of the platform information had a significant impact on the intention of users to use it, but that the direct impact of this on the behavioral intentions of users was relatively weak [11].
Studying the tourist information support provided to travelers on Q&A platforms can help clarify the functional positioning of platforms and increase their efficiency for users. For example, Arsal et al. studied Lonely Planet, comparing the influence of different information providers (such as local residents, experienced travelers, etc.) on all aspects of the travel experience. They found that information provided by experienced travelers or locals had the greatest impact on visitors to the site, with the latter particularly influencing decisions about accommodation and food [12]. Savolainen looked at Q&A data from the Yahoo! Answers travel question-and-answer module, and identified three types of information support on the platform: providing personal opinions, factual information, and advice [13]. Liu et al. conducted semi-structured, face-to-face interviews with 21 participants who had traveled within the previous two months and identified four roles played by travel Q&A platforms in their decision-making process, including “need generator”, “supporter”, “guide”, and “approver” [14].

2.2. Tourism Information Needs

By providing information, online Q&A platforms enable people to satisfy their cognitive, emotional, and social needs [15]. Tourist information needs have been analyzed comprehensively and in terms of specific elements, such as transportation—including aviation—and accommodation. Grotenhuis et al. analyzed the results of a questionnaire on the transportation information needs of Dutch travelers before and at different stages of travel. Whereas their participants paid more attention to travel time and search time before traveling, they were concerned with saving travel time above all else and ensuring they chose the right mode of transportation for their journeys [16]. Nwagwu et al. surveyed the aviation information needs of Nigerian air passengers, finding their primary concern was the cost of air tickets; baggage capacity and friendliness of customer service were also very important, while safety requirements were less significant [17]. Gal-Tzur et al. developed a three-way categorization of the public transport information needs of tourists into choice, that is, information needs related to the choice of mode of transportation; detail, i.e., auxiliary information about transportation, including fares, travel times, etc.; and an informal category covering how to avoid peak travel times and find information about landmarks at stations [18].
In addition to these separate analyses, scholars have also systematically conducted comprehensive, general research into tourist information needs of travelers. To explore the functionality of the Australian Tourist Information Center, Ballantyne et al. surveyed visitors to 18 local tourist information centers in Australia to understand which information needs were being met there. The tourists wished to obtain general information about the area, detailed information on local attractions, and accommodation information [19]. Wong et al. investigated Hong Kong traveler requirements for travel guides via in-depth interviews with 15 leisure travelers and 402 questionnaires about 9 types of travel information needs related to functionality, aesthetics, safety, and itinerary optimization to improve travel guides to the city [20]. Hwang et al. sampled user questions about South Korea and Japan published on the Lonely Planet platform to analyze their functional information needs. It was found that 71% of user needs centered on the acquisition of knowledge-based information about, for instance, fares and scenic spots, whereas only a small proportion of needs were concerned with reducing the risk of the journey or improving its efficiency [21].

2.3. Evaluations of Answer Quality

Many investigations have evaluated the quality of information on social media platforms [22,23,24,25,26], including that of Q&A sites [7]. To some extent, this quality reflects the level of construction of Q&A platforms since only high-quality answers can meet the questioner’s needs for information. Identifying the characteristics of optimal answers allows those with high levels of user satisfaction to be recommended by the platforms, whose services will be improved as a result. Research into the quality of information on social Q&A platforms tends to build an evaluative framework and predictive models but few studies of the tourist sector have yet been conducted.
To evaluate the quality of answers on general Q&A platforms, methods such as manual labeling and answerer adoption are used to include the perspectives of answer content and responder in frameworks. Some studies have evaluated the quality of answers on specific Q&A platforms, such as those addressing health and academic questions. For example, Chu et al. conducted an evaluative study of answers in the health field of Yahoo! Answers, recruiting nurses and librarians to evaluate responses in terms of accuracy, completeness, relevance, and professionalism: 46% of the answers were found to be of low quality [27]. Peer recommendations awarded to responses on the academic platform ResearchGate Q&A were counted by Li et al. to measure answer quality. Factors impacting the quality of the ResearchGate responses were explored from the perspective of the answer content and the answerer [28]. Finally, Fu et al. selected 2000 answers each from the four Stack Exchange fields of science, technology, entertainment, and art, and evaluated the quality of answers based on 23 user features and 24 data characteristics. The authors established that the effects of user and data characteristics on answer quality varied between each domain of knowledge [29].
While the quality of responses on Q&A platforms has been thoroughly investigated, little consideration has been given to those whose subject matter is tourism. Evaluative research carried out to date has mostly centered on tourism information provided on websites and social media. For instance, Bastida et al. studied the information quality of official travel websites in four cities—Hong Kong, Shanghai, Beijing, and Taipei—in terms of 23 dimensions and three aspects: pre-tourism, travel period, and website functions [30]. Meanwhile, Kim et al. researched Sina Weibo, evaluating the quality of tourism information published by official travel Weibo accounts in terms of the value, relevance, completeness, and interest of the information [31].

2.4. Summary

The literature review suggested that research into the life-oriented and domain-specific aspects of tourism Q&A platforms is limited. Despite its contemporary relevance, research evaluating the quality of answers on these platforms has not yet been conducted. Yet answers on the platforms are an important source of travel information, and their quality is of great significance to travelers. The wealth and diversity of the questions reflect the diverse information needs of those who ask them. Previous studies have investigated tourist information needs from general information-seeking perspectives as well as elements specific to tourism. This implies that investigations of the characteristics of high-quality answers must be linked to different types of tourist information needs.

3. Research Questions

This study investigates the largest Chinese online tourism Q&A platform, Ctrip Q&A. It seeks to understand what characterizes high-quality answers on this platform and further introduces tourism information needs into the analysis of these characteristics. That is, the content of user questions can be classified into different types of information needs before their links to the characteristics of high-quality answers are explored.
RQ1:
What are the characteristics that affect the quality of answers on tourism social Q&A platforms?
RQ1:
How do these characteristics vary according to the category of information required? Furthermore, do the characteristics of answers to each of these categories vary according to the different elements of tourism they refer to?

4. Method

4.1. Dataset

The data for this study came from Ctrip Q&A, a large corporate travel Q&A platform with nearly 1.5 billion users and almost 5.9 million travel questions answered on its pages. Users can select multiple tags for questions, such as “Beijing,” “Food,” and “Parks”, to clarify the subject of the question and attract responses. This study used location tags such as “Beijing” and “Shanghai” as the selection criteria for question data and combined them with Ctrip’s 2019 report on the travel habits of mainland Chinese residents. This report selected the top five tourist spots in mainland China (Beijing, Shanghai, Guangzhou, Shenzhen, and Chengdu) and overseas (Japan, the United States, Singapore, Thailand, and Malaysia), making a total of ten destination cities. All questions and answers providing the data for this study were related to at least one of these cities.
Between 7 and 10 December 2020, a crawler program was used to capture the question data under each destination tag. This included the URLs of the question and the questioner, the question title and content, and the number of answers to the question. The platform allows questioners to confirm the answer they wish to adopt from those received; alternatively, the platform will recommend high-quality answers to users for priority display. Questions with accepted or high-quality answers recommended by the platform are marked as resolved and were treated as high-quality answers in the present study. Therefore, only the resolved questions under the tags for each location were crawled to ensure a manageable dataset was obtained, facilitating the subsequent division of answers by quality. Ultimately, we obtained 3752 items of solved question data published between 9 August 2011, and 26 September 2020.
After collecting the question dataset, the URL of each question was used to collect information about the answers and answerers. For answer data, the answerer’s URL, answer content, number of likes, number of comments, number of pictures included in the answer, and answer adoption type—that is, whether the answer was adopted by the questioner or recommended by the platform—were captured. For the answerer, data on the number of followers, fans, questions, and questions answered were obtained. After randomly sampling the 3752 pieces of question data obtained above to annotate the categories (see Section 4.2 for the specific annotation process), 1314 pieces of question data were sampled to annotate the four types of question, between 27 March and 2 April 2021. After excluding logged-out user data and corresponding answers, we obtained 5837 pieces of answer data published between 4 June 2012 and 5 August 2020, as well as 2639 items of answerer data.

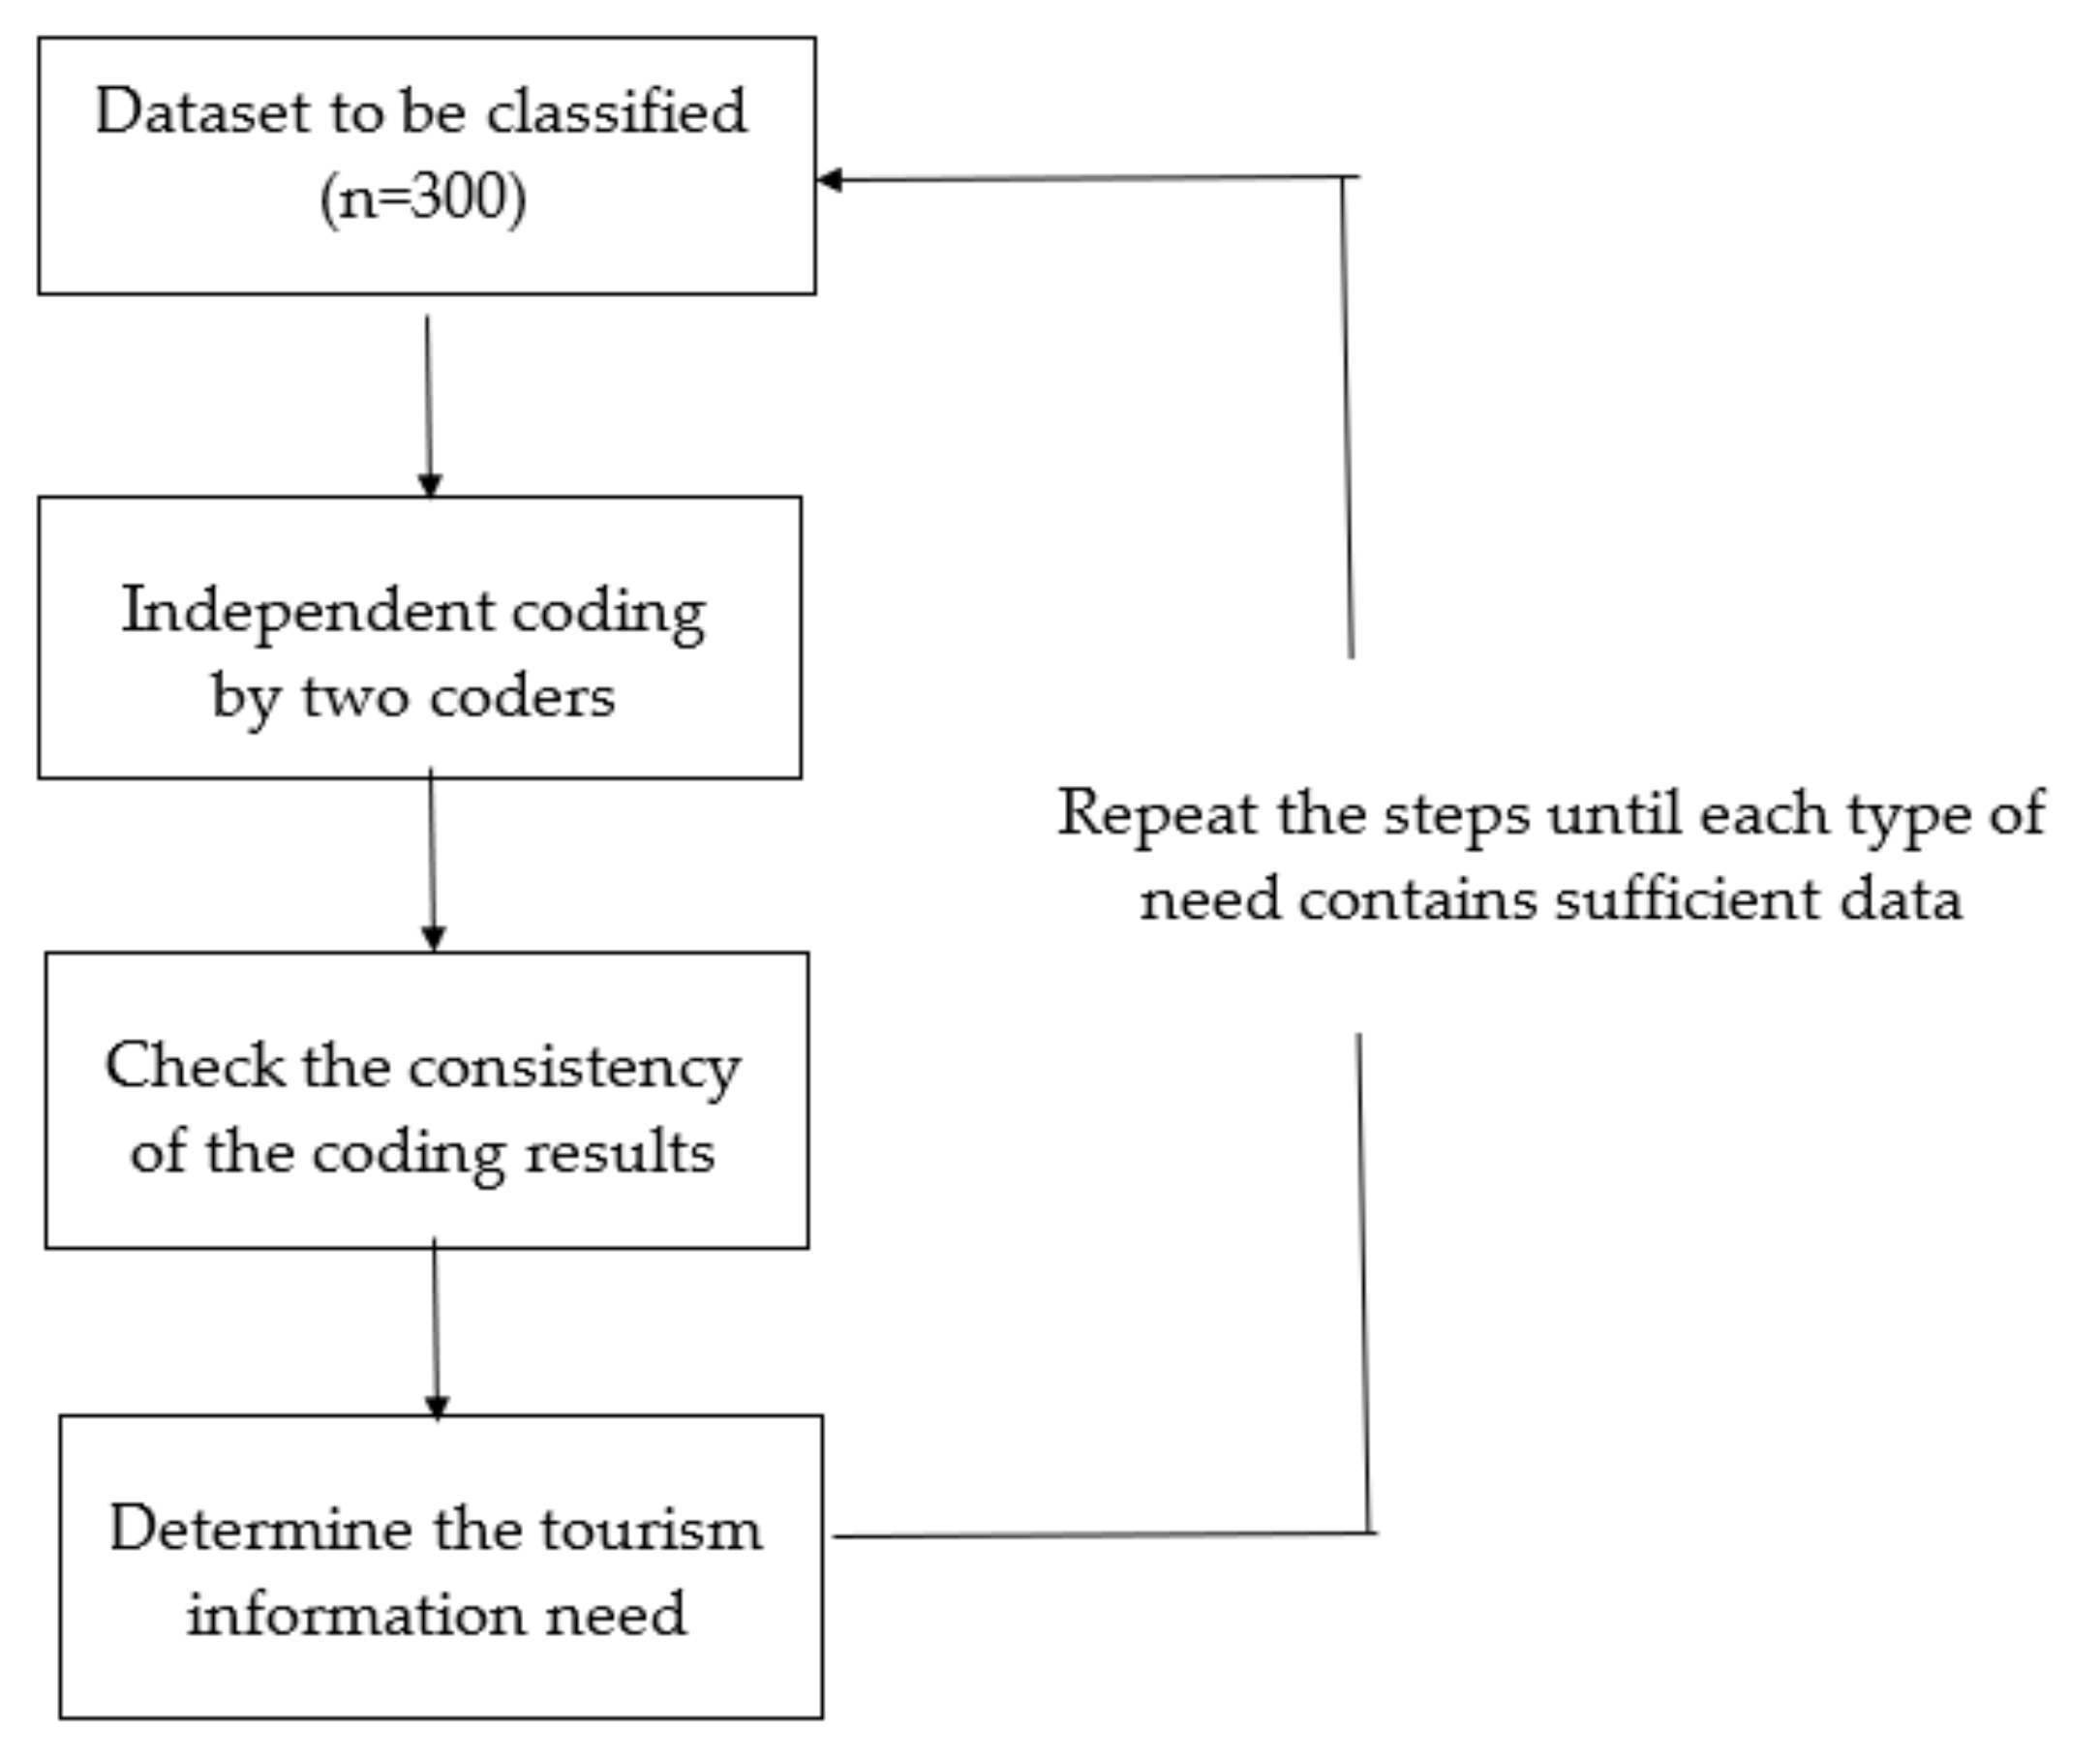
4.2. Question Dataset Annotation

Before considering the characteristics of high-quality answers, the question data had to be classified by the type of information required. Because the user questions were complex and the subsequent data analysis was based on this classification, its accuracy was of paramount importance. Therefore, content analysis was used to code the information needs represented in the questions.
Following previous approaches, this study used a classification framework based on four types of information needs: “knowledge”, “efficiency”, “risk”, and “hedonic”, each of which is explained in Table 1. We followed the standard content analysis procedure described by Krippendorff [32] and the directed content analysis proposed by Hseieh & Shannon [33]. Using the framework shown in Table 1, the data were independently tagged and sorted by two coders. This identified the information requirement in each question and ensured the coding was consistent and reliable. Figure 1 illustrates the coding process. First, 300 questions from the 3752-question dataset were randomly selected and independently coded, and the results were compared. Where results differed, the two coders discussed their interpretations and assigned a single category to the question. Question data that were unclear or reflected a variety of travel information needs were eliminated. After completing one round of coding, the above steps were repeated until each category of tourism information need had accumulated sufficient data. The numbers of questions related to the four needs of knowledge, efficiency, risk, and hedonism were 559, 484, 173, and 98, respectively.
During the process of coding, it was clear that questions representing different needs for information were also connected to particular aspects of tourism, such as transportation, scenic spots, accommodation, etc. Drawing on earlier research, we subdivided the information needs into additional elements of tourism, as shown in Table 2. The number of questions for each element in terms of the various types of information needs is shown in Table 3.

4.3. Answer Quality Evaluation Criteria Framework

The study drew on criteria proposed in earlier studies for evaluating answers on social Q&A platforms. These were combined with the characteristics of tourism Q&A topics to produce the framework in Table 4. The framework includes 14 criteria covering the answer content and the answerer.

4.4. Criteria Extraction

It was then necessary to extract the value of each answer in the dataset under the criteria listed in Table 4. To accomplish this, we utilized previous approaches to quantifying the data linked to each criterion (Table 5).

4.4.1. Criteria for Measuring Answer Content Dimensions

  • Emotion. The emotionality of the answer was measured by the number of emotional words that appeared in it, as well as positive and negative emotional language such as “happy,” “regret,” etc. The ratio of emotional words to the total number of words per answer was calculated.
  • Richness. Answers may contain relevant pictures to enrich the content. The richness of each answer was measured by counting the number of images that accompanied the written content.
  • Conciseness. The conciseness of the answer was measured by calculating the ratio of words with four or more letters to the total number of words, the ratio of words with six letters or more letters to total words, and the average number of words per sentence. Generally speaking, the shorter the word length and the smaller the average number of words per sentence, the more concise the content is.
  • Usefulness. The usefulness of each answer was measured by counting the number of upvotes it received. A larger number of upvotes signifies greater recognition from users and reflects the answer’s usefulness.
  • Believability. The credibility of the answer was measured by calculating the ratio of words expressing certainty, such as “certain,” “must,” etc., to the total number of words in the answer content.
  • Readability. Readability was measured by the number of conjunctions per answer, the ratio of words of four or more letters to the total word count, and the ratio of words with at least six letters to the total words used in the response. Generally speaking, using more conjunctions and shorter word lengths increases readability.
  • Amount of information. This was measured by counting the total number of words, the number of URLs, and the proportion of punctuation marks in each answer. Generally speaking, longer answers with more resource links and less punctuation indicate larger amounts of information.
  • Politeness. The answer’s politeness was measured by calculating the ratio of swear words to the total number of words in each answer.
  • Experiential reference. The experiential reference of the answer was measured by the number of first-person singular pronouns in the content. Uses of “I” are connected to the writer’s own experiences, events, indicating the content’s authenticity. It was specifically quantified by measuring the ratio of the number of first-person singular pronouns to the total number of words in each response.
  • Entertainment. The entertainment content of the answer was measured by counting the number of words referring to leisure that appeared in the content, such as “rest,” “relax,” and so on. The ratio of these “leisure” words to the total number of words in the answer content was then calculated.
TextMind [48] was used to sort the linguistic data according to the above categorizations. TextMind can sort and segment Chinese text according to pre-defined terms to calculate the proportions of the text related to different language features.

4.4.2. Criteria for Measuring the Answerer Dimension

The criteria for measuring the answerer dimension included the number of the answerer’s followers, the accounts followed by each answerer, the number of questions asked, and the responses provided. All of these were quantified by collecting data directly on the answerer’s homepage through a crawler program.

4.5. Data Analysis

On Ctrip Q&A, questions are deemed to be resolved when an answer is accepted by the questioner, indicating they are most satisfied with this response and providing a basis on which to evaluate the answer’s quality [39]. Alternatively, the platform recommends the highest-quality answer. In this study, the answer accepted by the questioner or recommended by the platform was assigned a value of 1 (a high-quality answer). All other responses were assigned a zero value. A binary logistic regression analysis was conducted in which the dependent variable was answer quality, and the 19 criteria were the independent variables. We tested the independent variables for multicollinearity, recording values of >0.1 for all factors and variance inflation factors of <10, supporting the independence of each construct in the regression model.
According to the classification of the needs to which the question belongs, the answer data were divided into sub-datasets under the four types of information needs. Binary logistic regression analysis was used for each sub-dataset to obtain the factors that affect the quality of answers under each type of information need so that the similarities and differences of the characteristics that significantly affect the quality of answers for questions about the different types of tourism information needs could be obtained through comparison. Then, according to the division of tourism elements to which the question belongs under each tourism information need, the answer to the question was divided into answer sub-datasets reflecting the different elements. An ANOVA was conducted to analyze how each feature of the high-quality answers varied according to the different elements referred to in the questions. As the data did not conform to a normal distribution, a log transformation was performed before carrying out the ANOVA.

5. Results

5.1. Characteristics of High-Quality Answers to Questions about Tourism

Table 6 shows the criteria that significantly affected the quality of answers to questions about tourism, as well as the fitting indicators of the model constructed using the features proposed in Table 5. The p-value for the Omnibus Tests of Model Coefficients was <0.05, which indicates that the fitted model was generally meaningful.
The regression coefficients displayed in Table 6 indicate that only negative emotional words had a significant negative impact on the quality of the answer. The remaining features had a positive effect on the quality of answers. In the “answerer” dimension, only the number of questions answered predicted answer quality, indicating that the answerer’s experience is likely to improve the quality of responses they give, to a certain extent. The content features of richness, conciseness, readability, usefulness, and amount of information had significant positive impacts on the quality of the answer. For answer readability, the value of the number of connective features was the highest among all the significant factors, indicating that the use of connectives had the strongest effect on the quality of answers to questions about tourism, followed by the proportion of punctuation marks, and the number of URLs in the criterion of the amount of information.

5.2. Characteristics of High-Quality Answers under Different Tourism Information Needs

Table 7 shows the features that impacted the quality of answers for each category of tourism information needs referenced in the questions. Table 8, Table 9, Table 10 and Table 11 demonstrate that there were significant differences between the elements of tourism referenced in high-quality answers.
Table 7 shows that the number of answers given previously by the answerer significantly influenced the quality of the answers to questions for all categories of tourism information needs. Table 9 and Table 10 display significant differences in the answerer features of high-quality answers in terms of the different elements of tourism referred to in answers to questions about efficiency and risk. For questions about efficiency, the number of questions answered by the answerer was a more significant predictor of high-quality answers to travel strategy and transportation questions than of high-quality answers to questions about accommodation or scenic spots, demonstrating the greater importance of answerer experience in these areas to the quality of their responses. For risk-oriented questions, the number of the answerer’s previous responses was a more powerful predictor of high-quality answers to time-based questions than of high-quality answers to financial or scenic questions. In addition, it can be seen from Table 7 that the greater the number of users followed by the answerer, the more high-quality answers they provided to knowledge-based questions; this did not, however, have a significant impact on answers to questions about other types of information needs.
In terms of answer content criteria, Table 7 demonstrates that seven features attached to six criteria significantly affected the quality of answers. The six criteria were richness, conciseness/readability, usefulness, readability, and amount of information. The following describes how these six criteria contributed to producing high-quality answers to the information needs expressed in the questions.
  • First, the richness of answers—measured by the number of pictures provided—was significantly and positively related to the quality of answers to efficiency and hedonic questions. At the same time, high-quality answers to questions about scenic spots contained significantly higher numbers of pictures than the two other knowledge-based types of questions.
  • Second, the average number of words per sentence in answers predicted the quality of answers to questions concerned with knowledge, risk, as well as hedonic questions. In other words, the longer the average number of words per sentence in an answer to these three question types, the more likely it was to be selected as a high-quality answer. However, the same relationship was not found for efficiency-based questions. In addition, for knowledge-oriented questions, the average number of words per sentence of high-quality answers to traffic-related queries was significantly higher than that of high-quality responses to questions about scenic spots.
  • Third, the number of upvotes for answers—i.e., their usefulness—impacted the quality of answers to all questions, as categorized by information need. This was particularly true for answers to questions about attractions when upvotes significantly predicted more high-quality answers to knowledge-type questions than to questions about the other two types of elements. This indicates that the higher the number of upvotes the answer to a question about scenic spots received, the more likely it was to be selected as a high-quality answer.
  • Fourth, the number of connectives (used to measure the answer’s readability) had a significant positive effect on the quality of answers to efficiency and risk questions. In addition, higher numbers of connectives predicted high-quality answers to visa-related knowledge questions more strongly than high-quality responses to questions about traffic or scenic spots.
  • Fifth, the total word count—representing the amount of information in each answer—had a significant influence on the quality of answers to all question types. Total word count was a stronger predictor of high-quality answers to efficiency-linked questions about travel strategy than of the quality of responses to traffic questions. In addition, the proportion of punctuation marks in answers carried a significant and positive effect on the quality of answers to knowledge-based questions—but not the other question types. However, the proportion of punctuation marks was a more powerful predictor of high-quality answers to efficiency-linked questions about tourism strategy than it was for questions about transportation or accommodation. Finally, the number of URLs, a measure of the amount of information in an answer, only significantly predicted the quality of answers to efficiency questions.
Some other characteristics did not strongly influence the quality of answers to questions in terms of information type but had relationships of varying strength to particular elements expressed in the questions.
  • First, the importance of the proportion of leisure words (i.e., entertainment), as a predictor of high-quality answers varied among the different elements of knowledge-, efficiency-, and risk-based questions. The proportion of leisure words included in high-quality answers to knowledge-based questions about scenic spots was significantly higher than that of the other two types of elements. Next, the ratios of leisure words to total words in high-quality answers to questions about scenic spots, travel strategies, and accommodation for efficiency-oriented questions were significantly higher than for traffic questions. Last, the proportion of leisure words included in high-quality answers to risk-based questions about scenery was significantly higher than for safety, climate, or time questions.
  • Furthermore, there were also significant differences in the emotional aspects of high-quality answers to hedonic and risk-oriented questions about the different elements of tourism. In risk-oriented questions, the proportion of emotional words included in high-quality answers to security and climate questions was significantly higher than for financial or time categories and the proportion of positive emotional words contained in high-quality responses to safety questions was significantly higher than for questions related to finance, climate, or time. In high-quality answers to hedonic questions, the ratios of both positive and negative emotional words to total words were significantly higher about scenery than in answers to questions related to gourmet food.
  • Finally, in terms of the proportion of words expressing certainty (i.e., the answer’s credibility) there were significant differences between the answers to the elements of questions oriented to risk and the elements of hedonic questions. The proportion of words expressing certainty in high-quality answers to risk-type questions was significantly higher than for climate or time-related questions. Conversely, the proportion of words expressing certainty included in high-quality answers to hedonic questions about scenery was significantly higher than for gourmet questions of the hedonic type.

6. Discussion

6.1. Insights Based on Findings

This study has analyzed the characteristics of high-quality answers on Chinese tourism Q&A platforms. After reviewing similar research into both general and tourism Q&A platforms, we developed an evaluative framework to determine the quality of answers on tourism Q&A platforms. This included a total of 14 indicators in the two dimensions of answerer and answer content. Binary logistic regression was then used to determine the influence of each indicator on the quality of answers. The results showed that the number of questions answered by the answerer, the richness of the answer content, and the amount of information were all positively correlated with answer quality. At the same time, the characteristics of high-quality answers in terms of answerers and answer content varied according to the information needs expressed in the questions. The discussion considers how these findings converge with and differ from those of studies of general Q&A platforms, and how the needs reflected in questions on tourism Q&A platforms influence the quality of the answers.
First, the factors influencing answer quality on the tourist Q&A platform were similar to those of general Q&A platforms. In terms of the answerer dimension, the more questions an answerer had provided, the higher the quality of their answers. This corroborated the results of Chu’s research on Yahoo! Answers [27] that the answerer’s professionalism and experience were positively associated with higher-quality answers, confirming that the richness of the answerer’s experience has an important impact on the quality of answers on general and tourist Q&A platforms alike. In terms of content indicators, research has found that the emotionality, usefulness, and the information volume of travel answers have a major impact on their quality. Fu’s research on Stack Exchange [29] claimed that the total number of words in the answer, the number of conjunctions included, etc., had a significant impact on the quality of the answer. The present study supported these findings, showing that readability and volume of information were also important requirements for quality in answers on tourist Q&A platforms. In addition, it was found that resources such as URLs and relevant explanatory pictures also affected the quality of the answer. Li et al.’s study of answer quality on the Q&A section ResearchGate [28] reported that the relevance of resources was significantly related to answer quality. Academic Q&A platforms are highly professional and feature more targeted questions, making the questioners’ needs for related resources particularly strong. Similarly, the users of specialized and professional tourist Q&A platforms demand relevant resources from other contributors. Relevant resources in travel answers, such as URL links and related pictures, can improve answer quality to a certain extent.
Furthermore, the present study found that for the quality of tourism answers, a higher number of negative emotional words included in an answer negatively impacted its quality. Existing research on the quality of answers to health questions shows that positive emotional support in answers is the most important criterion for evaluating their quality [49]. Similarly, the present study demonstrated that emotionality was a key factor in the quality of answers to tourism questions. It also confirms findings from previous research into general Q&A platforms or those from other professional fields concerning the positive impact of the number of upvotes answers receive, the average number of words per sentence, and the proportion of punctuation marks on the quality of answers [42,44,50]. To sum up, the dimensions that significantly affect the quality of answers to questions about tourism are broadly similar to those of general and various field-specific Q&A platforms.
The second major finding was that, even when the more abstract information needs of questions differed, the characteristics of high-quality answers often had certain similarities that corresponded to similarities in the practical elements referred to in questions. For example, visa and travel strategy questions are more information-intensive, and high-quality answers are often more informative—facts reflected in the total number of words in the answers and the average number of words in the sentence. This is also related to the higher requirements of the question itself for relevant, comprehensive knowledge and complex information. Similarly, high-quality answers to scenic questions tend to refer to entertainment and the answers tend to contain more leisure words and pictures. Thus, although the abstract tourism information requirements referenced in the questions are different, the high-quality answers shared characteristics because they cover the same concrete topic—in this case, scenic spots. Overall, although the characteristics of high-quality answers varied according to the tourist information need that the question expressed, the characteristics of high-quality answers on the same topic shared some similarities.

6.2. Theoretical Implications

The theoretical significance of this research is mainly in terms of the following two aspects: First, this research has constructed a framework for evaluating the quality of answers on tourism Q&A platforms. Through a summary survey of existing related research, we pointed out that the usefulness, richness, and amount of information in the content of answers to questions about tourism are of great significance to the evaluation of answer quality. At the same time, combined with the characteristics of tourism Q&A platforms, we also specifically proposed that the richness and entertainment content of the answer also need to be used as evaluation indicators. Then, the evaluation framework constructed for assessing answer quality on tourism Q&A platforms was verified, and the factors affecting answer quality on tourism Q&A platforms were obtained. This study can enrich the research on the evaluation of answer quality on domain-based Q&A platforms and provide a theoretical basis for the construction of an answer quality evaluation framework for tourism Q&A platforms. In addition, this study also innovatively introduces the tourism information needs contained in the question into the answer quality evaluation and proposes that the answer quality should be evaluated separately due to the different needs reflected in the question. After categorizing the types of tourism information needs referenced in the questions, this study also confirmed the differences in the characteristics of high-quality answers under questions about different types of tourism information needs, which introduces new ideas and directions for answer quality evaluation.

6.3. Practical Implications

Today, travel Q&A platforms have become one of the important channels for travelers to collect travel information. At the same time, many travel Q&A platforms are constantly exploring new ways to improve their quality of service. By analyzing and comparing the characteristics of high-quality answers on tourism Q&A platforms, this study can provide users and operators of tourism Q&A platforms with new inspiration from the perspective of providing high-quality information services to improve user efficiency in their platform usage and the popularity and influence of the platform.
First, in terms of platform users, they can be divided into two categories: the questioner and the answerer. Regarding the questioner, they can choose high-quality answers based on the content of the answers, combined with the travel information needs they referred to in their question and the characteristics of high-quality answers corresponding with their needs. After the questioner understands the characteristics of high-quality answers under the corresponding tourism information needs, they can evaluate and analyze the quality of the answers from multiple angles, and then select high-quality answers more accurately to meet their own information needs to the greatest extent possible. At the same time, high-quality answers can be selected for users with the same question. For the answerer, in the process of answering the question, they can analyze the relevant tourism information needs based on the title of the question, its content, etc., and clarify the tourism information needs implied in the question. Answerers can organize and optimize answer content according to the characteristics of high-quality answers under relevant tourism information needs, improve the performance of answer content in terms of the relevant characteristics, and improve the quality of their answers.
Second, platform operators can consider optimizing the platform construction mechanism from the two perspectives of high-quality answer recommendation and answer content organization. When recommending high-quality answers, the platform can select and recommend high-quality answers for users in a targeted manner based on the characteristics of high-quality answers to questions about different types of travel information needs. This can, to a certain extent, help platform operators optimize the relevant mechanism for the platform to choose and recommend the best answer, and more accurately push high-quality answers to users. In addition, in terms of answer content organization, the quality of newly released answers can be judged, and relevant measures can be taken to avoid the occurrence of high-quality answers being ignored due to the recency of their release time, and it can also prevent low-quality questions from occupying a favorable position on the site, and then promote the dissemination of high-quality information on the Q&A platform. To sum up, by identifying and recommending high-quality content, on the one hand, the platforms can increase user satisfaction and increase user stickiness; on the other hand, this can also increase the platform’s visibility and authority in the field of travel Q&A, and ultimately realize the purpose of promoting the sustainable development of the platform.

6.4. Limitations

This study has certain limitations and can also provide a reference for future research directions. First, in the process of identifying and categorizing the types of tourism information needs referred to in the question content on the tourism Q&A platforms, this study only selected questions with clear and single tourism information needs as the research object, and any question data related to multiple tourism information needs were eliminated. This makes the dataset of this study relatively simplistic and limits the richness of the data analysis results. The research results can only explain the characteristics of high-quality answers to questions under a single travel information need and cannot further analyze the characteristics of high-quality answers to questions under multiple types of tourism information needs. In reality, the content of questions is often rich and complex. There are many questions that belong to multiple different information needs at the same time. In the future, questions can be classified under multiple types of information needs, and multi-category methods can be used to analyze the characteristics of high-quality answers under multiple tourism information needs.
Second, this study uses whether the answer is adopted by the questioner or recommended by the platform as the standard to distinguish between high- and low-quality answers. Accordingly, the accepted or recommended answers are considered high-quality answers, and the rest are considered low-quality answers. Although this classification method avoids the subjective factors of manual evaluation, it also expands the emphasis on the validity and accuracy of the questioner and the platform selection, and cannot effectively avoid the situation where the questioner and the platform make mistakes of judgment, which will also ignore some high-quality answers. This overly absolute way of judging the quality of the answer also has a certain impact on the size of the subsequent dataset, which limits the corresponding data analysis results. The existing research mainly uses methods such as the questioner’s adoption of answers, platform recommendations, the number of upvotes received by the answer, or manual scoring to judge answer quality. In future research, methods for judging answer quality may try to use a combination of multiple evaluation methods.

7. Conclusions

This study first constructed an answer quality evaluation framework with 14 indicators from the answerer and answer content dimensions and analyzed the impact of each indicator on answer quality using the binary logistic regression method. The results show that the emotionality, richness, and usefulness of the answer and the number of questions answered by the answerer have a significant positive impact on the quality of the answer. Furthermore, based on the tourism information needs of the question as the dividing standard, the characteristics of high-quality answers under different questions regarding tourism information needs were analyzed, and it was found that high-quality answers to questions that fall under different categories of tourism information needs are consistent in many characteristics, such as the usefulness of the answers, the amount of information, and the number of questions answered by the answerer. At the same time, there are also certain differences. For example, the proportion of punctuation in answer content seems to be a more significant predictor of high-quality answers to questions about knowledge-based needs, and the number of URLs is a more significant predictor of high-quality answers to questions about efficiency needs. Finally, according to the various types of tourism information needs, the characteristics of high-quality answers to questions about the different elements of tourism are analyzed, and the high-quality answers to questions about the different elements of tourism are compared in terms of which indicators are significantly different to further understand the characteristics of high-quality answers to questions about different elements of tourism. Although this study analyzes the characteristics of high-quality answers to questions about tourism from multiple angles, it also has certain limitations. In future research, we will further optimize the framework for evaluating the quality of answers to questions about tourism, integrate multiple ways to identify high-quality answers, and consider answer quality evaluation issues for questions referencing multiple needs.

Author Contributions

Conceptualization, L.L., X.S. and K.H.; methodology, L.L. and X.S.; software, X.S. and S.L.; validation, L.L., X.S. and S.L.; formal analysis, X.S. and S.L.; investigation, L.L. and X.S.; resources, L.L.; data curation, X.S. and S.L.; writing—original draft preparation, L.L. and X.S.; writing—review and editing, L.L. and K.H.; visualization, L.L.; supervision, L.L. and K.H.; project administration, L.L.; funding acquisition, L.L. All authors have read and agreed to the published version of the manuscript.

Funding

This research was funded by the Fundamental Research Funds for the Central Universities in China (No. 2019NTSS38).

Institutional Review Board Statement

Not applicable.

Informed Consent Statement

Not applicable.

Data Availability Statement

Data will be available on request.

Conflicts of Interest

The authors declare no conflict of interest.

References

  1. BAIJIAHAO. Available online: https://baijiahao.baidu.com/s?id=1659856949727439142&wfr=spider&for=pc (accessed on 1 November 2021).
  2. Park, D.-H.; Lee, S. UGC Sharing Motives and Their Effects on UGC Sharing Intention from Quantitative and Qualitative Perspectives: Focusing on Content Creators in South Korea. Sustainability 2021, 13, 9644. [Google Scholar] [CrossRef]
  3. Zhao, L.; Detlor, B.; Connelly, C.E. Sharing Knowledge in Social Q&A Sites: The Unintended Consequences of Extrinsic Motivation. J. Manag. Inf. Syst. 2016, 33, 70–100. [Google Scholar] [CrossRef]
  4. Jin, J.; Li, Y.; Zhong, X.; Zhai, L. Why Users Contribute Knowledge to Online Communities: An Empirical Study of an Online Social Q&A Community. Inf. Manag. 2015, 52, 840–849. [Google Scholar] [CrossRef]
  5. Jin, X.-L.; Zhou, Z.; Lee, M.K.O.; Cheung, C.M.K. Why Users Keep Answering Questions in Online Question Answering Communities: A Theoretical and Empirical Investigation. Int. J. Inf. Manag. 2013, 33, 93–104. [Google Scholar] [CrossRef]
  6. Gretzel, U.; Yoo, K.H.; Purifoy, M. Online Travel Review Study: Role and Impact of Online Travel Reviews; Texas A & M University: College Station, TX, USA, 2007. [Google Scholar]
  7. Gazan, R. Social Q&A. J. Am. Soc. Inf. Sci. Technol. 2011, 62, 2301–2312. [Google Scholar] [CrossRef]
  8. Prasetyo, Y.T.; Ong, A.K.S.; Concepcion, G.K.F.; Navata, F.M.B.; Robles, R.A.V.; Tomagos, I.J.T.; Young, M.N.; Diaz, J.F.T.; Nadlifatin, R.; Redi, A.A.N.P. Determining Factors Affecting Acceptance of E-Learning Platforms during the COVID-19 Pandemic: Integrating Extended Technology Acceptance Model and DeLone & McLean IS Success Model. Sustainability 2021, 13, 8365. [Google Scholar] [CrossRef]
  9. Chen, Y.-L.; Chang, C.-L.; Sung, A.-Q. Predicting EWOM’s Influence on Purchase Intention Based on Helpfulness, Credibility, Information Quality and Professionalism. Sustainability 2021, 13, 7486. [Google Scholar] [CrossRef]
  10. Casaló, L.V.; Flavián, C.; Guinalíu, M. Determinants of the Intention to Participate in Firm-Hosted Online Travel Communities and Effects on Consumer Behavioral Intentions. Tour. Manag. 2010, 31, 898–911. [Google Scholar] [CrossRef]
  11. Ayeh, J.K.; Au, N.; Law, R. “Do We Believe in TripAdvisor?” Examining Credibility Perceptions and Online Travelers’ Attitude toward Using User-Generated Content. J. Travel Res. 2013, 52, 437–452. [Google Scholar] [CrossRef]
  12. Arsal, I.; Woosnam, K.M.; Baldwin, E.D.; Backman, S.J. Residents as Travel Destination Information Providers: An Online Community Perspective. J. Travel Res. 2010, 49, 400–413. [Google Scholar] [CrossRef]
  13. Savolainen, R. Providing Informational Support in an Online Discussion Group and a Q & A Site: The Case of Travel Planning. J. Assoc. Inf. Sci. Technol. 2015, 66, 450–461. [Google Scholar] [CrossRef] [Green Version]
  14. Liu, X.; Mehraliyev, F.; Liu, C.; Schuckert, M. The Roles of Social Media in Tourists’ Choices of Travel Components. Tour. Stud. 2020, 20, 27–48. [Google Scholar] [CrossRef]
  15. Choi, E.; Shah, C. User Motivations for Asking Questions in Online Q & A Services. J. Assoc. Inf. Sci. Technol. 2016, 67, 1182–1197. [Google Scholar] [CrossRef]
  16. Grotenhuis, J.-W.; Wiegmans, B.W.; Rietveld, P. The Desired Quality of Integrated Multimodal Travel Information in Public Transport: Customer Needs for Time and Effort Savings. Transp. Policy 2007, 14, 27–38. [Google Scholar] [CrossRef]
  17. Nwagwu, W.; Kolapo, A. Information Needs, Information Sources and Information Search Strategies of International Air Travellers in Nigeria. Pearl A J. Libr. Inf. Sci. 2012, 6, 216–234. [Google Scholar] [CrossRef]
  18. Gal-Tzur, A.; Bar-Lev, S.; Shiftan, Y. Using Question & Answer Forums as a Platform for Improving Transport-Related Information for Tourists. J. Travel Res. 2020, 59, 1221–1237. [Google Scholar] [CrossRef]
  19. Ballantyne, R.; Hughes, K.; Ritchie, B.W. Meeting the Needs of Tourists: The Role and Function of Australian Visitor Information Centers. J. Travel Tour. Mark. 2009, 26, 778–794. [Google Scholar] [CrossRef]
  20. Wong, C.K.S.; Liu, F.C.G. A Study of Pre-Trip Use of Travel Guidebooks by Leisure Travelers. Tour. Manag. 2011, 32, 616–628. [Google Scholar] [CrossRef]
  21. Hwang, Y.-H.; Jani, D.; Jeong, H.K. Analyzing International Tourists’ Functional Information Needs: A Comparative Analysis of Inquiries in an on-Line Travel Forum. J. Bus. Res. 2013, 66, 700–705. [Google Scholar] [CrossRef]
  22. Chen, M.; Ohta, T. Using Blog Content Depth and Breadth to Access and Classify Blogs. Int. J. Bus. Inf. 2010, 5, 26. [Google Scholar]
  23. Savolainen, R. Judging the Quality and Credibility of Information in Internet Discussion Forums. J. Am. Soc. Inf. Sci. Technol. 2011, 62, 1243–1256. [Google Scholar] [CrossRef] [Green Version]
  24. Stvilia, B.; Twidale, M.B.; Gasser, L.; Smith, L.C. Information Quality Discussions in Wikipedia. In Proceedings of the 2005 International Conference on Knowledge Management, Bremen, Germany, 31 October–5 November 2005; pp. 101–113. [Google Scholar]
  25. Chua, A.Y.K.; Banerjee, S. Helpfulness of User-Generated Reviews as a Function of Review Sentiment, Product Type and Information Quality. Comput. Human Behav. 2016, 54, 547–554. [Google Scholar] [CrossRef]
  26. Pérez-Nicolás, R.L.; Alario-Hoyos, C.; Estévez-Ayres, I.; Moreno-Marcos, P.M.; Muñoz-Merino, P.J.; Delgado Kloos, C. Evaluation of an Algorithm for Automatic Grading of Forum Messages in MOOC Discussion Forums. Sustainability 2021, 13, 9364. [Google Scholar] [CrossRef]
  27. Chu, S.K.W.; Huang, H.; Wong, W.N.M.; Van Ginneken, W.F.; Wu, K.M.; Hung, M.Y. Quality and Clarity of Health Information on Q&A Sites. Libr. Inf. Sci. Res. 2018, 40, 237–244. [Google Scholar] [CrossRef]
  28. Li, L.; He, D.; Jeng, W.; Goodwin, S.; Zhang, C. Answer Quality Characteristics and Prediction on an Academic Q&A Site: A Case Study on ResearchGate. In Proceedings of the 24th International Conference on World Wide Web, Florence, Italy, 18–22 May 2015; pp. 1453–1458. [Google Scholar]
  29. Fu, H.; Oh, S. Quality Assessment of Answers with User-Identified Criteria and Data-Driven Features in Social Q&A. Inf. Process. Manag. 2019, 56, 14–28. [Google Scholar] [CrossRef]
  30. Bastida, U.; Huan, T.C. Performance Evaluation of Tourism Websites’ Information Quality of Four Global Destination Brands: Beijing, Hong Kong, Shanghai, and Taipei. J. Bus. Res. 2014, 67, 167–170. [Google Scholar] [CrossRef]
  31. Kim, S.-E.; Lee, K.Y.; Shin, S.I.; Yang, S.-B. Effects of Tourism Information Quality in Social Media on Destination Image Formation: The Case of Sina Weibo. Inf. Manag. 2017, 54, 687–702. [Google Scholar] [CrossRef]
  32. Krippendorff, K. Content Analysis: An Introduction to Its Methodology; Sage Publications: Thousand Oaks, CA, USA, 2018; ISBN 1506395678. [Google Scholar]
  33. Hsieh, H.-F.; Shannon, S.E. Three Approaches to Qualitative Content Analysis. Qual. Health Res. 2005, 15, 1277–1288. [Google Scholar] [CrossRef] [PubMed]
  34. Card, J.A.; Chen, C.-Y.; Cole, S.T. Online Travel Products Shopping: Differences between Shoppers and Nonshoppers. J. Travel Res. 2003, 42, 133–139. [Google Scholar] [CrossRef]
  35. Xiang, Z.; Pan, B. Travel Queries on Cities in the United States: Implications for Search Engine Marketing for Tourist Destinations. Tour. Manag. 2011, 32, 88–97. [Google Scholar] [CrossRef]
  36. Oh, S.; Worrall, A. Health Answer Quality Evaluation by Librarians, Nurses, and Users in Social Q&A. Libr. Inf. Sci. Res. 2013, 35, 288–298. [Google Scholar] [CrossRef]
  37. Li, L.; Wang, A.; Huang, K. Exploring the Criteria for Self-Guided Tourists to Evaluate Satisfaction with Online Travel Information. Proc. Assoc. Inf. Sci. Technol. 2020, 57, e346. [Google Scholar] [CrossRef]
  38. Wang, R.Y.; Strong, D.M. Beyond Accuracy: What Data Quality Means to Data Consumers. J. Manag. Inf. Syst. 1996, 12, 5–33. [Google Scholar] [CrossRef]
  39. Shah, C.; Pomerantz, J. Evaluating and Predicting Answer Quality in Community QA. In Proceedings of the 33rd International ACM SIGIR Conference on Research and Development in Information Retrieval, Geneva, Switzerland, 19–23 July 2010; pp. 411–418. [Google Scholar]
  40. Tausczik, Y.R.; Pennebaker, J.W. The Psychological Meaning of Words: LIWC and Computerized Text Analysis Methods. J. Lang. Soc. Psychol. 2010, 29, 24–54. [Google Scholar] [CrossRef]
  41. Deng, S.; Tong, J.; Lin, Y.; Li, H.; Liu, Y. Motivating Scholars’ Responses in Academic Social Networking Sites: An Empirical Study on ResearchGate Q&A Behavior. Inf. Process. Manag. 2019, 56, 102082. [Google Scholar] [CrossRef]
  42. Fu, H.; Wu, S.; Oh, S. Evaluating Answer Quality across Knowledge Domains: Using Textual and Non-textual Features in Social Q&A. Proc. Assoc. Inf. Sci. Technol. 2015, 52, 1–5. [Google Scholar] [CrossRef]
  43. Shah, C.; Kitzie, V.; Choi, E. Questioning the Question–Addressing the Answerability of Questions in Community Question-Answering. In Proceedings of the 2014 IEEE 47th Hawaii International Conference on System Sciences, Waikoloa, HI, USA, 6–9 January 2014; pp. 1386–1395. [Google Scholar]
  44. Agichtein, E.; Castillo, C.; Donato, D.; Gionis, A.; Mishne, G. Finding High-Quality Content in Social Media. In Proceedings of the 2008 International Conference on Web Search and Data Mining, Barcelona, Spain, 10–12 September 2008; pp. 183–194. [Google Scholar]
  45. Liu, Y.; Bian, J.; Agichtein, E. Predicting Information Seeker Satisfaction in Community Question Answering. In Proceedings of the 31st Annual International ACM SIGIR Conference on Research and Development in Information Retrieval, Online, 11–15 July 2021; Association for Computing Machinery: New York, NY, USA, 2008; pp. 483–490. [Google Scholar]
  46. Blooma, M.J.; Hoe-Lian Goh, D.; Yeow-Kuan Chua, A. Predictors of High-quality Answers. Online Inf. Rev. 2012, 36, 383–400. [Google Scholar] [CrossRef]
  47. Li, L.; He, D.; Zhang, C.; Geng, L.; Zhang, K. Characterizing Peer-Judged Answer Quality on Academic Q&A Sites. Aslib J. Inf. Manag. 2018, 70, 269–287. [Google Scholar] [CrossRef]
  48. Gao, R.; Hao, B.; Li, H.; Gao, Y.; Zhu, T. Developing Simplified Chinese Psychological Linguistic Analysis Dictionary for Microblog. In International Conference on Brain and Health Informatics; Springer: Berlin/Heidelberg, Germany, 2013; pp. 359–368. [Google Scholar]
  49. Worrall, A.; Oh, S.; Yi, Y.J. Quality Evaluation of Health Answers in Social Q&A: Socio-emotional Support and Evaluation Criteria. Proc. Am. Soc. Inf. Sci. Technol. 2012, 49, 1–5. [Google Scholar] [CrossRef]
  50. Liu, J.; Cao, Y.; Lin, C.-Y.; Huang, Y.; Zhou, M. Low-Quality Product Review Detection in Opinion Summarization. In Proceedings of the 2007 Joint Conference on Empirical Methods in Natural Language Processing and Computational Natural Language Learning (EMNLP-CoNLL), Prague, Czech Republic, 28–30 June 2007; pp. 334–342. [Google Scholar]
Figure 1. Coding processing.
Sustainability 13 13884 g001
Table 1. Tourist Information Need Classification Framework.
Tourism Information NeedsDefinitionJudgment StandardExamples of QuestionsReferences
KnowledgeAims to obtain specific knowledge about certain aspects of the journey, such as accommodation reservations and transportation routesUnderstand basic information about the destination“Can I ride my bicycle on Songshan Lake?”[19,20,21]
Understand basic information about accommodation, transportation, entertainment, etc.“How much is a ticket for the night show, and when are the Halloween admission and closing times”
Assist the questioner to make choices; the answers are often specific and unique“How long can I play with a full ticket in Happy Valley Beijing”
EfficiencyAims to obtain ideas or suggestions related to travel plans, such as plans for specific journeys or advisory information on transportation, accommodation, etc.Seek advice on itinerary planning and formulating travel plans“South Luogu Lane, Happy Valley, the Forbidden City, Tsinghua University—I will arrive at noon on the first day, how can I arrange it?”[16,20,21]
Seek help in the process of preparing food, clothing, accommodation, transportation, entertainment, and leisure during the journey“My family will go to Beijing for about four days—we mainly want to go to the Great Wall, the Forbidden City, the Old Summer Palace, Peking University, and Beijing Happy Valley”
Help the questioner improve the efficiency of the journey“Preparing to travel to Sanya in December—Wuzhizhou Island, Tianya Haijiao, Yalong Bay: which is the more convenient place to stay?”
RiskAims to reduce various risks that may occur during the journey, such as financial risks, security risks, etc.Is relevant to needs concerning finances, time, safety, physiology, psychology, and the value or meaning of the journey“I have already booked a flight ticket to Guangzhou. Due to the coronavirus, I am a little scared. Can I refund it now?”[16,18,21]
Contains obvious emotional tendencies“Excuse me, I only have one day in Beijing. Is it too late for the evening train to the Great Wall?”
Questioner aims to reduce the risk and/or losses associated with the journey“Is it necessary to go to Planet Garden? Is it worth it?”
HedonicAims to obtain various entertainment-related information such as destination attractions, food, and games to meet the traveler’s own entertainment needsQuestion is clearly directed at the relevant attractions, food, entertainment, etc. at the destination“What’s delicious in Guangzhou, please?”[20]
Question pays more attention to entertainment, viewing, and play experiences“Where is the best place to enjoy red autumnal leaves in Beijing?”
Seeks a hedonic experience during travel, to assist the questioner to make choices“If I go to Beijing to climb the Great Wall, which one is more fun, Badaling Great Wall or Mutianyu Great Wall?”
Table 2. Description of the types of elements of tourism.
Elements of TourismDescriptionReferences
TransportationRelated traffic information during the journey, including recommendations for transportation methods[34,35]
AttractionsDetailed introduction to relevant information about the attraction, such as location, tickets, and opening hours
AccommodationInformation related to accommodation, such as accommodation recommendations, prices, and types
FoodRecommendations and introductions to relevant cuisines at the tourist destinations
ClimateClimate information related to the tourist destinations, including advice on dressing and protection
Passing through customsIncluding the difficulties and solutions that may be encountered when going through customs
VisaAll information related to the visa, such as visa application, validity period, etc.
COVID-19Information on epidemic control policies at tourist destinations
Travel guidelinesA series of travel-related suggestions, which may include various types of travel information such as transportation, accommodation, attractions, and food
TimeRefers to time planning issues during the journey and relevant suggestions
SafetyRefers to personal safety issues during the journey and relevant suggestions
FinanceRefers to financial safety issues and preventive measures during the journey
ShoppingInformation on specialty items at tourist destinations, famous shopping locations, etc.
Table 3. Summary of question classification results.
Needs/ElementsKnowledgeRiskEfficiencyHedonic
Transportation10342--
Attractions54142258
Accommodation1023--
Food72-21
Climate23316-
Passing through customs31---
Visa161-8-
COVID-1928---
Travel guidelines-393--
Time--40-
Safety--26-
Finance--24-
Shopping---8
Others142103711
Total55948417398
Table 4. Framework for evaluating answer quality.
DimensionCriterionExplanationReferences
Answer ContentEmotionEmotional tendency displayed in the answer[29,36]
RichnessRichness of the answer content[27,29,31,36,37]
ConcisenessConciseness of the answer description[27,29,36,37]
UsefulnessNumber of upvotes for the answer[27,36,37]
BelievabilityThe exact degree of the answer’s credibility[28,36,37]
ReadabilityHow easy the answer is for others to read and understand[27,36]
Amount of informationThe amount of information contained in the answer[38]
PolitenessThe frequency of swear words in the answer[36,39]
Experiential referenceThe answer contains the answerer’s relevant personal experience[28,29,36,37]
EntertainmentReferences to entertainment and leisure in the answer content-
AnswererFollowersNumber of followers of the answerer[28,37]
FollowingNumber of users followed by the answerer
QuestionsThe number of questions asked by the answerer on the platform
AnswersThe number of answers provided by the answerer on the platform
Table 5. Computable features of answer quality evaluation criteria.
DimensionCriterionComputable FeaturesReferences
Answer ContentEmotionThe number of emotional words[40,41]
The number of positive emotional words
The number of negative emotional words
RichnessThe number of pictures in the content[42]
ConcisenessThe ratio of words of four or more letters to the total number of words[40,43]
The ratio of words of six or more letters to the total number of words
The average number of words per sentence
UsefulnessThe number of upvotes for the answer[44]
BelievabilityThe number of words expressing certainty[40]
ReadabilityThe number of conjunctions in the content[40]
The ratio of words of four or more letters to the total number of words
The ratio of words of six or more letters to the total number of words
The average number of words per sentence
Amount of InformationThe total number of words in the content[28,38]
The number of URLs in the content
Percentage of punctuation marks in the content
PolitenessThe number of swear words in the content[40]
Experiential referenceThe number of first-person singular pronouns contained in the content[40]
EntertainmentThe number of words referring to leisure in the content-
AnswererFollowersThe number of followers of the answerer on the platform[45,46,47]
FollowingNumber of users followed by the answerer on the platform
QuestionsThe number of questions asked by the answerer on the platform
AnswersThe number of answers provided by the answerer on the platform
Table 6. Features significantly associated with the quality of answers to tourism questions.
CriterionComputable FeaturesCoefficientp
EmotionThe number of negative emotional words−6.7510.030
RichnessThe number of pictures in the content0.1050.003
Conciseness\ReadabilityThe average number of words per sentence0.0080.000
UsefulnessThe number of upvotes for the answer0.0240.000
ReadabilityThe number of conjunctions in the content3.7730.000
Amount of InformationPercentage of punctuation marks in the content1.0010.036
The total number of words in the content0.0060.000
The number of URLs in the content0.9070.014
AnswererThe number of answers provided by the answerer on the platform0.0000.000
Model fitting indicatorsConstant =−2.533
Omnibus Tests of Model Coefficients: df = 8, Sig. = 0.000
−2Loglikehood = 5070.069
Cox & Snell R Square = 0.133
Nagelkerke R Square = 0.209
Table 7. Features that are significantly correlated with the quality of answers for each category of tourism information needs.
CriterionComputable FeaturesKnowledgeEfficiencyRiskHedonic
Coeff.pCoeff.pCoeff.pCoeff.p
RichnessThe number of pictures in the content--0.1450.002--0.2330.005
Conciseness\ReadabilityThe average number of words per sentence0.0130.000--0.0390.0000.0170.030
UsefulnessThe number of upvotes for the answer0.0280.0010.0220.0000.1090.0100.0300.049
ReadabilityThe number of conjunctions in the content 4.5420.0085.8510.022--
Amount of InformationPercentage of punctuation marks in the content2.3190.003------
The total number of words in the content0.0100.0000.0070.0000.0090.0000.0030.001
The number of URLs in the content--2.0050.019----
AnswererThe number of answers provided by the answerer on the platform0.0000.0000.0000.0090.0000.0000.0000.046
Number of users followed by the answerer on the platform0.0000.016------
Table 8. Variation in the characteristics of high-quality answers to the elements of knowledge-related tourism questions.
CriterionComputable FeaturesMean + Standard Deviationp
TrafficAttractionsVisa
EntertainmentThe number of words referring to leisure in the content0.019 ± 0.0220.048 ± 0.0470.010 ± 0.0170.000
Conciseness\ReadabilityThe average number of words per sentence30.019 ± 34.49918.207 ± 10.58625.569 ± 23.5680.020
UsefulnessThe number of upvotes for the answer4.011 ± 9.1036.700 ± 10.8611.471 ± 5.2940.000
ReadabilityThe number of conjunctions in the content0.035 ± 0.0280.033 ± 0.0260.052 ± 0.0350.000
RichnessThe number of pictures in the content0.116 ± 0.5620.320 ± 0.9570.051 ± 0.2220.017
Table 9. Variation in the characteristics of high-quality answers to the elements of efficiency-related tourism questions.
CriterionComputable FeaturesMean + Standard Deviationp
TrafficAttractionsTravel StrategyAccommodation
EntertainmentThe number of words referring to leisure in the content0.017 ± 0.0160.038 ± 0.0340.039 ± 0.0260.043 ± 0.0260.000
Amount of InformationPercentage of punctuation marks in the content0.166 ± 0.0610.167 ± 0.1090.187 ± 0.0600.153 ± 0.0510.011
The total number of words in the content115.500 ± 82.660156.308 ± 117.540201.942 ± 188.435135.682 ± 94.3640.000
AnswererThe number of followers of the answerer on the platform274.575 ± 253.979202.231 ± 259.124452.319 ± 1097.024201.727 ± 522.1870.005
The number of answers provided by the answerer on the platform10,270.800 ±
14,275.841
6364.615 ±
14,151.143
8533.086 ±
11,790.326
2543.727 ±
4056.241
0.002
Table 10. Variation in the characteristics of high-quality answers to the elements of risk-related tourism questions.
CriterionComputable FeaturesMean + Standard Deviationp
SecurityFinanceAttractionsClimateTime
EntertainmentThe number of words referring to leisure in the content0.019 ± 0.0190.029 ± 0.0310.046 ± 0.0280.021 ± 0.0250.023 ± 0.0280.008
EmotionThe number of emotional words0.057 ± 0.0500.019 ± 0.0240.038 ± 0.0320.051 ± 0.0420.018 ± 0.0200.000
The number of positive emotional words0.047 ± 0.0490.015 ± 0.0150.031 ± 0.0320.024 ± 0.0200.012 ± 0.0150.000
BelievabilityThe number of words expressing certainty0.005 ± 0.0090.008 ± 0.0120.011 ± 0.0120.002 ± 0.0040.004 ± 0.0080.028
AnswererThe number of answers provided by the answerer on the platform12,661.476 ± 19,762.4135649.647 ± 11,231.4566911.409 ± 14,116.6918106.375 ± 13,444.84316,155.462 ± 19,225.6660.040
Table 11. Variation in the characteristics of high-quality answers to the elements of hedonic-related tourism questions.
CriterionComputable FeaturesMean + Standard Deviationp
AttractionsGourmet
EmotionThe number of emotional words0.036 ± 0.0290.017 ± 0.0190.005
The number of positive emotional words0.030 ± 0.0280.015 ± 0.0180.021
The number of negative emotional words0.003 ± 0.0070.001 ± 0.0020.018
BelievabilityThe number of words expressing certainty0.014 ± 0.0260.005 ± 0.0080.017
Publisher’s Note: MDPI stays neutral with regard to jurisdictional claims in published maps and institutional affiliations.

