Article

A Sensitivity Analysis for Thermal Performance of Building Envelope Design Parameters

1
Department of Architecture, Faculty of Engineering, Minia University, Minia 61111, Egypt
2
Szentágothai Research Centre, Energia Design Building Technology Research Group, Ifjúság útja 20, H-7624 Pecs, Hungary
3
Faculty of Engineering and Information Technology, Marcel Breuer Doctoral School, University of Pécs, Boszorkány ut 2, H-7624 Pecs, Hungary
4
Structural Diagnostics and Analysis Research Group, Faculty of Engineering and Information Technology, University of Pécs, Boszorkány ut 2, H-7624 Pecs, Hungary
*
Author to whom correspondence should be addressed.
Sustainability 2021, 13(24), 14018; https://doi.org/10.3390/su132414018
Submission received: 14 November 2021 / Revised: 10 December 2021 / Accepted: 16 December 2021 / Published: 19 December 2021
(This article belongs to the Special Issue Thermal Behavior and Energy Efficiency of Buildings)

Abstract

:
Sensitivity analysis is crucial in building energy assessments. It is used to determine the major variables influencing building thermal performance, using both observational research and energy simulation models. This study investigates the most influential envelope design parameters on the thermal performance of a typical residential building in Budapest, Hungary. Sensitivity analysis is used in conjunction with the IDA-Indoor and Climate Energy (IDA-ICE 4.8) simulation tool to assess the effects of 33 envelope design parameters for energy consumption and carbon dioxide concentrations. The input parameters include thickness, materials, density, specific heat and thermal conductivity of the basement, exterior floor, interior floor, exterior wall, interior wall, roof, ground slab, glazing type, and infiltration rate. The results show that exterior floor materials have the biggest impact on annual delivered energy for heating and cooling, whereas the density of all structural elements and thickness of the basement, exterior floors, interior floors, and walls have minimal effects on energy consumption. It is also shown that the impact of all investigated parameters is not sensitive to the carbon dioxide concentration in the building. The authors consider that the findings of the paper assist designers to assess the performance of existing buildings and more efficiently generating alternative solutions in the energetic retrofitting of existing and energy design of new residential buildings.

1. Introduction

In building science, designers and researchers frequently use dynamic thermal simulation software to analyze the energy and thermal performance of buildings to achieve specific goals, such as lower energy consumption, improved indoor thermal comfort, or reduced environmental effects [1,2,3]. As a result, several techniques for supporting building simulation analysis have been developed, such as simulation-based optimization, parametric simulations, sensitivity analysis, meta-model analysis, etc. Numerical simulations are frequently used to assess the energy performance of buildings. Despite many recent advancements in software to simulate building energy requirements, the discrepancy between predicted and actual energy consumption remains a constant issue. One reason behind this disparity in existing buildings may be due to uncertainties in the thermal and physical properties of building materials [4]. The properties vary as a result of (i) degradation over time, (ii) exposure to weather conditions, and (iii) traditional construction processes. Consequently, estimating actual material properties tends to improve the reliability and accuracy of building simulation software. Environmental and energy issues of buildings have recently received significant attention [5,6]. In addition to the development of green buildings, a large number of existing buildings must also be upgraded to an improved thermal performance level. The primary methods for improving the indoor environment in naturally ventilated residential buildings are envelope and ventilation design. As a result, optimal envelope retrofitting of existing buildings and envelope designs for new residential buildings are urgently required. The effects that design parameters of building envelopes have on energy performance and thermal comfort have been extensively researched. Increasing the insulation thickness can directly enhance the thermal properties of buildings, lowering cooling and heating energy consumption.
The optimal insulation thickness was investigated by Al-Khawaja, Alsayed, and Huang et al. [7,8,9]. The window-to-wall ratio (WWR) and building shape coefficient (building exterior area/building volume) are critical factors in the design of energy-efficient buildings [10,11]. The lower these factors are, the less heat is lost through the envelope and the less energy is consumed. The preceding study focuses primarily on residential and public buildings. As a result, the most important envelope design parameters differ from those of buildings with active cooling and heating. Uncertainty and sensitivity analysis is an effective tool to identify uncertainties in a system’s or simulation tool’s input and output [12,13,14]. The importance of sensitivity analysis in building energy analysis cannot be overstated. Sensitivity analysis is the study of the effects of changes in parameters of a mathematical model or system on the outputs or performance of the system. In other words, sensitivity analysis may be used to assign changes in a system’s outputs to various sources of uncertainty in its inputs. Sensitivity analysis identifies the most important design parameters in terms of building performance. In practice, uncertainty and sensitivity analysis provide a number of additional advantages, including: (1) the use of parameter screening to simplify models [15,16]; (2) the evaluation of models’ robustness [17]; (3) alerting designers to unexpected sensitivities that may result in errors, and/or incorrect specifications (quality assurance) [18,19,20,21,22]; and (4) providing a “what-if analysis” by changing the input parameters and displaying the effect on the outcome of a model (decision-support) [23].
By focusing on the most influential parameters, the number of parameters to be estimated using in situ measurements can be reduced. Furthermore, it significantly reduces the computational requirements of inverse problems [24]. The objective function was set to help with previously unmeasured existing buildings, especially with the historical or pronounced architectural value. As a result, sensitivity analysis has been widely used to investigate building thermal performance characteristics in a variety of applications, including building design [25,26], energy model calibration [27,28], building stock [29,30], building retrofit and refurbishment [31,32], and the effect of climate change on thermal performance buildings [33,34]. Furthermore, practitioners of building energy modeling have shown a rising interest in uncertainty and sensitivity analysis approaches in recent years. From the perspective of a building energy retrofit, uncertainty analysis and sensitivity analysis are often used to evaluate the risk of various energy-saving methods and to aid decision-making.
Goffart et al. [35] applied the uncertainty analysis to evaluate the effects of bricks on the energy cooling demand of a structure. Yu et al. [36] conducted an energy performance sensitivity analysis to evaluate the effects of eight design parameters and defined the most important parameters for various WWR. Eisenhower et al. [37] proposed a sensitivity indices decomposition to identify which intermediate processes (e.g., heating sources, cooling sources air handling unit, etc.) made a significant contribution to the uncertainty of building simulation outputs. Spitz et al. [38] utilized 6669 simulation runs of the variance based Sobol method to find the most significant factors for an experimental home in France. The design variables that have the largest effect on a typical office building’s energy performance are determined in [39]. Hopfe and Hensen [26] conducted sensitivity and uncertainty analysis on three types of office building input parameters: design parameters, physical parameters, and scenario parameters. Heiselberg et al. [40] applied a local sensitivity method, the Morris method [41], to perform sensitivity analysis on office buildings in Denmark to assess the impact of design parameters on total building energy demand. Heo et al. [42] used the Morris design technique to describe the ranking of energy usage intensity for office buildings in Chicago’s commercial center. Tian and Choudhary [31] utilized the standardized regression coefficient (SRC) technique to identify the major parameters influencing energy use in London school buildings. Song et al. [43] used a treed-based Bayesian Gaussian model (one of the meta-modeling sensitivity analysis approaches) to analyze the energy usage trends of a London office building.
This paper identifies the most important envelope design parameters for buildings in general, but a two-storied residential building located in Budapest (Hungary) was used as a case study to demonstrate the use of the proposed methodology in practice sensitivity analysis of 33 envelope design parameters for energy consumption and carbon concentrations was performed. The input parameters included the thickness, materials, density, specific heat, and thermal conductivity of the basement, exterior floor, interior floor, exterior wall, interior wall, roof, and ground slab, glazing type, and infiltration rate. It is assumed that the findings of the paper assist designers to assess the performance of existing buildings and more efficiently generate alternative solutions in the energetic retrofitting of existing and energy design of new buildings.

2. Materials and Methods
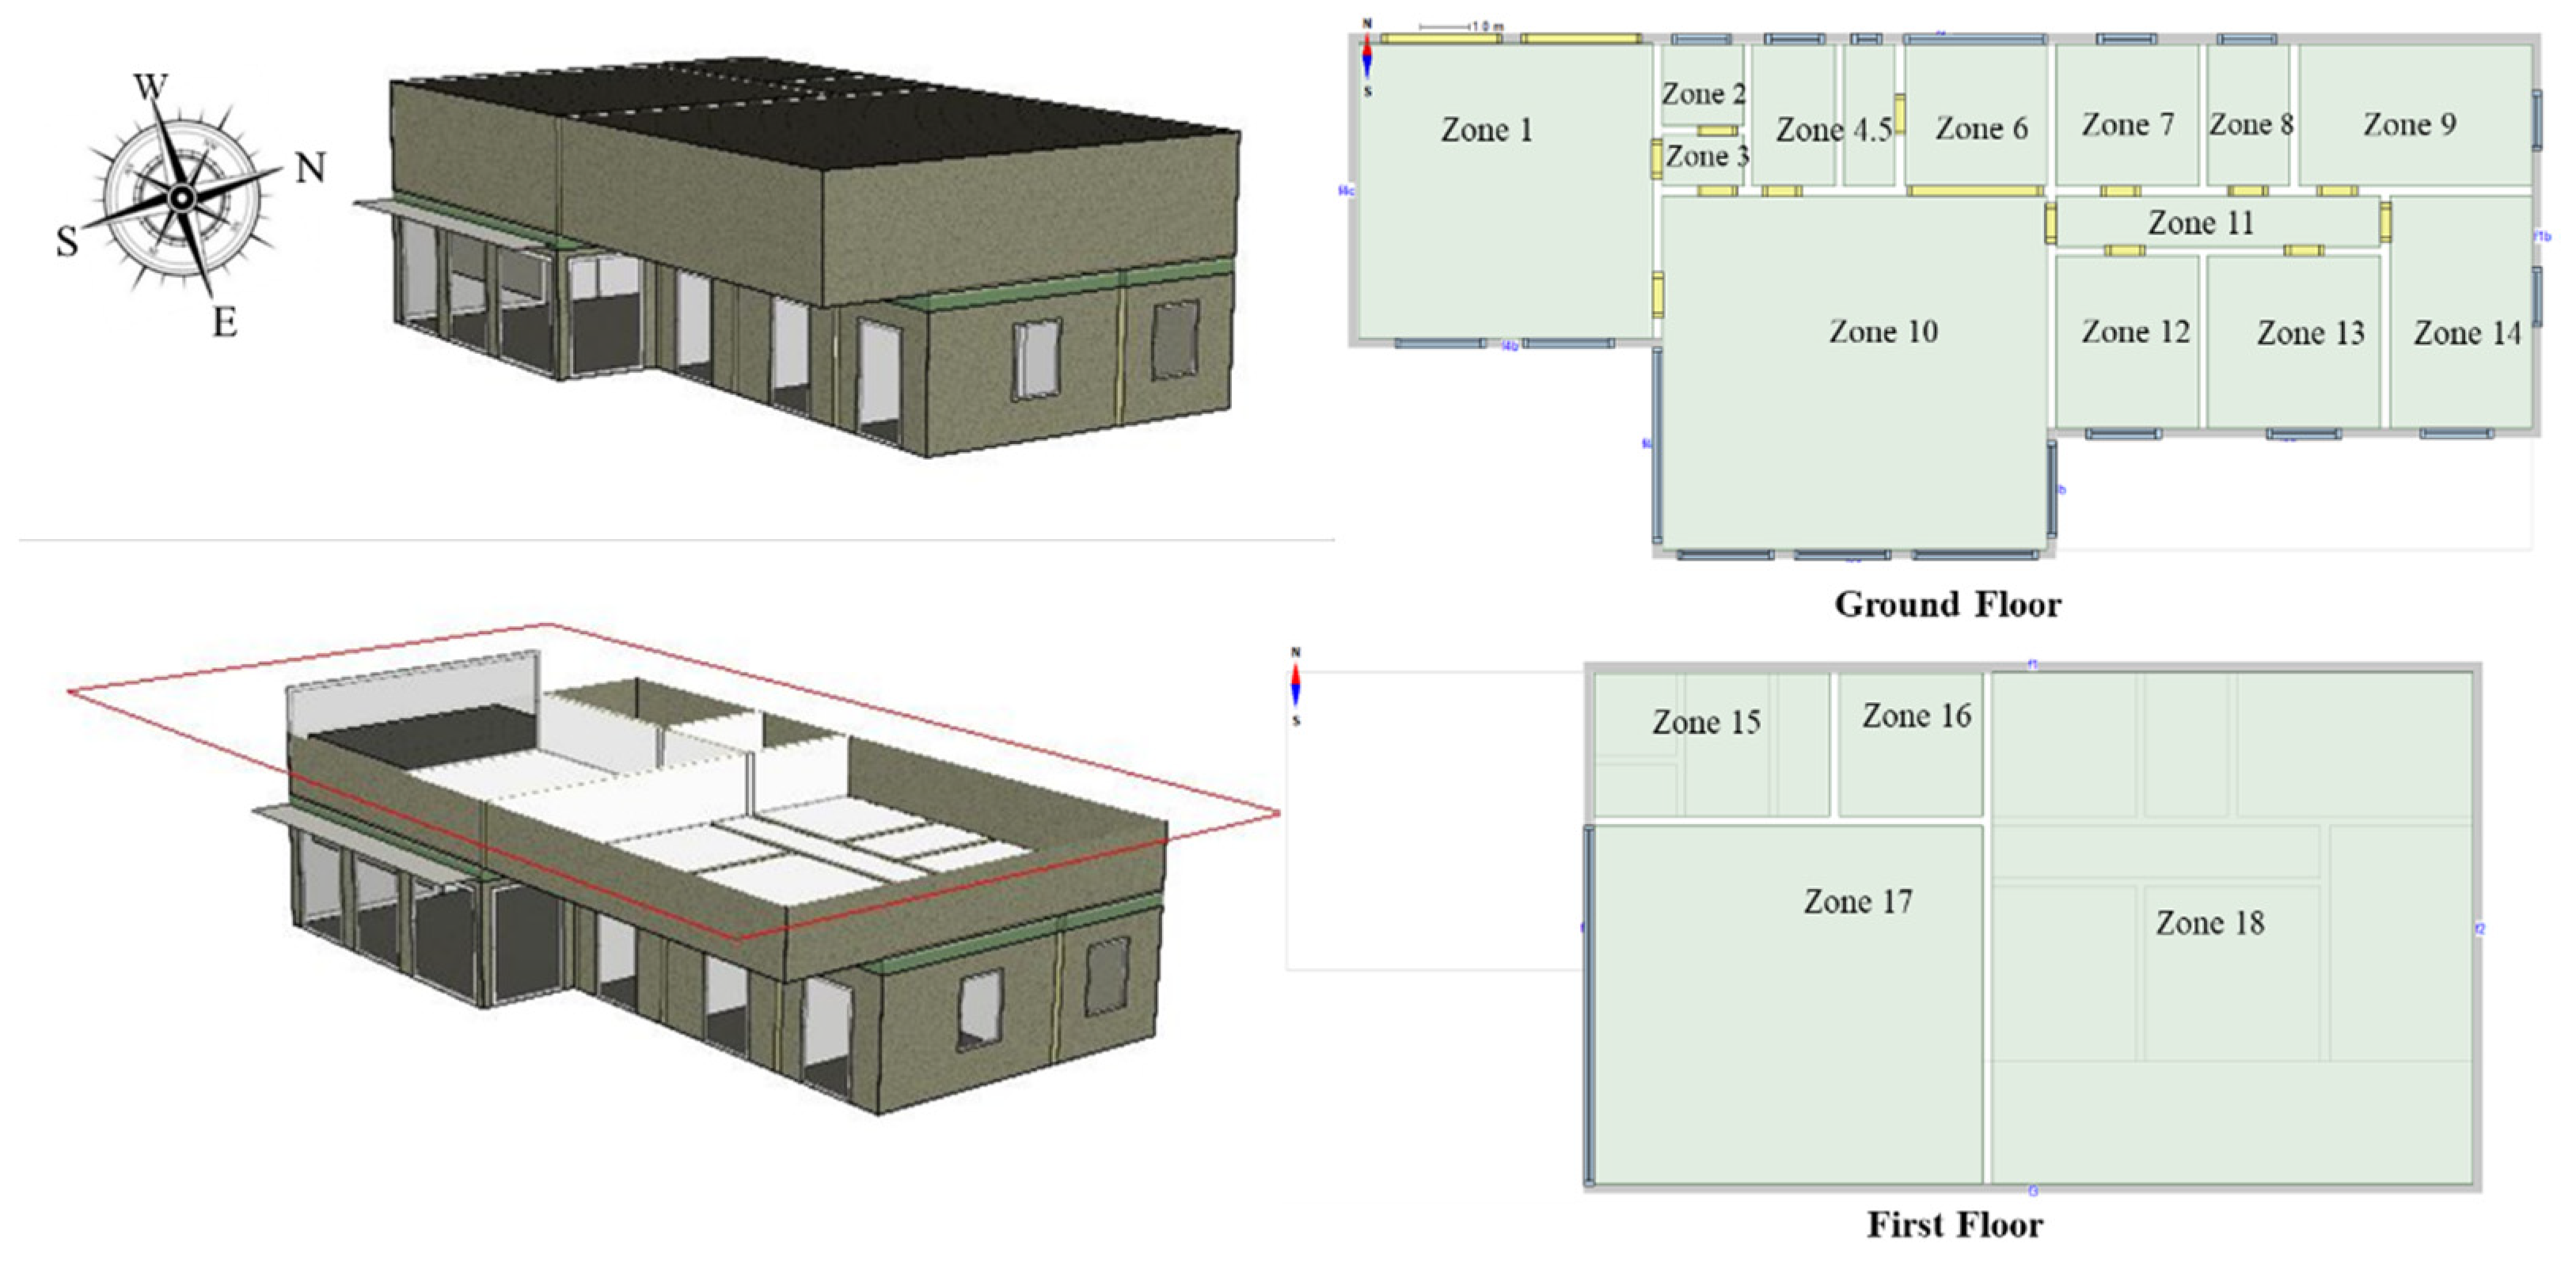
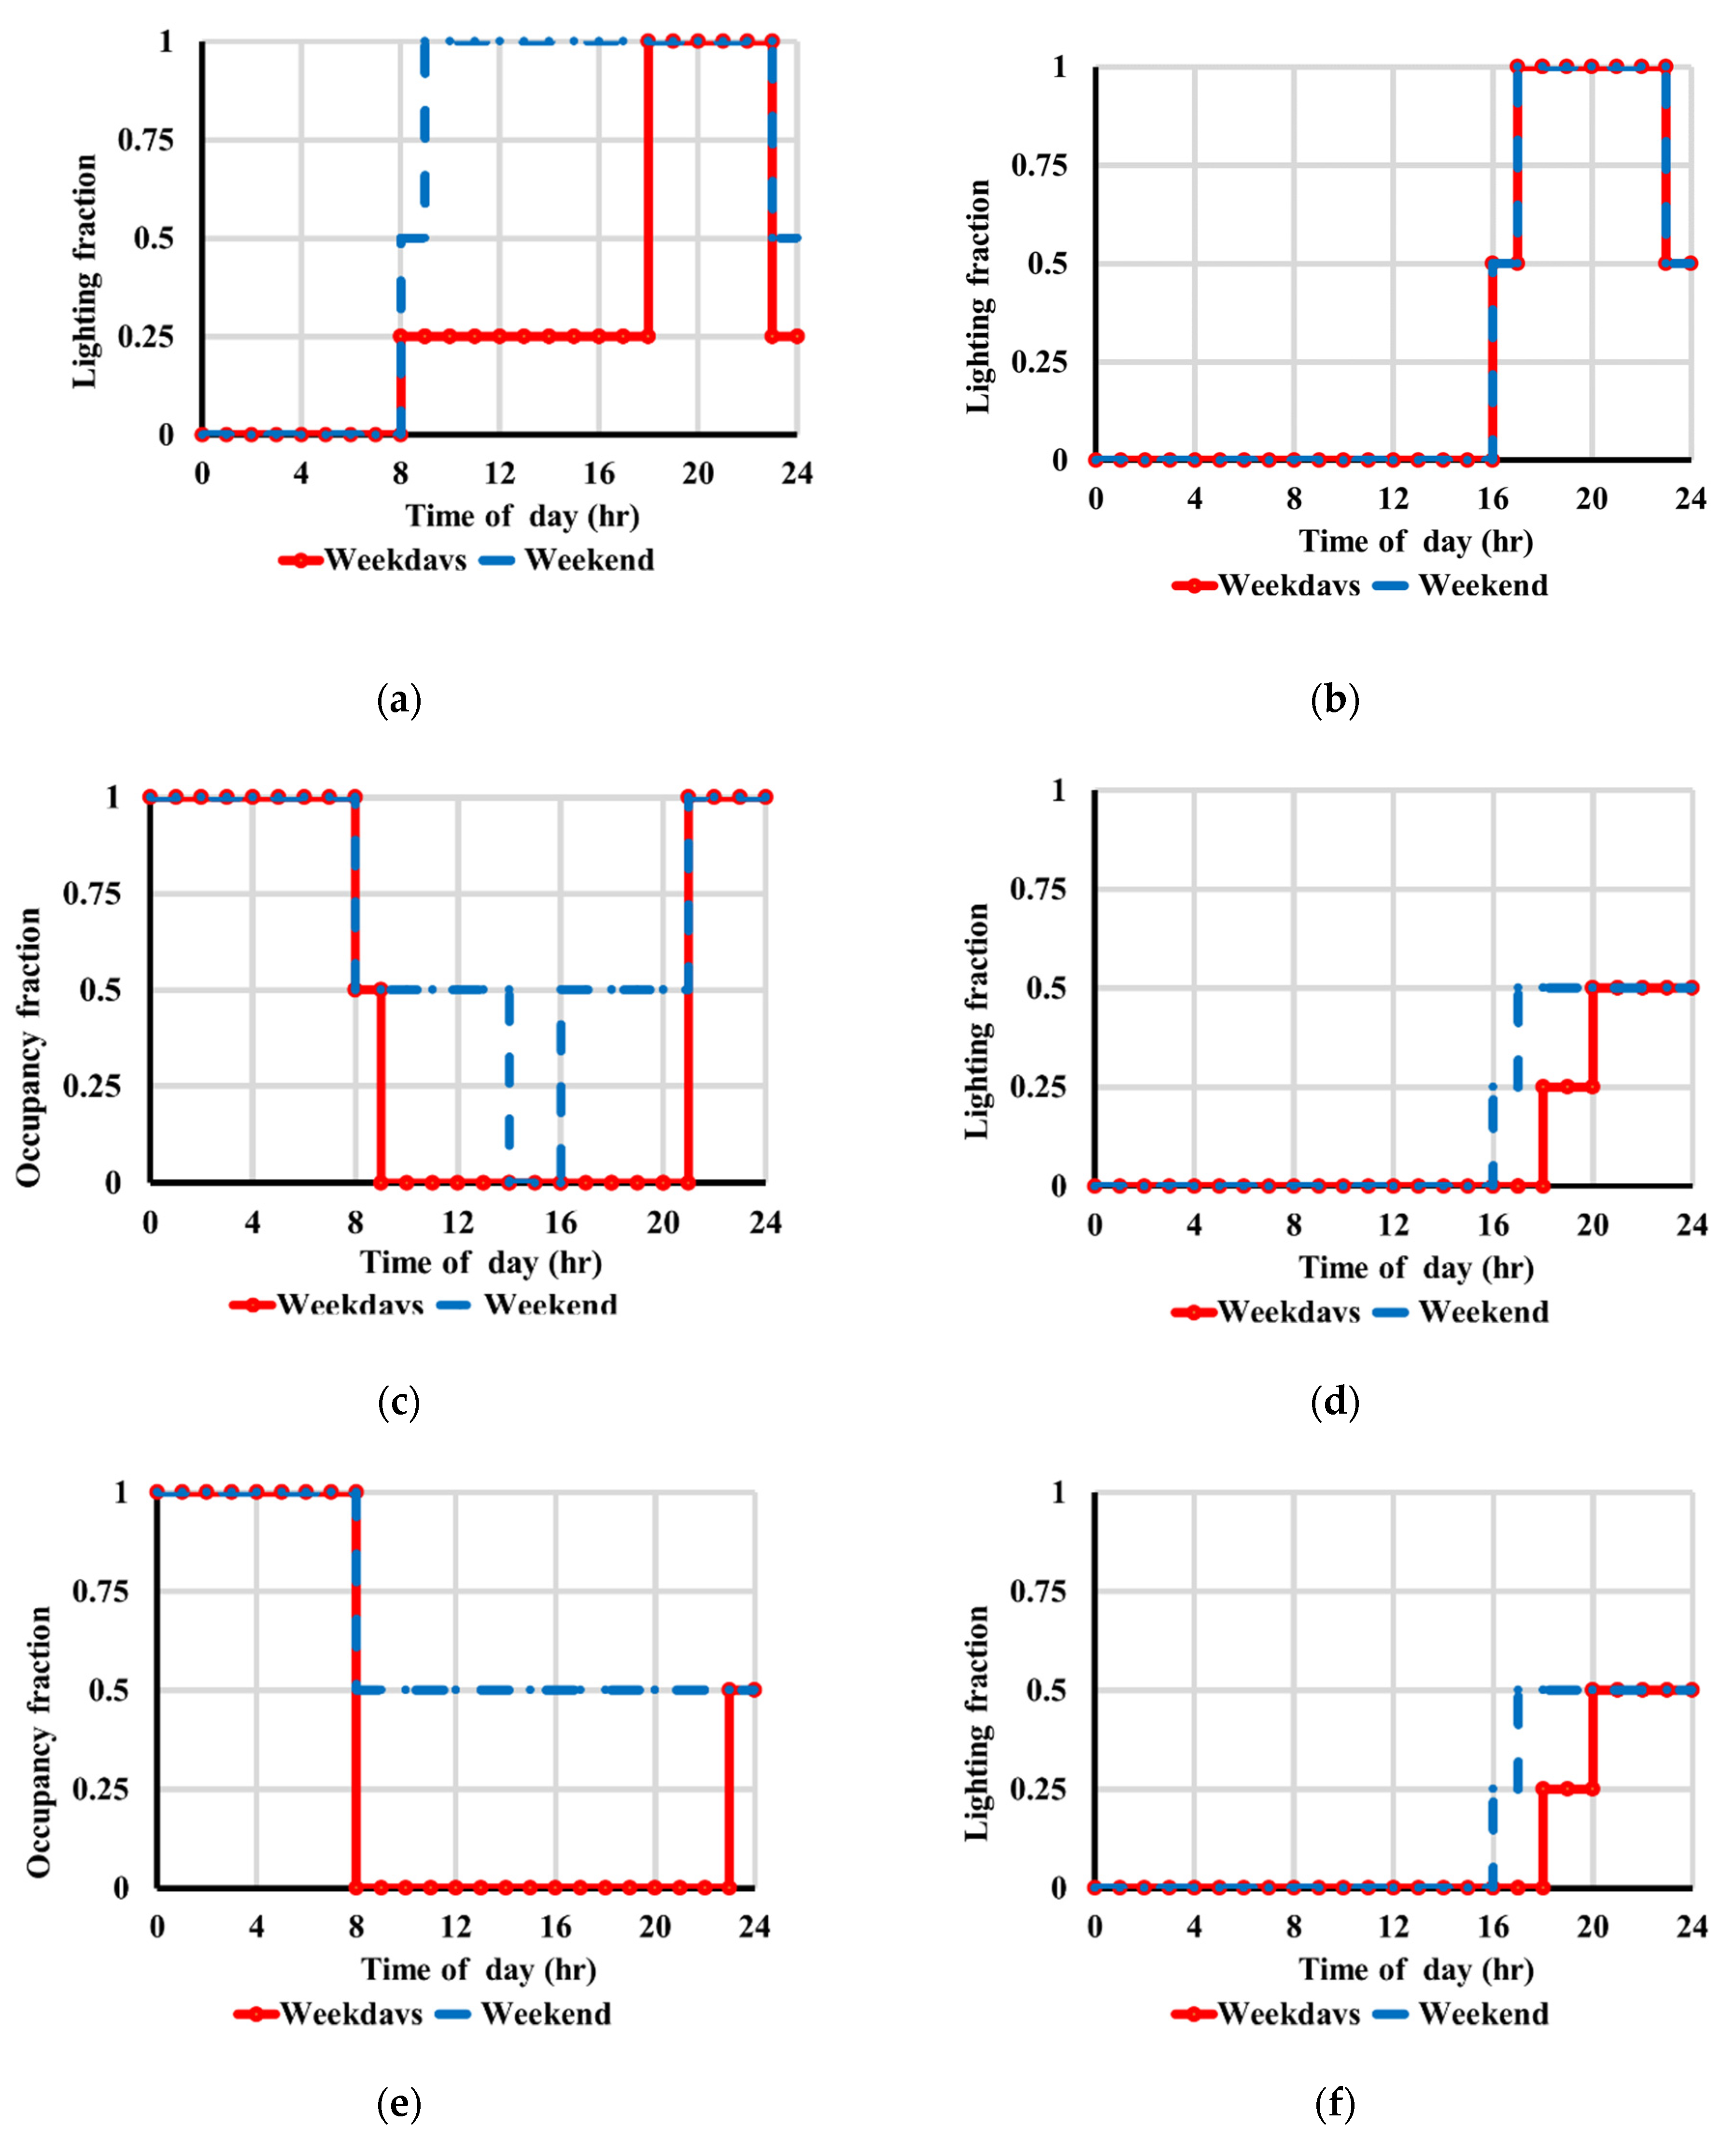
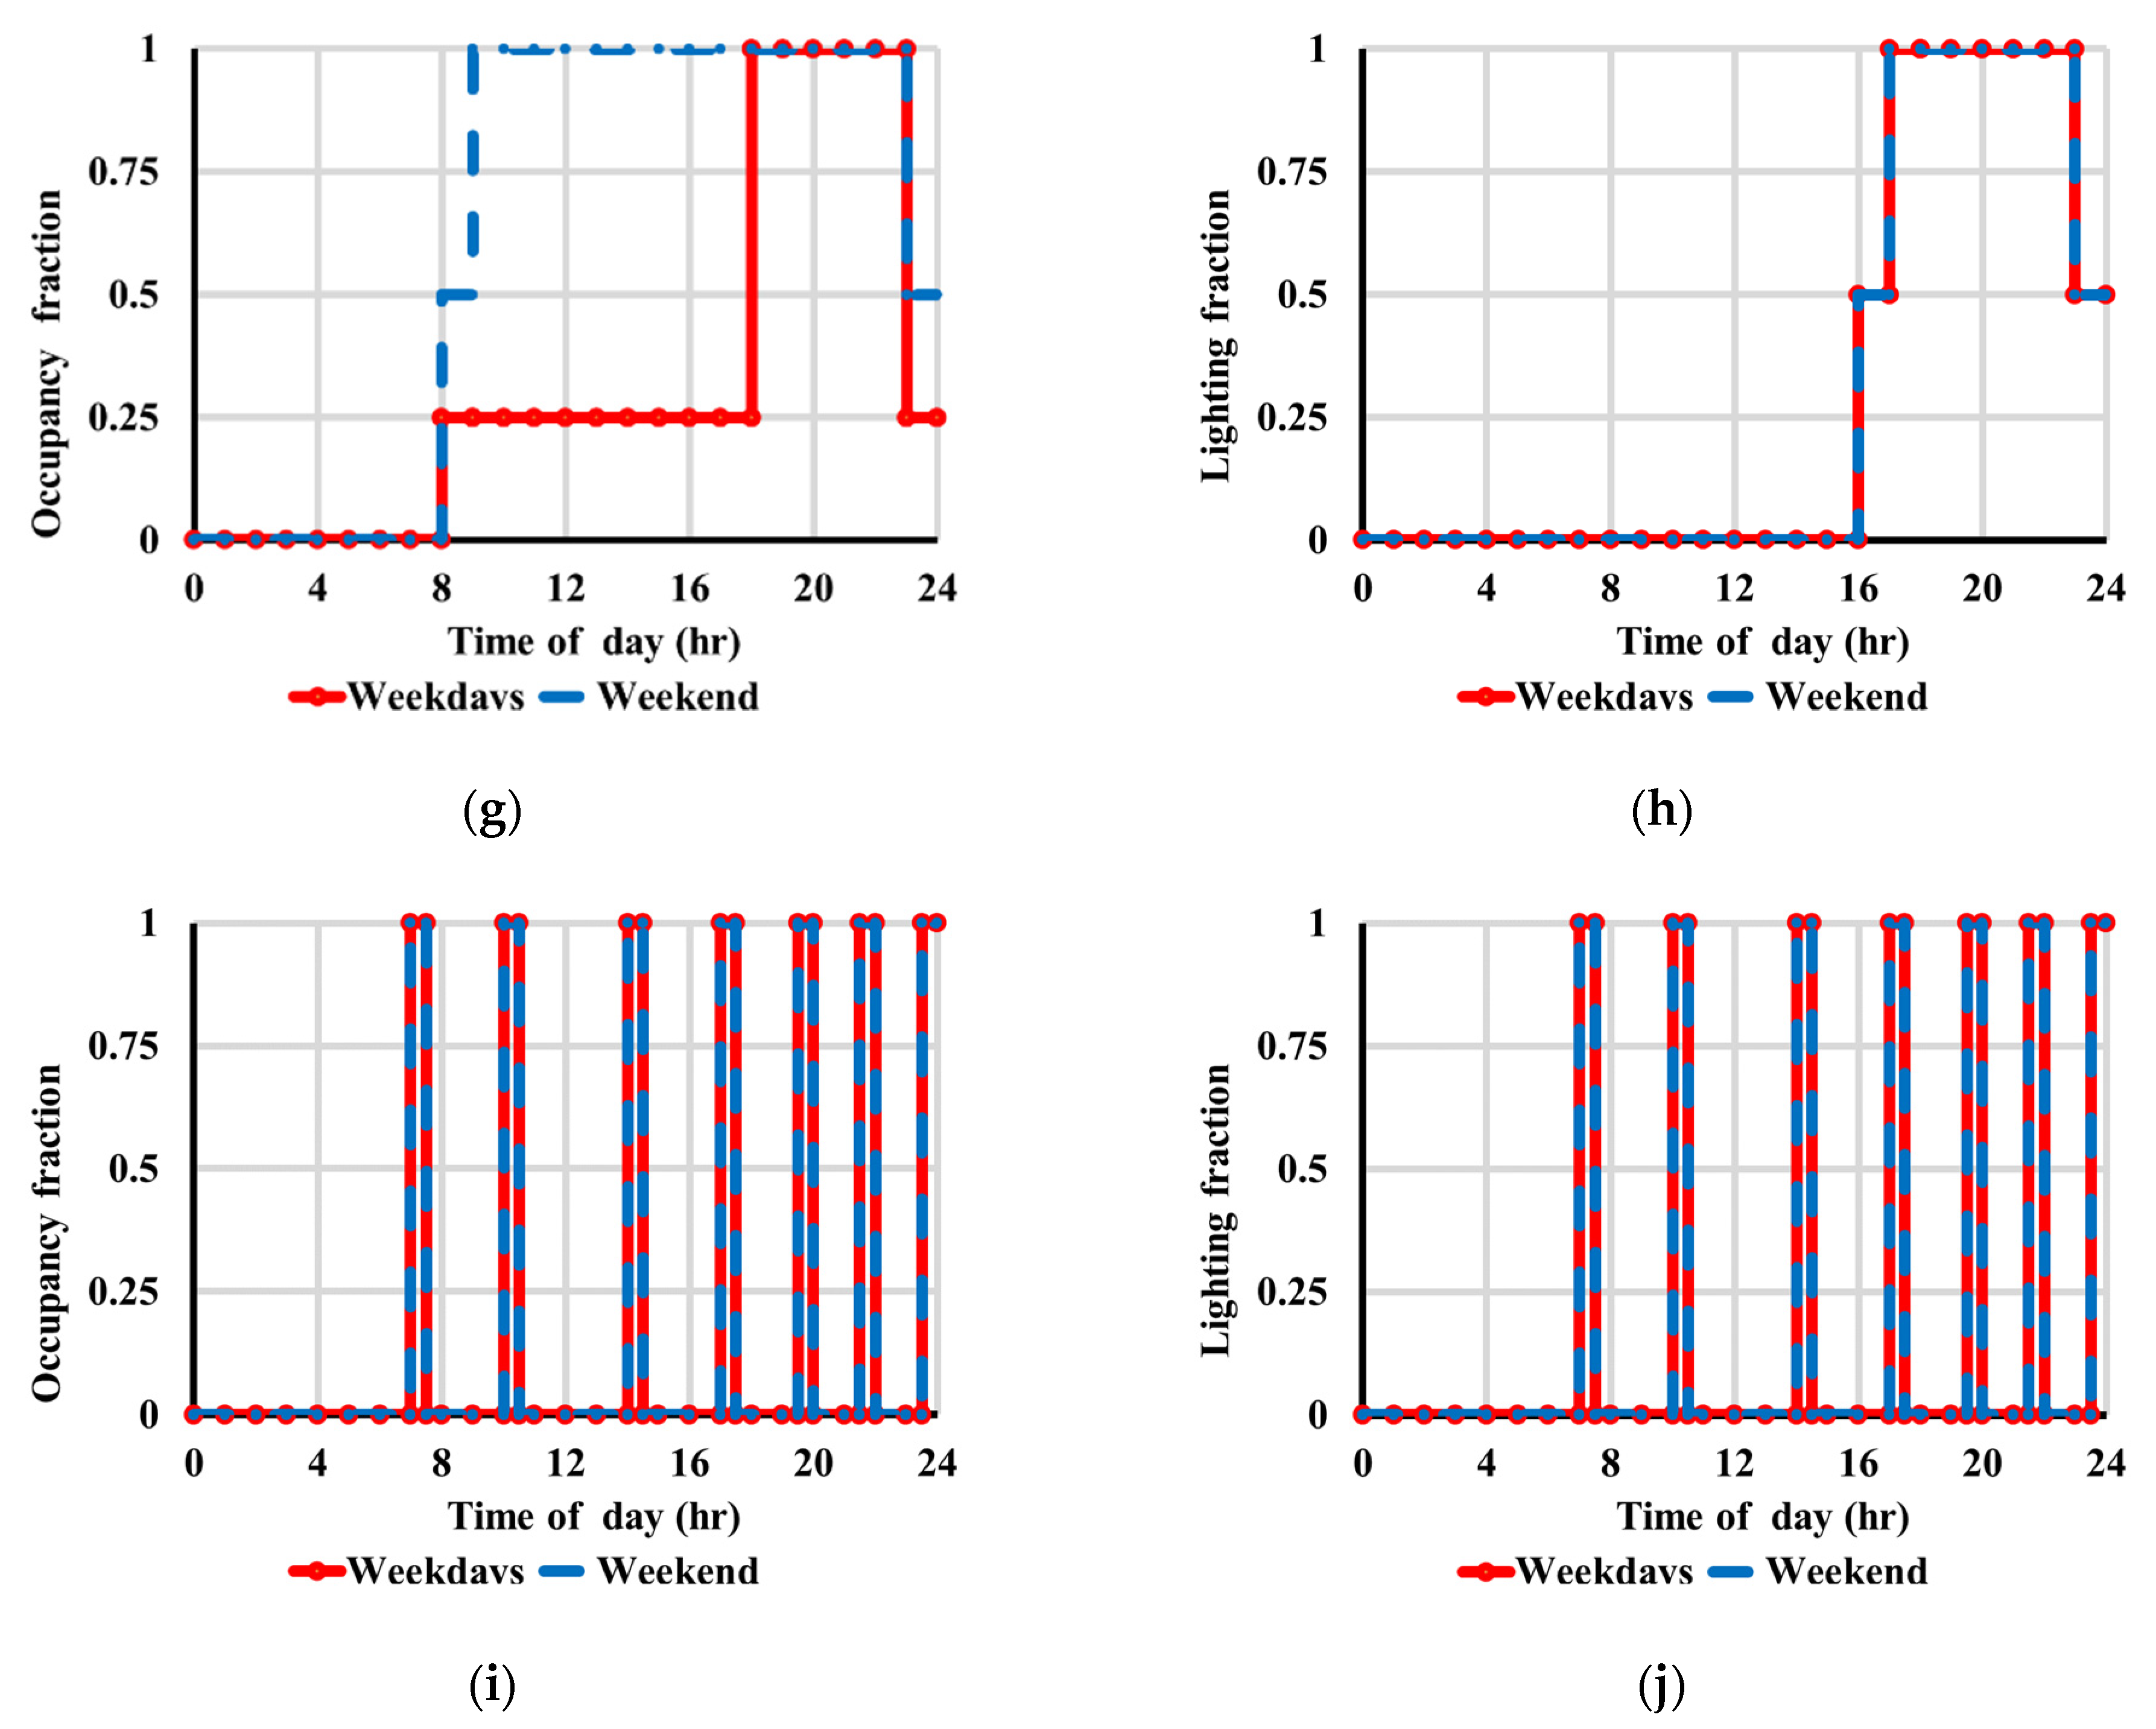
2.1. Case Study

For the purpose of the sensitivity analysis, family building is proposed, representing a typical residential building type in the world’s largest building sector. This reference building is a two-story floor located building in Budapest, Hungary (Figure 1). The ground floor area consists of 14 zones with a total area of 200 m2 with a ceiling height of 2.8 m, 4 zones are distributed on the first floor the first-floor area is 187 m2 with a ceiling height of 2.6 m.
IDA-ICE was utilized as a reliable tool to simulate the building’s energy and thermal comfort performance providing a comprehensive model and sensitivity analysis [44]. Table 1; Table 2 summarize the used materials in the construction of this building and input data. The schedules for occupants and lighting were created based on the assumption of regular daily patterns. Occupancy and lighting schedules on weekdays and weekend for different thermal zones are defined in IDA-ICE as shown in Figure 2. The properties of thermal zones in the investigated building are presented in Table A1. The internal emitted heat per person was assumed to be 75 W when present. Constant clothing level was set 0.85 ± 0.25 CLO (clothing is automatically adapted between limits to obtain comfort). Ventilation air change rate and air pressure difference are set by 0.5 ACH and 50 Pa, respectively. No integrated window shading was used in this building.
Hungary is located in the temperate climatic zone. The average monthly temperate and relative humidity are shown in Figure 3. The highest temperature was observed in August with an average value of 29.2 while December represents the coldest month with an average temperature of 21.9 °C. In this building, the average relative humidity is 32.4%. The heating–cooling temperature was defined between 21 and 25 °C, heating–cooling temperature, and heating–cooling temperature between 20 and 80%.

2.2. Sensitivity Analysis

To gain a better knowledge of the building’s performance, sensitivity analysis was used to identify the relationship between independent and dependent factors. Sensitivity analysis is utilized in building design, retrofitting, stock management, and assessing the impact of climate change on structures (see [26,28,32,34,42,43,44). Sensitivity analysis and simulation tools can be used in tandem to help conclude better design decisions [45]. They can be applied to define the key variables influencing building thermal performance based on both observational studies and energy simulation models. Sensitivity analysis is defined as a measure of the impact of a given input on the output [46]. It can quantitatively examine the impact of each parameter of a building envelope and define important design parameters for reducing energy consumption and improving the thermal environment. In this paper, a sensitivity analysis method was used. Sensitivity analysis is frequently quantified in building research as the difference in simulated results caused by changes in input parameters. It gives designers a reliable tool for quantifying the impact of various design parameters and identifying sources of uncertainty. It has also been applied widely in building energy analysis as it not only prioritizes energy-saving solutions but also analyzes energy-use patterns for energy optimization and model calibration [47,48,49].
The sensitivity methods utilized in building performance analysis may be classified into two types: global and local sensitivity analysis approaches [48]. Global techniques are increasingly used in research because they consider the consequences of uncertain inputs over the whole input space [50] which allows for a more complete examination of the link between inputs and outputs throughout the whole input space. This, in return, results in more dependable energy-saving solutions. The downsides of utilizing global techniques are that they are more computationally intensive than local sensitivity analyses. Global sensitivity analyses can be further classified into the following approaches: Morris design, screening-based methods [40,51,52,53,54,55,56], variance-based methods [39,51,56,57,58], regression methods [26,32,59,60,61,62,63,64,65,66,67,68,69], and meta-modeling approaches [27,33,70]. Local sensitivity analysis techniques, on the other hand, can only investigate the connection between the data points utilized in the analysis without taking into account interactions among inputs [71]. They are mainly concerned with the impacts of uncertain inputs at a point (or base case).
This section describes how different model parameters entered influence variations in model output by using a number of estimators relevant for individual parameters. The effect of a parameter is determined by changing input and analyzing changes in output. It can be applied to determine the extent to which each input parameter contributes to the generation of output variability and to define the most significant parameters. The sensitivity coefficient Sm of the design parameter m can be determined as [5,72].
Sm = ( Δ X / Xn ) ( Δ Ym / Ym , n ) × 100 %
where ΔYm is the change in the value of input parameter m, ΔYm = Ym − Ym, n; Ym is the value of the input parameter m; Ym, n is the value of the input parameter m as a baseline value; ΔX is the output variation for the change in the input parameter, ΔX = Xm − Xn; Xm is the output value corresponding to the input value Ym; and Xn is the output value in the baseline case.
Sensitivity analysis can help to improve the efficiency of the design process and optimize the envelope of a building [40]. The structure of sensitivity analysis is presented in Figure 4. The four basic steps for sensitivity analysis are:
  • Specify the input and output variables, as well as the interval and range of each input parameter;
  • Assign the baseline design parameters and compute the output of the baseline case;
  • Compute the output distribution due to the variations of a given input parameter, and compute the sensitivity coefficient using Equation (1); and
  • Evaluate the impact and significance of each design parameter on the output variables.

2.2.1. Input Parameters

Before conducting sensitivity analysis, it is critical to define which input parameters will be examined. To determine this a literature study [70,73,74,75] was conducted which allowed information regarding distributions utilized for each input parameter type to be obtained. Such uncertainties influence a total of 33 input parameters. As input parameters, 33 envelope design parameters were chosen (exterior floor type, exterior wall type, interior wall type, glazing type, infiltration rate type, thickness, density, specific heat, and thermal conductivity for basement, exterior floor, interior floor, exterior wall, interior wall, roof, and ground slab). Table 3 presents parameters and parameter ranges used in sensitivity analysis. Different materials for the exterior floor, exterior wall, and interior wall were applied. Density, specific heat, and thermal conductivity for concrete range from 2100 to 2500 kg/m3, 672 to 1050 J/kg K, and 1.07 to 1.7 W/mK, respectively, while ranges 1500 to 1800 kg/m3, 800 to 840 J/kg K, and 0.58 to 0.73 W/mK correspond to the brick. Four different types of glazing were selected. Infiltration flowrate ranged from 0.2 to 2 m3/s. The thickness range for the building envelope is presented in Table 3.

2.2.2. Output Variables

The output variables included the assessment of energy consumption and indoor thermal comfort performance. The delivered of energy for heating and cooling, lighting, equipment, and appliances, and DHW are investigated. CO2 concentrations were assessed as one of the main indices to evaluate thermal comfort.

3. Results and Discussions

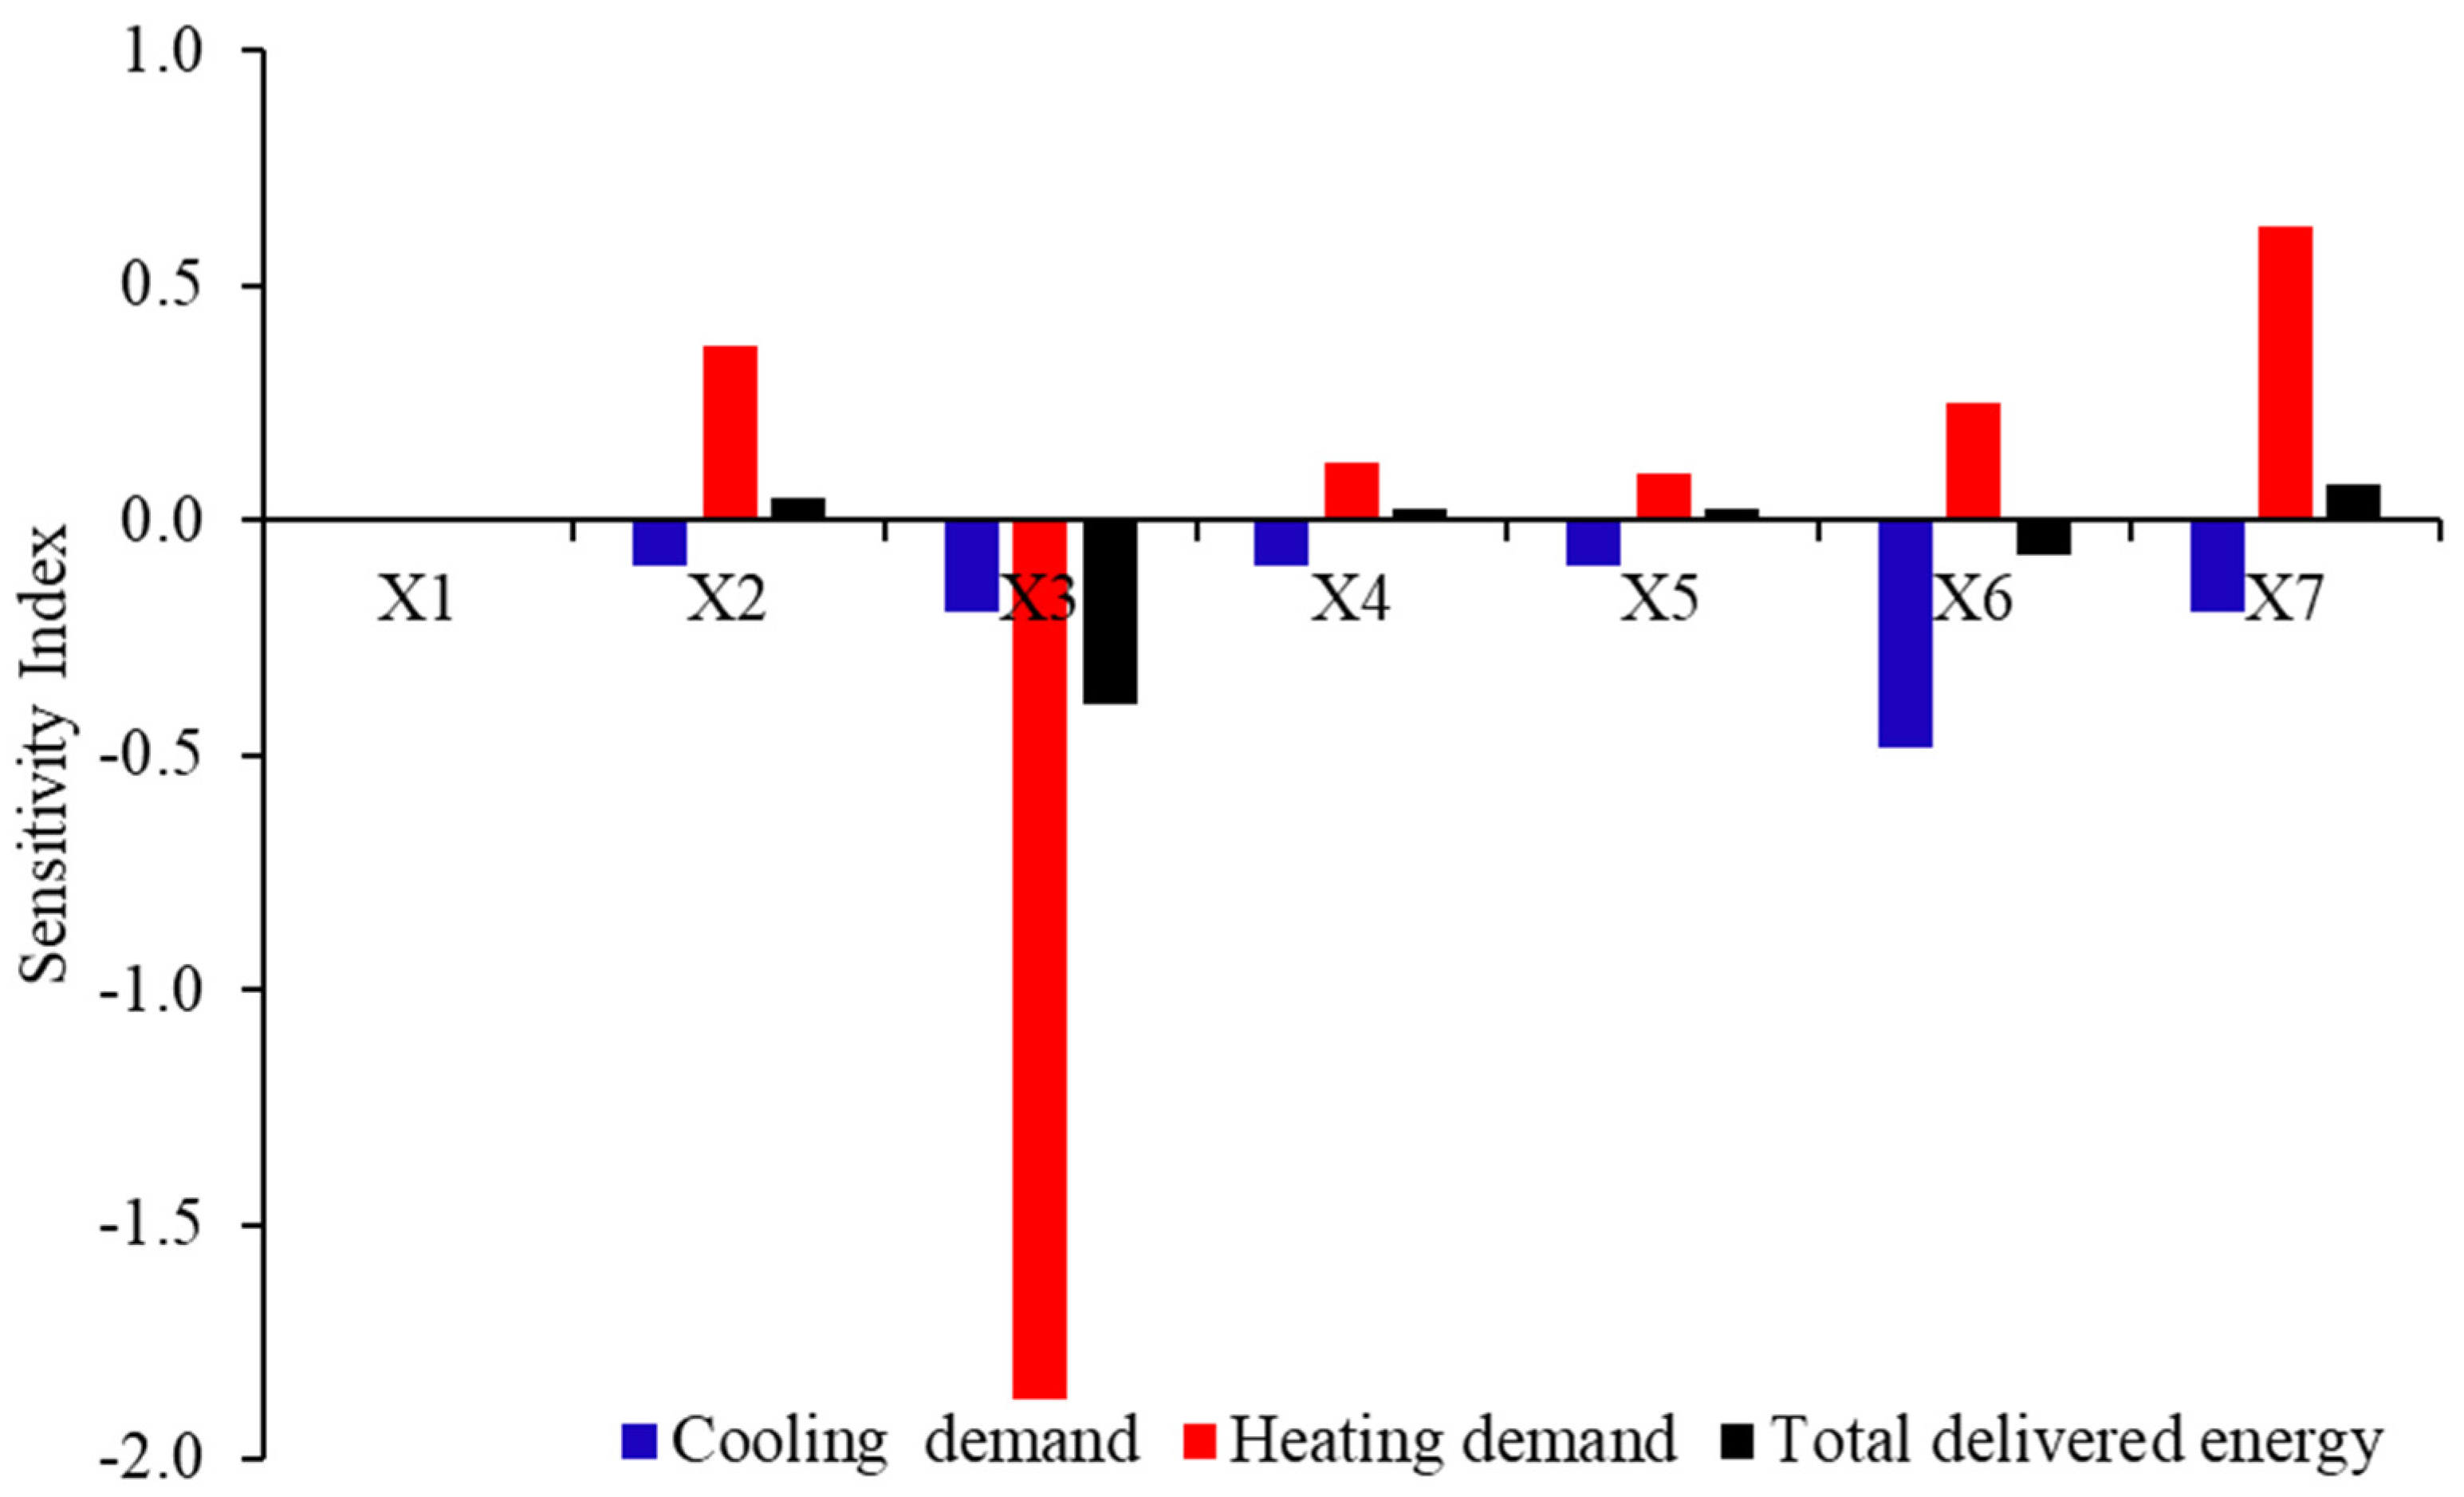
3.1. Sensitivity Analysis for the Energy Assessment

The goal of the research was to address some of the concerns discovered in existing literature analysis and case study into input parameters and evaluate what kind of influence these issues have on energy consumption and thermal comfort. Although the sensitivity analysis results cannot be applied to all structures, the study demonstrates that different input factors have variable effects on the building’s thermal performance. As a result, the study reaffirms the necessity for participants to be more strategic in determining where to place their emphasis when collecting field data, conducting tests, and modeling buildings. The input parameters are divided into three groups: thickness change parameters; materials change parameters; density-specific heat and thermal conductivity parameters while other relevant parameters, such as building geometry, occupancy schedules, temperature setpoints, air change rates, and natural ventilation are assumed to be constant. Thus, the generated findings cannot be generalized to all dwellings, which may diminish the likelihood of our findings in different types of dwellings.
The results demonstrate that only heating and cooling demand varies with the different runs of sensitivity analysis with very little variation in energy demand for illumination, facility, equipment, tenant, and DHW. Figure 5 shows the mean sensitivity coefficient for each change in the thickness parameter for heating demand, cooling demand, and total delivered energy. The sensitivity coefficients of interior floor thickness (X3) represent the highest value of 1.9% and 0.2% for cooling and total delivered energy, respectively, while the basement thickness (X1) has the lowest sensitivity coefficient value for cooling, heating, and total energy. The thickness of the interior floor and interior wall also have minimal impact on delivered energy.
Figure 6 presents the mean sensitivity coefficient of material change design parameters. With respect to material change design parameters, the weights of exterior floor material (X8) are 27.7% and 12.8% for heating and cooling demand, respectively. The exterior floor material of the roof also plays an important role in delivered energy. The sensitivity coefficient of the glazing type (X11) is 22.3% and 5.9%, and the sensitivity coefficient of the exterior wall material (X9) is 15.1% and 2.6% for heating and cooling demand, respectively. On the other hand, the internal wall materials (X10) have minimal effect on the energy demand for cooling and heating with a sensitivity coefficient of 0.2% and 1.7%, respectively.
The mean sensitivity coefficient of density, specific heat, thermal conductivity, and the infiltration rate design parameter for heating demand, cooling demand, and total delivered energy are shown in Figure 7. The sensitivity analysis reveals that the density of the basement wall, exterior floor and wall, interior floor and wall, roof, and ground slab, (X12–X18); all have a minimal effect on electric heating demand and cooling demand and total delivered energy. Thermal conductivity of the basement wall, interior floor, exterior floor materials (X26–X28) have the greatest impact on heating and cooling demand with sensitivity coefficients of 5.24%, 1.95%, and 0.59%, respectively. The thermal conductivity sensitivity coefficient of the roof (X31) and the exterior wall (X29) are 5.2% and 1.2%, respectively, for the heating demand. The sensitivity coefficient of the basement specific heat (X19), exterior and interior specific heat (X20–X21) are 2.4% and 0.5%, respectively, while the sensitivity coefficient of the exterior wall specific heat is 1.7% for cooling demand.
Figure 5, Figure 6 and Figure 7 depict that changes to the material parameters have the most obvious effect on total delivered energy. The impact of thermal conductivity parameters is the second most sensitive category, followed by the specific heat design parameters in the third group and thickness change design parameters in the fourth group. Finally, the density of all structural materials comes in the least sensitive category. This study provides an overview of which design factors are most important for enhancing the thermal environment of buildings. Given the limited time available for energy modelers to construct energy models, the emphasis should be on ensuring that the inputs having the greatest influence are tailored to properly represent the existing building circumstances.
The findings are especially intriguing since the input factors that had the greatest influence on energy analysis results corresponded to current building information, occupancy schedules, and thermostat settings, which industry observers could easily record during an energy audit. Because these characteristics are generally constant before and after the retrofit, more accurate modeling would be possible. Moreover, the results can assist designers in the early stages of envelope design of newly constructed buildings, as well as envelope rehabilitation of existing buildings.

3.2. Sensitivity Analysis on Carbon Dioxide (CO2) Concentrations

Carbon dioxide concentration is used as an indication of indoor air quality [76]. The link between indoor air quality and indoor CO2 concentrations stems from the idea that individuals produce bio effluents odors while also creating CO2 [76]. CO2 concentration is also used to classify indoor air quality in European Standard EN 13779 (EN 13779:2007 2019), and the highest value of CO2 concentration is 1500 ppm, although it is recommended to keep CO2 concentrations below 1000 ppm. In this study, The findings demonstrate that CO2 concentrations were comparatively low with an average value around 651.5 ppm for all scenarios due to more frequent window openings and a higher air exchange rate, resulting in better air quality. Thus, none of the selected design parameters were affected by carbon dioxide levels. Moreover, CO2 concentrations are mainly affected by other variables such as occupancy schedules and air change rates which are assumed to be constant in the current study. Future studies might involve expanding the analysis to include those parameters.

3.3. Research Limitations and Future Research Opportunities

The findings of a baseline performance assessment and sensitivity analysis of family residential dwelling are presented in this paper. This study, however, has several limitations. Firstly, the input parameters used for this investigation are constrained to the envelope components, while other variables are assumed to be constant. Other relevant parameters such as building geometry, occupancy schedules, temperature setpoints, and air change rates are not considered in this study. Since this paper presents a specific dwelling with specific assumptions, it is crucial to remember that the specific sensitivities identified by the study are not absolute and cannot be generalized to all dwellings; however, the critical evaluation to examine the underlying functions behind the design recommendations and performance responses to improve building behavior can be applied to a wide range of projects. Secondly, because existing information about building factors and their bounds are still restricted, the number of input parameters and their ranges must be expanded, as with many other forms of SA research. Future studies might involve expanding the analysis to include those parameters or determining whether the same parameters for the same building would have a different degree of sensitivity if an energy modeling program other than IDA-ICE was used. As a future study recommendation, the same procedure might be applied for data from other regions to determine if the relevant input parameters change regionally. Finally, the analysis exclusively addresses Budapest’s climate circumstances, using a single climate file, and cannot predict the impacts of climate change in the upcoming years. As a result, future studies should consider the consequences of climate change to provide more realistic results.

4. Conclusions

Sensitivity analysis is typically performed in conjunction with energy simulations to better understand building performance and minimize consumption. The quality of their outputs is mostly determined by the thermal models and input data. It is challenging to obtain reliable data regarding the attributes and operational status of buildings. As a result, simulation inputs are influenced by uncertainties, which can have a major impact on outcomes and must be considered.
Uncertainty analysis considers uncertainties caused by intrinsic model simplifications and a lack of knowledge about input data. The paper discussed the possible use of sensitivity analysis in the field of buildings’ thermal performance analysis and demonstrated its practical application via a case study. The sensitivity coefficient of 33 envelope design parameters for delivered energy and thermal comfort were calculated and compared for buildings in Budapest, Hungary. The most critical design parameters were identified for the analyzed building. The results showed that the material of the exterior floor had the most significant impact on the delivered energy of the building. The parameter’s influence in terms of weights were 27.7%, 12.8%, and 2.6% for heating demand, cooling demand, and total delivered energy, respectively. The second most influencing factors were the thermal conductivity parameters. The impact of the density of all structural elements and the thickness of the basement floor, exterior floor, interior floor, and wall had the least impact on total delivered energy.
All envelope design parameters had minimal impact on carbon concentrations. This study provides an overview of which design factors are most important for enhancing the thermal environment of buildings. Future study will concentrate on expanding these ideas to further advance energy modeling process standards. These findings were interesting since not only did these misrepresented inputs have the greatest influence of those examined, but much of the input parameter data would be very straightforward to collect through a site visit, tests, and interviews with the building inhabitants. Moreover, they can assist designers in the early stages of envelope design for newly constructed buildings, as well as envelope rehabilitation of existing buildings.

Author Contributions

Conceptualization, S.E. and Z.O.; methodology, S.E.; software, S.E.; validation, S.E. and Z.O.; formal analysis, S.E.; investigation, S.E.; resources, S.E. and Z.O.; data curation, S.E.; writing—original draft preparation S.E.; writing—review and editing Z.O.; visualization S.E.; supervision Z.O.; project administration, Z.O. funding acquisition, Z.O. All authors have read and agreed to the published version of the manuscript.

Funding

This research was funded by the Biomedical Engineering Project of the Thematic Excellence Programme 2019 (TUDFO/51757-1/2019-ITM).

Institutional Review Board Statement

Not applicable.

Informed Consent Statement

Not applicable.

Data Availability Statement

The data presented in this study are available on request from the corresponding author. The data are not publicly available due to privacy issues.

Acknowledgments

The research project is conducted at the University of Pécs, Hungary, within the framework of the Biomedical Engineering Project of the Thematic Excellence Programme 2019 (TUDFO/51757-1/2019-ITM). The first author would like to thank the Egyptian Ministry of Higher Education (MoHE) and Tempus Public Foundation for providing her the Stipendium Hungaricum Scholarship. Also, we appreciate Mahmoud Khaled for his technical help in model development. Further we appreciatethe János Szentágoghai Research Centre, University of Pécs, Energia Design Research Group, led by István Kistelegd.

Conflicts of Interest

The authors declare no conflict of interest.

Appendix A

Table A1. Thermal Zones properties in the investigated Building.
Thermal ZoneArea
(m2)
Volume
(m3)
Glazing Area
(m2)
Glazing to Floor Area RatioThermal Bridges (W/K)
Zone 136.8105.83.40.113.5
Zone 22.88.21.10.41.5
Zone 31.85.10.00.00.0
Zone 44.914.21.10.21.5
Zone 53.19.00.50.21.0
Zone 68.624.87.00.83.1
Zone 78.624.81.10.12.2
Zone 84.914.21.10.21.5
Zone 914.140.61.80.14.6
Zone 1058.0167.133.40.615.3
Zone 117.120.40.00.00.1
Zone 1210.430.13.60.33.1
Zone 1312.736.53.60.33.3
Zone 1414.140.75.40.45.9
Zone 1514.136.70.00.00.1
Zone 168.622.40.00.00.2
Zone 1758.0150.819.00.33.5
Zone 18102.4266.20.00.08.2

References

  1. Garber, R. Optimisation stories: The impact of building information modelling on contemporary design practice. Archit. Eng. 2009, 79, 6–13. [Google Scholar] [CrossRef]
  2. Katona, Á.L.; Xuan, H.; Elhadad, S.; Kistelegdi, I.; Háber, I. High-Resolution CFD and In-Situ Monitoring Based Validation of an Industrial Passive Air Conduction System (PACS). Energies 2020, 13, 3157. [Google Scholar] [CrossRef]
  3. Elhadad, S.; Rais, M.; Boumerzoug, A.; Baranyai, B. Assessing the impact of local climate on the building energy design: Case study Algeria-Egypt in hot and dry regions. In Proceedings of the International Conference, Istanbul, Turkey, 20–21 November 2019; pp. 21–24. [Google Scholar]
  4. Hughes, M.; Palmer, J.; Cheng, V.; Shipworth, D. Global sensitivity analysis of England’s housing energy model. J. Build. Perform. Simul. 2015, 8, 283–294. [Google Scholar] [CrossRef]
  5. Meng, X.; Wei, B.; Zhai, Y. Sensitivity Analysis of Envelope Design Parameters of Industrial Buildings with Natural Ventilation. Sustainability 2020, 12, 10288. [Google Scholar] [CrossRef]
  6. Hama Radha, C.A.; Elhadad, S.; Kistelegdi, I. Integrated Strategies for Sustainable Urban Renewal in Hot and Dry Climate. In New Metropolitan Perspectives. NMP 2020. Smart Innovation, Systems and Technologies; Bevilacqua, C., Calabrò, F., Della Spina, L., Eds.; Springer: Cham, Switzerland, 2020; Volume 178. [Google Scholar] [CrossRef]
  7. Al-Khawaja, M. Determination and selecting the optimum thickness of insulation for buildings in hot countries by accounting for solar radiation. Appl. Energy 2004, 24, 2601–2610. [Google Scholar] [CrossRef]
  8. Ucar, A. Thermoeconomic analysis method for optimization of insulation thickness for the four dierent climatic regions of Turkey. Energy 2010, 35, 1854–1864. [Google Scholar] [CrossRef]
  9. Huang, J.; Lv, H.; Gao, T.; Feng, W.; Chen, Y.; Zhou, T. Thermal properties optimization of envelope in energy-saving renovation of existing public buildings. Energy Build. 2014, 75, 504–510. [Google Scholar] [CrossRef]
  10. Messaouda, R.; Elhadad, S.; Boumerzoug, A. Optimum window position in the building façade for high day-light performance: Empirical study in hot and dry climate. Pollack Period. 2020, 15, 211–220. [Google Scholar] [CrossRef]
  11. Elhadad, S.; Baranyai, B.; Gyergyák, J.; Kistelegdi, I.; Salem, A. Passive design strategies for residential buildings in a hot desert climate in upper Egypt. In Proceedings of the Multidisciplinary Scientific GeoConference SGEM 2019, Albena, Bulgaria, 28 June–7 July 2019; Volume 19, pp. 495–502. [Google Scholar]
  12. Lomas, K.J.; Eppel, H. Sensitivity analysis techniques for building thermal simulation programs. Energy Build. 1992, 19, 21–44. [Google Scholar] [CrossRef]
  13. Fuerbringer, J.M. Sensitivity of Models and Measurements in the Airflow in Buildings with the Aid of Experimental Plans; Ecole Polytechnique Federale de Lausanne: Lausanne, Switzerland, 1994. [Google Scholar]
  14. Macdonald, I.A. Quantifying the Effects of Uncertainty in Building Simulation. Ph.D. Thesis, University of Strathclyde, Glasgow, Scotland, 2002. [Google Scholar]
  15. De Wit, M.S. Identification of the important parameters in thermal building simulation models. J. Stat. Comput. Simul. 1997, 57, 305–320. [Google Scholar] [CrossRef]
  16. Elhadad, S.; Radha, C.H.; Kistelegdi, I.; Baranyai, B.; Gyergyák, J. Model Simplification on Energy and Comfort Simulation Analysis for Residential Building Design in Hot and Arid Climate. Energies 2020, 13, 1876. [Google Scholar] [CrossRef] [Green Version]
  17. Litko, J.R. Sensitivity analysis for robust parameter design experiments. In Proceedings of the 37th Conference on Winter simulation, Winter Simulation Conference, Orlando, FL, USA; 2005; pp. 2020–2025. [Google Scholar]
  18. Lewandowska, A.; Foltynowicz, Z.; Podlesny, A. Comparative lca of industrial objects. Part 1. lca data quality assurance—sensitivity analysis and pedigree matrix. Int. J. Life Cycle Assess 2004, 9, 86–89. [Google Scholar] [CrossRef]
  19. Hopfe, C.J.; Hensen, J.; Plokker, W. Introducing uncertainty and sensitivity analysis in non-modifiable building performance software. In Proceedings of the 1st IBPSA Germany-Austrian Conference (BauSIM 2006), Munich, Germany, 9–11 October 2006. [Google Scholar]
  20. Hopfe, C.J.; Hensen, J.; Plokker, W. Uncertainty and sensitivity analysis for detailed design support. In Proceedings of the 10th IBPSA Building Simulation Conference, Tsinghua University, Beijing, China, 3–6 September 2007; Volume 3, pp. 1799–1804. [Google Scholar]
  21. Hopfe, C.J.; Hensen, J.L.M.; Plokker, W.; Wijsman, A.J.T.M. Model uncertainty and sensitivity analysis for thermal comfort prediction. In Proceedings of the 12th Symposium for Building Physics, Dresden, Germany, 29–31 March 2007; pp. 103–112. [Google Scholar]
  22. Hopfe, C.J. Uncertainty and sensitivity analysis in building performance simulation for decision support and design optimization. Ph.D. Thesis, Technische Universiteit Eindhoven, Eindhoven, The Netherlands, 2009. [Google Scholar]
  23. Gokhale, S.S. Model-based performance analysis using block coverage measurements. J. Syst. Softw 2009, 82, 121–130. [Google Scholar] [CrossRef]
  24. Beck, J.; Arnold, K. Parameter Estimation in Engineering and Science; John Wiley & Sons: New York, NY, USA, 1977. [Google Scholar]
  25. Hygh, J.S.; DeCarolis, J.F.; Hill, D.B.; Ranjithan, S.R. Multivariate regression as an energy assessment tool in early building design. Build Environ. 2012, 57, 165–175. [Google Scholar] [CrossRef]
  26. Hopfe, C.J.; Hensen, J.L.M. Uncertainty analysis in building performance simulation for design support. Energy Build. 2011, 43, 2798–2805. [Google Scholar] [CrossRef] [Green Version]
  27. Westphal, F.S.; Lamberts, R. Building simulation calibration using sensitivity analysis. In Proceedings of the 9th International Building Performance Simulation Association Conference, Montreal, Canada, 15–18 August 2005; pp. 1331–1338. [Google Scholar]
  28. Sun, J.; Reddy, T.A. Calibration of Building Energy Simulation Programs Using the Analytic Optimization Approach (RP-1051). HVAC&R Res. 2006, 12, 177–196. [Google Scholar]
  29. Gustafsson, S.-I. Sensitivity analysis of building energy retrofits. Appl. Energy 1998, 61, 13–23. [Google Scholar] [CrossRef]
  30. Lam, J.C.; Wan, K.K.W.; Yang, L. Sensitivity analysis and energy conservation measures implications. Energy Convers. Manag 2008, 49, 3170–3177. [Google Scholar] [CrossRef]
  31. Tian, W.; Choudhary, R.A. probabilistic energy model for non-domestic building sectors applied to analysis of school buildings in greater London. Energy Build. 2012, 54, 1–11. [Google Scholar] [CrossRef] [Green Version]
  32. Moran, F.; Natarajan, S.; Nikolopoulou, M. Developing a database of energy use for historic dwellings in Bath, UK. Energy Build. 2012, 55, 218–226. [Google Scholar] [CrossRef]
  33. Tian, W.; de Wilde, P. Uncertainty and sensitivity analysis of building performance using probabilistic climate projections: A UK case study. Autom. Constr. 2011, 20, 1096–1109. [Google Scholar] [CrossRef]
  34. de Wilde, P.; Tian, W. Preliminary application of a methodology for risk assessment of thermal failures in buildings subject to climate change. In Proceedings of the 11th International Building Performance Simulation Association Conference, Glasgow, Scotland, 27–30 July 2009; pp. 2077–2084. [Google Scholar]
  35. Goffart, J.; Rabouille, M.; Mendes, N. Uncertainty and sensitivity analysis applied to hygrothermal simulation of a brick building in a hot and humid climate. J. Build. Perform. Simul 2017, 10, 37–57. [Google Scholar] [CrossRef]
  36. Yu, J.; Tian, L.; Yang, C.; Xu, X.; Wang, J. Sensitivity analysis of energy performance for high-rise residential envelope in hot summer and cold winter zone of China. Energy Build. 2013, 64, 264–274. [Google Scholar] [CrossRef]
  37. Eisenhower, B.; O’Neill, Z.; Fonoberov, V.A.; Mezić, I. Uncertainty and sensitivity decomposition of building energy models. J. Build. Perform. Simul 2012, 5, 171–184. [Google Scholar] [CrossRef]
  38. Spitz, C.; Mora, L.; Wurtz, E.; Jay, A. Practical application of uncertainty analysis and sensitivity analysis on an experimental house. Energy Build. 2012, 55, 459–470. [Google Scholar] [CrossRef]
  39. Mechri, H.E.; Capozzoli, A.; Corrado, V. USE of the ANOVA approach for sensitive building energy design. Appl. Energy 2010, 87, 3073–3083. [Google Scholar] [CrossRef]
  40. Heiselberg, P.; Brohus, H.; Hesselholt, A.; Rasmussen, H.; Seinre, E.; Thomas, S. Application of sensitivity analysis in design of sustainable buildings. Renew. Energy 2009, 34, 2030–2036. [Google Scholar] [CrossRef] [Green Version]
  41. Morris, M.D. Factorial sampling plans for preliminary computational experiments. Technometrics 1991, 33, 161–174. [Google Scholar] [CrossRef]
  42. Heo, Y.; Augenbroe, G.; Graziano, D.; Muehleisen, R.T.; Guzowski, L. Scalable methodology for large scale building energy improvement: Relevance of calibration in model-based retrofit analysis. Build Environ 2015, 87, 342–350. [Google Scholar] [CrossRef] [Green Version]
  43. Song, J.; Wei, L.; Sun, Y.; Tian, W. Implementation of Meta-modelling for Sensitivity Analysis in Building Energy Analysis. In Proceedings of the eSim 2014 Canada’s Building Simulation Conference, Ottawa, Canada, 7–10 May 2014. [Google Scholar]
  44. Elhadad, S.; Baranyai, B.; Gyergyák, J. The impact of building orientation on energy performance: A case study in new Minia, Egypt. Pollack Period. 2018, 13, 31–40. [Google Scholar] [CrossRef]
  45. Attia, S.; Gratia, E.; De Herde, A.; Hensen, J.L.M. Simulation-based decision support tool for early stages of zero-energy building design. Energy Build. 2012, 39, 2–15. [Google Scholar]
  46. Saltelli, A.; Tarantola, S.; Campolongo, F.; Ratto, M. Sensitivity Analysis in Practice; John Wiley & Sons: Chichester, UK, 2004. [Google Scholar]
  47. Tian, W.; Song, J.; Li, Z.; de Wilde, P. Bootstrap techniques for sensitivity analysis and model selection in building thermal performance analysis. Appl. Energy 2014, 135, 320–328. [Google Scholar] [CrossRef]
  48. Tian, W. A review of sensitivity analysis methods in building energy analysis. Renew. Sustain. Energy Rev. 2013, 20, 411–419. [Google Scholar] [CrossRef]
  49. Tian, W.; Yang, S.; Li, Z.; Wei, S.; Pan, W.; Liu, Y. Identifying informative energy data in Bayesian calibration of building energy models. Energy Build. 2016, 119, 363–376. [Google Scholar] [CrossRef]
  50. Mara, T.; Tarantola, S. Application of global sensitivity analysis of model output to building thermal simulations. Build. Simul. 2008, 1, 290–302. [Google Scholar] [CrossRef] [Green Version]
  51. Sanchez, D.G.; Lacarrière, B.; Musy, M.; Bourges, B. Application of sensitivity analysis in building energy simulations: Combining first- and second-order elementary effects methods. Energy Build. 2014, 68, 741–750. [Google Scholar] [CrossRef] [Green Version]
  52. Heo, Y.; Choudhary, R.; Augenbroe, G.A. Calibration of building energy models for retrofit analysis under uncertainty. Energy Build. 2012, 47, 550–560. [Google Scholar] [CrossRef]
  53. Corrado, V.; Mechri, H.E. Uncertainty and sensitivity analysis for building energy rating. J. Build. Phys. 2009, 33, 125–156. [Google Scholar] [CrossRef]
  54. de Wit, S.; Augenbroe, G. Analysis of uncertainty in building design evaluations and its implications. Energy Build. 2002, 34, 951–958. [Google Scholar] [CrossRef]
  55. Moon, H.J. Uncertainty analysis in mould spore transportation and its application in an existing building. Indoor Built Environ. 2010, 19, 355–365. [Google Scholar] [CrossRef]
  56. Hyun, S.; Park, C.; Augenbroe, G. Analysis of uncertainty in natural ventilation predictions of high-rise apartment buildings. Build. Serv. Eng. Res. Technol. 2008, 29, 311–326. [Google Scholar] [CrossRef]
  57. Shen, H.; Tzempelikos, A. Sensitivity analysis on daylighting and energy performance of perimeter offices with automated shading. Build. Environ. 2013, 59, 303–314. [Google Scholar] [CrossRef]
  58. Flores, R.R.; Bertagnolio, S.; Lemort, V. Global Sensitivity Analysis applied to Total Energy Use in Buildings. In Proceedings of the International High Performance Buildings Conference, Purdue, France, 16–19 July 2012; p. 3484. [Google Scholar]
  59. de Wilde, P.; Tian, W. Identification of key factors for uncertainty in the prediction of the thermal performance of an office building under climate change. Build. Simul. 2009, 2, 157–174. [Google Scholar] [CrossRef]
  60. Yildiz, Y.; Korkmaz, K.; Göksal Özbalta, T.; Arsan, D.Z. An approach for developing sensitive design parameter guidelines to reduce the energy requirements of low-rise apartment buildings. Appl. Energy 2012, 93, 337–347. [Google Scholar] [CrossRef] [Green Version]
  61. Domínguez-Muñoz, F.; Cejudo-López, J.M.; Carrillo-Andrés, A. Uncertainty in peak cooling load calculations. Energy Build. 2010, 42, 1010–1018. [Google Scholar] [CrossRef]
  62. Breesch, H.; Janssens, A. Performance evaluation of passive cooling in office buildings based on uncertainty and sensitivity analysis. Solar Energy. 2010, 84, 1453–1467. [Google Scholar] [CrossRef]
  63. Struck, C.; Hensen, J.; Kotek, P. On the application of uncertainty and sensitivity analysis with abstract building performance simulation tools. J. Build. Phys. 2009, 33, 5–27. [Google Scholar] [CrossRef] [Green Version]
  64. Ballarini, I.; Corrado, V. Analysis of the building energy balance to investigate the effect of thermal insulation in summer conditions. Energy Build. 2012, 52, 168–180. [Google Scholar] [CrossRef]
  65. Tian, W.; de Wilde, P. Sampling-based sensitivity analysis of thermal performance in domestic buildings under climate change. In Proceedings of the EG-ICE (European Group for Intelligient Computing in Engineering), Enschede, The Netherlands, 6–8 July 2011. [Google Scholar]
  66. Wright, J.A.; Wang, M.; Brownlee, A.E.I.; Buswell, R.A. Variable convergence in evolutionary optimization and its relationship to sensitivity analysis. In Proceedings of the First Building Simulation and Optimization Conference, Loughborough, UK, 10–11 September 2012. [Google Scholar]
  67. Brohus, H.; Heiselberg, P.; Simonsen, A.; Sřrensen, K.C. Uncertainty of Energy Consumption assessment of domestic buildings. In Proceedings of the 11th International Building Performance Simulation Association Conference, Glasgow, Scotland, 27–30 July 2009; pp. 1022–1029. [Google Scholar]
  68. Zhao, F. Agent-based modeling of commercial building stocks for energy policy and demand response analysis. Ph.D. Thesis, Georgia Institute of Technology, Atlanta, GA, USA, 2012. [Google Scholar]
  69. Zhao, J.; Xin, Y.; Tong, D. Energy consumption quota of public buildings based on statistical analysis. Energy Policy. 2012, 43, 362–370. [Google Scholar] [CrossRef]
  70. de Wilde, P.; Tian, W. Predicting the performance of an office under climate change: A study of metrics, sensitivity and zonal resolution. Energy Build. 2010, 42, 1674–1684. [Google Scholar] [CrossRef]
  71. Saltelli, A.; Ratto, M.; Andres, T.; Campolongo, F.; Cariboni, J.; Gatelli, D.; Saisana, M.; Tarantola, S. Global sensitivity analysis: The primer, Wiley-Interscience. John Wiley & Sons Ltd.: West Sussex, UK, 2008. [Google Scholar]
  72. Chow, W.K.; Chan, K.T. Parameterization study of the overall thermal-transfer value equation for buildings. Appl. Energy 1995, 50, 247–268. [Google Scholar] [CrossRef]
  73. Macdonald, I.A.; Strachan, P. Practical application of uncertainty analysis. Energy Build. 2001, 33, 219–227. [Google Scholar] [CrossRef]
  74. Brohus, H.; Frier, C.; Heiselberg, P.; Haghighat, F. Quantification of uncertainty in predicting building energy consumption: A stochastic approach. Energy Build. 2012, 55, 127–140. [Google Scholar] [CrossRef] [Green Version]
  75. Reddy, T.A.; Maor, I.; Jian, S.; Panjapornporn, C. Procedures for Reconciling Computer-Calculated Results with Measured Energy Data; Technical Report; American Society of Heating, Refrigerating and Air-Conditioning.Engineers: Atlanta, GA, USA, 2006. [Google Scholar]
  76. Batog, P.; Badura, M. Dynamic of Changes in Carbon Dioxide Concentration in Bedrooms. Procedia Eng. 2013, 57, 175–182. [Google Scholar] [CrossRef] [Green Version]
Figure 1. IDA-ICE model of the case study.
Sustainability 13 14018 g001
Figure 2. Occupancy and lighting schedules on weekdays and weekend for different thermal zones (a,b) living room; (c,d) bedroom; (e,f) children room; (g,h) kitchen; and (i,j) toilet.
Sustainability 13 14018 g002aSustainability 13 14018 g002b
Figure 3. Average monthly air temperature and relative humidity.
Sustainability 13 14018 g003
Figure 4. Structure of methodology.
Sustainability 13 14018 g004
Figure 5. Sensitivity coefficient of thickness change parameters.
Sustainability 13 14018 g005
Figure 6. Sensitivity coefficient for different materials.
Sustainability 13 14018 g006
Figure 7. Sensitivity coefficient of density, specific heat, and thermal conductivity parameters.
Sustainability 13 14018 g007
Table 1. The used materials in the construction of the investigated building (reference).
ComponentMaterialThickness (m)Conductivity (W/m K)Density (kg/m3)Specific Heat (J/(kg K))U-Value
Exterior WallGypsum5.0E-40.298008400.4518
Plasterboards0.020.241000840
Air gap0.050.171.21006
Brick0.110.581500840
Baumit noble plaster0.0020.931500880
Interior WallPlasterboard0.0150.2410008401.752
Brick0.160.581500840
Plasterboard0.190.241000840
DoorWood0.050.1450023001.897
Internal FloorsFloor coating0.020.1811009200.32
L/W concrete0.060.155001050
heavy insulation0.040.05292982
concrete0.21.72300880
RoofLight insulation0.20.036207500.172
concrete0.151.72300880
External FloorFloor coating0.0050.1811009202.9
concrete0.251.72300880
Basement wall towards GroundRender0.010.818007903.332
Concrete0.21.72300880
Slab on groundPlasterboard0.0640.412508401.12
Air in 30 mm vert.air gap0.30.171.21006
Plasterboard0.020.41250840
reinforced concrete screed0.01551.552400840
gravel0.50.351800840
Table 2. Glass parameters.
Solar Heat Gain Coefficient (SHGC)T, Solar TransmittanceTvis, Visible TransmittanceGlazing U-Value W/m2KInternal EmissivityExternal Emissivity
Glass0.520.500.710.800.8370.837
Table 3. Parameters and parameter ranges used in sensitivity analysis.
Description of ParametersNameRange *TypeDistribution
Thickness
(m)
BasementX10.21–0.30ContinuesUniform
Exterior floorX20.20–0.30ContinuesUniform
Interior floorX30.15–0.25ContinuesUniform
Exterior wallX40.15–0.25ContinuesUniform
Interior walX50.11–0.20ContinuesUniform
RoofX60.20–0.35ContinuesUniform
Ground slabX70.12–0.25ContinuesUniform
MaterialExterior floorX8100, 101, …, 103DiscreteUniform
Exterior wallX9200, 201, …, 205DiscreteUniform
Interior wallX10300, 301, …, 303DiscreteUniform
Glazing typeX11400, 401, …, 404DiscreteUniform
Density
(kg/m3)
BasementX122100–2500ContinuesUniform
Exterior floorX132100–2500ContinuesUniform
Interior floorX142100–2500ContinuesUniform
Exterior wallX151500–1800ContinuesUniform
Interior wallX161500–1800ContinuesUniform
RoofX172100–2500ContinuesUniform
Ground slabX182100–2500ContinuesUniform
Specific heat
((J/kg K)
BasementX19672–880ContinuesUniform
Exterior floorX20672–880ContinuesUniform
Interior floorX21672–1050ContinuesUniform
Exterior wallX22800–840ContinuesUniform
Interior wallX23800–840ContinuesUniform
RoofX24672–880ContinuesUniform
Ground slabX25672–840ContinuesUniform
Thermal conductivity
(W/mK)
BasementX261.07–1.7ContinuesUniform
Exterior floorX271.07–1.7ContinuesUniform
Interior floorX281.07–1.7ContinuesUniform
Exterior wallX290.58–0.73ContinuesUniform
Interior wallX300.58–0.73ContinuesUniform
RoofX311.07–1.7ContinuesUniform
Ground slabX321.07–1.7ContinuesUniform
Infiltration rate (m3/s)Infiltration rateX330.2–2.0ContinuesUniform
* For discrete parameters, each number in IDA-ICE represents a codified name of a building element (e.g., 101 indicates “Exterior floor-joist floor against”).
Publisher’s Note: MDPI stays neutral with regard to jurisdictional claims in published maps and institutional affiliations.

