Effectiveness of Active Luminous Lane Markings on Highway at Night: A Driving Simulation Study


Abstract
:1. Introduction
2. Methods
2.1. Scenes Design
2.2. Participants
2.3. Experimental Procedure
2.4. Data Analysis
3. Results and Discussion
3.1. Pupil Area Change Rate.
3.2. Driver’s Physical Load
3.3. Brake Distance
3.4. Lane Departure
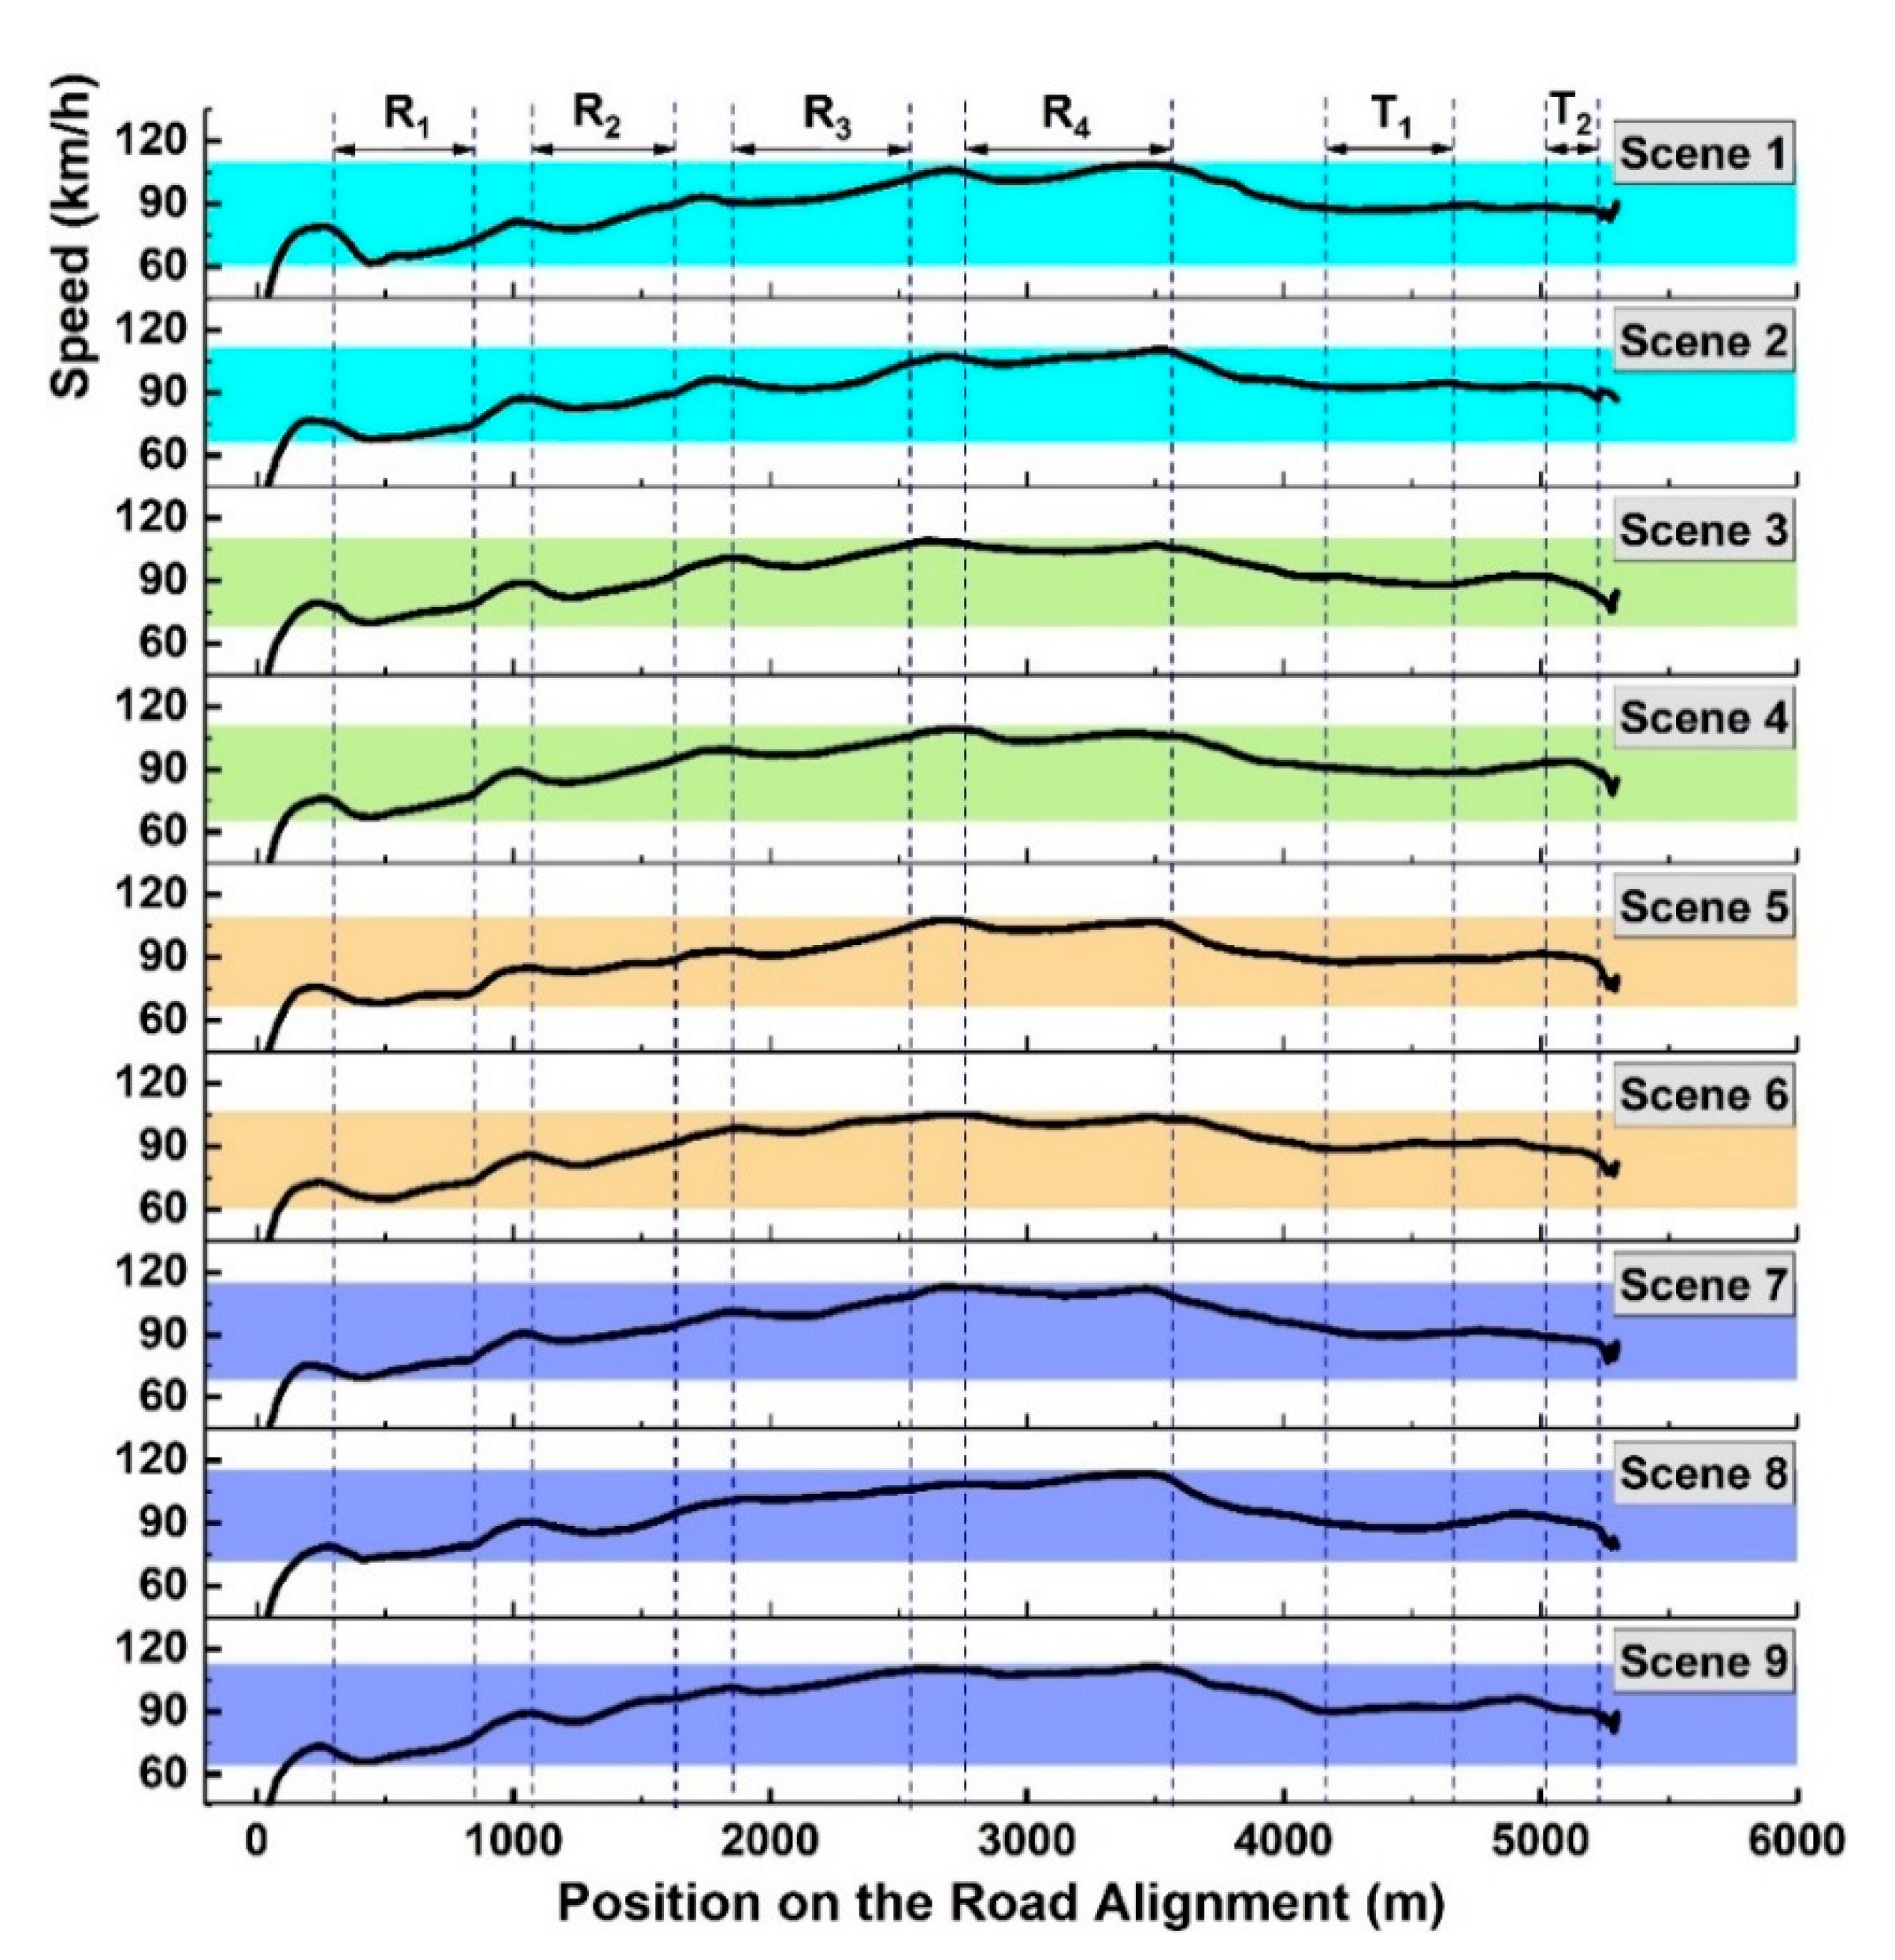
3.5. Operating Speed
3.6. The Overall Comprehensive Effectiveness Evaluation
3.7. Application Prospect Analysis
4. Conclusions
- The active luminous lane markings had a better visual recognition performance at night, which was improved by about two times compared to the passive luminous lane markings.
- Compared with the passive luminous lane markings, the active luminous lane markings can reduce the mental and physical loads of drivers, increase the early braking distance by approximately two times, improve the lane-keeping ability by approximately 31%, smoothing the operating speed and be more conducive to improving traffic efficiency and stability. These improvements have great potential for enhancing road safety in night conditions.
- For the specific parameter settings of the active luminous lane markings on highways at night, the yellow lane markings were better than the white ones, the point-line-type lane markings were superior to those of the conventional-type ones, and the blinking frequency was reasonable to set, at a moderate level, as 40 times per min.
Author Contributions
Funding
Data Availability Statement
Conflicts of Interest
References
- Tang, C.; He, Y.; Gao, H. National Standards of the People’s Republic of China, Road Traffic Signs and Markings (GB 5768-2009); China National Standardization Administration: Beijing, China, 2009.
- Babic, D.; Scukanec, A.; Babic, D. Determining the Impact of Directionality on Road Markings Retroreflectivity Using Dynamic Method. Transport 2018, 33, 1095–1103. [Google Scholar]
- European Co-operation in the Field of Scientific and Technical Research; Directorate-General Transport, European Commission. COST 331: Requirements for Horizontal Road Marking: Final Report of the Action; Office for Official Publications of the European Communities: Luxembourg, 1999; Volume 331. [Google Scholar]
- Chapman, B. Cost-Effective Marking and Delineation Materials for Highways; State of California, Department of Transportation, Division of New Technology, Materials and Research: Sacramento, CA, USA, 1994; Volume 94. [Google Scholar]
- Oh, H.U.; Mun, S. Broken-line Markings Preferred under High-speed Conditions for Visibility. KSCE J. Civ. Eng. 2018, 22, 3130–3136. [Google Scholar] [CrossRef]
- Fotios, S.; Gibbons, R. Road lighting research for drivers and pedestrians: The basis of luminance and illuminance recommendations. Light. Res. Technol. 2018, 50, 154–186. [Google Scholar] [CrossRef]
- Smadi, O.; Hawkins, N.; Aldemir-Bektas, B.; Carlson, P.; Pike, A.; Davies, C. Recommended Laboratory Test for Predicting the Initial Retroreflectivity of Pavement Markings from Glass Bead Quality. Transp. Res. Rec. 2014, 2440, 94–102. [Google Scholar] [CrossRef]
- Li, D.; Zhang, G.; Feng, Z.; Liu, H.; Xu, D. Research Progress on Rainy Night Visibility Test Method for Road Lane markings at Home and Abroad. J. Highw. Transp. Res. Dev. 2017, 02, 241. [Google Scholar]
- Sungmin, H.; Soyoung, J.; Cheol, O. A Novel Method to Integrate Speed and Emissions Characteristics in Pavement Marking Design. KSCE J. Civ. Eng. 2018, 22, 5178–5186. [Google Scholar]
- Hautière, N.; Dumont, E.; Brémond, R.; Ledoux, V. Review of the Mechanisms of Visibility Reduction by Rain and Wet Road. In Proceedings of the 8th International Symposium on Automotive Lighting, München, Germany, 29–30 September 2009. [Google Scholar]
- Nance, J.; Sparks, T.D. From streetlights to phosphors: A review on the visibility of roadway markings. Prog. Org. Coat. 2020, 148, 105749. [Google Scholar] [CrossRef]
- Costa, M.; Lantieri, C.; Vignali, V.; Ghasemi, N.; Simone, A. Evaluation of an integrated lighting-warning system on motorists’ yielding at unsignalized crosswalks during nighttime. Transp. Res. Part F 2020, 68, 132–143. [Google Scholar] [CrossRef]
- Lantieri, C.; Costa, M.; Vignali, V.; Acerra, E.M.; Marchetti, P.; Simone, A. Flashing in-curb LEDs and beacons at unsignalized crosswalks and driver’s visual attention to pedestrians during nighttime. Ergonomics 2020, 1–12. [Google Scholar] [CrossRef]
- Zhai, B.; Xu, H.; Zhuo, F.; Huang, Y. Annealing temperature dependent photoluminescence and afterglow of undoped CaAl2O4. J. Alloys Compd. 2020, 821, 153563. [Google Scholar] [CrossRef]
- Yamashita, M.; Imamura, T.; Matsumoto, S.; Murakami, M.; Hongo, T.; Akai, T.; Iwamoto, Y. Enhancement of afterglow luminescence of long-lasting phosphor-glass composite by using refractive index matched glass. Key Eng. Mater. 2016, 702, 113–117. [Google Scholar] [CrossRef]
- Arras, J.; Brase, S. The world needs new colors: Cutting edge mobility focusing on long persistent luminescence materials. ChemPhotoChem 2018, 2, 55–66. [Google Scholar] [CrossRef]
- Lv, N. Research on Self-illuminated Traffic Safety Signs of Rural Roads. China Highw. Mag. 2013, 7, 237–243. [Google Scholar]
- Liang, B.; Li, S.; Li, S. Self-Storage and Auto-Luminous Emergency Escape System in Tunnel. Transp. Stand. 2014, 42, 189. [Google Scholar]
- Xu, J.; Chen, C.; Wan, H.; Dai, J. Research and Application of Afterglow Pavement Self-Luminescent Coatings. Technol. Highw. Transp. 2017, 33, 6. [Google Scholar]
- Ibarra, C.; Rice, E. LED Raised Pavement Markers; Department of Transportation FHWA: Washington, DC, USA, 2009.
- Wu, T. Intelligent Variable Road Traffic Marking; CN 101538834A; China National Intellectual Property Administration: Beijing, China, 2009. [Google Scholar]
- Zhang, Y. Position Adjustable Road Double Yellow Line; CN 102635078A; China National Intellectual Property Administration: Beijing, China, 2012. [Google Scholar]
- Wang, Q.; Zhu, J.; Tai, D. Traffic Marking with Traffic Signal Function and Changeable Lane Indicator Line; CN 107012805A; China National Intellectual Property Administration: Beijing, China, 2017.
- Zhao, X.; Ju, Y.; Li, H.; Zhang, C.; Ma, J. Safety of raised pavement markers in freeway tunnels based on driving behavior. Accid. Anal. Prev. 2020, 145, 105708. [Google Scholar] [CrossRef]
- Lin, P.; Ozkul, S.; Guo, R.; Chen, C. Assessment of countermeasure effectiveness and informativeness in mitigating wrong-way entries onto limited-access facilities. Accid. Anal. Prev. 2018, 116, 79–93. [Google Scholar] [CrossRef]
- Babic, D.; Fiolic, M.; Babic, D.; Gates, T. Road Markings and Their Impact on Driver Behaviour and Road Safety: A Systematic Review of Current Findings. J. Adv. Transp. 2020. [Google Scholar] [CrossRef]
- Theeuwes, J. Self explaining roads: Subjective categorisation of road environments. In Vision in Vehicles; Gale, G., Brown, I.D., Haslegrave, C.M., Taylor, S.P., Eds.; North-Holland: Amsterdam, The Netherlands, 1998. [Google Scholar]
- Mosbock, H.; Burghardt, T.E. The importance of road markings for road safety and modern traffic management. In Proceedings of the 1st European Road Infrastructure Congress, Leeds, UK, 18–20 October 2016. [Google Scholar]
- Ghasemi, N.; Acerra, E.; Vignali, V.; Lantieri, C.; Simone, A.; Imine, H. Road Safety Review update by using innovative technologies to investigate driver behavior. Transp. Res. Procedia 2020, 45, 368–375. [Google Scholar] [CrossRef]
- Zhao, X.; Ju, Y.; Li, J.; Tao, P.; Wang, X.; Zhou, R. Evaluation of the Effect of RPMs in Extra-long Tunnels Based on Driving Behavior and Visual Characteristics. China J. Highw. Transp. 2020, 33, 29–41. [Google Scholar]
- Chow, S.C.; Shao, J.; Wang, H.; Lokhnygina, Y. Sample Size Calculations in Clinical Research; Taylor & Francis: London, UK, 2007. [Google Scholar]
- Fu, R.; Liu, T.; Guo, Y.; Zhang, S.; Cheng, W. A Case Study in China to Determine Whether GPS Data and Derivative Indicator Can Be Used to Identify Risky Drivers. J. Adv. Transp. 2019. [Google Scholar] [CrossRef]
- Zhang, L.; Kong, J.; Cui, B.; Fu, T. Safety Effects of Freeway Roadside Electronic Billboards on Visual Properties of Drivers: Insights from Field Experiments. J. Transp. Eng. Part A Syst. 2020, 146, 04019071. [Google Scholar] [CrossRef]
- Horberry, T.; Anderson, J.; Regan, M.A. The possible safety benefits of enhanced road markings: A driving simulator evaluation. Transp. Res. Part F Traffic Psychol. Behav. 2006, 9, 77–87. [Google Scholar] [CrossRef]
- Bella, F.; Silvestri, M. Driver’s braking behavior approaching pedestrian crossings: A parametric duration model of the speed reduction times. J. Adv. Transp. 2016, 50, 630–646. [Google Scholar] [CrossRef] [Green Version]
- Chang, K.; Ramirez, M.V.; Dyre, B.; Mohamed, M.; Abdel-Rahim, A. Effects of longitudinal pavement edgeline condition on driver lane deviation. Accid. Anal. Prev. 2019, 128, 87–93. [Google Scholar] [CrossRef]
- Liu, Y.; Wong, C.K. Refining Lane-Based Traffic Signal Settings to Satisfy Spatial Lane Length Requirements. J. Adv. Transp. 2017. [Google Scholar] [CrossRef] [Green Version]
- Ranney, T.A.; Gawron, V.J. The effects of pavement edgelines on performance in a driving simulator under sober and alcohol-dosed conditions. Hum. Factors 1986, 28, 511–525. [Google Scholar] [CrossRef]
- Xue, C.; Zhou, H.; Xu, D.; Liu, P. Field Verification of Directional Rumble Strips to Deter Wrong-Way Freeway Driving. J. Transp. Eng. Part A Syst. 2019, 145, 04019031. [Google Scholar] [CrossRef]
- Zhu, B.; Guo, Z.; Song, C. Fiber-Optic Parameters of Light Emitting Diode Active-Luminous Traffic Markings Based on Light-Transmitting Concrete. Tongji Daxue Xuebao 2019, 47, 802–809. [Google Scholar]
- Gholikhani, M.; Tahami, S.A.; Khalili, M.; Dessouky, S. Electromagnetic Energy Harvesting Technology: Key to Sustainability in Transportation Systems. Sustainability 2019, 11, 4906. [Google Scholar] [CrossRef] [Green Version]
- Mao, L.; Li, W.; Hu, P.; Zhou, G.; Zhang, H.; Dai, J. Design of Real-Time Dynamic Reversible Lane in Intelligent Cooperative Vehicle Infrastructure System. J. Adv. Transp. 2020. [Google Scholar] [CrossRef]


| Scenes | Parameters of Lane Markings | ||||
|---|---|---|---|---|---|
| Shape of Lane Markings | Color | Whether it is Active Luminous or Not | Whether it is Blinking or Not | Blinking Frequency (times/min) | |
| Scene 1 | conventional type | white | no | no | - |
| Scene 2 | conventional type | yellow | no | no | - |
| Scene 3 | conventional type | white | yes | no | - |
| Scene 4 | conventional type | yellow | yes | no | - |
| Scene 5 | point-line type | white | yes | no | - |
| Scene 6 | point-line type | yellow | yes | no | - |
| Scene 7 | point-line type | yellow | yes | yes | 20 |
| Scene 8 | point-line type | yellow | yes | yes | 40 |
| Scene 9 | point-line type | yellow | yes | yes | 60 |
| Position on the Road Alignment (m) | Types of Road Alignment | Radius (m) | Direction | Length (m) | Code Name | Notes |
|---|---|---|---|---|---|---|
| K0 + 000–K0 + 300 | Straight line | - | - | 300 | S1 | - |
| K0 + 300–K0 + 840 | Circular curve | 250 | Left turn | 540 | R1 | With a 70-m transition curve at both ends |
| K0 + 840–K1 + 080 | Straight line | - | - | 240 | S2 | - |
| K1 + 080–K1 + 620 | Circular curve | 400 | Right turn | 540 | R2 | With a 70-m transition curve at both ends |
| K1 + 620–K1 + 860 | Straight line | - | - | 240 | S3 | - |
| K1 + 860–K2 + 530 | Circular curve | 700 | Left turn | 670 | R3 | With an 85-m transition curve at both ends |
| K2 + 530–K2 + 770 | Straight line | - | - | 240 | S4 | - |
| K2 + 770–K3 + 570 | Circular curve | 1000 | Right turn | 800 | R4 | With a 100-m transition curves at both ends |
| K3 + 570–K4 + 170 | Straight line | - | - | 600 | S5 | - |
| K4 + 170–K4 + 670 | Straight line | - | - | 500 | T1 | Long tunnel with lighting lamps |
| K4 + 670–K5 + 010 | Straight line | - | - | 340 | S6 | - |
| K5 + 010–K5 + 210 | Straight line | - | - | 200 | T2 | Short tunnel without lighting lamps |
| K5 + 210–K5 + 300 | Straight line | - | - | 90 | S7 | - |
| Type | With the Vehicle Beams on | With the Vehicle Beams off |
|---|---|---|
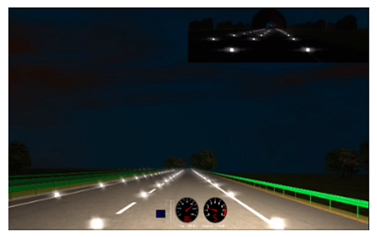
| 1 | Conventional type, white, passive luminous | |
 | 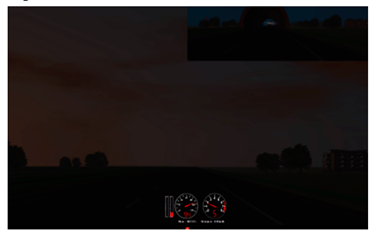 | |
| 2 | Conventional type, yellow, passive luminous | |
 | 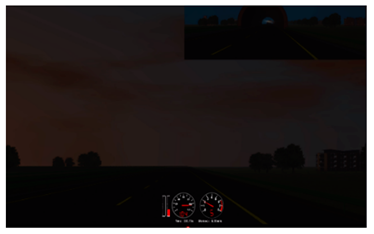 | |
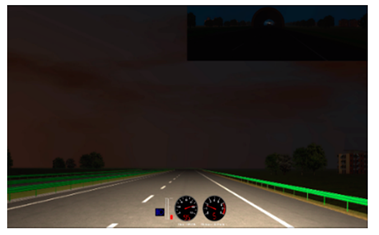
| 3 | Conventional type, white, active luminous | |
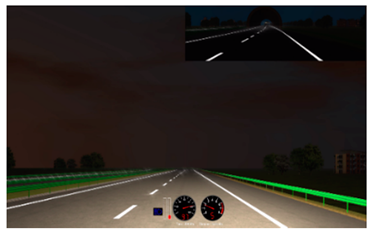 |  | |
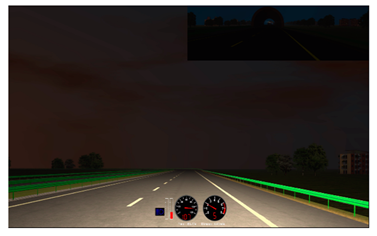
| 4 | Conventional type, yellow, active luminous | |
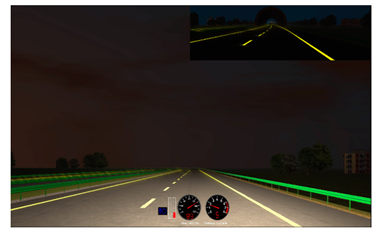 | 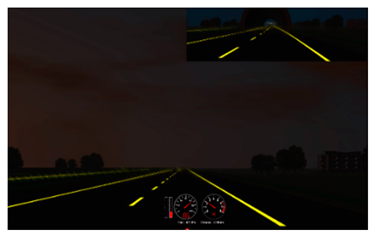 | |
| 5 | Point-line type, white, active luminous | |
 | 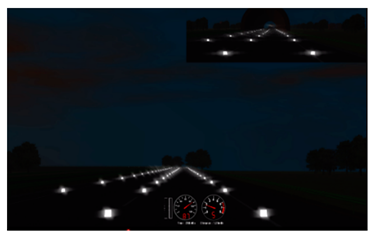 | |
| 6 | Point-line type, yellow, active luminous | |
 | 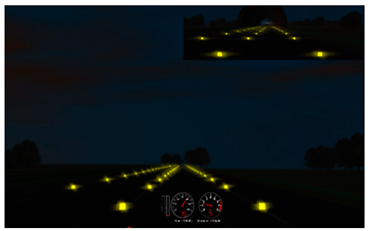 | |
| Indicators | Mean (SD) | F | P | ||||||||
|---|---|---|---|---|---|---|---|---|---|---|---|
| Scene 1 | Scene 2 | Scene 3 | Scene 4 | Scene 5 | Scene 6 | Scene 7 | Scene 8 | Scene 9 | |||
| Pupil area change rate (%) | 1.61 (2.82) | 1.46 (2.45) | 1.35 (1.64) | 1.28 (1.64) | 1.28 (1.59) | 1.26 (2.38) | 1.29 (1.47) | 1.14 (1.35) | 1.24 (1.67) | 5.11 | 2.24 × 10⁻⁶ ** |
| Steering wheel speed (°/s) | 0.81 (1.36) | 0.81 (1.28) | 0.79 (1.35) | 0.77 (1.26) | 0.75 (1.26) | 0.75 (1.24) | 0.83 (1.39) | 0.74 (1.16) | 0.73 (1.20) | 0.82 | 0.58 |
| Brake pedal force (N) | 1.95 (4.34) | 1.64 (3.49) | 1.47 (2.94) | 1.81 (3.15) | 1.33 (2.91) | 1.14 (2.20) | 1.32 (2.48) | 1.42 (3.28) | 1.56 (3.16) | 6.86 | 4.95 × 10⁻⁹ ** |
| Gas pedal (%) | 14.25 (6.39) | 15.16 (7.77) | 14.69 (6.53) | 16.60 (7.24) | 15.08 (7.41) | 15.91 (7.15) | 15.07 (6.45) | 16.12 (7.41) | 16.73 (8.86) | 13.92 | 0 ** |
| Lane departure (m) | 0.09 (0.25) | 0.04 (0.26) | 0.08 (0.25) | 0.04 (0.25) | 0.05 (0.25) | 0.02 (0.26) | 0.005 (0.23) | 0.00007 (0.23) | 0.01 (0.21) | 37.67 | 0 ** |
| Operating speed (km/h) | 88.51 (13.38) | 91.11 (13.22) | 91.52 (13.24) | 91.83 (12.72) | 89.52 (12.75) | 89.74 (13.20) | 93.44 (14.10) | 93.41 (13.57) | 93.42 (14.71) | 19.99 | 0 ** |
| Scene 1 | Scene 2 | Scene 3 | Scene 4 | Scene 5 | Scene 6 | Scene 7 | Scene 8 | Scene 9 | |
|---|---|---|---|---|---|---|---|---|---|
| 0.80 | 0.80 | 0.60 | 0.40 | 0.20 | 0.20 | 1.00 | 0.10 | 0.00 | |
| 1.00 | 0.62 | 0.41 | 0.83 | 0.23 | 0.00 | 0.22 | 0.35 | 0.52 | |
| 0.00 | 0.37 | 0.18 | 0.95 | 0.33 | 0.67 | 0.33 | 0.75 | 1.00 | |
| −1.80 | −1.05 | −0.83 | −0.28 | −0.10 | 0.47 | −0.89 | 0.31 | 0.48 |
| Scheme 1 | D1 (R1) | D2 (R2) | D3 (R3) | D4 (R4) | D5 (T1) | D6 (T2) | Average | SD |
|---|---|---|---|---|---|---|---|---|
| Scene 1 | 50 | 30 | 15 | 5 | 80 | 35 | 36 | 23 |
| Scene 2 | 40 | 25 | 15 | 10 | 145 | 30 | 44 | 43 |
| Scene 3 | 75 | 45 | 35 | 30 | 305 | 95 | 98 | 88 |
| Scene 4 | 90 | 50 | 40 | 40 | 290 | 90 | 100 | 81 |
| Scene 5 | 115 | 55 | 60 | 50 | 350 | 125 | 126 | 97 |
| Scene 6 | 135 | 75 | 45 | 55 | 375 | 120 | 134 | 104 |
| Scene 7 | 120 | 70 | 35 | 50 | 325 | 45 | 108 | 94 |
| Scene 8 | 170 | 90 | 55 | 50 | 425 | 50 | 140 | 124 |
| Scene 9 | 175 | 85 | 75 | 35 | 375 | 75 | 137 | 106 |
| Scenes | Area above the Zero Line | Area below the Zero Line | Total Area |
|---|---|---|---|
| Scene 1 | 860 | 395 | 1255 |
| Scene 2 | 690 | 485 | 1175 |
| Scene 3 | 785 | 375 | 1160 |
| Scene 4 | 660 | 435 | 1095 |
| Scene 5 | 470 | 610 | 1080 |
| Scene 6 | 365 | 655 | 1020 |
| Scene 7 | 505 | 480 | 985 |
| Scene 8 | 460 | 405 | 865 |
| Scene 9 | 475 | 470 | 945 |
| Scene 1 | Scene 2 | Scene 3 | Scene 4 | Scene 5 | Scene 6 | Scene 7 | Scene 8 | Scene 9 | |
|---|---|---|---|---|---|---|---|---|---|
| 1.00 | 0.68 | 0.45 | 0.30 | 0.30 | 0.26 | 0.32 | 0.00 | 0.21 | |
| 0.80 | 0.80 | 0.60 | 0.40 | 0.20 | 0.20 | 1.00 | 0.10 | 0.00 | |
| 1.00 | 0.62 | 0.41 | 0.83 | 0.23 | 0.00 | 0.22 | 0.35 | 0.52 | |
| 0.00 | 0.37 | 0.18 | 0.95 | 0.33 | 0.67 | 0.33 | 0.75 | 1.00 | |
| 1.00 | 0.44 | 0.89 | 0.44 | 0.56 | 0.22 | 0.05 | 0.00 | 0.11 | |
| 0.00 | 0.53 | 0.61 | 0.67 | 0.20 | 0.25 | 1.00 | 0.99 | 1.00 | |
| −3.80 | −1.65 | −1.56 | −0.35 | −0.75 | 0.24 | −0.27 | 1.30 | 1.15 |
Publisher’s Note: MDPI stays neutral with regard to jurisdictional claims in published maps and institutional affiliations. |
© 2021 by the authors. Licensee MDPI, Basel, Switzerland. This article is an open access article distributed under the terms and conditions of the Creative Commons Attribution (CC BY) license (http://creativecommons.org/licenses/by/4.0/).
Share and Cite
Zhu, B.; Song, C.; Guo, Z.; Zhang, Y.; Zhou, Z. Effectiveness of Active Luminous Lane Markings on Highway at Night: A Driving Simulation Study. Sustainability 2021, 13, 1043. https://doi.org/10.3390/su13031043
Zhu B, Song C, Guo Z, Zhang Y, Zhou Z. Effectiveness of Active Luminous Lane Markings on Highway at Night: A Driving Simulation Study. Sustainability. 2021; 13(3):1043. https://doi.org/10.3390/su13031043
Chicago/Turabian StyleZhu, Bencheng, Cancan Song, Zhongyin Guo, Yu Zhang, and Zichu Zhou. 2021. "Effectiveness of Active Luminous Lane Markings on Highway at Night: A Driving Simulation Study" Sustainability 13, no. 3: 1043. https://doi.org/10.3390/su13031043