Abstract
This study aims to further understand the moderating role of customer orientation in the formation of customer satisfaction in the Chinese restaurant context. The first finding of direct effects reveals that customer orientation has a positive impact on quality evaluations, restaurant image and customer satisfaction. Taken in sequence, customer orientation improves quality evaluations, which, in turn, improves restaurant image and customer satisfaction. In particular, restaurant image by itself is not significant in its impact on customer satisfaction, whereas higher levels of customer orientation moderate to strengthen the relationship of restaurant image with customer satisfaction. The authors then provide a managerial framework that can be used to guide customer orientation improvement efforts.
1. Introduction
Although service quality has been applied to traditional restaurant service contexts, it is also important for the relatively new information on service quality. Researchers have developed new service scales that can reflect relevant information. As such, extant literature shows a vast amount of research on measurement and management approaches to improve service quality [1,2,3,4,5], reflecting the imperative that achieving superior levels of service quality is essential for service firms to remain competitive. Similarly, there is a great deal of research on the relationships between service quality and customer satisfaction [6,7,8,9,10,11]. Indeed, in competitive markets characterized by service offerings, service quality is a key for improving restaurant (or firm) performance [12].
Extant empirical research that has taken a traditional view has largely considered either two dimensions of technical vs. functional quality [1,12] or three dimensions [13,14]. Furthermore, perceived service quality has been well known in the marketing literature because it has a significant influence on firm choice [15]. Thus, there exists an opportunity to unite these two types of service quality in the context of Chinese restaurant evaluation [16,17], where there appears to be a distinct separation of physical service quality in those service categories where customers rely heavily on tangibles in the physical environment [18]. In this paper, we empirically theorize the relative importance of two types of service quality (i.e., perceived quality and physical service quality) in services that have a high degree of tangible evidence available to the customer for evaluation.
As we consider the relative importance of both perceived and physical service qualities and how they impact customer satisfaction in services, we have to reconcile the role of customer orientation on these effects. This is because customer orientation is the basis for executing marketing strategies that result in greater customer satisfaction [19,20]. Despite the importance of customer orientation, the important question as to how customer orientation influences customer satisfaction from direct or indirect influence perspectives has been still limited. That is, we consider how consumers’ judgments of service quality and its impact on customer satisfaction vary with different levels of customer orientation. This study is a valuable contribution to the literature for managers and researchers who seek the benefits gained from the practice of customer-oriented approaches.
Restaurant markets in China provide an interesting scenario for our study since these consumption experiences are considered exciting and are often associated with celebrating life events and, at the very least, are occasions to establish or sustain and nurture social connections [21]. For a perspective of the retail market value of China’s full service restaurants, consider that this market will reach EUR 390 billion by 2019 [22]. Hence, any research that yields a better understanding of how restaurants should manage service quality and other relevant factors to improve customer satisfaction is a desirable pursuit for scholars in services research [23]. Restaurants are able to improve customer orientation by investing in initiatives such as employee rewards based on customer satisfaction, or based on any of the dimensions of service quality that are measured and tracked at the individual customer level. The return on such investments/initiatives for restaurants is of great interest to the owners and investors.
Further, any and all such customer-oriented employee behavior can also impact restaurant image [24]. In Chinese culture, restaurant image is important because an excellent dining experience via excellent food in conjunction with good atmosphere is likely to enhance social connection and improve business exchange compared with other developed countries [23]. However, it has still not been empirically tested whether the service quality–satisfaction linkage is likely to be different based on perceptions of customer orientation and image of the restaurant. Especially, while there has been empirical work on the service quality–customer satisfaction link [6,25,26], to the best of our knowledge, this study is the first to look empirically at the strength of moderator (e.g., customer orientation)/mediator (e.g., restaurant image) in restaurant services across Chinese customer management.
This study tests our model of how quality evaluations impact restaurant image and customer satisfaction and, more importantly, the role of customer orientation in that regard. We have three goals in this study. First, we study the direct effects of physical and perceived service quality on restaurant image and customer satisfaction. Second, we examine the direct effect of customer orientation on perceived service quality, restaurant image and customer satisfaction. Third, we wish to examine the moderating effect of customer orientation in the impact of quality evaluations and restaurant image on customer satisfaction.
2. Literature Review
Service quality, whether identified as two types (technical vs. functional) or three types (interaction, physical and outcome), and its formation through customer evaluations depend on the sustainable nature of the service [27]. This is because the ability to sustain the delivery of quality services is essential for the long-term success of restaurants, particularly in the context of COVID-19. With this basic assumption, the question remains as to which type of service quality should be the focus for restaurants. More specifically, since restaurant environments play a critical role in customer perceptions of restaurant quality [14,28], we posit that physical service quality should be separate and distinct from overall service quality. Since overall service quality is a function of the outcome quality of the service, and as reflected in the five quality dimensions of SERVQUAL [26,29], would separating physical service quality yield a better insight into the formation of customer satisfaction in restaurants? Even though past studies show that rigorous research on the topic has started to emerge, various shortcomings remain in the restaurant sector.
Further, we seek to investigate the importance of the roles of restaurant image and customer orientation. Scholars view restaurant image as a facilitator of customer behavior, since restaurant customers rely heavily on tangible cues [30]. In the context of high-credence services, the importance of image in restaurant choice or further patronage behavior has also been recognized and identified [31,32]. Similarly, customer-oriented service organizations outperform their competitors by exceeding customer expectations by consistently delivering both value and satisfaction [10]. Even though several studies have identified nonsignificant or negative effects for the relationship between customer orientation and firm performance [33,34], more favorable customer outcomes result from well designed and executed marketing implementation that allows service firms to acquire and assimilate the information available on their customers. More specifically, researchers have viewed customer orientation as a cornerstone in the theoretical links between service quality, satisfaction and firm performance [19,35]. Using the restaurant context, we explore the extent to which the impact of restaurant image on customer satisfaction may also be influenced by the indirect role of customer orientation.
The conceptual model for this study is primarily based on two types of service quality—physical and overall perceived service quality—and their effect on customer satisfaction. Further, as shown in Figure 1, both customer orientation and restaurant image play a bridging role of moderating the strength of the effects between the two types of service quality and satisfaction. We now provide theoretical rationale for the hypothesized relationships between these constructs.
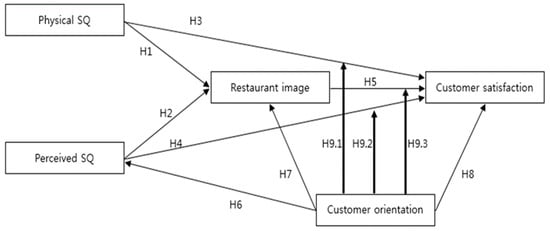
Figure 1.
Model and research hypotheses.
2.1. Service Quality and Restaurant Image
Restaurant image as an extension of the concept of restaurant image derives from customers’ perceptions of a restaurant’s image in terms of functional attributes [36]. There are numerous definitions of image reflecting the complex nature of the image [30]. The main body of the restaurant image literature has mostly focused on the individual’s subjective perception [37,38]. For the purposes of this study, we define restaurant image as the sum of beliefs, ideas and impressions that customers have of a restaurant [39]. While services have a higher proportion of intangible aspects in their consumption experience, the customer also interacts with the tangibles in the environment. In services where customers enter the service factory, the physical aspects of the experience are a significant component of service quality and can have an important effect on overall service evaluations, particularly in the restaurant sector [9]. For the purpose of this study, we distinguish physical service quality as a separate construct from perceived service quality.
Following Bitner [18], we define physical service quality as “the built environment surroundings the service that shape the customer’s restaurant experience” (pp. 57). Furthermore, retaining the accepted interpretation of perceived service quality as an overall view of the service [29], we define perceived service quality as “a global consumer judgment of the superiority of the service” (pp. 15).
Restaurant image has been viewed as a predictor of restaurant choice and other consumer behaviors [40]. It is also an outcome of a restaurant’s perceived service quality [32,41] and a predictor of customer satisfaction [30,36]. From a consumer behavior perspective, a consumer’s perception of a restaurant’s image is likely to reflect the consumer’s consumption experiences with more conscious purchasing decisions [42]. More specifically, positive perceptions following great physical environment or good service experiences influence the perception of restaurant image [43] and, in turn, strengthen the restaurant image. That is, the higher the level of physical/perceived service quality received from a particular restaurant, the more favorable the restaurant image would be that is instilled in the minds of customers. The majority of research treats service quality as playing a determinant role in the formation of restaurant image [44]. Thus, the following two hypotheses are proposed:
Hypothesis 1 (H1).
The higher the physical service quality, the more favorable the restaurant image.
Hypothesis 2 (H2).
The higher the perceived service quality, the more favorable the restaurant image.
These first two hypotheses of our model treated restaurant image as dependent on quality evaluations. Next, we examine the direct impact of the quality evaluations—perceived service quality, physical service quality and restaurant image on customer satisfaction.
2.2. Service Quality, Restaurant Image and Customer Satisfaction
While most researchers agree on definitions of service quality, there is generally poor agreement on how customer satisfaction should be defined [6] and how customer satisfaction has been changed [45,46]. As different customers do not have the same expectations of a particular service, satisfaction may not mean the same thing to every customer [47]. Thus, for the purpose of this study, we define customer satisfaction as the perceived degree of contentment with regard to a customer’s prior experience with a particular restaurant [48]. This definition indicates that a restaurant (or firm) must simultaneously satisfy customers from a long-term perspective [49].
It is widely recognized that both physical and perceived service quality have positive effects on customer satisfaction, particularly in a restaurant context. Customers are more likely to seek ambient, clean and well-designed restaurants that are related to their feelings and social connections [50]. The manner in which a professional restaurant presents itself can provide insight into customers’ evaluations of the restaurant’s physical environment [51,52]. Furthermore, reliable and high levels of perceived service quality will be able to influence customers’ beliefs about expectations and performance of the restaurant and represented in customer satisfaction [53].
Restaurant image has been viewed as a predictor of not only restaurant choice [40], but also of customer satisfaction [36,50]. That is, if customers favor the image of a particular restaurant, they will probably show a certain degree of satisfaction. Thus, the following three hypotheses are proposed:
Hypothesis 3 (H3).
The higher the physical service quality, the higher the customer satisfaction in a restaurant.
Hypothesis 4 (H4).
The higher the perceived service quality, the higher the customer satisfaction in a restaurant.
Hypothesis 5 (H5).
The more favorable the restaurant image, the higher the customer satisfaction in a restaurant.
We have now covered the first goal of the study: to model the effects of quality evaluations on restaurant image and customer satisfaction. We now turn to the second and third goals of our study, which involve the role of customer orientation in our model.
2.3. Customer Orientation
The second goal of this study was to examine the direct effects of customer orientation on perceived service quality, restaurant image and customer satisfaction. Researchers emphasize the need for a better understanding of customer orientation as an important leverage for service-based organizations’ economic success [35,54,55,56]. A service firm obtains a variety of customer information regarding their needs and preferences and, in turn, incorporates activities in its regular operations that are based on that information [57,58]. In this study, we follow Ha and John’s study [55] to define customer orientation as “the application of employees’ specialized activities to identify, analyze, understand, and answer customer needs” (p.1028). This definition reflects Vargo and Lusch’s [59,60] service-dominant logic perspective and addresses the service directly related to the provision of benefit and assistance. Employee behavior has a direct effect on customers’ perception of the service [18], thus making it closely related to the customer’s service quality assessment. While research on customer orientation is not necessarily new, there is very limited research that looks at the role of customer orientation in the service context [61].
Previous studies in the services literature have demonstrated that customer orientation is strongly linked with customer satisfaction and business performance [58,59]. Employees’ treatment of a customer from the start of the service process to its end point is crucial for successful business performance [62]. Kelley and Hoffman [63] demonstrated that employees’ positive effect and activity lead to a favorable service assessment, resulting in business success (i.e., satisfaction, trust and loyalty). In line with these observations, we argue that if a customer experiences favorable customer-oriented services in a particular restaurant, they will develop certain higher levels of their perceptions (i.e., perceived service quality, restaurant image and satisfaction). Thus, the following three hypotheses are proposed:
Hypothesis 6 (H6).
Higher levels of customer orientation result in higher levels of perceived quality.
Hypothesis 7 (H7).
Higher levels of customer orientation result in higher levels of restaurant image.
Hypothesis 8 (H8).
Higher levels of customer orientation result in higher levels of customer satisfaction.
Having modeled the direct effects of customer orientation, we now hypothesize the moderating effects of customer orientation on the impact of perceived service quality, physical service quality and restaurant image on customer satisfaction. Although in general, the customer orientation–customer satisfaction (or relevant constructs) link has been confirmed in a number of different settings, there is also a strong belief that in restaurant services, the impact of customer orientation may depend on its level (low vs. high). However, what has not been tested in the literature is different levels of customer orientation that can affect the relationship between customer satisfaction and its antecedents. These unknown effects encompass the third goal of our study.
2.4. Moderating Role of Customer Orientation
Building moderating effect models gives insights into how that understanding can be applied [64]. We now present support for the moderating effects of customer orientation on the relationships between the service quality and restaurant image constructs on customer satisfaction. The moderating notion of customer orientation on the “service quality–customer satisfaction” link, though a seemingly novel concept in marketing, has its original conceptual grounding in marketing strategy literature that focuses on the consequence (direct or mediating effects) of customer orientation [13,35,61,65] rather than the resource-based theory [66]. This approach makes sense because customers at any given time may have different judgments of customer orientation. For example, some customers may feel comfortable when restaurant employees deliver customer-oriented services, whereas other customers may keep their distance from employees. Therefore, we can argue that customer orientation can have a critical influence on how customer evaluations of quality might impact their satisfaction. It is possible for customers to perceive high (low) customer orientation and for it to enhance (dilute) the impact of quality assessments on satisfaction. Given the nature of restaurant experiences, especially as a real-time service, customer orientation is likely to be a key determinant. This conditional indirect effect is formed by customers’ judgments and also involves activities such as attitude formation and focusing on customer trust [67]. Thus, we should expect customer orientation to play a moderating role in the direct effects, previously hypothesized in H3, H4 and H5, at different levels (low vs. high) of customer orientation.
We can argue that if restaurant customers who prefer customer-focused services are likely to take a more favorable view on friendly employees’ treatment, the positive effect of service quality on customer satisfaction will improve. Furthermore, if restaurant customers who prefer a well-designed interior or physical environment created by perceived atmospherics after entering the restaurant, the positive impact of physical service quality on satisfaction will improve. Even though these two types of service quality have a generally positive influence on satisfaction, the proposed relationship may be much stronger when customer-oriented activities additionally meet or exceed customer expectations. In other words, the relative importance of service quality (e.g., physical and perceived service quality) in customer satisfaction is likely to increase as customers highly perceive customer-oriented activities. From a similar point of view, high customer orientation also indicates that if customers develop a positive image with more customer-oriented activities rather than less customer-oriented activities, they are more likely to be satisfied. Thus, the final three hypotheses are proposed as:
Hypothesis 9.1 (H9.1).
The positive impact of physical service quality on customer satisfaction will be stronger at higher levels of customer orientation.
Hypothesis 9.2 (H9.2).
The positive impact of perceived service quality on customer satisfaction will be stronger at higher levels of customer orientation.
Hypothesis 9.3 (H9.3).
The positive impact of restaurant image on customer satisfaction will be stronger at higher levels of customer orientation.
3. Methodology
Here, we first present the data collection particulars followed by a report on the measures. We also present the control for the restaurant type.
3.1. Data Collection
The customers in our study had experienced a particular restaurant service during August to November of 2019 in China. The wide variety of restaurants would cause a wide variance in the relevant independent and dependent variables. More specifically, the several factors that contribute to customer satisfaction in the context of (Chinese) restaurant services are the food, physical surroundings, image and the service received—speed, friendliness and care [32,68]—in addition to the core factor of taste. As mentioned earlier in the Introduction section, restaurants are well suited for testing the proposed model.
For data collection efforts, participants were screened before the questionnaire was administered to make sure that they were familiar with the restaurant context in question. To establish this screen, potential respondents were intercepted in the waiting lounge at multiple restaurants. This method of sampling allows for easy access to target respondents who have restaurant experience. The main criteria for selecting participants to be eligible for the sample was a minimum of one year of experience at restaurants with at least two visits during that period. These criteria were very similar with the Chinese restaurant patrons used in Chow et al.’s study [23]. Trained interviewers provided assurances of confidentiality to the prospective respondents and indicated to them that their responses were for a research study at a university.
Self-administered surveys were distributed to 580 restaurant customers after they completed their meals. Note that the upper management of the restaurants had been previously approached and had consented to the survey of their customers. To facilitate response rates, we provided a 5% discount coupon issued by these restaurants for all respondents. After accounting for sample bias and missing data, we used a total of 547 questionnaires. Approximately 48% of the participants were male (52% females, 57% married) and 66% were older than 31 years of age (e.g., under 25 years = 15%; 26–30 years = 19%). Most respondents had an undergraduate degree (71%).
Following Armstrong and Overton’s suggestion [69], we assessed nonresponse bias through a series of t-tests that compared early response with late response respondents for all key constructs. No significant difference appeared between early and late respondents on the key variables.
3.2. Measures
The five constructs were measured using seventeen questions (responses on five-point Likert scales; strongly disagree (1) and strongly agree (5)) adapted from published scales (please see Table 1). Customer orientation was measured using four items adapted from Saxe and Weitz [56]. Although they developed the SOCA (Selling Orientation-Customer Orientation) scale within the specific context of salespeople, their marketing concept determined the needs of a target market (e.g., Chinese restaurant market in this study) and adapted itself to satisfying customer needs better than its competitors. Furthermore, this concept aimed at increasing long-term customer satisfaction, suggesting that their measures are consistent with the nature of our study.

Table 1.
Results of the CFA analysis.
Restaurant image was measured with four items adapted from Stern, Bush and Hair [43]. The two types of service quality were measured as follows: physical service quality, with four items adapted from Dabholkar et al. [14], and perceived service quality, with three items adapted from Yoo et al. [27]. Customer satisfaction was measured with two items adapted from Ragunathan and Irwin [47].
All survey questions were originally written in English and translated into Chinese. Slight wording changes were made as necessary to fit the Chinese restaurant context. We checked the translation and back-translation method to ensure the accuracy of the translation. We wanted to be careful about conceptual equivalence. Therefore, the translation was written in the appropriate Chinese language (dialect) spoken by the Chinese population and three colleagues were consulted on the wording and understandability of the Chinese language survey. They concluded that the Chinese survey had an adequate level of translation quality.
Finally, we calculated different levels (low vs. high) of customer orientation. In doing so, the mean of customer orientation was used to divide individual responses into two equal groups. Although it does not guarantee capturing high and low levels of customer orientation, it is a simple and strong way of showing the relationship for testing the difference between group means [64]. Furthermore, this approach is well known in the literature.
In particular, we used two-step approaches to analyze the data. First, we analyzed the direct effects using structural equation modeling with the AMOS program. Second, we further analyzed the indirect effects using moderated moderation with Process Macro.
4. Results
We used structural equation modeling to test the research hypotheses. Based on Anderson and Gerbing’s suggestion [70], this study tested convergent validity using exploratory and confirmatory factor analysis (CFA). First, the item–total correlation was considered, and values that had low item–total correlations were targeted for deletion. Next, any items with a loading less than 0.50 on their intended construct were candidates for deletion. As a consequence, one item from the customer orientation scale was dropped from the original pool of items.
We conducted a CFA to test the measurement model using AMOS 23.0. The results suggested good fit to the data, χ2(109) = 296.836, p < 0.01; Comparative Fit Index (CFI) = 0.993; Tucker–Lewis Index (TLI) = 0.967, with a root mean square error of approximation (RMSEA) = 0.056. The results of the CFA with factor loadings and t-values are summarized in Table 1.
All factor loadings were relatively high and significant, providing strong evidence for convergent validity [71]. Support for convergent validity is also demonstrated by the high average variance extracted (AVE) for all four constructs [71]. Most AVEs exceeded the recommended level of 0.50, but AVEs from 0.4 to 0.50 are not valid cut-off values [72].
Discriminant validity was assessed by calculating the shared variance between pairs of constructs and verifying that they were all lower than the average variances extracted for the individual constructs [73]. As shown in Table 2, the shared variances between pairs of all possible scale combinations indicated that the variances extracted were higher than the associated shared variance in all cases.
Table 2.
Discriminant validity (N = 547).
The direct hypothesized relationships shown in Table 3, H1 through H8, were tested using a path analysis in AMOS. The overall model had a good fit with the data based on following fit indices (χ2 = 332.788; df = 111; CFI = 0.969; TLI = 0.939; RMSEA = 0.064).
Table 3.
Results of path analysis.
4.1. Direct Effects between Quality Evaluations, Restaurant Image and Customer Satisfaction
The first two hypothesized relationships between the two types of service quality and restaurant image were significant, and therefore, H1 (ß = 0.355, p < 0.01) and H2 (ß = 0.483, p < 0.01) were supported. Similarly, the relationships between the two types of service quality and customer satisfaction were significant, and therefore, H3 (ß = 0.188, p <0.01) and H4 (ß = 0.465, p < 0.01) were also supported. However, restaurant image had an insignificant influence on customer satisfaction (ß = 0.012, p > 0.05), indicating that H5 is not supported.
4.2. Direct Effects of Customer Orientation
The three hypotheses related to the direct effect of customer orientation were all significant. Customer orientation had a significant positive effect on perceived service quality (ß = 0.800, p <0.01), as predicted in H6. As predicted in H7, the results revealed that customer orientation has a positive significant relationship with restaurant image (ß = 0.318, p <0.01). Furthermore, as predicted in H8, customer orientation had a significant positive effect on customer satisfaction (ß = 0.391, p <0.01).
4.3. Moderating Effects of Customer Orientation
To test the moderating effects of customer orientation, H9.1, H9.2 and H9.3, we conducted the PROCESS analysis proposed by Hayes [64], who recommended testing a moderation effect using bootstrap. This approach is particularly beneficial when testing hypotheses about the mechanisms behind causal effects and in describing and exploring the conditional nature of the mechanisms by which causality operates.
With regard to H9.1 (see Table 4), the interaction effect between physical service quality and customer orientation on customer satisfaction (ß = 0.17) was significant at p < 0.001 and the difference of moderating effects (low vs. high) was 0.18 (0.34−0.16 = 0.18). That is, high levels of customer orientation significantly moderate the relationship between the two constructs compared to low levels of customer orientation. This indicates that there is a conditional effect of physical service quality on customer satisfaction at different values of customer orientation.
Table 4.
Mediated moderation using bootstrapping.
In terms of H9.2, the interaction effect between perceived service quality and customer orientation on customer satisfaction (ß = 0.12) was significant at p < 0.05 and the difference of moderating effects (low vs. high) was 0.12 (0.38−0.26 = 0.12). These results also supported the conditional effect of perceived service quality on customer satisfaction at different values of the moderator, customer orientation.
On the other hand, the results of H9.3 were somewhat different from H9.1 and H9.2. The interaction effect between restaurant image and customer orientation on customer satisfaction was insignificant (ß = 0.08, p > 0.05), whereas the mediated moderation effects of customer orientation between restaurant image and customer satisfaction were positively significant at p < 0.01, from both low and high levels of customer orientation. As we noted earlier, these results explain that the indirect effects of customer orientation vary when an interaction effect or mediated moderation effect is involved in the proposed relationship. These results indicate that there is a difference between interaction and moderation.
Finally, one can argue that the interaction of customer orientation with restaurant image is insignificant, thereby making inferences of a moderating effect possibly inappropriate. However, if there are different or confusing findings (e.g., direct or indirect effects) from researchers, our analysis stressed the need to make clear the proposed relationships, suggesting that testing moderator effects is recommended [64]. In line with these observations, we conclude that customer orientation plays a significant role in moderating each of the relationships between physical service quality, perceived service quality, restaurant image and customer satisfaction in our study.
5. Discussion
The direct effect of quality evaluations on restaurant image being confirmed as expected is not surprising. Similarly, the direct effect of quality evaluations on customer satisfaction being confirmed, as expected, is also not surprising. These findings are consistent with previous studies [9]. We were also able to confirm that physical evidence in a service where the customer enters the service factory has an independent and separate impact on image and satisfaction. Image and satisfaction are summative attitudes and, as such, are a result of cognitive evaluations such as the quality evaluations we measured in this study. Attitudes toward a restaurant are greatly associated with the cognitive evaluations, such that as quality evaluations improve, restaurant image and customer satisfaction improve. These effects simply confirm that any restaurant, as with other services, must constantly seek ways to improve those factors that improve service quality. Such an endeavor will yield a better image and more satisfied customers for the service firm.
Unlike Ryu et al. [30], and in contrast to the significant impact of quality evaluations, we did not find support for a significant impact of restaurant image on customer satisfaction. What do we see if we juxtapose this finding of the impact of quality evaluations on restaurant image being significant and the finding that the impact of quality evaluations on customer satisfaction were significant? We see that as long a restaurant focuses on improving quality, you can expect both restaurant image and satisfaction to improve, regardless of whether there is a strong relationship between restaurant image and customer satisfaction. Perhaps restaurant image is a cumulative attitude built over time, and quality evaluations and customer satisfaction are episodic and are tied to just that one specific service experience.
This preceding discussion begs the question that if quality evaluations are indeed significant in their impact on restaurant image and customer satisfaction, and restaurants are already focused on improving quality, is there anything they could do to increase that relationship between quality and customer satisfaction? The answer to this question might provide a way to further leverage investments on quality, such that customer satisfaction will be even greater than otherwise possible. Our study shows that indeed, the answer might be a focus on customer orientation.
Now, let us consider the findings on the two sets of hypotheses involving the role of customer orientation. The first set of direct effects reveals that customer orientation has a positive impact on quality evaluations, restaurant image and customer satisfaction. Taken in sequence, customer orientation improves quality evaluations, which, in turn, improves restaurant image and customer satisfaction. The support of the direct effects of customer orientation places it as a fundamental driver of all outcomes, evaluative and attitudinal, which, by themselves, are also critical for positive behavioral outcomes. These findings are consistent with previous studies [55,63].
To add more support for the role of customer orientation, we have significant support to the claim that customer orientation even moderates the impact of quality evaluations and restaurant image on customer satisfaction. Thus, customer orientation in our study impacts quality evaluations as well as the effect of those quality evaluations on customer satisfaction. Further, while restaurant image by itself was not significant in its impact on customer satisfaction, higher levels of customer orientation moderate to strengthen the relationship of restaurant image with customer satisfaction. Even though the interaction effect of customer orientation is very limited, the restaurant image–customer satisfaction link is more likely to be enhanced by the mediated moderating impact of customer orientation. Drawing from the customer-oriented view of the Chinese restaurant, we reveal an underlying mediated moderation mechanism and point out that customer orientation at the higher level influences restaurant performance through the implementation of customer orientation.
What might we glean as managerial implications from these findings? Much has been written on the management of quality. We are able to add to that conversation the critical role of customer orientation. Even a cursory glance at the items we used to measure customer orientation brings to mind the importance of frontline employees. Previously, beginning with Saxe and Weitz [56], scholars such as Kelley [62], Kelley and Hoffman [63], and Ha and John [55] had studied the impact of customer orientation of frontline personnel on behavioral outcomes of customers. Based on our study, we would add that there are two specific areas that managers can improve upon in practice to improve quality evaluations and customer satisfaction.
First, the items in our customer orientation measure allude to employees “going beyond normal call of duty” and employees that “are given adequate resources to meet customer needs.” Thus, when employees are empowered—trained and rewarded for exceptional responses to service failures or unusual customer requests—customer orientation improves, which, in turn, improves quality evaluations, image and customer satisfaction. Going beyond the call of duty with the resources to meet customer needs should be the norm in company culture. Such employee behaviors should be recognized and rewarded.
Second, the other two items in our customer orientation measure allude to employees that “understand what service attributes customers value the most” and “understand customers’ real problems”. In employee orientation and training, it behooves the firm to include service attributes that constitute the service quality construct, such as the manifestations of the dimensions of SERVQUAL [29] for the service offerings of the firm. In addition, training should include a thorough briefing of the fail points responsible for typical service failures in the service firm and the appropriate service recovery actions employees must follow.
Limitations and Research Directions
Our study was conducted in China and on restaurants, and thus, the generalizability of our results must be approached with caution. Similar cultures and economic environments and services that are similar to restaurants might exhibit similar effects as our findings as well. It would be a natural extension to replicate our study in other cultures, countries and in other services where customers enter a service factory, such as in the hospitality, transportation and healthcare service sectors. While we measured the overall evaluations of quality, it would be useful to measure the impact of customer orientation on dimensions of scales such as SERVQUAL to better parse out the impact of customer orientation on specific variables for research and actions that managers might engage in to improve customer orientation. For example, to what extent does improving frontline training and empowerment improve evaluations of empathy and responsiveness of the frontline personnel? How do such improvements in training improve customer satisfaction? Other possible research directions could include the role customer orientation plays in frontline personnel–customer relationships and customer retention as well as employee satisfaction and retention.
Finally, we also encourage researchers to consider further study to build on the findings of this study. Future studies can consider replicating this new service quality-sustainable satisfaction framework in other settings such as home sharing [74] and other services in the sharing economy [75]. Furthermore, future research can consider building on this model and testing its validity across different product categories (economical vs. luxury), product types (goods vs. services) and marketplace scenarios (individual vs. group) [76].
6. Conclusions
This study examined how two types of service quality influence restaurant image and customer satisfaction, how customer orientation directly influences restaurant image and customer satisfaction and how customer orientation changes dynamically in response to the moderating roles of the proposed relationships among service quality, restaurant image and customer satisfaction. We established a moderated moderation model implemented in a structural equation framework. The findings revealed that customer orientation has a positive impact on quality evaluations, restaurant image and customer satisfaction. Taken in sequence, customer orientation improved quality evaluations, which, in turn, improved restaurant image and customer satisfaction. In particular, restaurant image by itself was not significant in its impact on customer satisfaction, whereas higher levels of customer orientation strengthened the relationship of restaurant image with customer satisfaction. Finally, we presented specific implications for sustainable restaurant practice and directions for future research.
Author Contributions
Conceptualization, H.-Y.H.; methodology, H.-Y.H.; software, Y.X.; validation, H.-Y.H.; formal analysis, Y.X.; investigation, H.-Y.H.; resources, H.-Y.H.; data curation, H.-Y.H.; writing—original draft preparation, H.-Y.H.; writing—review and editing, Y.X.; visualization, H.-Y.H.; supervision, H.-Y.H.; project administration, H.-Y.H.; funding acquisition, Y.X. All authors have read and agreed to the published version of the manuscript.
Funding
This research received no external funding.
Institutional Review Board Statement
Not applicable.
Informed Consent Statement
Not applicable.
Conflicts of Interest
The authors declare no conflict of interest.
References
- Bell, S.J.; Auh, S.; Smalley, K. Customer relationship dynamics: Service quality and customer loyalty in the context of varying levels of customer expertise and switching costs. J. Acad. Mark. Sci. 2005, 33, 169–183. [Google Scholar] [CrossRef]
- Zeithaml, V.A.; Berry, L.L.; Parasuraman, A. The behavioral consequences of service quality. J. Mark. 1996, 60, 31–46. [Google Scholar] [CrossRef]
- Ladhari, R. Alternative measures of service quality: A review. Manag. Serv. Qual. 2008, 18, 65–86. [Google Scholar] [CrossRef]
- Keith, N.K.; Simmers, C.S. Measuring service quality perceptions of restaurant experiences: The disparity between comment cards and DINESERV. J. Foodserv. Bus. Res. 2011, 14, 20–32. [Google Scholar] [CrossRef]
- Knutson, B.; Stevens, P.; Patton, M. DINESERV: Measuring service quality in quick service, casual/theme, and fine dining restaurants. J. Hosp. Leis. Mark. 1996, 3, 35–44. [Google Scholar] [CrossRef]
- Spreng, R.A.; Mackoy, R.D. An empirical examination of a model of perceived service quality and satisfaction. J. Retail. 1996, 72, 201–214. [Google Scholar] [CrossRef]
- Taylor, S.A.; Baker, T.L. An assessment of the relationship between service quality and customer satisfaction in the formation of consumers’ purchase intentions. J. Retail. 1994, 70, 163–178. [Google Scholar] [CrossRef]
- Cronin, J.J.; Brady, M.K.; Hult, G.T.M. Assessing the effects of quality, value, and satisfaction on consumer behavioral intentions in service environments. J. Retail. 2000, 76, 193–218. [Google Scholar] [CrossRef]
- Ryu, K.; Han, H. Influence of the quality of food, service, and physical environment on customer satisfaction and behavioral intention in quick-casual restaurants: Moderating role of perceived price. J. Hosp. Tour. Res. 2010, 34, 310–329. [Google Scholar] [CrossRef]
- Brady, M.K.; Robertson, C.J. Searching for a consensus on the antecedent role of service quality and satisfaction: An exploratory cross-national study. J. Bus. Res. 2001, 51, 53–60. [Google Scholar] [CrossRef]
- Kim, H.J. Service orientation, service quality, customer satisfaction, and customer loyalty: Testing a structural model. J. Hosp. Mark. Manag. 2011, 20, 619–637. [Google Scholar] [CrossRef]
- Eisingerich, A.B.; Bell, S.J. Does enhancing customers’ service knowledge matter? J. Serv. Res. 2008, 10, 256–268. [Google Scholar] [CrossRef]
- Brady, M.K.; Cronin, J.J. Some new thoughts on conceptualizing perceived service quality: A hierarchical approach. J. Mark. 2001, 65, 34–49. [Google Scholar] [CrossRef]
- Dabholkar, P.A.; Thorpe, D.I.; Rentz, J.O. A measure of service quality for retail stores: Scale development and validation. J. Acad. Mark. Sci. 1996, 24, 3–16. [Google Scholar] [CrossRef]
- González, M.E.A.; Comesań, L.R.; Brea, J.A.F. Assessing tourist behavioral intentions through perceived service quality and customer satisfaction. J. Bus. Res. 2007, 60, 153–160. [Google Scholar] [CrossRef]
- Hussain, K.; Jing, F.; Parveen, K. How do foreigners perceive? Exploring foreign diners’ satisfaction with service quality of Chinese restaurants. Asia Pac. J. Tour. Res. 2018, 23, 613–625. [Google Scholar] [CrossRef]
- Sudhagar, D.P.; Rajendran, G. Selection criteria of customers of Chinese restaurants and their dining habits. Int. J. Knowl. Manag. Tour. Hosp. 2017, 1, 57–75. [Google Scholar] [CrossRef]
- Bitner, M.J. Servicescapes: The impact of physical surroundings on customers and employees. J. Mark. 1992, 56, 57–71. [Google Scholar] [CrossRef]
- Brady, M.K.; Cronin, J.J. Customer orientation: Effects on customer service perceptions and outcome behaviors. J. Serv. Res. 2001, 3, 241–251. [Google Scholar] [CrossRef]
- Sinkula, J.M.; Baker, W.E.; Noordewier, T. A framework for market-based organizational learning: Linking values, knowledge and behavior. J. Acad. Mark. Sci. 1997, 25, 305–318. [Google Scholar] [CrossRef]
- EU-SME Center. The Food & Beverage Market in China; China-Britain Business Council: Beijing, China, 2015. [Google Scholar]
- Full-Service Restaurants in China. Beijing, China. January 2015. Available online: http://store.mintel.com/full-service-restaurants-china-january-2015?cookie_test=true (accessed on 18 January 2019).
- Chow, I.H.; Lau, V.P.; Lo, T.W.; Sha, Z.; Yun, H. Service quality in restaurant operations in China: Decision- and experiential-oriented perspectives. Int. J. Hosp. Manag. 2007, 26, 698–710. [Google Scholar] [CrossRef]
- Collins-Dodd, C.; Lindley, T. Store brands and retail differentiation: The influence of store image and store brand attitude on store own brand perceptions. J. Retail. Consum. Serv. 2003, 10, 345–352. [Google Scholar] [CrossRef]
- Anderson, S.; Pearo, L.K.; Widener, S.K. Linking customer satisfaction to the service concept and customer characteristics. J. Serv. Res. 2008, 10, 365–381. [Google Scholar] [CrossRef]
- Cronin, J.J.; Taylor, S.A. Measuring service quality: A reexamination and extension. J. Mark. 1992, 56, 55–68. [Google Scholar] [CrossRef]
- Yoo, B.; Donthu, N.; Lee, S. An examination of selected marketing mix elements and brand equity. J. Acad. Mark. Sci. 2000, 28, 195–211. [Google Scholar] [CrossRef]
- King, S.C.; Weber, A.J.; Meiselman, H.L.; Lv, N. The effect of meal situation, social interaction, physical environment and choice on food acceptability. Food Qual. Prefer. 2004, 15, 645–653. [Google Scholar] [CrossRef]
- Parasuraman, A.; Zeithaml, V.A.; Berry, L.L. SERVQUAL: A multiple-item scale for measuring consumer perceptions of service quality. J. Retail. 1988, 64, 12–40. [Google Scholar]
- Ryu, K.; Han, H.; Kim, T. The relationships among overall quick-casual restaurant image, perceived value, customer satisfaction, and behavioral intentions. Int. J. Hosp. Manag. 2008, 27, 459–469. [Google Scholar] [CrossRef]
- Kivela, J.; Inbakaran, R.; Reece, J. Consumer research in the restaurant environment, Part 1: A conceptual model of dining satisfaction and return patronage. Int. J. Contemp. Hosp. Manag. 1999, 11, 205–222. [Google Scholar] [CrossRef]
- Ryu, K.; Lee, H.; Kim, W. The influence of the quality of the physical environment, food, and service on restaurant image, customer perceived image, customer perceived value, customer satisfaction, and behavioral intentions. Int. J. Contemp. Hosp. Manag. 2012, 24, 200–223. [Google Scholar] [CrossRef]
- Agarwal, S.; Erramilli, K.M.; Dev, C.D. Market orientation and performance in service firms: Role of innovation. J. Serv. Mark. 2003, 17, 68–82. [Google Scholar] [CrossRef]
- Sandvik, I.L.; Sandvik, K. The impact of market orientation on product innovativeness and business performance. Int. J. Res. Mark. 2003, 20, 355–376. [Google Scholar] [CrossRef]
- Kirca, A.H.; Jayachandran, S.; Bearden, W.O. Market orientation: A meta-analytic review and assessment of its antecedents and impact on performance. J. Mark. 2005, 69, 24–41. [Google Scholar] [CrossRef]
- Bloemer, J.; Ruyter, K. On the relationship between store image, store satisfaction and store loyalty. Eur. J. Mark. 1998, 32, 499–513. [Google Scholar] [CrossRef]
- Castro, C.B.; Armario, M.; Ruiz, M. The influence of market heterogeneity on the relationship between a destination’s image and tourists’ future behavior. Tour. Manag. 2007, 28, 175–187. [Google Scholar] [CrossRef]
- Hartman, K.B.; Spiro, R. Recapturing store image in customer-based store equity: A construct conceptualization. J. Bus. Res. 2005, 58, 1112–1120. [Google Scholar] [CrossRef]
- Baloglu, S.; Brinberg, D. Affective images of tourism destinations. J. Travel Res. 1997, 35, 11–15. [Google Scholar] [CrossRef]
- Yi, S.; Zhao, J.; Joung, H. Influence of price and brand image on restaurant customers’ restaurant selection attribute. J. Foodserv. Bus. Res. 2018, 21, 200–217. [Google Scholar] [CrossRef]
- Wall, E.A.; Berry, L.L. The combined effects of the physical environment and employee behavior on customer perception of restaurant service quality. Cornell Hosp. Q. 2007, 48, 59–69. [Google Scholar] [CrossRef]
- Lysenko-Ryba, K.; Zimon, D. Customer behavioral reactions to negative experiences during the product return. Sustainability 2021, 13, 448. [Google Scholar] [CrossRef]
- Stern, B.L.; Bush, R.F.; Hair, J.F. The self-image/ store image matching process: An empirical test. J. Bus. 1977, 50, 63–69. [Google Scholar] [CrossRef]
- Cretu, A.E.; Brodie, R.J. The influence of brand image and company reputation where manufacturers market to small firms: A customer value perspective. Ind. Mark. Manag. 2007, 36, 230–240. [Google Scholar] [CrossRef]
- Schiffman, L.; Kanuk, L.L. Consumer Behavior; Pearson Prentice Hall: Upper Saddle River, NJ, USA, 2004. [Google Scholar]
- Oliver, R.L. Satisfaction: A Behavioral Perspective on the Consumer, 2nd ed.; M.E. Sharpe: New York, NY, USA, 2010. [Google Scholar]
- Ragunathan, R.; Irwin, J.R. Walking the hedonic product treadmill: Default contrast and mood-based assimilation in judgments of predicted happiness with a target product. J. Consum. Res. 2001, 28, 355–368. [Google Scholar] [CrossRef]
- Anderson, R.E.; Srinivasan, S.S. E-satisfaction and e-loyalty: A contingency framework. Psychol. Mark. 2003, 20, 123–138. [Google Scholar] [CrossRef]
- Wei, A.; Peng, C.; Huang, H.; Yeh, S. Effects of corporate social responsibility on firm performance: Does customer satisfaction matter? Sustainability 2020, 12, 7545. [Google Scholar] [CrossRef]
- Ryu, K.; Jang, S. Influence of restaurants’ physical environments on emotion and behavioral intention. Serv. Ind. J. 2008, 28, 1151–1165. [Google Scholar] [CrossRef]
- Harris, L.C.; Ezeh, C. Servicescape and loyalty intentions: An empirical investigation. Eur. J. Mark. 2008, 42, 390–422. [Google Scholar] [CrossRef]
- Kim, W.G.; Moon, Y.J. Customers’ cognitive, emotional, and actionable response to the servicescape: A test of the moderating effect of the restaurant type. Int. J. Hosp. Manag. 2009, 28, 144–156. [Google Scholar] [CrossRef]
- Gajewska, T.; Zimon, D.; Kaczor, G.; Madzík, P. The impact of the level of customer satisfaction on the quality of e-commerce services. Int. J. Product. Perform. Manag. 2019, 69, 666–684. [Google Scholar] [CrossRef]
- Bove, L.L.; Johnson, L.W. A customer-service worker relationship model. Int. J. Serv. Ind. Manag. 2000, 11, 491–511. [Google Scholar] [CrossRef]
- Ha, H.; John, J. Role of customer orientation in an integrative model of brand loyalty in services. Serv. Ind. J. 2010, 30, 1025–1046. [Google Scholar] [CrossRef]
- Saxe, R.; Weitz, B.A. The SOSO scale: A measure of the customer orientation of salespeople. J. Mark. Res. 1982, 19, 343–351. [Google Scholar] [CrossRef]
- Chang, T.; Chen, S. Market orientation, service quality and business profitability: A conceptual model and empirical evidence. J. Serv. Mark. 1998, 12, 246–264. [Google Scholar] [CrossRef]
- Križo, P.; Madzík, P.; Vilgová, Z.; Sirotiaková, M. Evaluation of the most frequented forms of customer feedback acquisition and analysis. In Proceedings of the International Conference on Knowledge Management in Organizations, Zilina, Slovakia, 6–10 August 2018; Springer: Cham, Switzerland, 2018; pp. 562–573. [Google Scholar]
- Vargo, S.L.; Lusch, R.F. The four service marketing myths: Remnants of a goods-based, manufacturing model. J. Serv. Res. 2004, 6, 324–335. [Google Scholar] [CrossRef]
- Vargo, S.L.; Lusch, R.F. Service-dominant logic: Continuing the evolution. J. Acad. Mark. Sci. 2008, 36, 1–10. [Google Scholar] [CrossRef]
- Yoo, J.J.; Kim, T.T.; Lee, G. When customer complain: The value of customer orientation in service recovery. Cornell Hosp. Q. 2015, 56, 411–426. [Google Scholar] [CrossRef]
- Kelley, S.W. Developing customer orientation among service employees. J. Acad. Mark. Sci. 1992, 20, 27–36. [Google Scholar] [CrossRef]
- Kelley, S.W.; Hoffman, K.D. An investigation of positive affect, prosocial behaviors and service quality. J. Retail. 1997, 73, 407–427. [Google Scholar] [CrossRef]
- Hayes, A.F. Introduction to Mediation, Moderation, and Conditional Process Analysis: A Regression-Based Approach; Guilford Press: New York, NY, USA, 2013. [Google Scholar]
- Brown, T.J.; Mowen, J.C.; Donavan, T.; Licata, J.W. The customer orientation of service workers: Personality trait effects on self- and supervisor performance ratings. J. Mark. Res. 2002, 39, 110–119. [Google Scholar] [CrossRef]
- Morgan, N.A.; Vorhies, D.W.; Mason, C.H. Market orientation, marketing capabilities, and firm performance. Strateg. Manag. J. 2009, 30, 909–920. [Google Scholar] [CrossRef]
- Hemmington, N.; King, C. Key dimensions of outsourcing hotel food and beverage services. Int. J. Contemp. Hosp. Manag. 2000, 12, 256–261. [Google Scholar] [CrossRef]
- Johns, N.; Pine, R. Consumer behavior in the food service industry: A review. Int. J. Hosp. Manag. 2002, 21, 119–134. [Google Scholar] [CrossRef]
- Armstrong, S.J.; Overton, T.S. Estimating non-response in mailed surveys. J. Mark. Res. 1977, 14, 396–402. [Google Scholar] [CrossRef]
- Anderson, J.C.; Gerbing, D.W. Structural equation modeling in practice: A review and recommended two-step approach. Psychol. Bull. 1988, 103, 411–423. [Google Scholar] [CrossRef]
- Bagozzi, R.P.; Yi, Y. On the evaluation of structural equation models. J. Acad. Mark. Sci. 1988, 16, 74–94. [Google Scholar] [CrossRef]
- Thompson, B. Exploratory and Confirmatory Factor Analysis: Understanding Concepts and Application; American Psychological Association: Washington, DC, USA, 2004. [Google Scholar]
- Fornell, C.; Larcker, D.F. Evaluating structural equations models with unobservable variables and measurement error. J. Mark. Res. 1981, 18, 39–50. [Google Scholar] [CrossRef]
- Lim, W.M.; Yap, S.F.; Makkar, M. Home sharing in marketing and tourism at a tipping point: What do we know, how do we know, and where should we be heading? J. Bus. Res. 2021, 122, 534–566. [Google Scholar] [CrossRef] [PubMed]
- Lim, W.M. The sharing economy: A marketing perspective. Australas. Mark. J. 2020, 28, 4–13. [Google Scholar] [CrossRef]
- LIM, W.M.; Phang, C.S.C.; Lim, A.L. The effects of possession-and social inclusion-defined materialism on consumer behavior toward economical versus luxury product categories, goods versus services product types, and individual versus group marketplace scenarios. J. Retail. Consum. Serv. 2020, 56, 102158. [Google Scholar] [CrossRef]

Publisher’s Note: MDPI stays neutral with regard to jurisdictional claims in published maps and institutional affiliations. |
© 2021 by the authors. Licensee MDPI, Basel, Switzerland. This article is an open access article distributed under the terms and conditions of the Creative Commons Attribution (CC BY) license (http://creativecommons.org/licenses/by/4.0/).