
The Relationship between Coordination Degree of the Water–Energy–Food System and Regional Economic Development

 , , , and
Abstract
:1. Introduction
2. Methodology
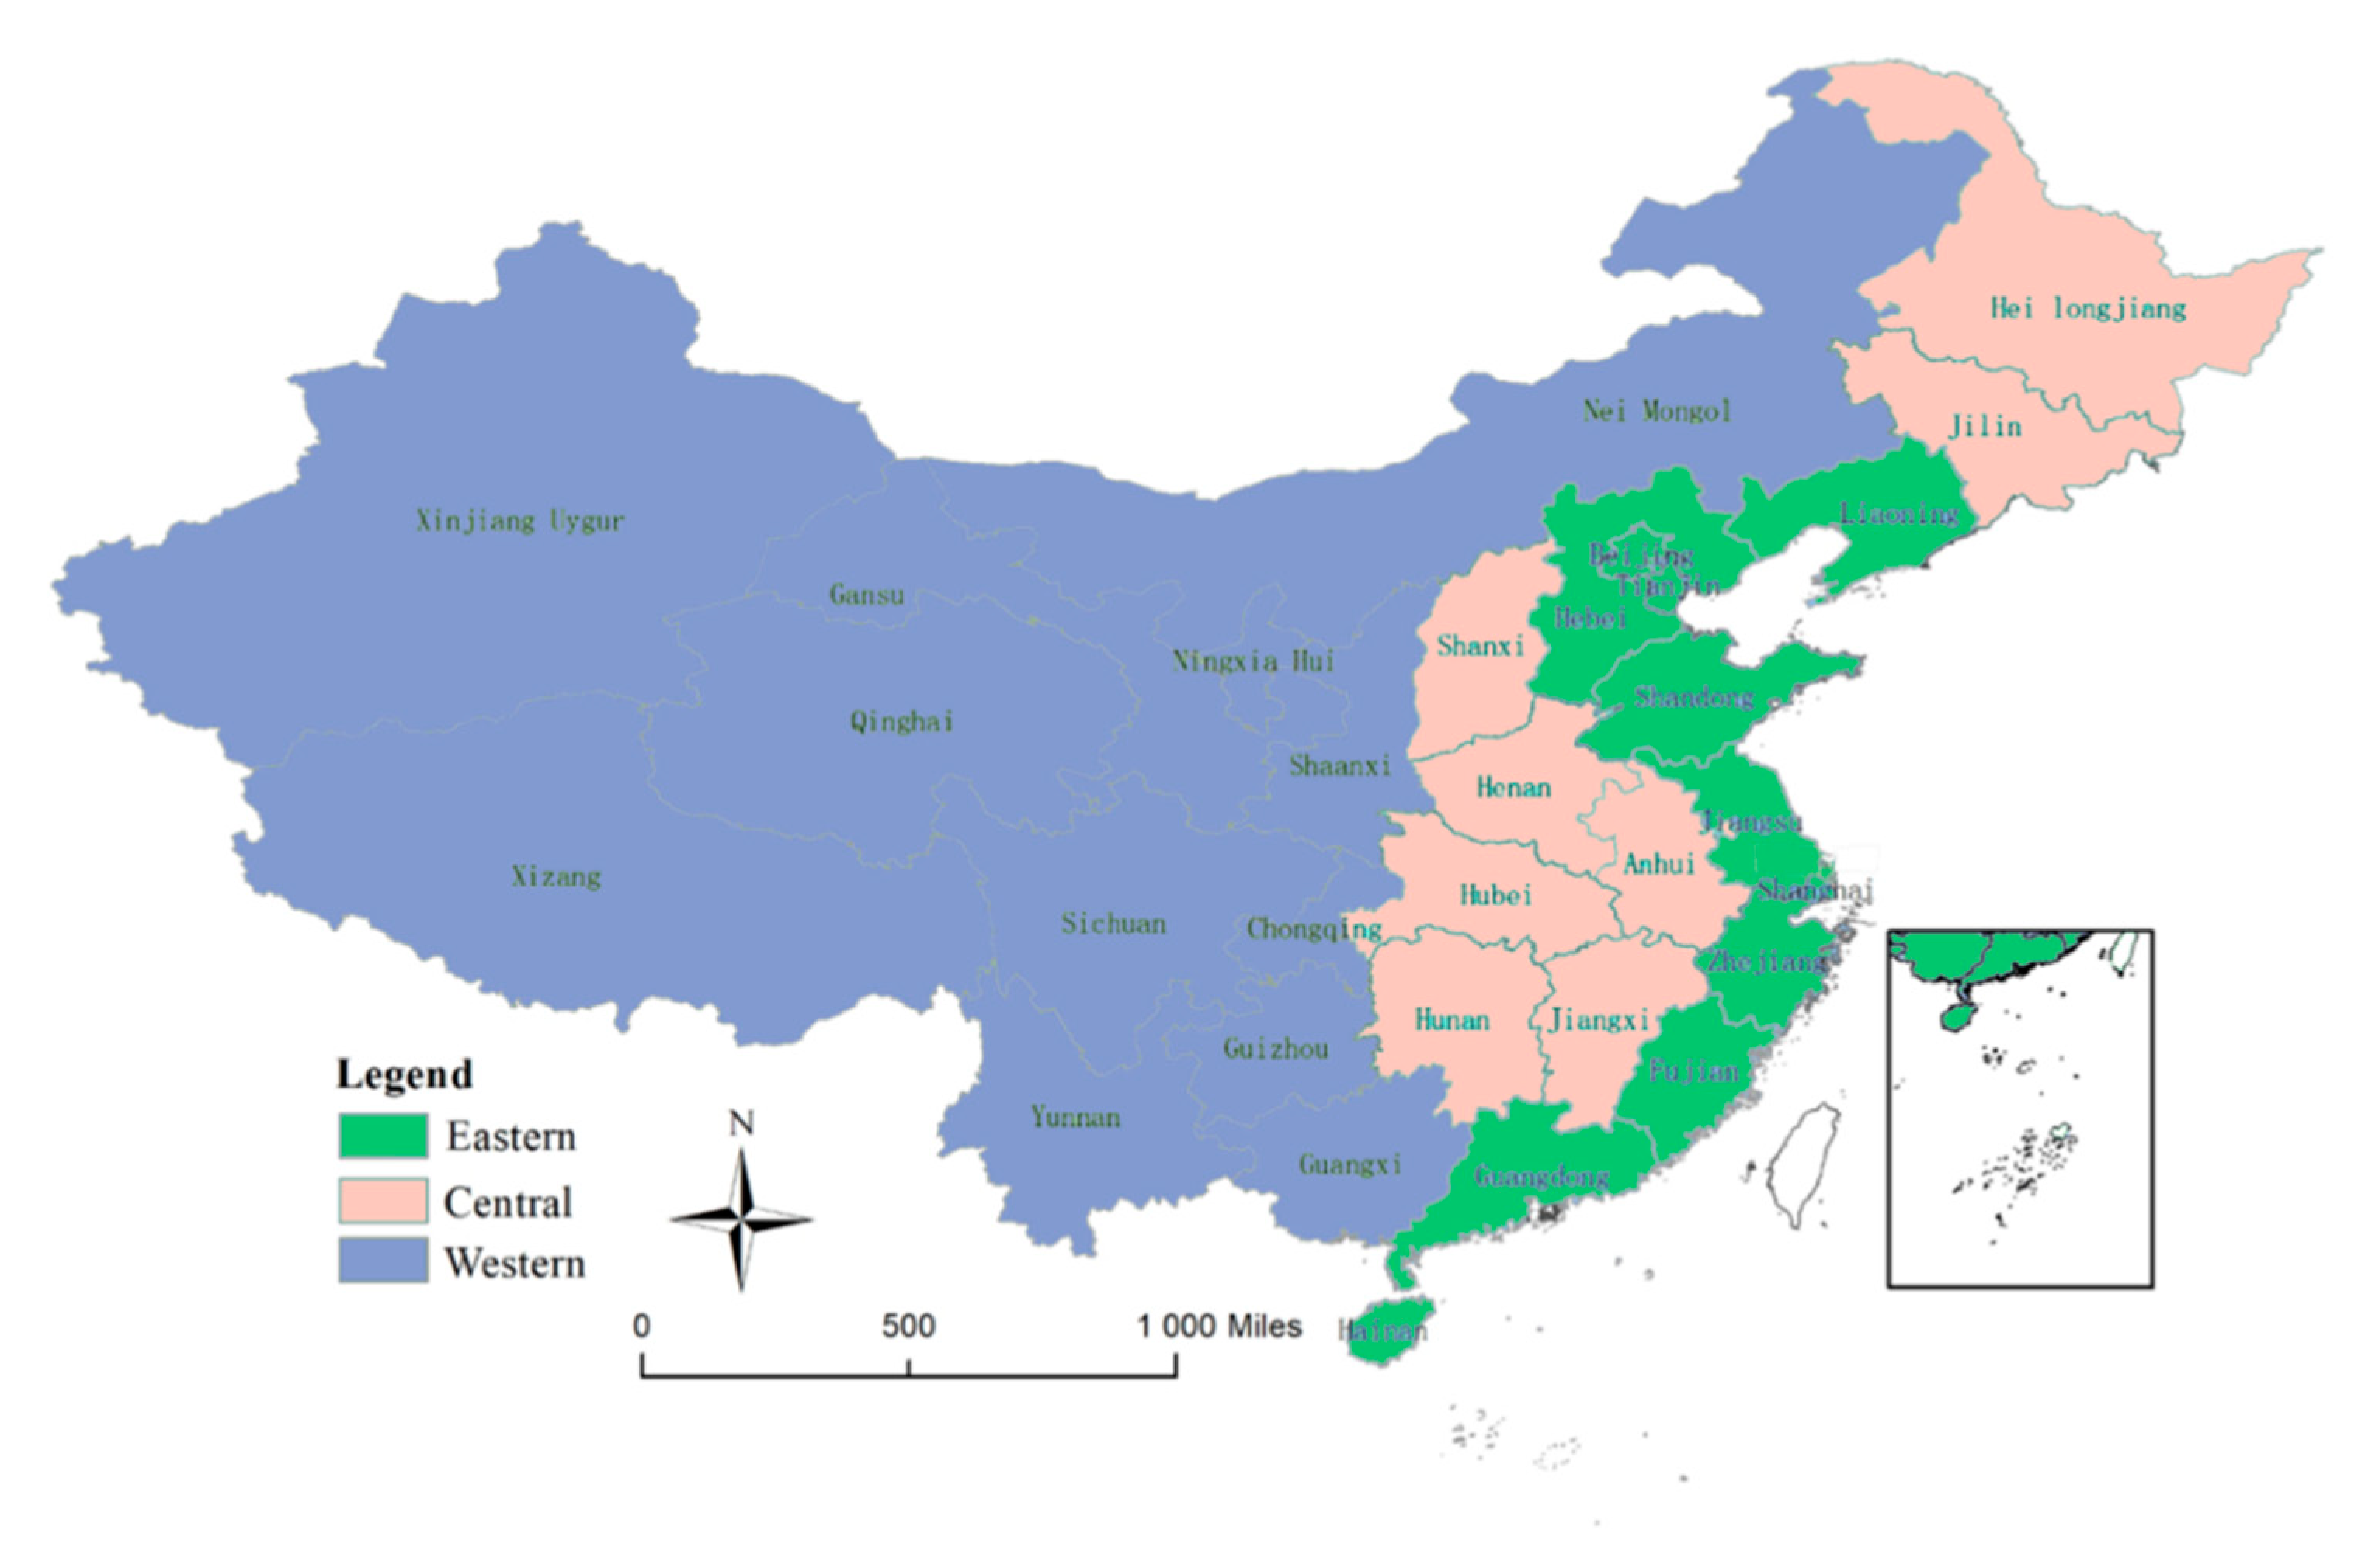
2.1. Study Area
2.2. Methods
2.3. Data Source
3. Results and Discussion
3.1. Results
3.1.1. Coordination Degrees of the WEF System and Their Types
3.1.2. Validity of System GMM Estimation
- (1)
- Estimated Results of OLS, FE, and System GMM Estimation
- (2)
- Reliability Analysis of System GMM Estimation
3.1.3. Estimated Results of the Eastern, Central, and Western Regions
3.2. Discussion
3.2.1. Relationship between Coordination Degree of the WEF System and Regional Economic Development
3.2.2. The Way to Improving the Coordination Degree of the WEF System in Different Regions
4. Conclusions
- (1)
- During the study period from 2007 to 2018, the coordination degree of the WEF system in China was still low. There were still 15 provinces with a low coordination degree; 11 provinces with a middle coordination degree; and only 5 provinces with a high coordination degree. The coordination degree of the three regions, in descending order, was the central, western, and eastern regions.
- (2)
- The system GMM estimation method is suitable for studying the relationship between the coordination degree of the WEF system and regional economic development. The results are robust and reliable.
- (3)
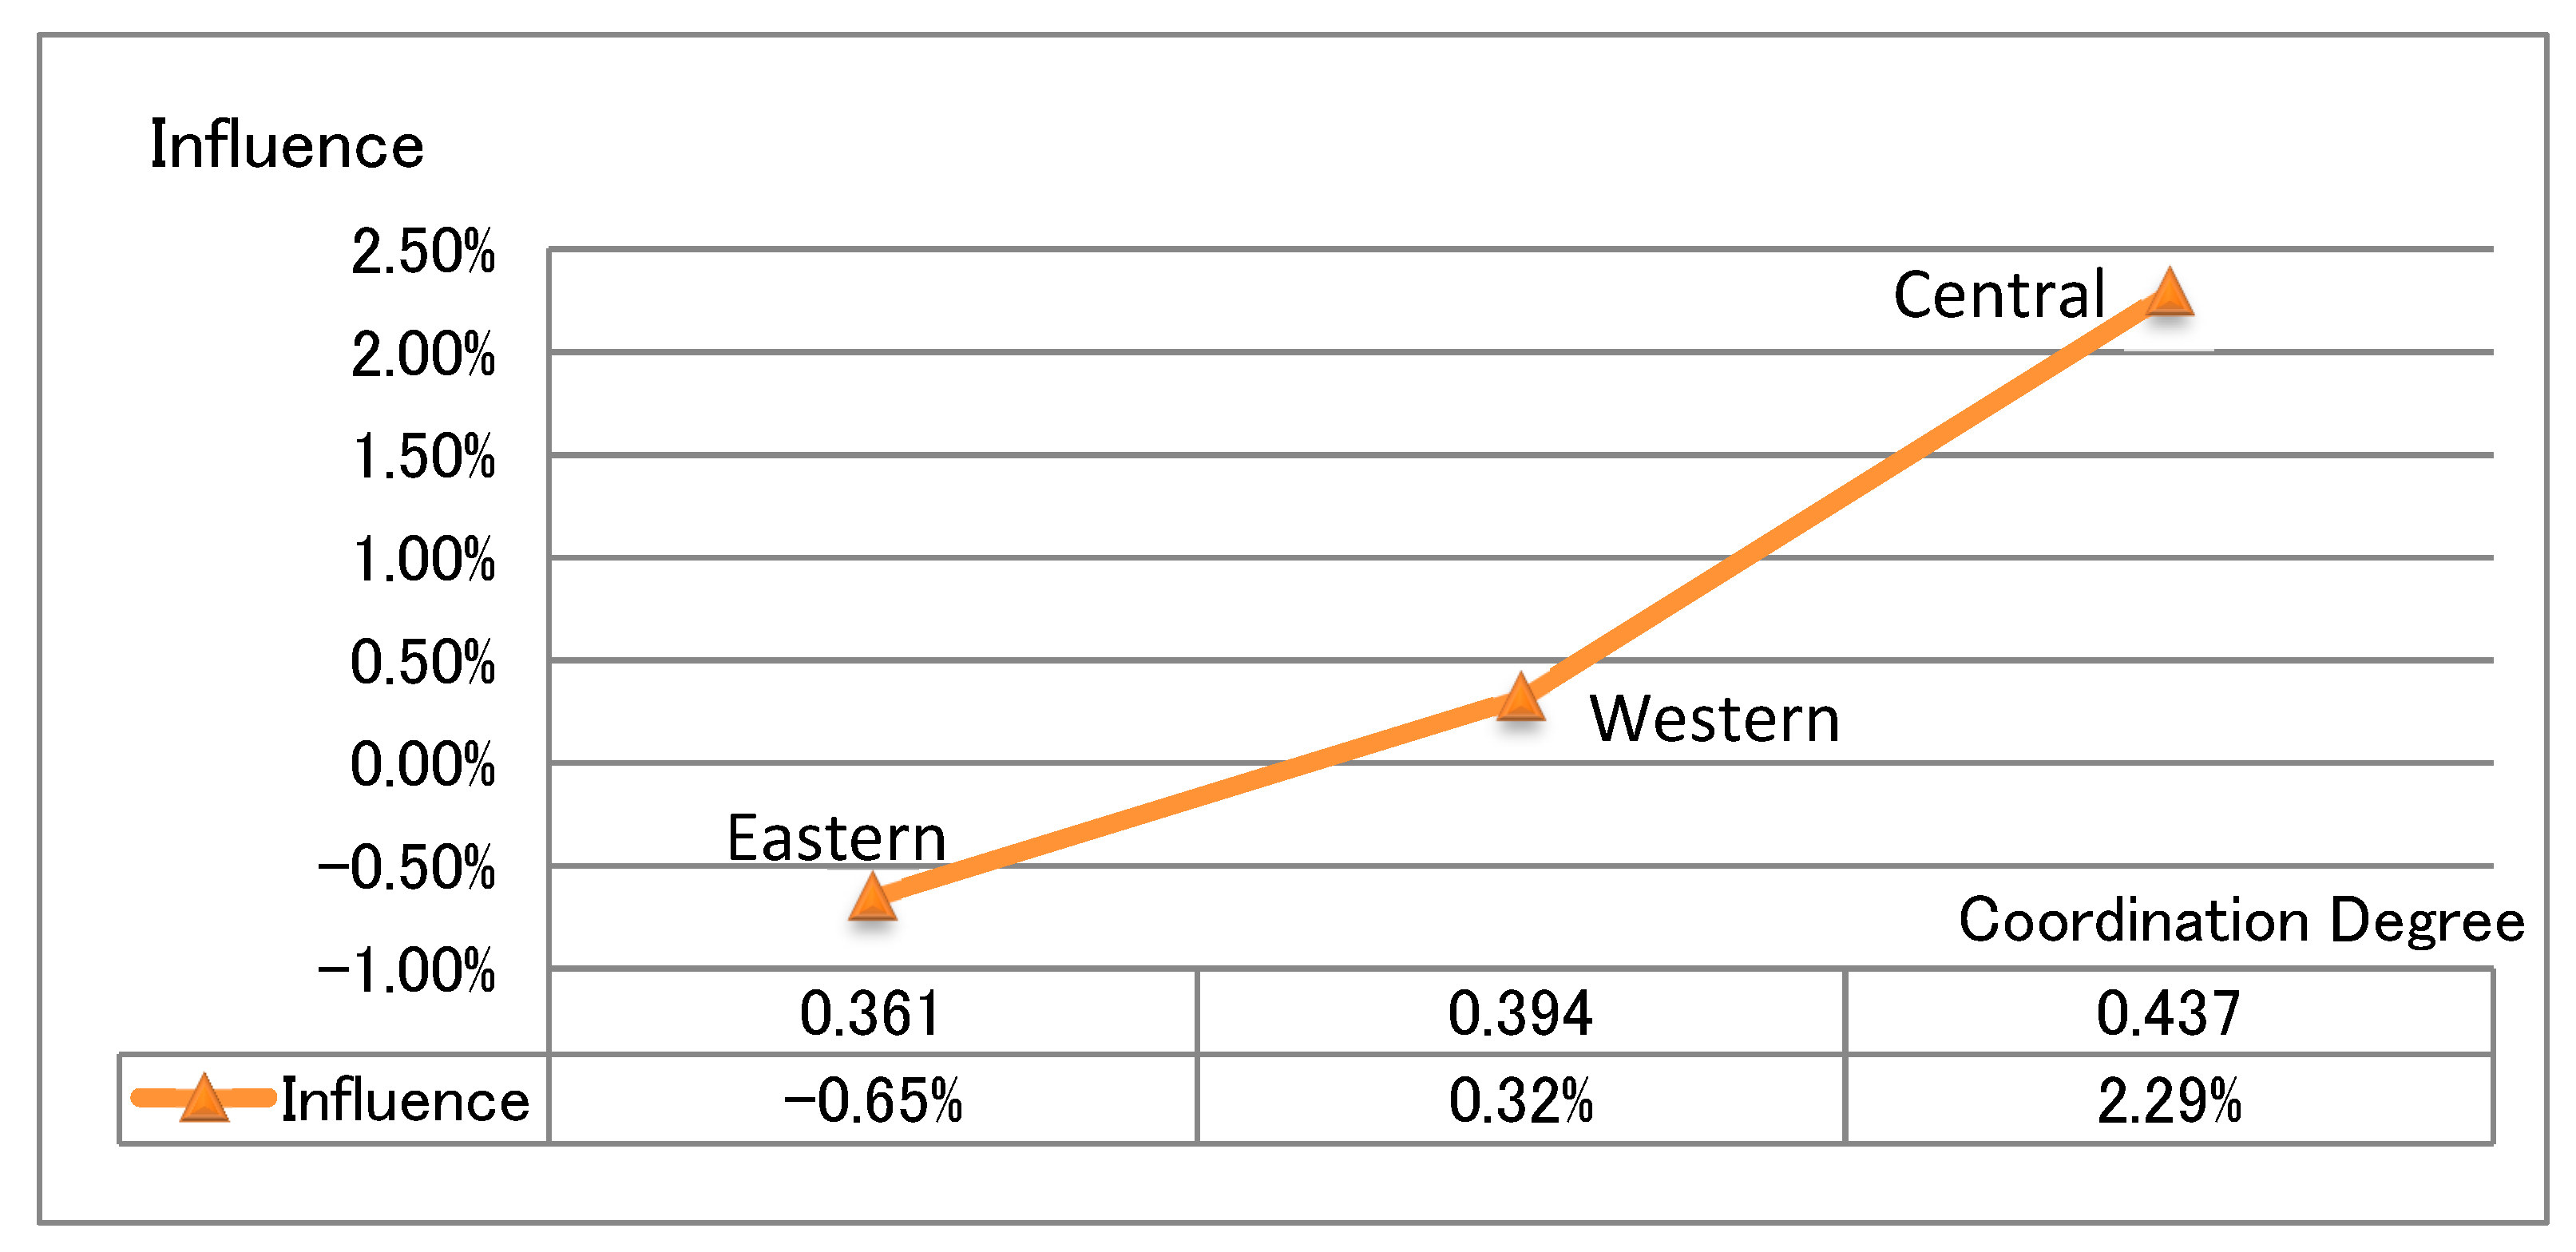
- In the central, western, and eastern regions, when coordination degree of the WEF system increases by 1%, the per capita GDP changes are 2.289%, 0.318%, and −0.653%, respectively. In regions with a low coordination degree, improved coordination degree will hinder regional economic growth; in regions with a high coordination degree, improved coordination degree of the WEF system will promote regional economic development. There is a lag period for the influence of an improved coordination degree on regional economic growth. In regions with different coordination degrees, it is necessary to adapt measures to local conditions and take different measures to improve the coordination degree of the WEF system and promote regional economic development.
Author Contributions
Funding
Institutional Review Board Statement
Informed Consent Statement
Data Availability Statement
Conflicts of Interest
References
- Future Earth Interim Secretariat. Future Earth 2025 Vision; Future Earth Interim Secretariat: Paris, France, 2014. [Google Scholar]
- Hoff, H. Understanding the Nexus: Background Paper for the Bonn 2011 Conference: The Water. Energy and Food Security Nexus; Stockholm Environment Institute: Stockholm, Sweden, 2011. [Google Scholar]
- Fontana, M.D.; Moreira, F.D.A.; Di Giulio, G.M.; Malheiros, T.F. The water-energy-food nexus research in the Brazilian context: What are we missing? Environ. Sci. Policy 2020, 112, 172–180. [Google Scholar] [CrossRef]
- Yazdani, S.; Dola, K. Sustainable City Priorities in Global North Versus Global South. J. Sustain. Dev. 2013, 6, 38. [Google Scholar] [CrossRef]
- Degefu, D.M.; He, W.; Zaiyi, L.; Liang, Y.; Zhengwei, H.; Min, A. Mapping Monthly Water Scarcity in Global Transboundary Basins at Country-Basin Mesh Based Spatial Resolution. Sci. Rep. 2018, 8, 1–10. [Google Scholar] [CrossRef] [PubMed] [Green Version]
- Zhang, Y.; Luo, P.; Zhao, S.; Kang, S.; Wang, P.; Zhou, M.; Lyu, J. Control and remediation methods for eutrophic lakes in the past 30 years. Water Sci. Technol. 2020, 81, 1099–1113. [Google Scholar] [CrossRef]
- Saladini, F.; Betti, G.; Ferragina, E.; Bouraoui, F.; Cupertino, S.; Canitano, G.; Gigliotti, M.; Autino, A.; Pulselli, F.; Riccaboni, A.; et al. Linking the water-energy-food nexus and sustainable development indicators for the Mediterranean region. Ecol. Indic. 2018, 91, 689–697. [Google Scholar] [CrossRef]
- Allouche, J.; Middleton, C.; Gyawali, D. Nexus Nirvana or Nexus Nullity? A Dynamic Approach to Security and Sustainability in the Water-energy-food Nexus. In STEPS Working Paper 63; STEPS Centre: Brighton, UK, 2014. [Google Scholar]
- Schmidt, J.J.; Matthews, N. From state to system: Financialization and the water-energy-food-climate nexus. Geoforum 2018, 91, 151–159. [Google Scholar] [CrossRef] [Green Version]
- Luo, P.; Sun, Y.; Wang, S.; Wang, S.; Lyu, J.; Zhou, M.; Nakagami, K.; Takara, K.; Nover, D. Historical assessment and future sustainability challenges of Egyptian water resources management. J. Clean. Prod. 2020, 263, 121154. [Google Scholar] [CrossRef]
- Weitz, N.; Strambo, C.; Kemp-Benedict, E.; Nilsson, M. Closing the governance gaps in the water-energy-food nexus: Insights from integrative governance. Glob. Environ. Chang. 2017, 45, 165–173. [Google Scholar] [CrossRef]
- Sušnik, J. Data-driven quantification of the global water-energy-food system. Resour. Conserv. Recycl. 2018, 133, 179–190. [Google Scholar] [CrossRef]
- Pahl-wostl, C. Governance of the Water-energy-food Security Nexus: A Multi-level Coordination Challenge. Environ. Sci. Policy 2019, 92, 356–367. [Google Scholar] [CrossRef]
- Yuan, L.; He, W.; Liao, Z.; Degefu, D.M.; An, M.; Zhang, Z.; Wu, X. Allocating Water in the Mekong River Basin during the Dry Season. Water 2019, 11, 400. [Google Scholar] [CrossRef] [Green Version]
- Huo, A.; Peng, J.; Cheng, Y.; Luo, P.; Zheng, C. Hydrological Analysis of Loess Plateau Highland Control Schemes in Dongzhi Plateau. Front. Earth Sci. 2020, 8, 637. [Google Scholar] [CrossRef]
- Pardoe, J.; Conway, D.; Namaganda, E.; Vincent, K.; Dougill, A.J.; Kashaigili, J.J. Climate change and the water–energy–food nexus: Insights from policy and practice in Tanzania. Clim. Policy 2017, 18, 863–877. [Google Scholar] [CrossRef] [Green Version]
- Stein, C.; Pahl-Wostl, C.; Barron, J. Towards a relational understanding of the water-energy-food nexus: An analysis of embeddedness and governance in the Upper Blue Nile region of Ethiopia. Environ. Sci. Policy 2018, 90, 173–182. [Google Scholar] [CrossRef]
- Daher, B.; Hannibal, B.; Mohtar, R.H.; Portney, K. Toward understanding the convergence of researcher and stakeholder perspectives related to water-energy-food (WEF) challenges: The case of San Antonio, Texas. Environ. Sci. Policy 2020, 104, 20–35. [Google Scholar] [CrossRef]
- Davis, N. Global Risks 2011 Report; World Economic Forum: Cologne, Germany, 2011. [Google Scholar]
- Rasul, G. Managing the food, water, and energy nexus for achieving the Sustainable Development Goals in South Asia. Environ. Dev. 2016, 18, 14–25. [Google Scholar] [CrossRef] [Green Version]
- Scott, C.A.; Kurian, M.; Wescoat, J.L., Jr. The water-energy-food nexus: Enhancing adaptive capacity to complex global challenges. In Governing the Nexus; Springer: Cham, Switzerland, 2015; pp. 15–38. [Google Scholar]
- Mu, D.; Luo, P.; Lyu, J.; Zhou, M.; Huo, A.; Duan, W.; Nover, D.; He, B.; Zhao, X. Impact of temporal rainfall patterns on flash floods in Hue City, Vietnam. J. Flood Risk Manag. 2020, e12668. [Google Scholar] [CrossRef]
- Degefu, D.M.; He, W.; Yuan, L.; Zhao, J.H. Water Allocation in Transboundary River Basins under Water Scarcity: A Cooperative Bargaining Approach. Water Resour. Manag. 2016, 30, 4451–4466. [Google Scholar] [CrossRef]
- Li, G.; Huang, D.; Li, Y. China’s Input-Output Efficiency of Water-Energy-Food Nexus Based on the Data Envelopment Analysis (DEA) Model. Sustainability 2016, 8, 927. [Google Scholar] [CrossRef] [Green Version]
- Keskinen, M.; Someth, P.; Salmivaara, A.; Kummu, M. Water-Energy-Food Nexus in a Transboundary River Basin: The Case of Tonle Sap Lake, Mekong River Basin. Water 2015, 7, 5416–5436. [Google Scholar] [CrossRef]
- Uen, T.-S.; Chang, F.-J.; Zhou, Y.; Tsai, W.-P. Exploring synergistic benefits of Water-Food-Energy Nexus through multi-objective reservoir optimization schemes. Sci. Total. Environ. 2018, 633, 341–351. [Google Scholar] [CrossRef]
- Pahl-Wostl, C.; Bhaduri, A.; Bruns, A. Editorial special issue: The Nexus of water, energy and food—An environmental governance perspective. Environ. Sci. Policy 2018, 90, 161–163. [Google Scholar] [CrossRef]
- Luo, P.; Mu, D.; Xue, H.; Ngo-Duc, T.; Dang-Dinh, K.; Takara, K.; Nover, D.; Schladow, G. Flood inundation assessment for the Hanoi Central Area, Vietnam under historical and extreme rainfall conditions. Sci. Rep. 2018, 8, 1–11. [Google Scholar] [CrossRef]
- Yang, S.; Liao, C.; Zheng, Z. Urban Ecological Environment; Science Press: Beijing, China, 1996. [Google Scholar]
- Xu, S.; He, W.; Shen, J.; Degefu, D.M.; Yuan, L.; Kong, Y. Coupling and Coordination Degrees of the Core Water–Energy–Food Nexus in China. Int. J. Environ. Res. Public Health 2019, 16, 1648. [Google Scholar] [CrossRef] [Green Version]
- Nhamo, L.; Mabhaudhi, T.; Mpandeli, S.; Dickens, C.; Nhemachena, C.; Senzanje, A.; Naidoo, D.; Liphadzi, S.; Modi, A.T. An integrative analytical model for the water-energy-food nexus: South Africa case study. Environ. Sci. Policy 2020, 109, 15–24. [Google Scholar] [CrossRef]
- Cobbinah, P.B.; Erdiaw-Kwasie, M.O.; Amoateng, P. Rethinking sustainable development within the framework of poverty and urbanisation in developing countries. Environ. Dev. 2015, 13, 18–32. [Google Scholar] [CrossRef]
- Huo, A.; Yang, L.; Luo, P.; Cheng, Y.; Peng, J.; Nover, D. Influence of landfill and land use scenario on runoff, evapotranspiration, and sediment yield over the Chinese Loess Plateau. Ecol. Indic. 2021, 121, 107208. [Google Scholar] [CrossRef]
- Shao, L. Human Capital and Regional Economic Growth. Popul. J. 2014, 36, 74–81. [Google Scholar] [CrossRef]
- Zhou, H.; Miao, H.; Zeng, B. Innovation Driven, Urbanization and Regional Economic Growth. Inq. Econ. Issues 2017, 217, 95–102. [Google Scholar]
- Chen, X.; Han, J. New Idea for Solving the Problems of “Agriculture, Rural Areas and Farmers” under the New Normal Economy; Tsinghua University Press: Beijing, China, 2016. [Google Scholar]
- Suocheng, D.; Dan, S.; Fujia, L.; Jiajun, L.; Fei, L.; Zhenyu, Y.; Li, Z.; Yu, L.; Rongxia, Z.; Yang, R.; et al. Study on the Resource Environment, Economy and Urbanization Situation and Green Rise Strategy in Central China. Resour. Sci. 2019, 41, 33–42. [Google Scholar] [CrossRef] [Green Version]
- Mi, H.; Lu, Q. Effect of Water Investment on Agricultural Economic Growth in Shanxi Province. J. China Agric. Univ. 2015, 20, 262–267. [Google Scholar] [CrossRef]
- Yao, C.; Yin, W.; Huang, L.; Cui, H. Spatial-Temporal Pattern and Coupling Coordination Evolution of the Vulnerability of Food Production and Consumption Ability in China. Econ. Geogr. 2019, 39, 147–156. [Google Scholar] [CrossRef]
- Dudley, B. Bp Statistical Review of World Energy. BP Stat. Rev. 2020, 6, 00116. [Google Scholar]
- Lefèvre, N. Energy Security and Climate Policy: Assessing Interactions; IEA/OECD: Paris, France, 2007. [Google Scholar]
- Yuan, L.; He, W.; Degefu, D.M.; Liao, Z.; Wu, X.; An, M.; Zhang, Z.; Ramsey, T.S. Transboundary Water Sharing Problem: A Theoretical Analysis Using Evolutionary Game and System Dynamics. J. Hydrol. 2020, 582, 124521. [Google Scholar] [CrossRef]
- Zhang, W. Research on Optimal Allocation and Suggestions of Water Quantity and Water Quality in Regional Water Resources; China University of Mining & Technology: Xuzhou, China, 2016. [Google Scholar]
- Peng, X.; Chen, Z. Impact Evaluation on China’s Western Development Policy. China Population. Resour. Environ. 2016, 26, 136–144. [Google Scholar] [CrossRef]
- He, G.; Yang, X. The Effect of Financial Constraints on Productivity in China. J. Quant. Tech. Econ. 2015, 5, 19–35. [Google Scholar] [CrossRef]
- Mao, L. Analysis of the Impact of China’s Social Fixed Assets Investment on GDP. Rural Econ. Sci. Technol. 2019, 30, 110–111. [Google Scholar]
- Long, X.; Wang, J. The Motivation of China’s Patent Proliferation and its Mass Effect. J. World Econ. 2015, 38, 115–142. [Google Scholar]
- Li, Q. GMM Estimation of Dynamic Panel Data Model and Its Application. Stat. Decis. 2010, 16, 161–163. [Google Scholar]
- Bond, S.R. Dynamic Panel Data Models: A Guide to Micro Data Methods and Practice. Port. Econ. J. 2002, 1, 141–162. [Google Scholar] [CrossRef]
- Wang, X. On Evaluation of Coordinated Development between Regional Science and Technology Progress and Technology Progress and Economy Growth; Jiangxi University of Finance & Economics: Nanchang, China, 2014. [Google Scholar]
- Li, G.; Fan, L.; Feng, Z. Capital Accumulation, Institutional Changes and Agricultural Growth. Manag. World 2014, 248, 67–79. [Google Scholar] [CrossRef]
- Liu, H.; Zhang, Q.; Yang, J. Urbanization, Spatial Spillover and Regional Economic Growth. J. Agrotech. Econ. 2014, 234, 95–105. [Google Scholar] [CrossRef]
- Luo, P.; Kang, S.; Apip; Zhou, M.; Lyu, J.; Aisyah, S.; Mishra, B.; Regmi, R.K.; Nover, D. Water Quality Trend Assessment in Jakarta: A Rapidly Growing Asian Megacity. PLoS ONE 2019, 14, e0219009. [Google Scholar] [CrossRef] [Green Version]
- Yu, B. How Does Industrial Restructuring Improve Regional Energy Efficiency? An Empirical Study Based on Two Dimensions of Magnitude and Quality. J. Financ. Econ. 2017, 43, 86–97. [Google Scholar] [CrossRef]
- Chen, Y. An Analysis of the Industrial Policy in the Western Regions Restricted to Develop. Reform Econ. Syst. 2013, 182, 52–56. [Google Scholar]
- Jiang, S.; Wang, Z.; Zhou, N. The Evolution, Case Analysis and Realistic Choice of Agricultural Modernization in Western China. Issues Agric. Econ. 2015, 36, 30–37. [Google Scholar] [CrossRef]


| Sign | Variable | Description | |
|---|---|---|---|
| Explained variable | Y | PCGDP | Per Capita GDP |
| Explanatory variable | C | CD | Coordination Degree |
| Control variables | L | LAB | The Amount of Local Labor Input |
| K | PCS | Physical Capital Stock | |
| T | TEC | Technological Progress | |
| U | URBAN | Urbanization Rate |
| The Type of Coordination Degree | Coordination Stage | Coordination Range |
|---|---|---|
| 1 | Low | (0, 0.4] |
| 2 | Middle | (0.4, 0.5] |
| 3 | High | (0.5, 0.8] |
| 4 | Extreme High | (0.8, 1] |
| Variable | OLS | FE | System GMM |
|---|---|---|---|
| Lnpcgdp (L1) | 0.76725091 *** | ||
| Lncd | −0.3817131 *** | −0.054 * | −0.17216848 *** |
| Lntec | 0.11040875 ** | 0.11532716 *** | 0.02091294 *** |
| Lnlab | −0.2748003 *** | −0.006 | −0.03266368 *** |
| Lnpcs | 0.30974107 *** | 0.45938906 *** | 0.013 |
| Lnurban | 0.73665478 *** | 0.11222916 * | 0.003 |
| Cons | 5.4470442 *** | 4.823879 *** | 1.9079572 *** |
| AR (1) | / | / | 0.0017 |
| AR (2) | / | / | 0.3 |
| Sargan | / | / | 1.0 |
| Variable | Eastern | Central | Western |
|---|---|---|---|
| Lnpcgdp (L1) | 0.68045629 *** | 1.3757429 *** | 0.74513613 *** |
| Lncd | −0.65257304 *** | 2.289376 ** | 0.318 * |
| Lntec | 0.003 | 0.2065328 *** | 0.006 |
| Lnlab | −0.13055859 ** | 0.928 | 0.084 |
| Lnpcs | 0.091 | 1.1715203 *** | 0.070 |
| Lnurban | 1.4788924 ** | 2.579665 *** | 0.069 |
| Cons | −1.884 | 3.727 | 2.7478819 ** |
| AR (1) | 0.0020 | 0.0394 | 0.0238 |
| AR (2) | 0.8396 | 0.5835 | 0.8181 |
| Sargan | 1 | 1 | 1 |
Publisher’s Note: MDPI stays neutral with regard to jurisdictional claims in published maps and institutional affiliations. |
© 2021 by the authors. Licensee MDPI, Basel, Switzerland. This article is an open access article distributed under the terms and conditions of the Creative Commons Attribution (CC BY) license (http://creativecommons.org/licenses/by/4.0/).
Share and Cite
Xu, S.; He, W.; Yuan, L.; Degefu, D.M.; Yang, Y.; Li, H. The Relationship between Coordination Degree of the Water–Energy–Food System and Regional Economic Development. Sustainability 2021, 13, 1305. https://doi.org/10.3390/su13031305
Xu S, He W, Yuan L, Degefu DM, Yang Y, Li H. The Relationship between Coordination Degree of the Water–Energy–Food System and Regional Economic Development. Sustainability. 2021; 13(3):1305. https://doi.org/10.3390/su13031305
Chicago/Turabian StyleXu, Shasha, Weijun He, Liang Yuan, Dagmawi Mulugeta Degefu, Yang Yang, and Hua Li. 2021. "The Relationship between Coordination Degree of the Water–Energy–Food System and Regional Economic Development" Sustainability 13, no. 3: 1305. https://doi.org/10.3390/su13031305