Article

Condition Assessment of Joints in Steel Truss Bridges Using a Probabilistic Neural Network and Finite Element Model Updating

School of Civil Engineering, Beijing Jiaotong University, Beijing 100044, China
*
Author to whom correspondence should be addressed.
Sustainability 2021, 13(3), 1474; https://doi.org/10.3390/su13031474
Submission received: 6 December 2020 / Revised: 20 January 2021 / Accepted: 26 January 2021 / Published: 31 January 2021

Abstract

:
The condition of joints in steel truss bridges is critical to railway operational safety. The available methods for the quantitative assessment of different types of joint damage are, however, very limited. This paper numerically investigates the feasibility of using a probabilistic neural network (PNN) and a finite element (FE) model updating technique to assess the condition of joints in steel truss bridges. A two-step identification procedure is developed to achieve damage localization and severity assessment. A series of FE models with single or multiple damages are simulated to generate the training and testing data samples and validate the effectiveness of the proposed approach. The influence of noise on the identification accuracy is also evaluated. The results show that the change rate of modal curvature (CRMC) can be used as a damage-sensitive input of the PNN and the accuracy of preliminary damage localization can exceed 90% when suitable training patterns are utilized. Damaged members can be localized in the correct substructure even with noise contamination. The FE model updating method used can effectively quantify the joint deterioration severity and is robust to noise.

1. Introduction

The last few decades have seen railway transport rapidly developing worldwide and occupying an essential role in transportation systems. As a vital component of railway infrastructure, bridges are the critical nodes that ensure the safety of railway operation.
The steel truss bridge is a ubiquitous structural form of railway bridges, while bolted connections are the most widely adopted type of joints. Over the long service life of a steel truss bridge, damage may accumulate in bolted joints due to repetitive loads and weathering, leading to looseness, cracks, corrosion, etc. Damage to joints will directly lead to stiffness degradation, and structural integrity and safety can be compromised. The collapse of the I-35W Bridge in Minneapolis, Minnesota, a recent catastrophic failure, exposed deficiencies in the existing condition management of steel bridges [1]. The failure of a gusset plate at one connection is considered to be the trigger of collapse according to the investigation results by the National Transportation Safety Board [2]. Therefore, timely monitoring and assessing bolt condition are important tasks in the maintenance and management of in-service steel structures.
Visual inspections at regular intervals and non-destructive tests are the most commonly used condition assessment methods for the management of bridge structures. According to the Federal Highway Administration, routine inspections at two-year intervals are required for highway bridges in the US [3]. The coin-tap method is a useful tool in conventional loose bolt detection practices. By hitting the bolt with a hammer, damage can be detected from the knock echo [4]. Nevertheless, visual inspections are time consuming and labor intensive, and also rely to a significant extent on the experience and subjective judgment of the inspector [5].
A review of the recent investigations on looseness detection methods in bolted structures was published by Nikravesh et al. [6], who divided them into direct and indirect measurement methods. While having a clear theoretical basis and being easy to apply, the direct methods have in practice low accuracy, which favors the indirect methods. The indirect methods generally comprise the impedance-based, vibration-based, ultrasonic-based, and vision-based approaches [7,8]. It has become increasingly popular to detect flaws by using vibration-based methods as a global approach in both academic research and practical applications. An et al. [9] developed a damage localization technique for truss joints and members based on the curvature difference method of strain waveform fractal dimension, which they proposed in an earlier study [10]. The investigators concluded that the proposed algorithm was insusceptible to noise and could detect damage reliably. Yang et al. [11] proposed a bolt looseness identification method for a steel frame using a reduced-order finite element (FE) model and a recently developed technique named the adaptive quadratic sum-square error with unknown inputs. Their experimental results showed that damage in the steel frame joint could be effectively identified. Li et al. [12] investigated the feasibility of utilizing a newly developed relative displacement sensor for joint monitoring in steel truss bridges. They demonstrated experimentally that the developed sensor was very sensitive to damage and could be employed as a useful tool for joint condition monitoring. Despite the existing examples of bolt looseness detection and localization, there are only limited studies focusing on the quantitative evaluation of joint damage in steel truss bridges.
Vibration-based methods utilizing machine learning have received significant attention in the structural health monitoring (SHM) community due to their excellent pattern matching capability and significant potential for online monitoring [13,14,15,16,17,18,19,20]. The early work on joint condition evaluation in steel truss bridges combining machine learning and vibration-based methods was performed by Mehrjoo et al. [21], who proposed a neural network-based system identification approach for damage detection in truss bridge joints using the natural frequencies and mode shapes as inputs. They concluded that a substructure technique can effectively reduce the number of unknown parameters, and the location of damaged joints and damage severity can be identified with good precision. However, their approach relied on 2D numerical models and the influence of noise on the results was not considered.
Although probabilistic neural networks (PNNs) have not been developed specifically for structural damage detection, their pattern matching capability makes them a very promising tool for classification problems [22,23]. Using the PNN learning and substructuring technique, rapid and accurate localization of damaged joints can be achieved. Moreover, the performance of model updating techniques for quantitative assessment of joint deterioration is accurate and efficient.
Considering the current state of the art and challenges, this paper proposes a new method that can achieve the localization and quantitative evaluation of different types of joint damage in steel truss bridges. Because of the structural complexity of truss bridges, a two-step identification approach is adopted to achieve damage localization and severity assessment in this study. First, a PNN is trained for preliminary localization of the damage to a certain substructure. Second, an FE model updating technique is used to quantitatively assess damage severity. The feasibility of the proposed method is validated on a series of numerical bridge models with single or multiple damage cases. Furthermore, the noise rejection ability of the method is investigated.

2. Bridge Description

A single-track through-type bolted-welded steel truss bridge is employed as a case study in this research (Figure 1). The steel truss bridge has a span of 64 m and comprises two 11 m high parallel triangular trusses located 5.75 m apart. Each main truss is divided into eight segments with a length of 8 m. The structural members are all welded H-shape sections. An open-deck design is adopted for the bridge deck with welded I-shape sections for the longitudinal and lateral beams. Grade Q345qD steel is used for the main components. Friction-type high-strength M22 bolts are used in the truss joints. The pretension of the high-strength bolts is 200 kN and the friction coefficient is 0.45. The dimensions and node numbers of the bridge are shown in Figure 2.

3. Methodology

Using the design documentation, a 3D FE model of the steel truss bridge is established in ANSYS software (Figure 3a). All the components are modeled by the same element type BEAM 188. Totally, 186 nodes and 136 elements are used and the connections of the members are regarded as rigid. The cross-sectional and material properties of the bridge components are listed in Table 1. The first four mode shapes (two lateral bending, torsional, and vertical bending modes) of the bridge in the healthy condition are shown in Figure 4.

3.1. Simplified Simulation of Joint Damage

In a steel truss bridge assembled using bolts, when looseness or another fault occurs in the member connection due to repetitive fatigue loads, there is a marked loss of joint stiffness. Thus, adjusting the stiffness of joint elements is usually adopted in simplified simulations of joint damage [21]. In this study, the members with joint damage are subdivided into three regions in the numerical model and the two regions with a length of 1/10 of the total member length, L, adjacent to the joints are designated as the end elements (Figure 3b). It is then assumed that the same damage occurs at both ends of the member. The joint damage is numerically simulated by reducing Young’s modulus, E, of the end elements for convenience [22]. The severity of damage is quantified by the stiffness reduction coefficient, α, which is defined as the ratio of the slope of the moment–rotation curve at the joint:
α = 1 k d k u = 1 E d I / L E u I / L = 1 E d E u
where ku and kd are the slopes of the moment–rotation curves of the joint before and after the damage occurrence, respectively, and Eu and Ed are Young’s moduli of the end members before and after damage occurrence, respectively.

3.2. Damage Localization Using PNN

3.2.1. Probabilistic Neural Network

A PNN is a type of supervised feedforward neural network, which was developed by Specht [24] from the radial basis function neural network (RBFNN) concept. It is suited for general classification problems, while the Bayesian decision strategy is widely accepted as a theoretical basis. Consider a p-dimensional pattern vector, X = [ x 1   x 2   x p ] T , that belongs to one of a number of categories, θ 1 , θ 2 , …, θ m . The classification, d ( X ) θ m , can be determined based on the Bayes decision rule if the following condition is satisfied:
h m l m f m ( X ) > h k l k f k ( X ) ,     f o r   a l l   k m
where hm and hk are the prior probabilities of occurrence of patterns from categories m and k, respectively, fm(X) and fk(X) are the probability density functions (PDFs) for categories m and k, respectively, lm is the loss function associated with decision d ( X ) θ m when θ = θ m , and lk is the loss function associated with decision d ( X ) θ k when θ = θ k .
For the damage detection problem, ℎ and 𝑙 can be considered equal for all categories. Therefore, the key to using the decision rule given by Equation (2) is to estimate the PDFs. In the PNN, a nonparametric estimation technique, known as Parzen windows, is used to estimate the normal probability density functions [25,26,27]:
f m ( X ) = 1 ( 2 π ) p / 2 σ p 1 n i = 1 n exp [ ( X X m i ) T ( X X m i ) 2 σ 2 ]
where n is the total number of training patterns in category m, X m i is the ith training pattern for category m, and σ is the smoothing parameter.
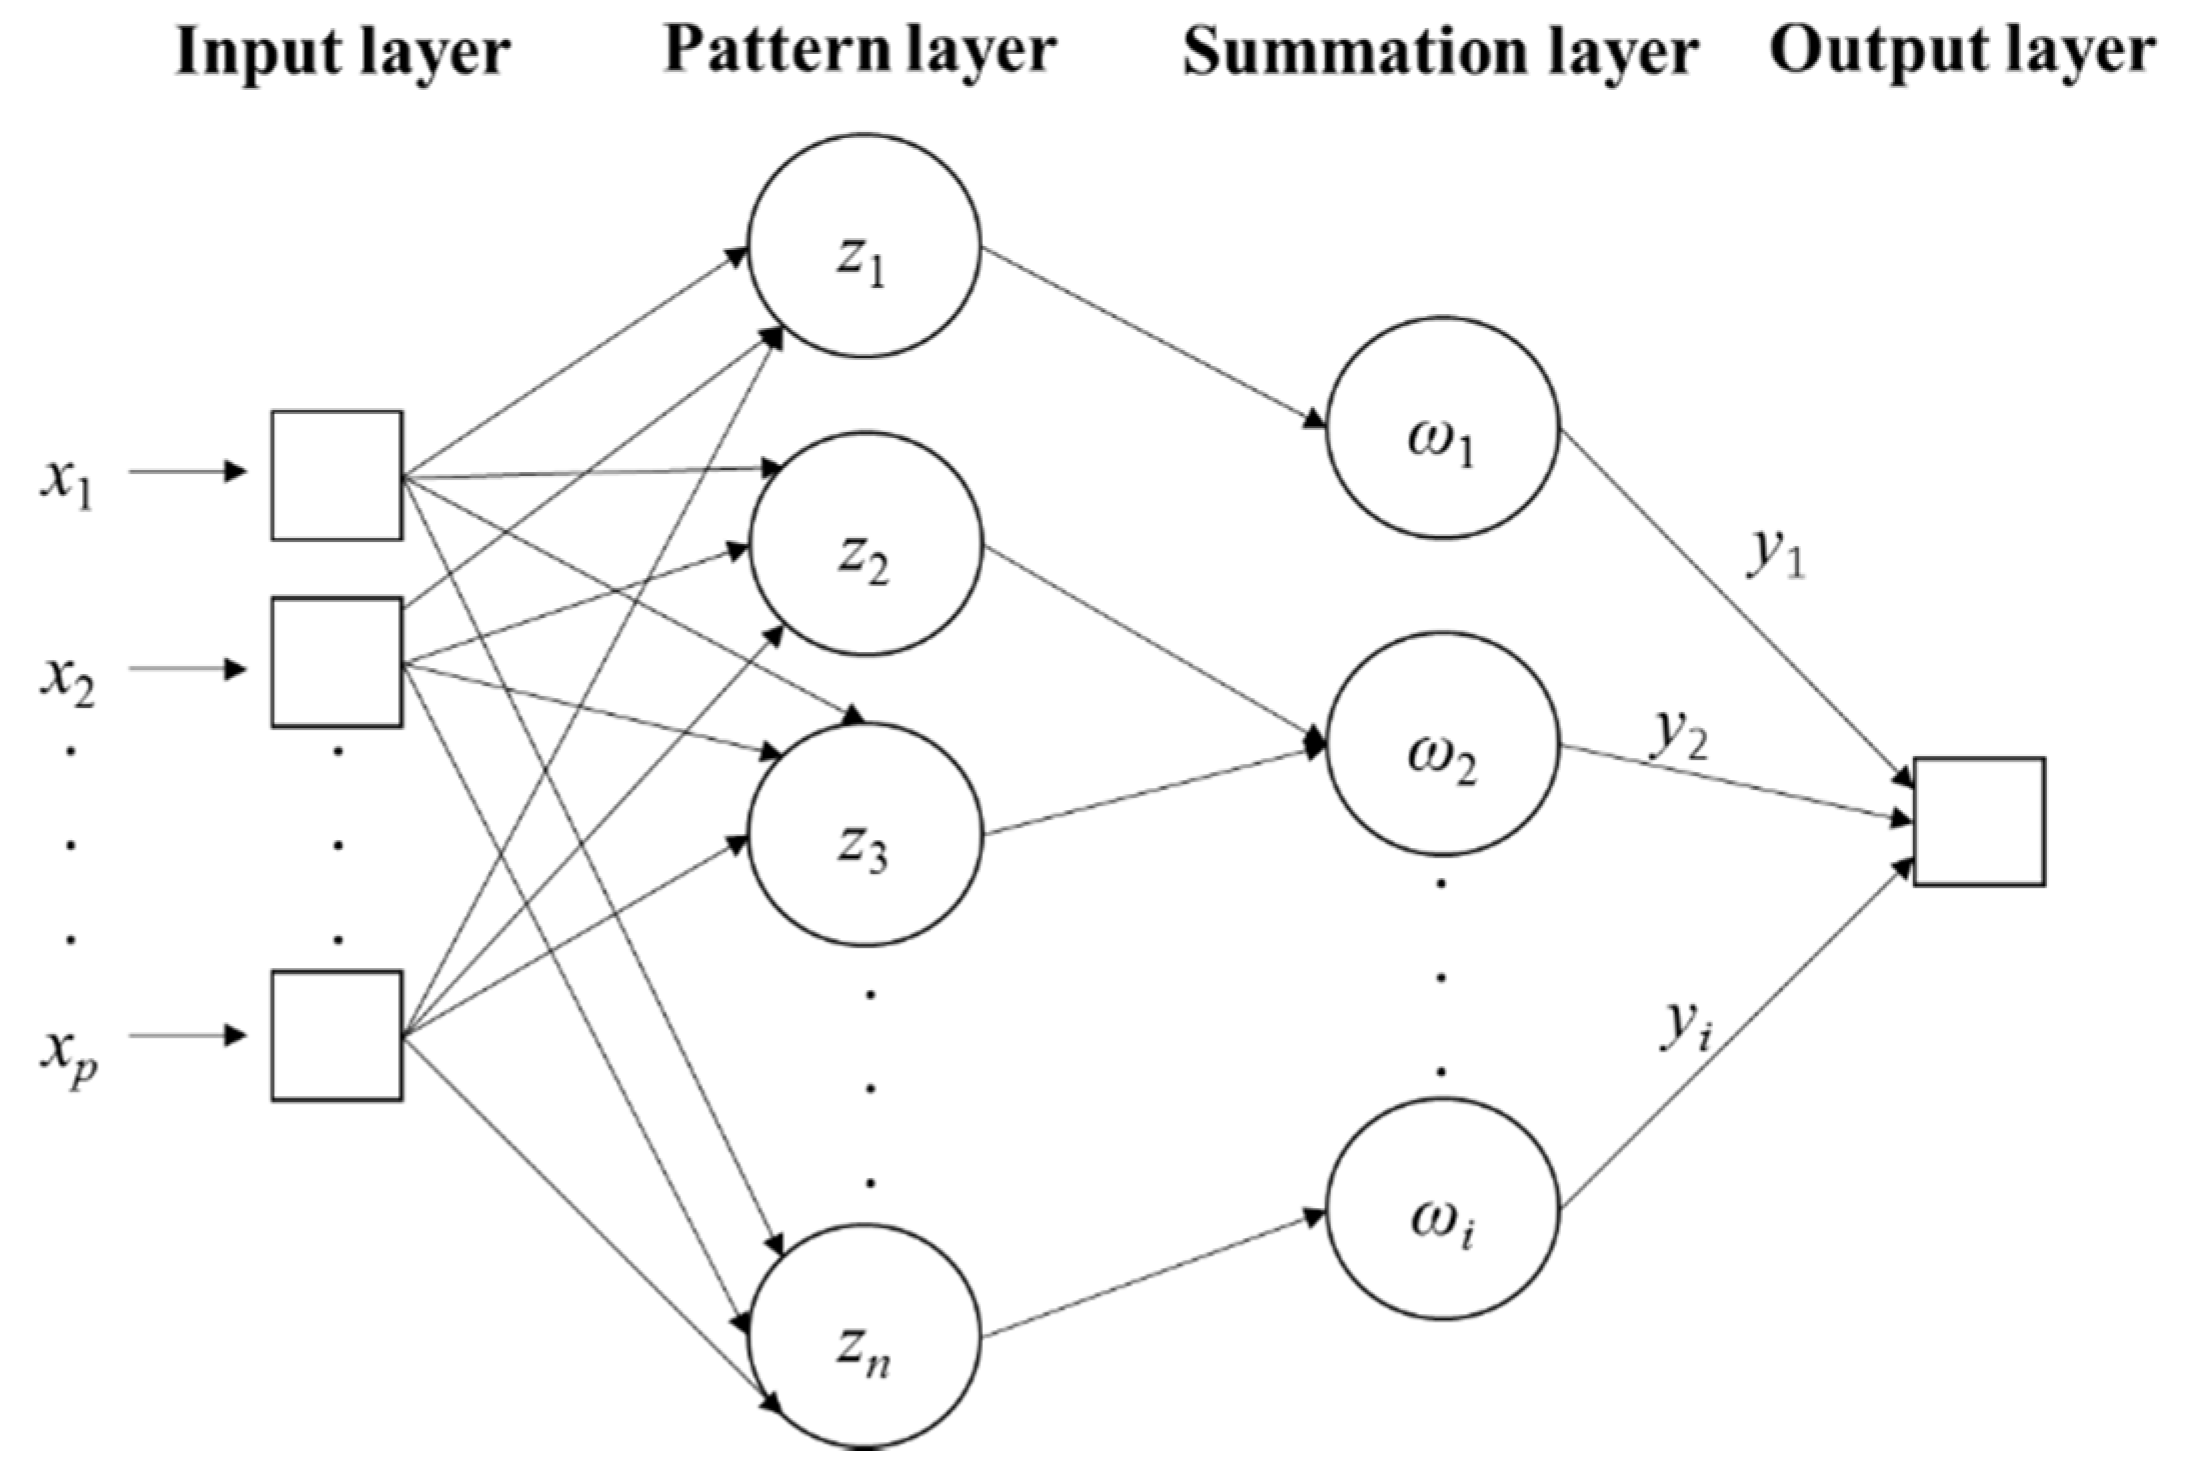
The PNN is used to cast the Bayesian decision analysis with the Parzen windows estimator into an artificial neural network framework. Figure 5 displays the architecture of the PNN, which is a multilayered feedforward network with four layers, namely, the input, pattern, summation, and output layers. The input layer has as many neurons as the dimension of the sample vector, and is used to input samples and pass them to the hidden layer. The hidden layer calculates the radial basis function value of the input sample, and outputs the radial distance between the sample and the center of the neuron. The number of neurons in the summation layer is the total number of categories of pattern classification, and their function is to calculate the weighted average value of the hidden layer outputs. In the output layer, the pattern discrimination of input samples is achieved by associating the sample with the class of highest probability.

3.2.2. Input Selection and Testing Method

The function of the PNN is pattern classification. By dividing the steel truss bridge into several substructures, damage identification can be carried out by taking the substructure as a unit for joint damage localization. The training process of the PNN is based on allocating training samples to the corresponding substructure. The substructure can be determined according to the damage mechanism, type and location of structural members, individual structural member characteristics, and other criteria [26].
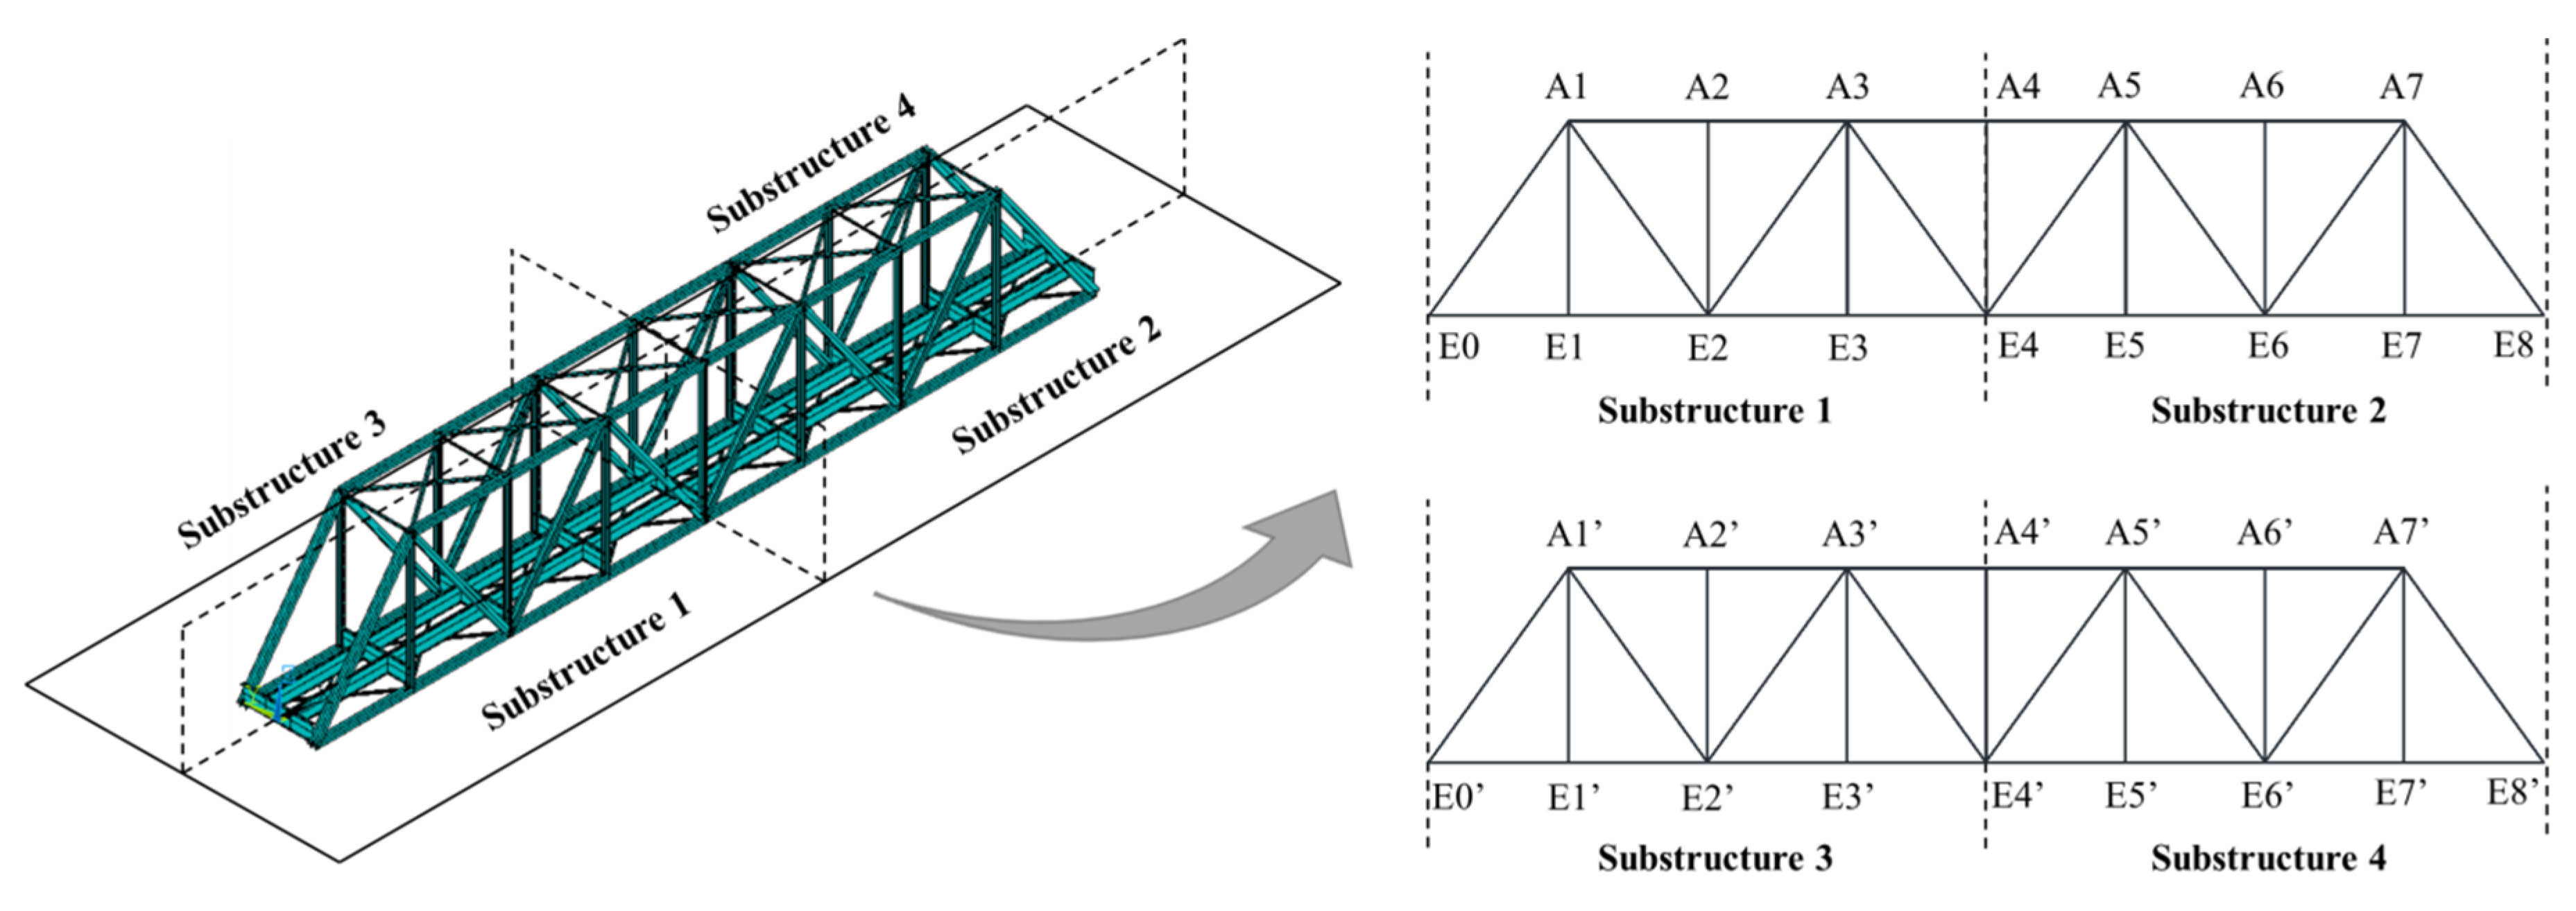
In this study, each main truss is divided into two symmetrical substructures, thus, in total, four substructures, shown in Figure 6, are considered in the PNN. Vertical bars A4-E4 and A4′-E4′, located symmetrically in each truss, are included in Substructures 2 and 4, respectively.
In previous investigations [28,29], the inputs of neural networks for structural damage identification were usually selected from modal dynamic properties, such as modal frequencies, shapes, flexibilities, and curvatures. Among these damage indicators, because of its clear physical interpretation and high sensitivity to localized damage, the modal curvature has great advantages in locating the joint damage. Changes will occur to the modal curvatures at damaged locations, and the change rate of modal curvature (CRMC) is therefore taken as the input of the neural network in this research. The CRMC is defined as follows:
C R M C i = M C d i M C u i M C d i
where MCui and MCdi are the ith order modal curvatures before and after damage occurs, respectively.
Under the assumption of small deformations, the modal curvature can be calculated as the second-order spatial derivative of the modal displacements. Since the curvature cannot be measured directly, in practical applications, it is usually obtained by a central difference approximation from the modal displacements, as follows [30]:
M C i = ϕ i = ϕ i + 1 2 ϕ i + ϕ i 1 h 2
where ϕi is the modal displacement at the ith point, and h is the sensor spacing.
The modal displacements can be obtained by a dynamic test, among which the residual vibration test is currently the most widely adopted method by the railway bridge authorities in China [31]. Hence, virtual train-induced free vibrations of the bridge are used to establish the modal displacements in this research. Considering that the bridge analyzed in this paper belongs to the Shuohuang railway line, a series of moving loads composed of one DF4D locomotive and six C80 trailers traveling at a speed of 80 km/h was employed to simulate the train-induced dynamic loads. The dynamics of the train–bridge interaction and track irregularity were ignored for simplicity. Figure 7 shows the train model and its parameters. Figure 8 shows the flow chart of modal curvature identification based on virtual residual vibration testing.

3.3. Quantitative Damage Severity Assessment Using FE Model Updating

3.3.1. FE Model Updating Parameters

Based on the simplified simulation method of joint damage, the updating parameters are defined using the end-stiffness reduction coefficients. Consequently, the vector composed of the end-stiffness reduction coefficients of the substructure members can be used to quantify the extent of joint damage:
α = [ α 1 , α 2 , , α N ]
where αi is the end-stiffness reduction coefficient of the ith main truss member, and N is the number of members in the substructure.

3.3.2. Objective Function and Optimization Algorithm

The objective function, F, is defined using MCb and MCe representing the vectors formed by the modal curvatures at each measurement point in the actual bridge and finite element model, respectively:
F = M C e M C b M C b
The value of F is always between 0 and 1, which depends on the difference of the modal curvatures.
After the objective function is determined, the process of model updating is to find a set of parameters that minimize the value of the objective function, which is a nonlinear least squares problem. The trust region method [32] is used to adjust the modal curvature vector, until the objective function satisfies the following convergence criteria:
{ F n ξ | F n + 1 F n | / F n ε n N
where n is the iteration number, ξ is the admissible residual, ε is the admissible difference between iterations, and N is the maximum number of iterations.

3.4. Two-Step Damage Identification Process

A two-step joint damage evaluation method using a PNN and FE model updating was developed, whose procedural steps are as follows (Figure 9):
Step 1: Preliminary localization of damage
  • Subdivide the steel truss bridge into several substructures and use the CRMCs as the inputs for the PNN.
  • Establish FE models of the bridge with and without damage, and calculate and normalize the inputs for different damage cases to generate the sample sets for the neural network.
  • Select samples to train the neural network, and use the remaining samples for testing and obtaining the optimum training pattern. Input the modal curvatures obtained from the field measurements into the neural network to localize the damage in a certain substructure.
Step 2: Quantitative assessment of damage severity
4.
Construct the objective function based on the modal curvatures. Identify the end-stiffness reduction coefficients, α, of members in the substructure by the iterative model updating method.

4. Results

4.1. Verification of Input Sensitivity

In order to verify the feasibility of employing the CRMCs as the inputs, four different cases listed in Table 2 were investigated. Since the four substructures are symmetrical, damage is only introduced into Substructure 1. The first-order vertical bending mode of the bridge is taken to calculate the CRMC of each main truss joint.
Figure 10 shows the calculation results of CRMC values of the fundamental vertical bending mode at each substructure node for different damage scenarios. Generally, it can be observed from the figure that the CRMC values in the damaged Substructure 1 are higher than in the remaining undamaged substructures, indicating that the CRMC has a high sensitivity to damage. To present the difference in a more intuitive way, the CRMC values at each substructure node are averaged and compared in Figure 11. The results indicate clear differences between the CRMC values of the fundamental vertical bending mode between the damaged and undamaged substructures.
To assess the feasibility of reducing the excessive effort of measuring the response at all the truss nodes, only the nodes on the lower chord in each substructure were selected to calculate the mean CRMC. It can be seen from Figure 12 that using only the lower chord nodes as the measurement points suffices to identify the damaged substructure. Therefore, the CRMCs calculated using the 12 lower-chord nodes (Figure 13) were used to form a 12-dimensional neural network input vector in the subsequent damage localization studies.

4.2. Damage Localization

4.2.1. Generation of Training and Testing Samples

According to the number of members with damaged joints in a single substructure, single, double, and triple damage cases were considered. In order to generate training patterns, a number of structures with different modal properties were simulated using α values varying from 0.3 to 0.6 for damaged members.
In the present investigation, there were a total of 58 main truss members in the steel truss bridge. For each damage severity, the total numbers of samples in the single, double, and triple damage sample sets were 58, 394, and 1638, respectively (Table 3). The neural network was trained using single damage samples and tested on all three types of damage types. To analyze the damage localization performance using different training patterns, seven training sample cases were considered, as shown in Table 4.

4.2.2. Testing of Trained Neural Networks for Damage Localization

In this study, the MATLAB net = newpnn(P, T, spread) function was employed to establish a PNN model. Apart from the input vector matrix, P, and target class vector matrix, T, the value of spread, i.e., the smoothing parameter, has a strong effect on the final classification. If the spread is close to zero, the network acts as a nearest neighbor classifier. As the spread becomes larger, the designed network takes into account several nearby design vectors [33]. Usually, the investigators would choose this by trial and error. Hence, a numerical test was conducted using a substantial number of single and multiple damage test samples to assess the performance of the established PNN. Here, the test samples were extracted from the non-training sample sets of the single, double, and triple damage types. The numbers of test samples for each damage type were 174, 160, and 160, respectively. Ten different values of spread varying from 0.1 to 1.0 were adopted to determine the suitable training pattern.
Figure 14 shows the localization accuracy achieved with different spread values when single damage occurs to a substructure. As can be observed from the figure, the selection of spread values has a significant impact on the identification results. Taking the training sample Case 2 as an example, the localization accuracy is 89.66% when the spread is 0.9, but only 63.79% when it is 0.1. For each training sample case, the localization accuracy for different damage categories with the optimum spread value is depicted in Figure 15. The following observations can be made:
  • High accuracy can be achieved when 16 training samples are used for single damage cases. A slight improvement can be achieved by including more training samples.
  • The damage severity of the training samples used has little effect on the accuracy of damage localization regardless of whether single or multiple damage detection is attempted.
  • Using a portion of single damage training samples cannot achieve good identification results for multiple damage localization. However, with adequate numbers of training samples, a high accuracy of multiple damage localization can be accomplished.
  • Using single damage samples to train the PNN can effectively achieve damage localization for either single or multiple damage cases, which indicates that the trained PNN has a strong generalization ability.

4.3. Quantitative Damage Severity Assessment

To validate the effectiveness of the proposed quantitative identification technique, eight different damage scenarios involving four single and four multiple damage cases, listed in Table 5, were simulated numerically. For the sake of simplicity, only damage to members of one main truss was considered, with total member numbers of 14 and 15 in Substructures 1 and 2, respectively. The main truss members are labeled as shown in Figure 16.
After the modal curvatures were obtained from the virtual residual vibration test, the trained PNN was used to localize the damaged joints. All damage was localized in the correct substructure, as expected. Then, quantitative damage severity assessment was carried out via the FE model updating technique. In order to ensure the convergence of the inverse solution, several upper chord nodes were added to the original measurement points in this section (Figure 16).

4.3.1. Detection of Single Damage

In the first four damage scenarios, various levels of end-stiffness reduction were introduced to different single members to demonstrate the applicability of the proposed method. Depicted in Figure 17 are the identification results in these single damage cases. Case 1 is taken as an example to illustrate the iterative process convergence, as shown in Figure 18. A comparison of the relative errors between the target and output values is presented in Table 6. From the results shown in Figure 17 and Figure 18 and Table 6, the following conclusions can be drawn:
  • For the single damage cases, the damage extent of different members can all be accurately identified with a maximum error of less than 3.3% between the identified results and real values.
  • Although some non-existent damage is identified in some members, the corresponding end-stiffness reduction coefficients, α, are relatively small, less than 0.1. The false damage identification can be eliminated by ignoring the results with α less than 0.1 in actual applications.
  • As shown in Figure 18, the objective function converges after about 12 iterations, which proves the high efficiency of the proposed method.

4.3.2. Detection of Multiple Damages

In multiple damage Cases 5 to 8, double or triple damage is introduced into a substructure. The detailed identification results of each case and the iterative process of Case 7 are shown in Figure 19 and Figure 20, respectively, while Table 7 presents a comparison of the real and identified values. The following conclusions can be drawn from the above results:
  • When a case of multiple damage occurs in a substructure, it can be effectively identified by the proposed model updating method, including Case 7, despite larger errors (14.25%) compared to other cases.
  • Compared to the single damage cases, the total number of false damage identifications in multiple damage cases is greater. The incorrect α values are, nevertheless, still all less than 0.1.
  • The numbers of steps the method takes to converge in multiple damage cases are generally consistent with the single damage cases, which again validates the high computational efficiency of the proposed method.

4.4. Noise Effect

Since the actual measured data are typically contaminated with noise, a further study on the effectiveness of the proposed damage identification method was conducted. Gaussian white noise was added to the virtual residual vibration response signals to analyze its impact on the identification results. Herein, four different levels of Gaussian white noise were considered, weighed by the signal-to-noise ratio (SNR), defined as follows:
S N R = 10 × log ( n = 1 N x 2 ( n ) n = 1 N [ x ( n ) x s ( n ) ] 2 )
where x(n) is the noisy signal, xs(n) is the noise-free signal, and N is the number of signal samples.
Single damage occurring to a substructure was considered in this analysis and damage identification was conducted using the noise-contaminated data. The noisy data cases are listed in Table 8. Damage localization for different noise levels was performed and damage was correctly localized in Substructure 1, which indicates that the damage localization method based on the PNN has a good anti-noise performance. Quantitative damage severity assessment for different noise levels is shown in Figure 21 and Table 9. It can be concluded that the damage preset cannot be effectively identified when SNR is lower than 30 dB. When SNR reaches 40 dB, the preset damage can be accurately identified, and the false damage index α values are less than 0.1.

5. Discussion

After training with single damage samples and selecting the most suitable training pattern, the damage localization precision of the PNN can exceed 90%, which demonstrates that the proposed damage localization method can effectively localize the member with the joint damage in the correct substructure. Furthermore, the trained PNN has a good damage localization performance even with noise contamination and the proposed FE model updating method can effectively quantify the joint damage severity when the noise is at a low level. Generally, the proposed method has good applicability for joint damage localization and quantification in similar steel truss structures.
Despite the successful evaluation of joint conditions in the case study steel truss bridge, there are still some limitations to our approach. When the proposed FE model updating method is used to quantitatively assess the damage without considering the influence of noise, the damage severity can be accurately identified with a small error. However, if too much noise is present in the residual vibration response, the proposed method may not be precise enough to evaluate the damage. Thus, an important aspect of our future work will be improving the immunity to noise of the proposed method. Furthermore, only numerical examples are considered in the current paper, thus the proposed method will be further validated by experimental case studies in future studies.

6. Conclusions

In this work, a PNN and an FE model updating technique were implemented for joint damage assessment in a steel truss bridge. A two-step approach for damage localization and severity quantification was proposed. The main truss of the bridge was subdivided into several substructures and the PNN was trained for preliminary damage localization to a certain substructure with the CRMCs as the inputs. Extensive numerical tests were conducted to verify the reliability of the trained PNN and obtain the most suitable training patterns. Numerical models with both single and multiple damage cases were established to validate the effectiveness of the proposed joint damage assessment method. Furthermore, the effect of noise on the proposed method performance was also investigated. The main conclusions that can be drawn are as follows:
  • The simplified simulation method of joint damage and substructuring technique were found to be very efficient for reducing the complexity of joint condition evaluation in steel truss bridges.
  • The CRMC has a high sensitivity to local damage. Using only the CRMCs of the fundamental vertical bending mode measured at lower chord nodes as the inputs of the PNN can correctly identify the damaged substructure.
  • Using single damage cases to train the PNN can achieve very high accuracy of joint damage localization for either single or multiple damage detection cases. The damage severity of the training samples adopted for training has little effect on the accuracy of the subsequent unknown damage localization.
  • The proposed model updating method can effectively quantify the joint deterioration with high iteration efficiency and has some robustness to noise.

Author Contributions

Conceptualization, J.Z., C.W., and Z.F.; methodology, J.Z., C.W., and Z.F.; software, J.Z., C.W., and Z.F.; validation, J.Z., C.W., and Z.F.; formal analysis, J.Z., C.W., and Z.F.; investigation, J.Z., C.W., and Z.F.; resources, J.Z., C.W., and Z.F.; data curation, J.Z., C.W., and Z.F.; writing—original draft preparation, J.Z., C.W., and Z.F.; writing—review and editing, J.Z., C.W., and Z.F.; funding acquisition, J.Z. All authors have read and agreed to the published version of the manuscript.

Funding

This research was funded by the National Natural Science Foundation of China, grant number 51678032.

Institutional Review Board Statement

Not applicable.

Informed Consent Statement

Not applicable.

Data Availability Statement

The data presented in this study are available on request from the corresponding author.

Acknowledgments

The authors would like to express their gratitude to EditSprings (https://www.editsprings.com/) for the expert linguistic services provided.

Conflicts of Interest

The authors declare no conflict of interest.

References

  1. Salem, H.M.; Helmy, H.M. Numerical investigation of collapse of the Minnesota I-35W bridge. Eng. Struct. 2014, 59, 635–645. [Google Scholar] [CrossRef]
  2. National Transportation Safety Board. Collapse of I-35W Highway Bridge, Minneapolis, Minnesota, August 1, 2007. Highway Accident Report NTSB/HAR-08/03; Washington, DC, USA. 2008. Available online: http://www.dot.state.mn.us/i35wbridge/pdf/ntsb-report.pdf (accessed on 29 January 2021).
  3. Federal Highway Administration. National Bridge. Inspection Standards; Federal Register, FHWA: Washington, DC, USA, 2004. [Google Scholar]
  4. Jiang, T.; Li, Y.; Song, G. Detection of High-Strength Bolts Looseness Using Lead Zirconate Titanate Due to Wavelet Packet Analysis. In Proceedings of Earth and Space 2018: Engineering for Extreme Environments, Cleveland, Ohio, USA, 9–12 April 2018; ASCE: Reston, VA, USA, 2018. [Google Scholar]
  5. Phares, B.M.; Washer, G.A.; Rolander, D.D.; Graybeal, B.A.; Moore, M. Routine highway bridge inspection condition documentation accuracy and reliability. J. Bridge. Eng. 2004, 9, 403–413. [Google Scholar] [CrossRef]
  6. Nikravesh, S.M.Y.; Goudarzi, M. A review paper on looseness detection methods in bolted structures. Lat. Am. J. Solids Struct. 2017, 14, 2153–2176. [Google Scholar] [CrossRef] [Green Version]
  7. Kong, X.; Li, J. Image Registration-Based Bolt Loosening Detection of Steel Joints. Sensors 2018, 18, 1000. [Google Scholar] [CrossRef] [PubMed] [Green Version]
  8. Pham, H.C.; Ta, Q.-B.; Kim, J.-T.; Ho, D.-D.; Tran, X.-L.; Huynh, T.-C. Bolt-Loosening Monitoring Framework Using an Image-Based Deep Learning and Graphical Model. Sensors 2020, 20, 3382. [Google Scholar] [CrossRef]
  9. An, Y.; Li, B.; Ou, J. An algorithm for damage localization in steel truss structures: Numerical simulation and experimental validation. J. Intell. Mater. Syst. Struct. 2013, 24, 1683–1698. [Google Scholar] [CrossRef]
  10. An, Y.; Ou, J. Experimental and numerical studies on damage localization of simply supported beams based on curvature difference probability method of waveform fractal dimension. J. Intell. Mater. Syst. Struct. 2012, 23, 415–426. [Google Scholar] [CrossRef]
  11. Yang, J.N.; Xia, Y.; Loh, C.H. Damage identification of bolt connections in a steel frame. J. Struct. Eng. 2014, 140, 04013064. [Google Scholar] [CrossRef]
  12. Li, J.; Hao, H. Health monitoring of joint conditions in steel truss bridges with relative displacement sensors. Measurement 2016, 88, 360–371. [Google Scholar] [CrossRef] [Green Version]
  13. Tan, Z.X.; Thambiratnam, D.P.; Chan, T.H.T.; Gordan, M.; Razak, H.A. Damage detection in steel-concrete composite bridge using vibration characteristics and artificial neural network. Struct. Infrastruct. Eng. 2020, 16, 1247–1261. [Google Scholar] [CrossRef]
  14. Chun, P.J.; Yamane, T.; Izumi, S.; Kuramoto, N. Development of a Machine Learning-Based Damage Identification Method Using Multi-Point Simultaneous Acceleration Measurement Results. Sensors 2020, 20, 2780. [Google Scholar] [CrossRef] [PubMed]
  15. Padil, K.H.; Bakhary, N.; Hao, H. The use of a non-probabilistic artificial neural network to consider uncertainties in vibration-based-damage detection. Mech. Syst. Signal. Process. 2017, 83, 194–209. [Google Scholar] [CrossRef]
  16. Abdeljaber, O.; Avci, O.; Kiranyaz, S.; Gabbouj, M.; Inman, D.J. Real-time vibration-based structural damage detection using one-dimensional convolutional neural networks. J. Sound Vib. 2017, 388, 154–170. [Google Scholar] [CrossRef]
  17. Chun, P.J.; Yamashita, H.; Furukawa, S. Bridge damage severity quantification using multipoint acceleration measurement and artificial neural networks. Shock Vib. 2015, 2015, 1–11. [Google Scholar] [CrossRef] [Green Version]
  18. Figueiredo, E.; Park, G.; Farrar, C.R.; Worden, K.; Figueiras, J. Machine learning algorithms for damage detection under operational and environmental variability. Struct. Health Monit. 2011, 10, 559–572. [Google Scholar] [CrossRef]
  19. Liu, H.B.; Jiao, Y.B. Application of genetic algorithm-support vector machine (GA-SVM) for damage identification of bridge. Inter. J. Comput. Intell. Appl. 2011, 10, 383–397. [Google Scholar] [CrossRef]
  20. Yam, L.H.; Yan, Y.J.; Jiang, J.S. Vibration-based damage detection for composite structures using wavelet transform and neural network identification. Compos. Struct. 2003, 60, 403–412. [Google Scholar] [CrossRef]
  21. Mehrjoo, M.; Khaji, N.; Moharrami, H.; Bahreininejad, A. Damage detection of truss bridge joints using Artificial Neural Networks. Expert Syst. Appl. 2008, 35, 1122–1131. [Google Scholar] [CrossRef]
  22. Yin, T.; Zhu, H.P. Probabilistic Damage Detection of a Steel Truss Bridge Model by Optimally Designed Bayesian Neural Network. Sensors 2018, 18, 3371. [Google Scholar] [CrossRef] [Green Version]
  23. Palomino, L.V.; Steffen, V., Jr.; Neto, R.M.F. Probabilistic Neural Network Applied to Impedance-Based Structural Health Monitoring for Damage Classification. In Proceedings of the 8th International Conference on Structural Dynamics, EURODYN 2011, Leuven, Belgium, 4–6 July 2011. [Google Scholar]
  24. Specht, D.F. Probabilistic neural networks. Neural Netw. 1990, 3, 109–118. [Google Scholar] [CrossRef]
  25. Wasserman, P.D. Advanced Methods in Neural Computing; Van Nostrand, R., Ed.; John Wiley & Sons, Inc.: Hoboken, NJ, USA, 1993. [Google Scholar]
  26. Lee, J.-J.; Yun, C.-B. Damage Localization for Bridges Using Probabilistic Neural Networks. KSCE J. Civ. Eng. 2007, 11, 111–120. [Google Scholar] [CrossRef]
  27. Li, P. Structural damage localization using probabilistic neural networks. Math. Comput. Model. 2011, 54, 965–969. [Google Scholar] [CrossRef]
  28. Zhou, X.T.; Ni, Y.Q.; Zhang, F.L. Damage localization of cable-supported bridges using modal frequency data and probabilistic neural network. Math. Probl. Eng. 2014, 2014, 837963. [Google Scholar] [CrossRef] [Green Version]
  29. Vagnoli, M.; Remenyte-Prescott, R.; Andrews, J. Railway bridge structural health monitoring and fault detection: State-of-the-art methods and future challenges. Struct. Health Monit. 2018, 17, 971–1007. [Google Scholar] [CrossRef]
  30. Pandey, A.K.; Biswas, M.; Samman, M.M. Damage detection from changes in curvature mode shapes. J. Sound Vib. 1991, 145, 321–332. [Google Scholar] [CrossRef]
  31. Ministry of Railways of the People’s Republic of China. China Railway Industry Standard. Code for Rating Existing Railway Bridges. 2004. Available online: http://m.wdfxw.net/Fulltext49716052.htm (accessed on 29 January 2021).
  32. Mazzotti, M.; Mao, Q.; Bartoli, I.; Livadiotis, S. A multiplicative regularized Gauss-Newton method with trust region Sequential Quadratic Programming for structural model updating. Mech. Syst. Signal. Process. 2019, 131, 417–433. [Google Scholar] [CrossRef]
  33. MATLAB 2017b. MATLAB Version R2017b; The Mathworks, Inc.: Natick, MA, USA, 2017. [Google Scholar]
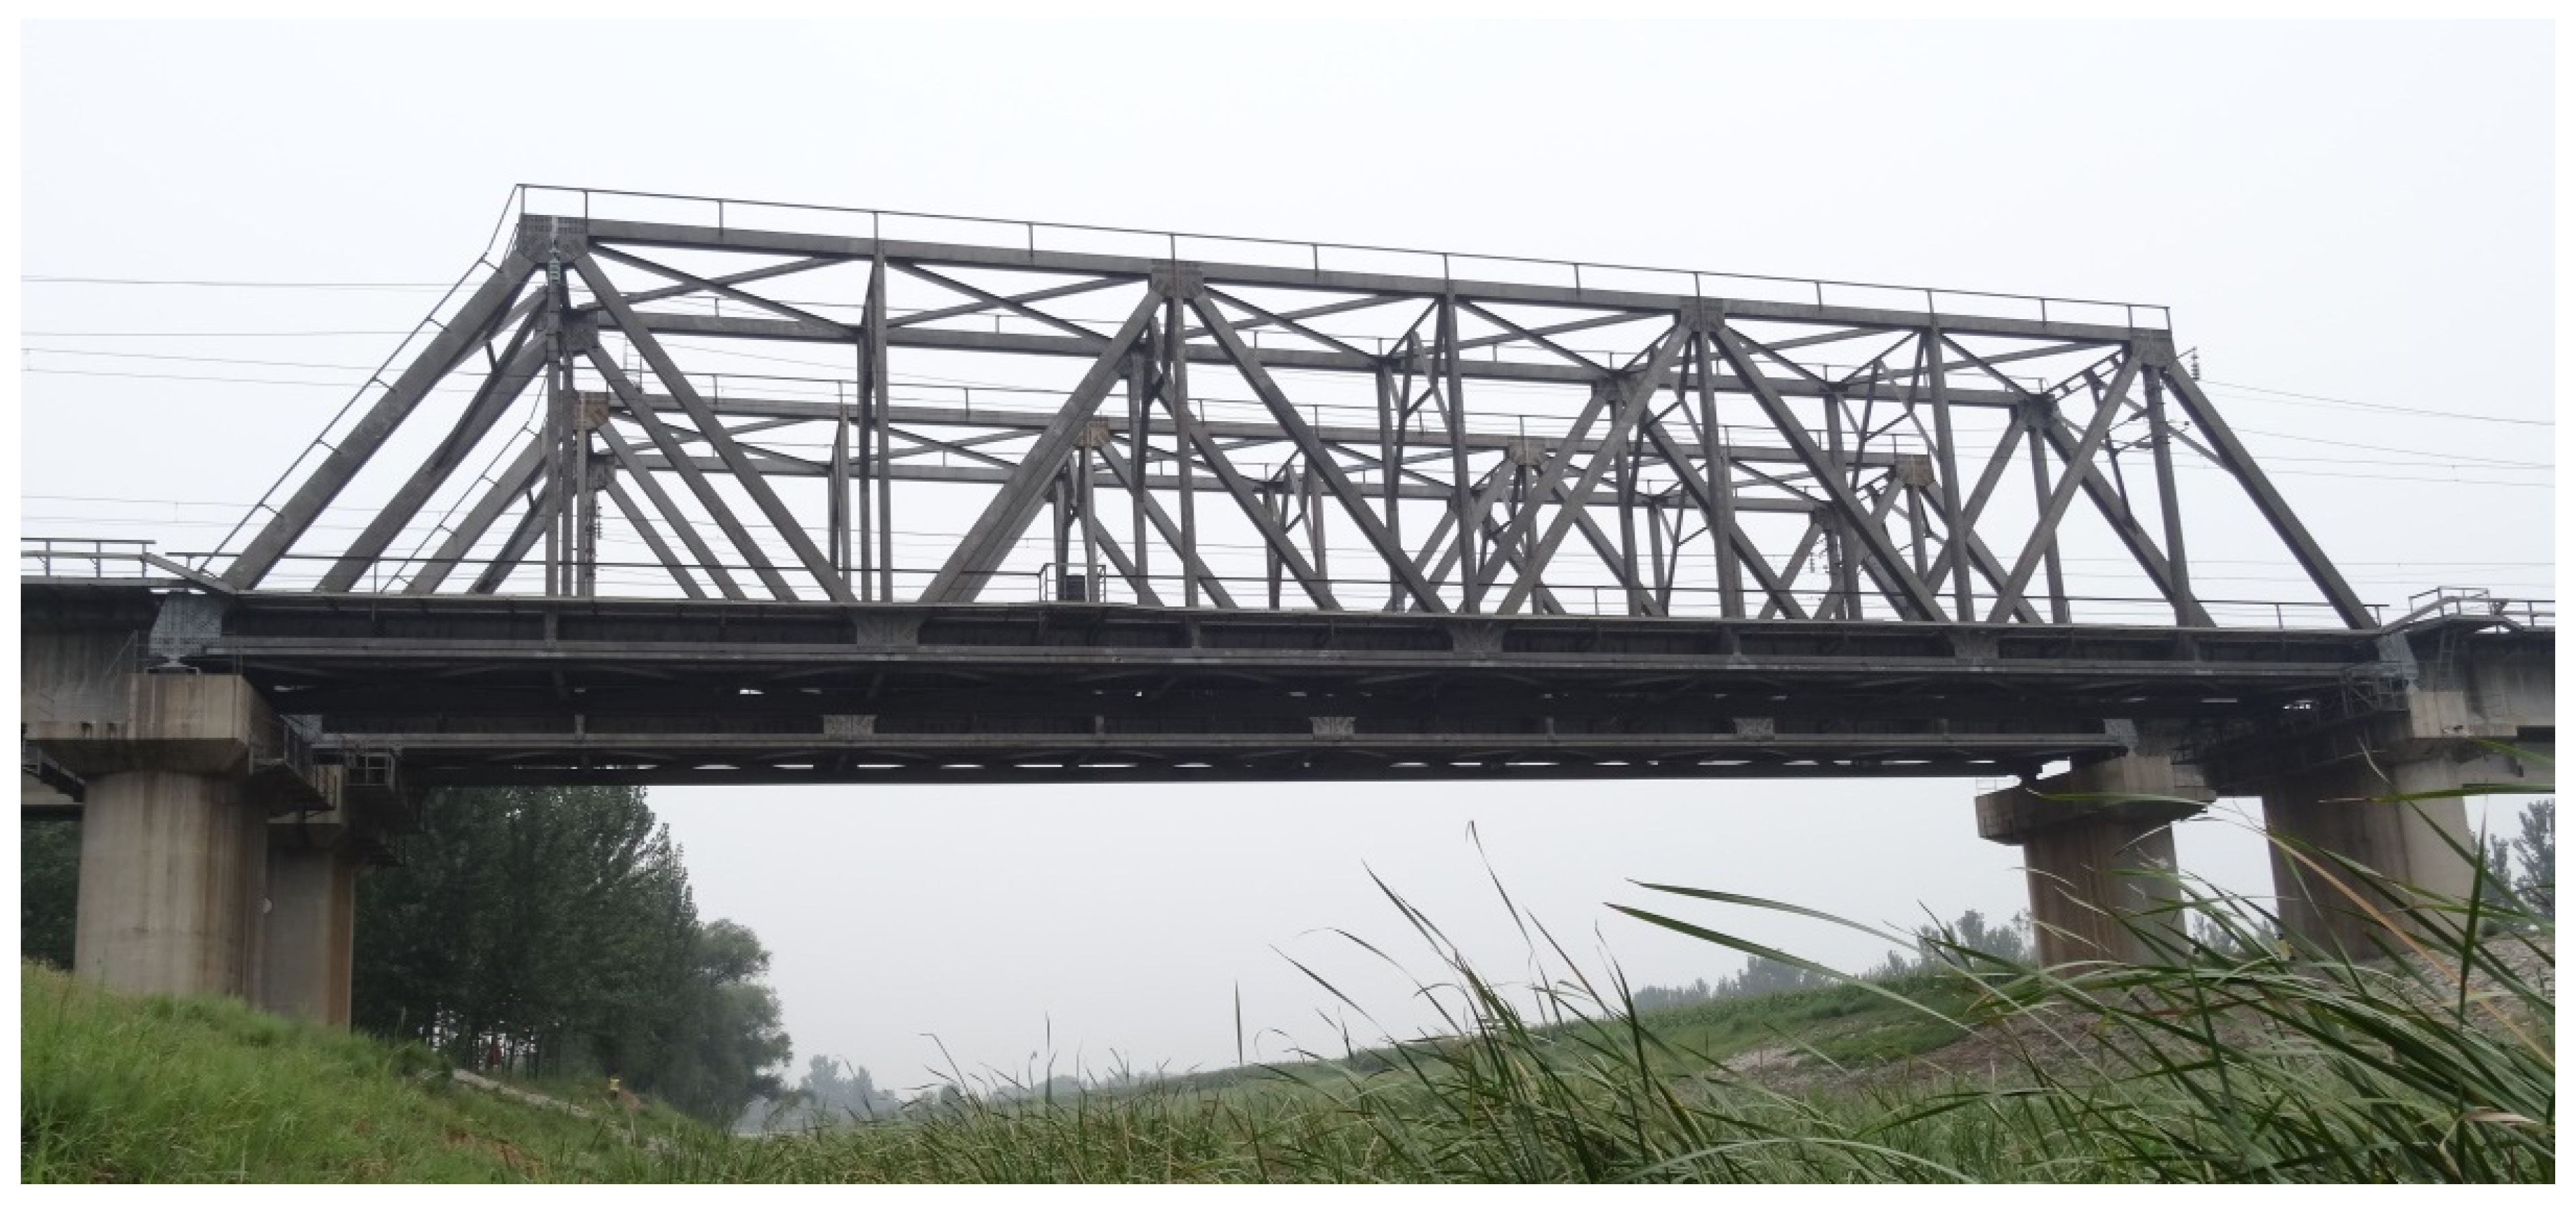
Figure 1. Overall view of case study through-type bolted-welded steel truss bridge.
Sustainability 13 01474 g001
Figure 2. Dimensions and details of case study bridge (unit: mm).
Sustainability 13 01474 g002
Figure 3. ANSYS steel truss bridge model: (a) overall view and (b) modeling of member with joint damage.
Sustainability 13 01474 g003
Figure 4. First four mode shapes of bridge in healthy condition: (a) Mode 1 (1.55 Hz); (b) Mode 2 (4.21 Hz); (c) Mode 3 (4.48 Hz); and (d) Mode 4 (5.08 Hz).
Sustainability 13 01474 g004aSustainability 13 01474 g004b
Figure 5. Architecture of probabilistic neural network (PNN).
Sustainability 13 01474 g005
Figure 6. Substructures of steel truss bridge.
Sustainability 13 01474 g006
Figure 7. Train components and load model: (a) photograph of DF4D locomotive; (b) axle load and wheelbase diagram of DF4D locomotive; (c) photograph of C80 trailer; and (d) axle load and wheelbase diagram of C80 trailer (unit: m).
Sustainability 13 01474 g007
Figure 8. Flow chart of modal curvature (MC) identification based on residual vibration testing.
Sustainability 13 01474 g008
Figure 9. Flow chart of proposed joint damage assessment method for steel truss bridges.
Sustainability 13 01474 g009
Figure 10. Fundamental vertical bending mode CRMCs of main truss joints for various damage cases: (a) Case 1; (b) Case 2; (c) Case 3; and (d) Case 4.
Sustainability 13 01474 g010
Figure 11. Mean CRMCs of main truss nodes in each substructure.
Sustainability 13 01474 g011
Figure 12. Mean CRMCs of lower chord nodes in each substructure.
Sustainability 13 01474 g012
Figure 13. Measurement points used for localization of bolt looseness.
Sustainability 13 01474 g013
Figure 14. Damage localization accuracy versus spread values in single damage cases.
Sustainability 13 01474 g014
Figure 15. Localization accuracy for single and multiple damage cases using optimum spread value.
Sustainability 13 01474 g015
Figure 16. Main truss member numbering in Substructures 1 and 2.
Sustainability 13 01474 g016
Figure 17. Identification results in single damage cases: (a) Case 1; (b) Case 2; (c) Case 3; and (d) Case 4.
Sustainability 13 01474 g017
Figure 18. Iterative solution of Case 1.
Sustainability 13 01474 g018
Figure 19. Identification results in multiple damage cases: (a) Case 5; (b) Case 6; (c) Case 7; and (d) Case 8.
Sustainability 13 01474 g019aSustainability 13 01474 g019b
Figure 20. Iterative solution of Case 7.
Sustainability 13 01474 g020
Figure 21. Damage identification results for different noise levels: (a) SNR = 10 dB; (b) SNR = 20 dB; (c) SNR = 30 dB; and (d) SNR = 40 dB.
Sustainability 13 01474 g021
Table 1. Cross-sectional and material properties of steel truss bridge model.
Component of Main TrussCross-Sectional PropertyMaterial Property
Section TypeCross-Sectional Area (m2)Moment of Inertia (m4)Young’s Modulus (GPa)Poisson’s Ratio (-)Mass Density (kg/m3)
Lower chordsH-shaped0.01540.623×10−32050.37850
Upper chordsH-shaped0.023440.965×10−32050.37850
Vertical rodsH-shaped0.01060.382×10−32050.37850
Diagonal rodsH-shaped0.0190.791×10−32050.37850
Diagonal rods at both endsH-shaped0.029041.236×10−32050.37850
Table 2. Change rate of modal curvature (CRMC) sensitivity analysis cases.
Case No.Member with Bolt LoosenessMember LocationEnd-Stiffness Reduction Coefficient, α
1E3-E4Lower chord0.5
2A2–A3Upper chord0.5
3A1–E1Vertical chord0.5
4A3-E2Diagonal chord0.5
Table 3. Neural network sample sets.
Damage TypeSingle damage Double damage Triple damage
Sample Set No.1234 5678 9101112
End-stiffnessReduction Coefficient, α0.30.40.50.6 0.30.40.50.6 0.30.40.50.6
Numberof Samples58585858 394394394394 1638163816381638
Table 4. Training samples cases.
Case No.Damage TypeEnd-Stiffness Reduction Coefficient, αNumber of Training Samples
1Single damage0.38
2Single damage0.316
3Single damage0.324
4Single damage0.358
5Single damage0.458
6Single damage0.558
7Single damage0.658
Table 5. Damage cases for quantitative damage severity assessment.
Case No.Damage TypeMember with Joint Damage (Member No.)End-Stiffness Reduction Coefficient, α
1Single damageA2–A3 (6)0.3
2A1–E1 (8)0.6
3E4–E5 (15)0.4
4A5–E6 (27)0.5
5Multiple damageA3–A4, A3–E4 (7, 14)0.2, 0.7
6E4–E5, A5–E5 (15, 23)0.4, 0.6
7E3–E4, A2–A3, A3–E2 (4, 6, 13)0.2, 0.4, 0.6
8A4–E4, A5–E4, A7–E6 (22, 26, 28)0.5, 0.7, 0.3
Table 6. Comparison of real and identified values in single damage cases.
Case No.Member with Joint DamageReal ValueIdentified ValueRelative Error (%)
160.30.290−3.33
280.60.597−0.50
3150.40.397−0.75
4270.50.5000
Table 7. Comparison of real and identified values in multiple damage cases.
Case No.Member with Joint DamageReal ValueIdentified ValueRelative Error (%)
57, 140.2, 0.70.185, 0.702−7.50, 0.29
615, 230.4, 0.60.395, 0.592−1.25, −1.33
74, 6, 130.2, 0.4, 0.60.181, 0.343, 0.597−9.50, −14.25, −0.50
822, 26, 280.5, 0.7, 0.30.492, 0.700, 0.301−1.50, 0, 0.33
Table 8. Noisy data cases.
Case No.Member with Joint Damage (Member No.)End-Stiffness Reduction Coefficient, αSignal-to-Noise Ratio (SNR) (dB)
9A2–A3 (6)0.510
1020
1130
1240
Table 9. Comparison of real and identified values for different noise levels.
Noise LevelMember with Joint DamageReal ValueIdentified ValueRelative Error (%)
10 dB6 (A2–A3)0.50.76052.00
20 dB0.01297.60
30 dB0.58116.20
40 dB0.5020.40
Publisher’s Note: MDPI stays neutral with regard to jurisdictional claims in published maps and institutional affiliations.