Quantitative Evaluation of Soil Quality Using Principal Component Analysis: The Case Study of El-Fayoum Depression Egypt
Abstract
:1. Introduction
- Removes correlated features that undermine the statistical significance of an independent variable [29];
- Improves algorithm performance, which can be significantly degraded if too many features are present in models, and speeds up analyses [30];
- Reduces overfitting: PCA helps in overcoming the overfitting issue by minimizing the number of variables in the investigated dataset [31];
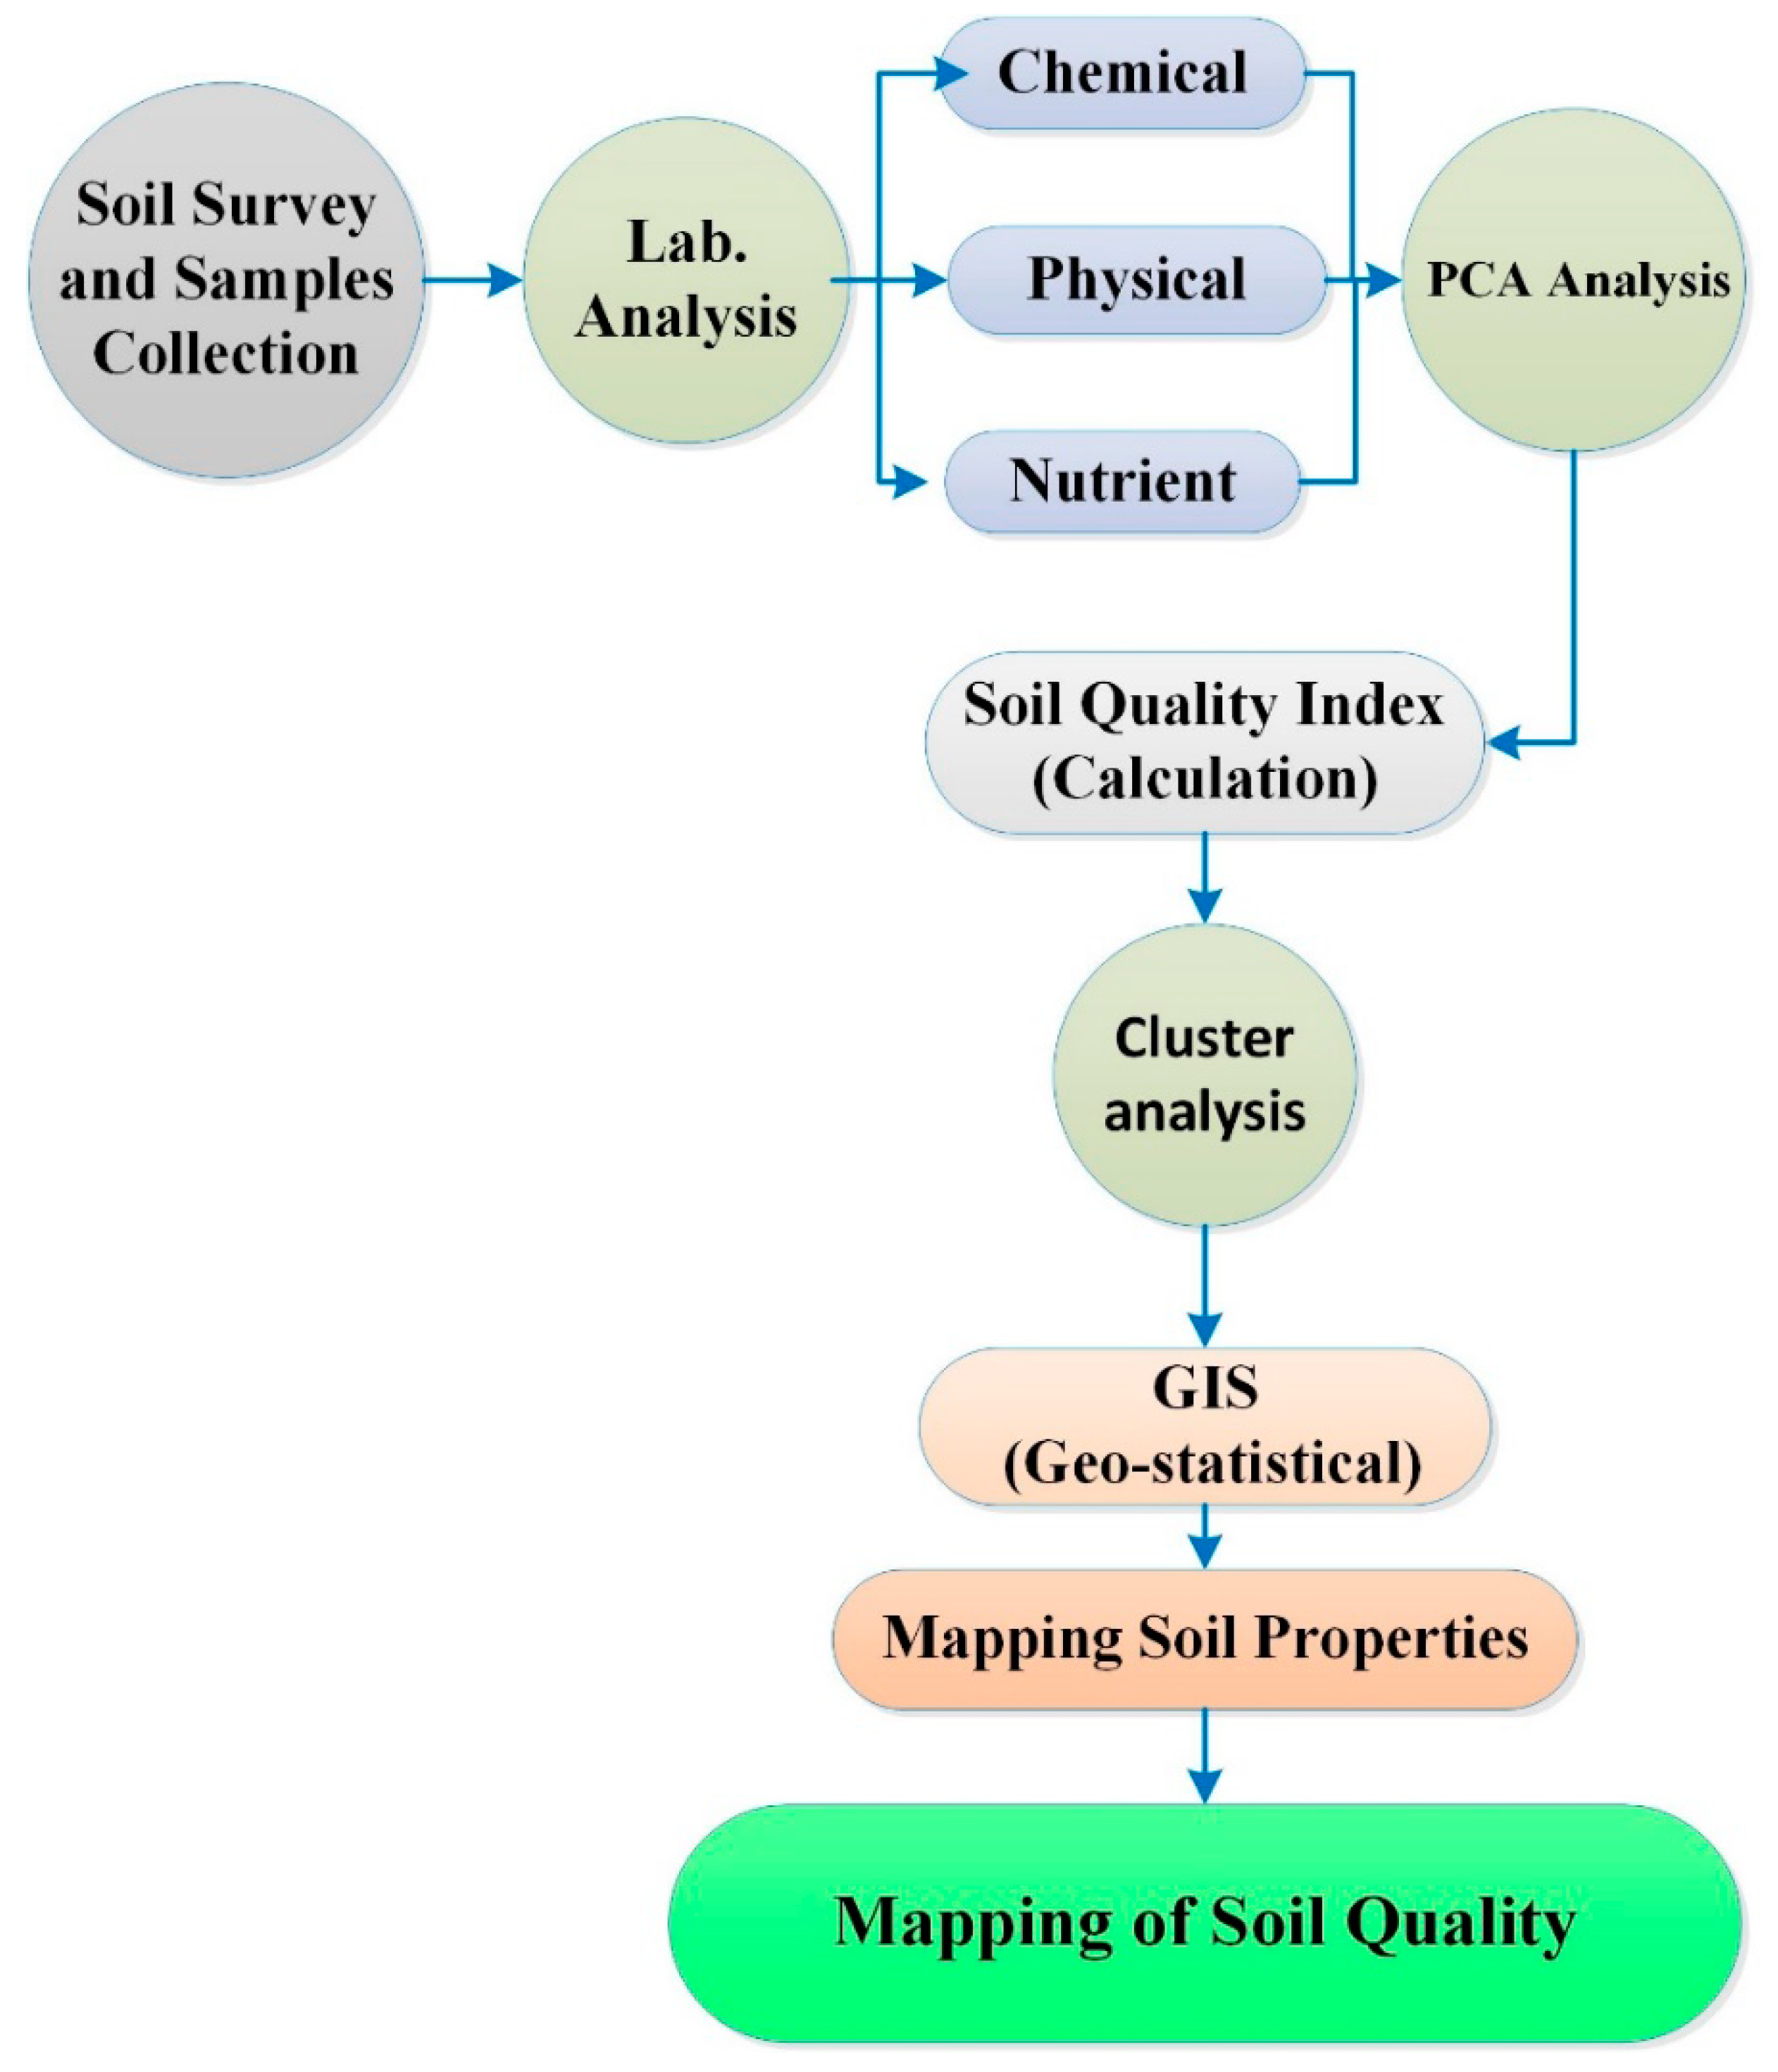
2. Materials and Methods
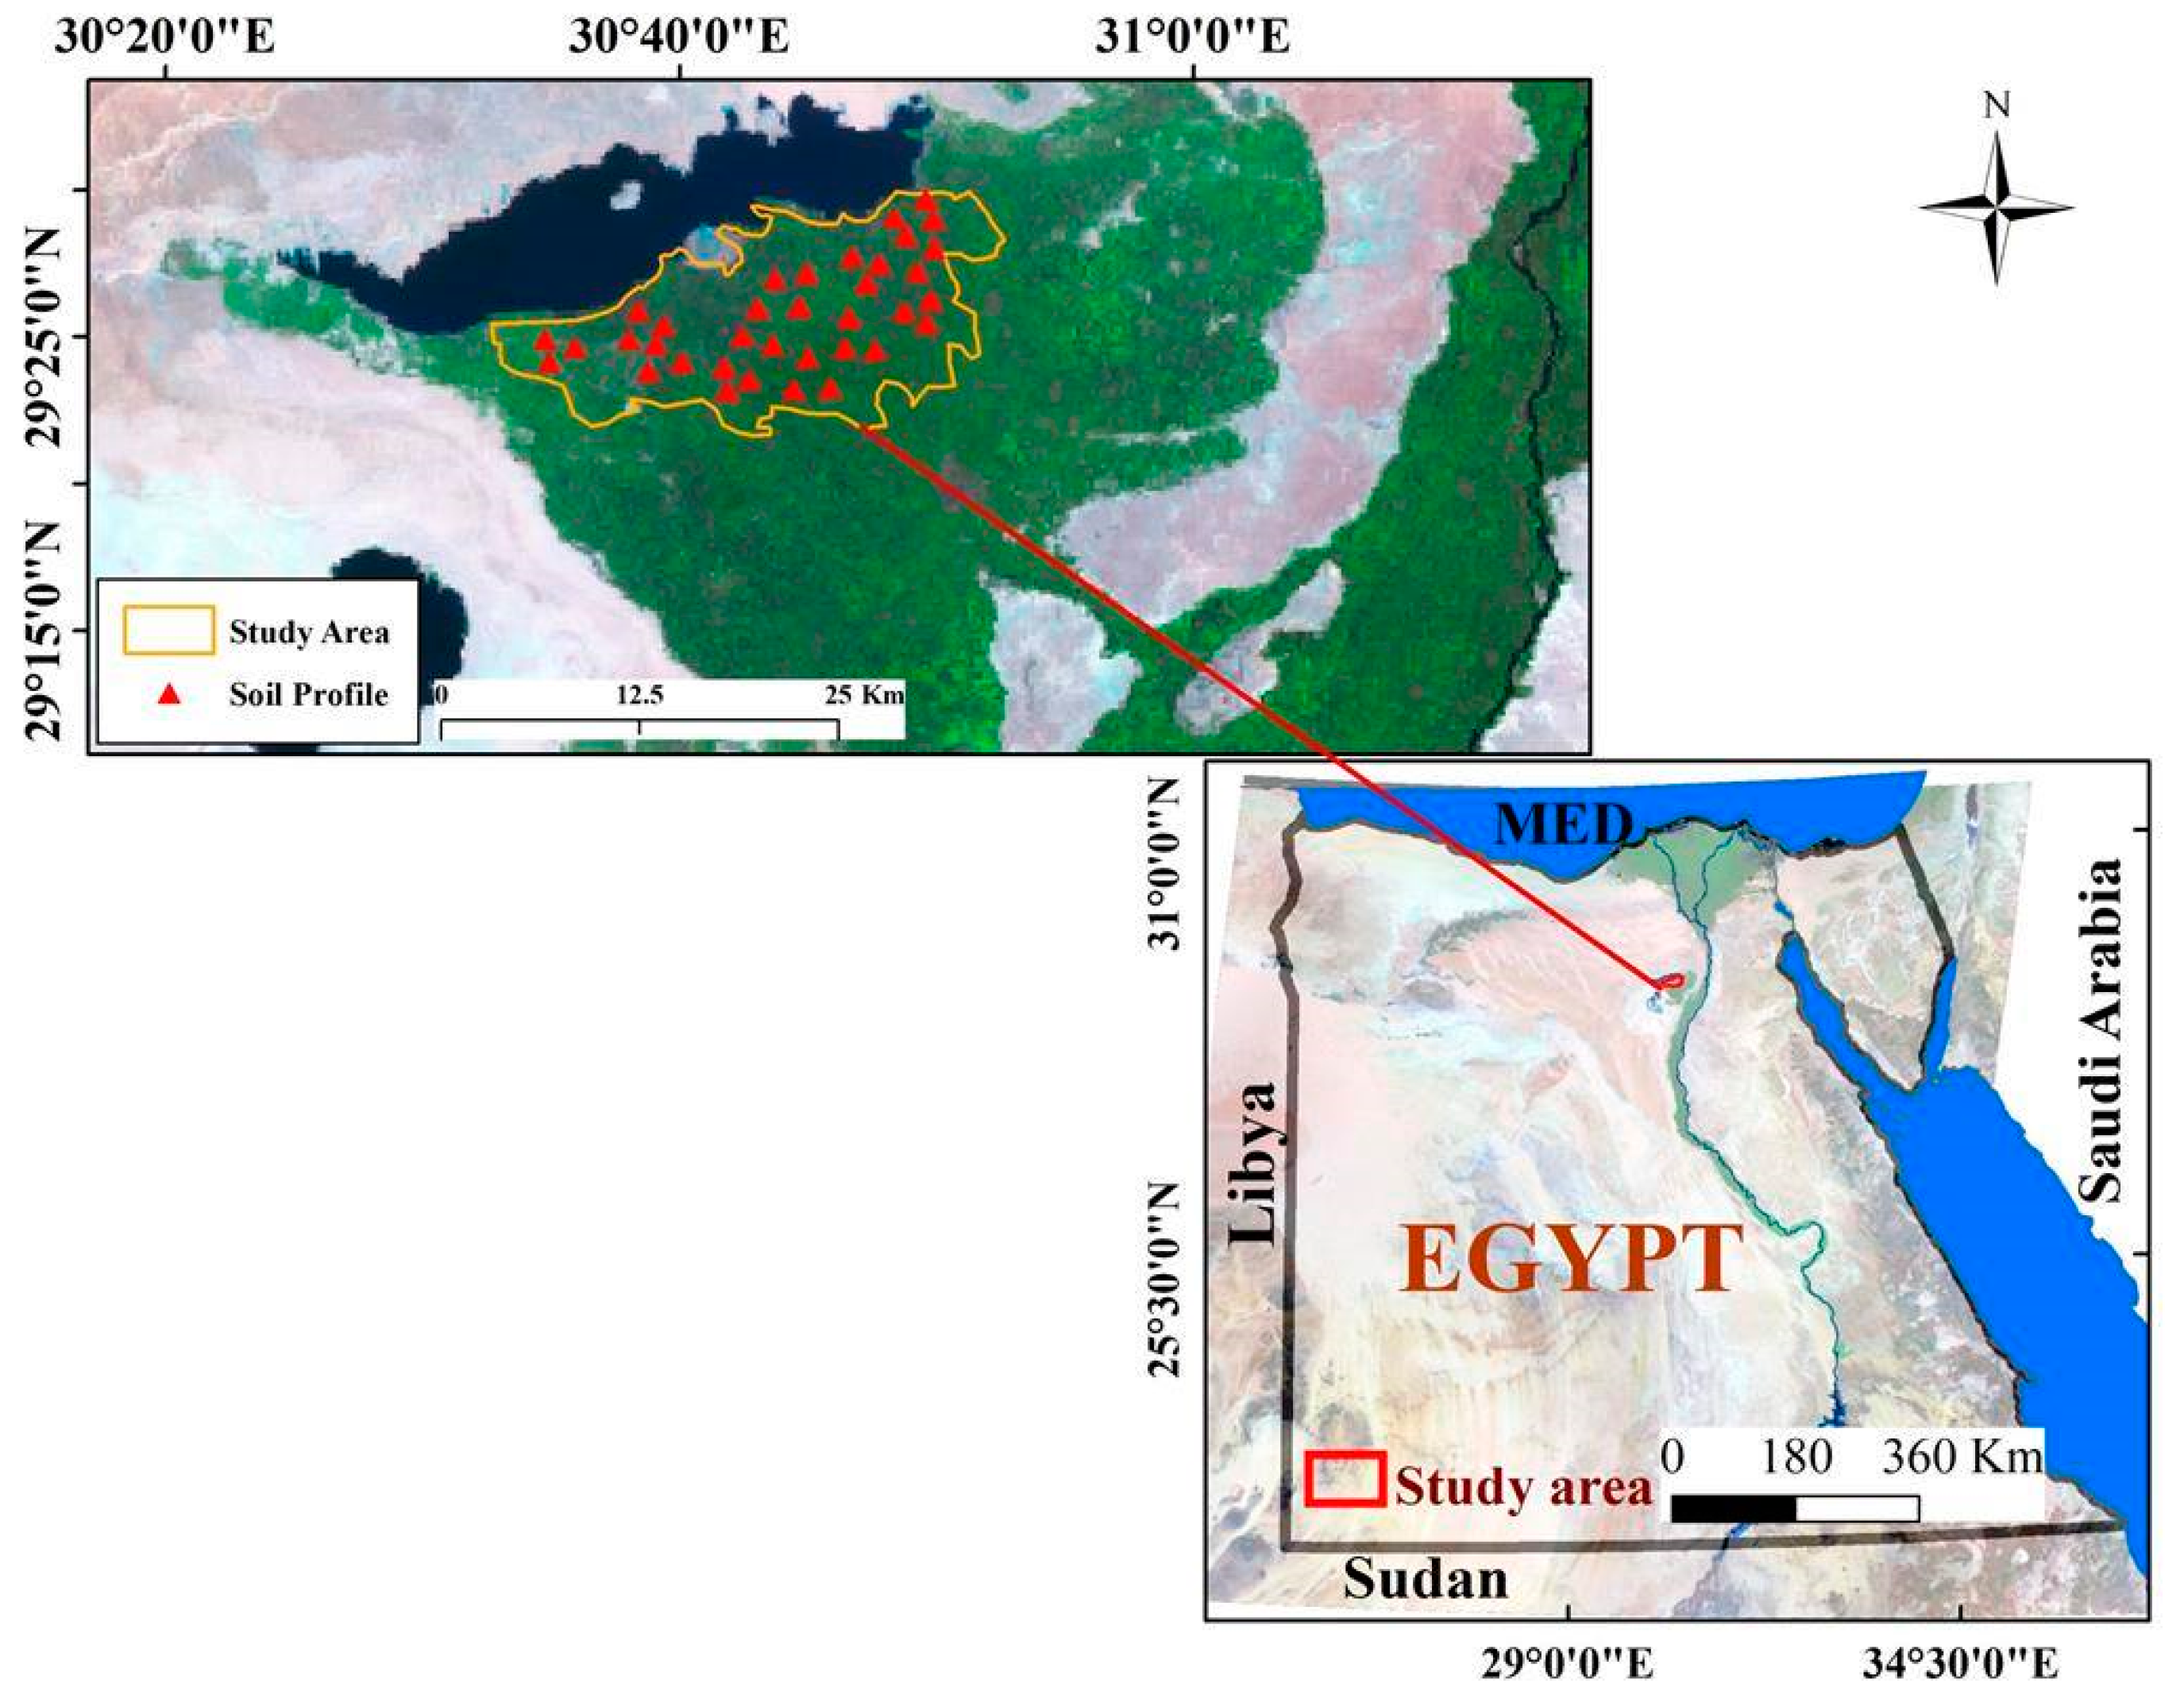
2.1. Study Area
2.2. Sampling and Soil Analysis
2.3. Statistical Analysis
2.4. Soil Quality Index (SQI) Calculation and Mapping
2.5. Cluster Analysis
2.6. Geostatistical Analyses
3. Results and Discussion
3.1. Soil Characteristics of the Study Area
3.2. Pearson Correlation Matrix, Bartlett’s, and Kaiser Meyer Olkin (KMO) Tests
3.3. Soil Quality Index Using Principal Component Analysis
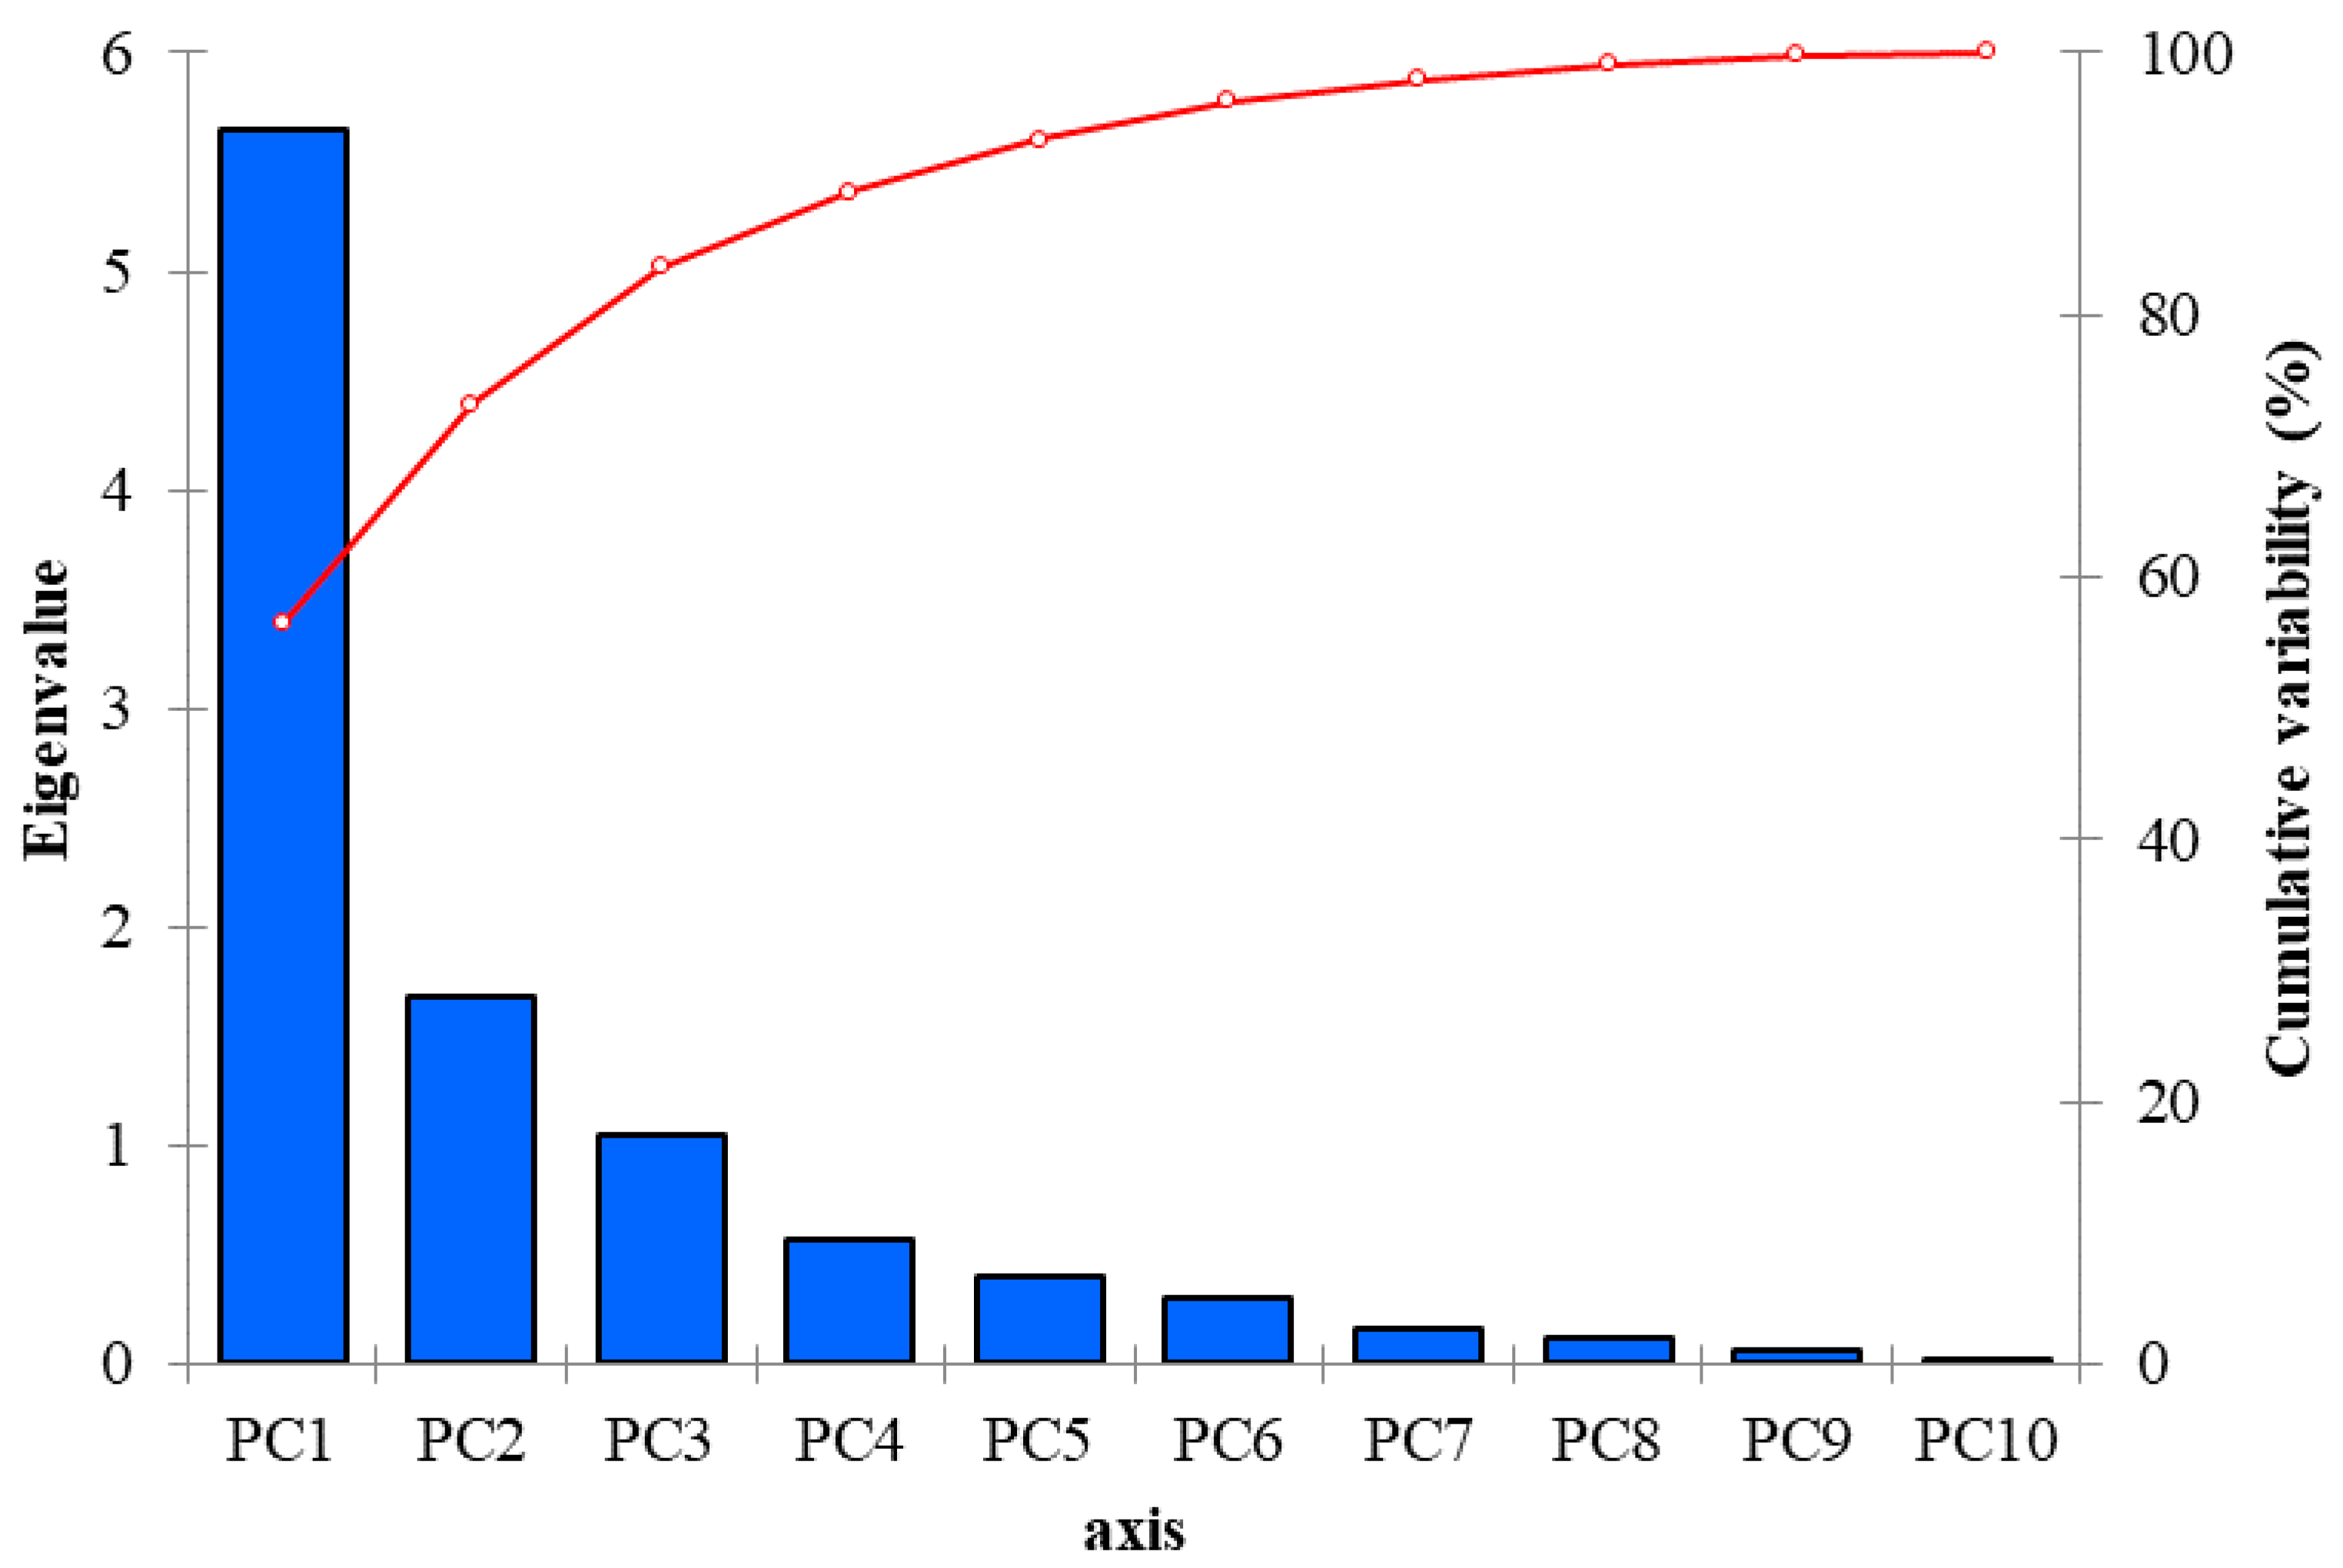
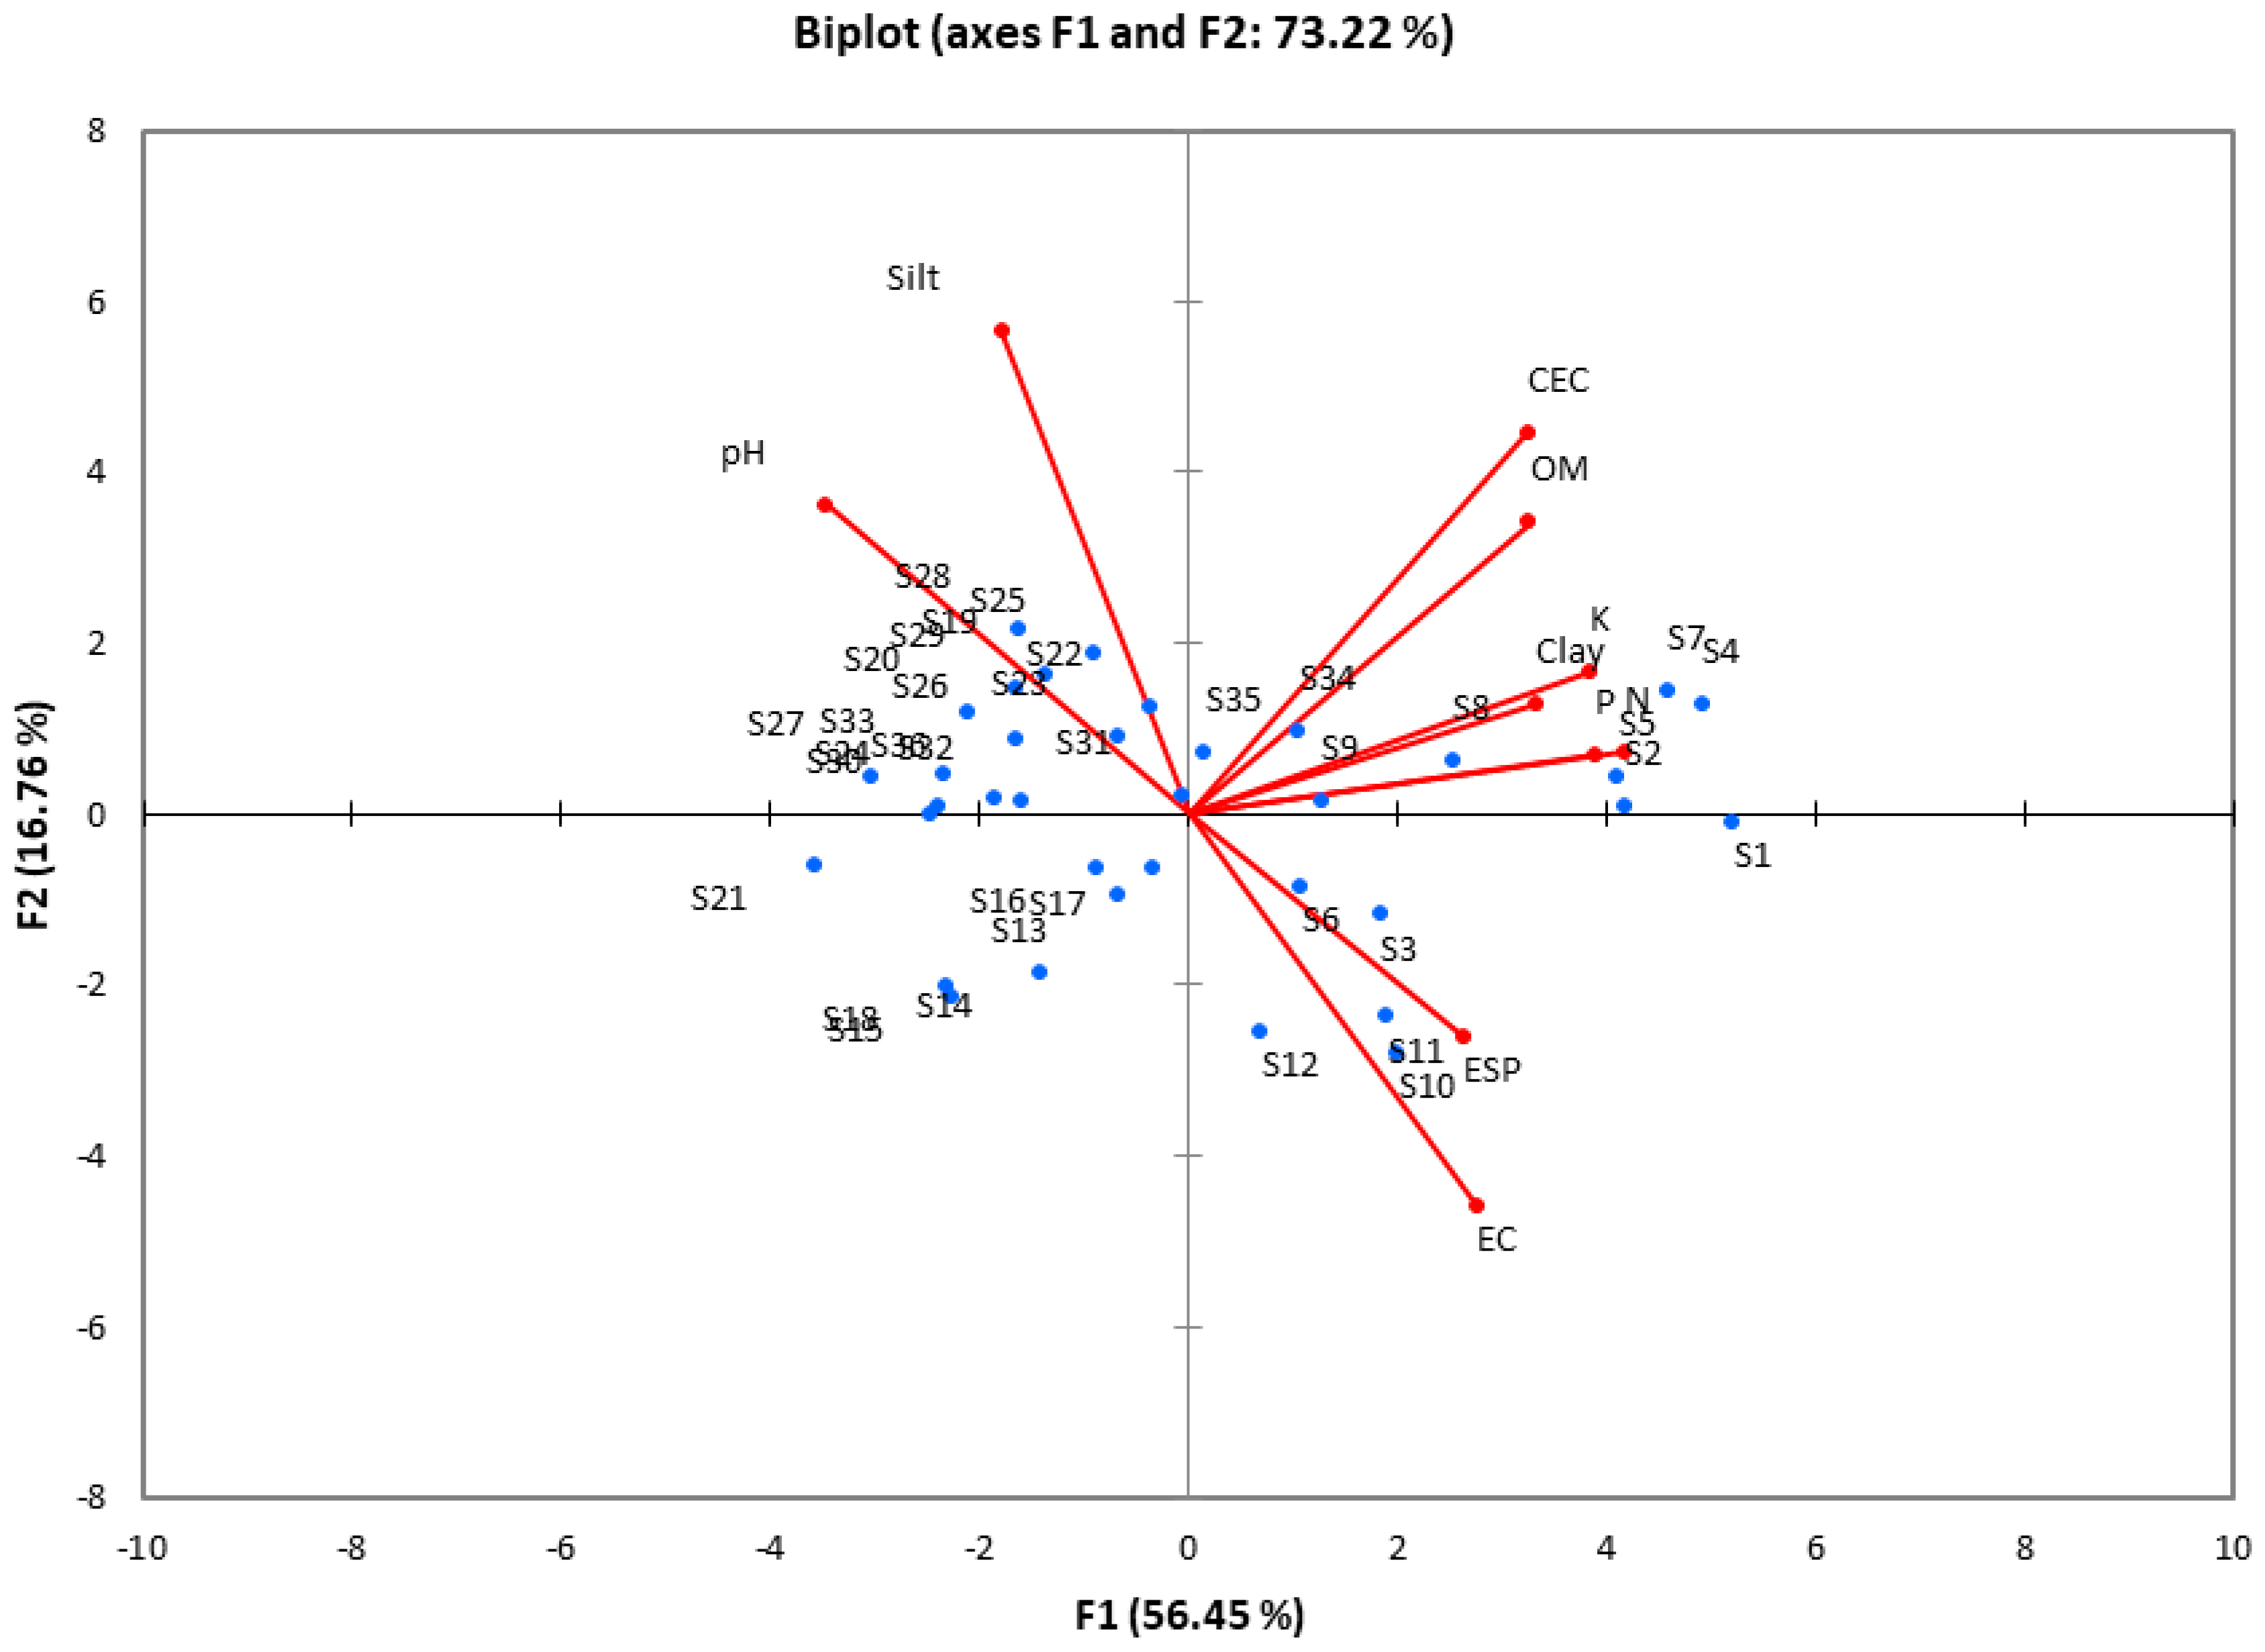
3.3.1. Principal Component Analysis
3.3.2. Cluster Analysis (k-Means Clustering)
3.3.3. Simulation of Cluster Analysis
3.4. Mapping Soil Properties and Soil Quality Index
3.4.1. Mapping Soil Properties
3.4.2. Mapping the Soil Quality Index
4. Conclusions
Author Contributions
Funding
Institutional Review Board Statement
Informed Consent Statement
Data Availability Statement
Acknowledgments
Conflicts of Interest
References
- Roy, T. Precision farming: A step towards sustainable, climate-smart agriculture. In Global Climate Change: Resilient and Smart Agriculture; Springer: Singapore, 2020; pp. 199–220. [Google Scholar]
- Mohamed, E.S.; Baroudy, A.; El-beshbeshy, T.; Emam, M.; Belal, A.; Elfadaly, A.; Aldosari, A.A.; Ali, A.; Lasaponara, R. Vis-NIR spectroscopy and satellite Landsat-8 OLI data to map soil nutrients in arid conditions: A case study of the northwest coast of Egypt. Remote Sens. 2020, 12, 3716. [Google Scholar] [CrossRef]
- Said, M.E.S.; Ali, A.; Borin, M.; Abd-Elmabod, S.K.; Aldosari, A.A.; Khalil, M.; Abdel-Fattah, M.K. On the use of multivariate analysis and land evaluation for potential agricultural development of the northwestern coast of Egypt. Agronomy 2020, 10, 1318. [Google Scholar] [CrossRef]
- Baroudy, A.A.E.; Ali, A.; Mohamed, E.S.; Moghanm, F.S.; Shokr, M.S.; Savin, I.; Poddubsky, A.; Ding, Z.; Kheir, A.; Aldosari, A.A. Modeling land suitability for rice crop using remote sensing and soil quality indicators: The case study of the Nile Delta. Sustainability 2020, 12, 9653. [Google Scholar] [CrossRef]
- Lal, R.; Stewart, B.A. Principles of Sustainable Soil Management in Agroecosystems; CRC Press; Taylor and Francis: Boca Raton, FL, USA, 2013; p. 568. [Google Scholar]
- Doran, J.; Coleman, D.; Bezdicek, D.; Stewart, B. A Framework for Evaluating Physical and Chemical Indicators of Soil Quality; Soil Science Society of America: Madison, WI, USA, 1994; Volume 35, pp. 53–72. [Google Scholar]
- Karlen, D.L.; Stott, D.E. A framework for evaluating physical and chemical indicators of soil quality. Defin. Soil Qual. Sustain. Environ. 1994, 35, 53–72. [Google Scholar]
- Mukherjee, A.; Lal, R. Comparison of soil quality index using three methods. PLoS ONE 2014, 9, e105981. [Google Scholar] [CrossRef] [Green Version]
- Martinez-Salgado, M.; Gutiérrez-Romero, V.; Jannsens, M.; Ortega-Blu, R. Biological soil quality indicators: A review. Curr. Res. Technol. Educ. Top. Appl. Microbiol. Microb. Biotechnol. 2010, 1, 319–328. [Google Scholar]
- Bouma, J. Land quality indicators of sustainable land management across scales. Agric. Ecosyst. Environ. 2002, 88, 129–136. [Google Scholar] [CrossRef]
- AbdelRahman, M.A.; Shalaby, A.; Mohamed, E. Comparison of two soil quality indices using two methods based on geographic information system. Egypt. J. Remote Sens. Space Sci. 2019, 22, 127–136. [Google Scholar] [CrossRef]
- Rangel-Peraza, J.G.; Padilla-Gasca, E.; López-Corrales, R.; Medina, J.R.; Bustos-Terrones, Y.; Amabilis-Sosa, L.E.; Rodríguez-Mata, A.E.; Osuna-Enciso, T. Robust soil quality index for tropical soils influenced by agricultural activities. J. Agric. Chem. Environ. 2017, 6, 199. [Google Scholar] [CrossRef] [Green Version]
- Aprisal, I.; Bambang, J.; Harianti, M. Soil quality index analysis under horticultural farming in Sumani upper watershed. Int. J. Geomate 2019, 16, 191–196. [Google Scholar] [CrossRef]
- Moore, F.; Sheykhi, V.; Salari, M.; Bagheri, A. Soil quality assessment using GIS-based chemometric approach and pollution indices: Nakhlak mining district, Central Iran. Environ. Monit. Assess. 2016, 188, 214. [Google Scholar] [CrossRef] [PubMed]
- Tesfahunegn, G.B. Soil quality assessment strategies for evaluating soil degradation in Northern Ethiopia. Appl. Environ. Soil Sci. 2014, 2014, 1–14. [Google Scholar] [CrossRef] [Green Version]
- Mohamed, E.S.; Belal, A.; Shalaby, A. Impacts of soil sealing on potential agriculture in Egypt using remote sensing and GIS techniques. Eurasian Soil Sci. 2015, 48, 1159–1169. [Google Scholar] [CrossRef]
- Smith, J.L.; Doran, J.W.; Jones, A.J. Methods for Assessing Soil Quality; SSSA Spec. Pub. 49; Soil Science Society of America: Madison, WI, USA, 1996. [Google Scholar]
- Karlen, D.; Mausbach, M.; Doran, J.; Cline, R.; Harris, R.; Schuman, G. Soil quality: Concept, rationale, and research needs. Soil Sci. Soc. Am. J. 1997, 61, 4–10. [Google Scholar] [CrossRef] [Green Version]
- Estrada-Herrera, I.R.; Hidalgo-Moreno, C.; Guzmán-Plazola, R.; Almaraz Suárez, J.J.; Navarro-Garza, H.; Etchevers-Barra, J.D. Indicadores de calidad de suelo para evaluar su fertilidad. Agrociencia 2017, 51, 813–831. [Google Scholar]
- Burrough, P.A.; McDonnell, R.; McDonnell, R.A.; Lloyd, C.D. Principles of Geographical Information Systems; Oxford University Press: Oxford, UK, 2015. [Google Scholar]
- Ali, A.; Soliman, K.; Nasr-Alla, A.; Kamh, R. Evaluation of soil fertility status at West Delta Area using GIS technique. Zagazig J. Agric. Res. 2008, 35. Available online: https://scholar.google.com/scholar?cluster=5574441466090192910&hl=en&oi=scholarr (accessed on 3 February 2021).
- Hammam, A.; Mohamed, E. Mapping soil salinity in the East Nile Delta using several methodological approaches of salinity assessment. Egypt. J. Remote Sens. Space Sci. 2018, 23, 125–131. [Google Scholar] [CrossRef]
- Hendawy, E.; Belal, A.; Mohamed, E.; Elfadaly, A.; Murgante, B.; Aldosari, A.A.; Lasaponara, R. The prediction and assessment of the impacts of soil sealing on agricultural land in the North Nile Delta (Egypt) using satellite data and GIS modeling. Sustainability 2019, 11, 4662. [Google Scholar] [CrossRef] [Green Version]
- Mohamed, E.S.; Saleh, A.M.; Belal, A.B.; Gad, A. Application of near-infrared reflectance for quantitative assessment of soil properties. Egypt. J. Remote Sens. Space Sci. 2018, 21, 1–14. [Google Scholar] [CrossRef]
- Doerge, T. Defining management zones for precision farming. Crop Insights 1999, 8, 1–5. [Google Scholar]
- Khosla, R.; Shaver, T. Zoning in on nitrogen needs. Colo. State Univ. Agron. Newsl. 2001, 21, 24–26. [Google Scholar]
- Csomós, E.; Héberger, K.; Simon-Sarkadi, L. Principal component analysis of biogenic amines and polyphenols in Hungarian wines. J. Agric. Food Chem. 2002, 50, 3768–3774. [Google Scholar] [CrossRef]
- Jolliffe, I.T.; Cadima, J. Principal component analysis: A review and recent developments. Philos. Trans. R. Soc. A Math. Phys. Eng. Sci. 2016, 374, 20150202. [Google Scholar] [CrossRef] [PubMed]
- Perez, L.V. Principal Component Analysis to Address Multicollinearity. Walla Walla, WA 99362, USA. Walla Walla Whitman Coll. 2017. Available online: https://www.whitman.edu/Documents/Academics/Mathematics/2017/Perez.pdf (accessed on 3 February 2021).
- Dandpat, S.K.; Meher, S. Performance improvement for face recognition using PCA and two-dimensional PCA. In Proceedings of the 2013 International Conference on Computer Communication and Informatics, Tamil Nadu, India, 9–11 January 2013; pp. 1–5. [Google Scholar]
- Ilin, A.; Raiko, T. Practical approaches to principal component analysis in the presence of missing values. J. Mach. Learn. Res. 2010, 11, 1957–2000. [Google Scholar]
- Müller, W.; Nocke, T.; Schumann, H. Enhancing the visualization process with principal component analysis to support the exploration of trends. In Proceedings of the 2006 Asia-Pacific Symposium on Information Visualisation, Tokyo, Japan, 1–3 February 2006; Volume 60, pp. 121–130. [Google Scholar]
- Ivosev, G.; Burton, L.; Bonner, R. Dimensionality reduction and visualization in principal component analysis. Anal. Chem. 2008, 80, 4933–4944. [Google Scholar] [CrossRef] [PubMed] [Green Version]
- Ali, R.; Kawy, W.A. Land degradation risk assessment of El Fayoum depression, Egypt. Arab. J. Geosci. 2013, 6, 2767–2776. [Google Scholar] [CrossRef]
- Abo-El-Ennan, S. Pedogenesis of the Fayoum Area’; Agriculture, Azhar Univ.: Cairoc, Egypt, 1985; p. 156. [Google Scholar]
- Mohamed, E.S. Spatial assessment of desertification in north Sinai using modified MEDLAUS model. Arab. J. Geosci. 2013, 6, 4647–4659. [Google Scholar] [CrossRef]
- Abd-Elmabod, S.K.; Bakr, N.; Muñoz-Rojas, M.; Pereira, P.; Zhang, Z.; Cerdà, A.; Jordán, A.; Mansour, H.; De la Rosa, D.; Jones, L. Assessment of soil suitability for improvement of soil factors and agricultural management. Sustainability 2019, 11, 1588. [Google Scholar] [CrossRef] [Green Version]
- Van Reeuwijk, L.P. Procedures for Soil Analysis. Tech. Pap.-Int. Soil Ref. Inf. Cent. 1986, 9, 106p. Available online: https://pascal-francis.inist.fr/vibad/index.php?action=getRecordDetail&idt=8009739 (accessed on 3 February 2021).
- Richards, L.A. Diagnosis and Improvement of Saline and Alkali Soils; U.S. Dept. of Agriculture: Washington, DC, USA, 1954; Volume 78, p. 154.
- Baruah, T.; Barthakur, H. A Textbook of Soil Analysis; Vikas Publishing House PVT Ltd.: New Delhi, India, 1997. [Google Scholar]
- Cude, C.G. Oregon water quality index a tool for evaluating water quality management effectiveness 1. J. Am. Water Resour. Assoc. (JAWRA) 2001, 37, 125–137. [Google Scholar] [CrossRef]
- Walck, C. Handbook on Statistical Distributions for Experimentalists; University of Stockholm: Stockholm, Sweden, 1996; p. 190. [Google Scholar]
- Everitt, B.; Landau, S.; Leese, M. Cluster Analysis, 4th ed.; Arnold: London, UK, 2001. [Google Scholar]
- Rencher, A.C.; Christensen, W. Methods of Multivariate Analysis; A John Wiley & Sons.: New York, NY, USA, 2002; p. 727. [Google Scholar]
- Manly, B.F.; Alberto, J.A.N. Multivariate Statistical Methods: A Primer; CRC Press Group; Taylor and Francis: Boca Raton, FL, USA; London, UK; New York, NY, USA, 2016; p. 252. [Google Scholar]
- Wang, X.; Yang, Z.; Jivkov, A.P. Monte Carlo simulations of mesoscale fracture of concrete with random aggregates and pores: A size effect study. Constr. Build. Mater. 2015, 80, 262–272. [Google Scholar] [CrossRef]
- Pham, B.T.; Nguyen-Thoi, T.; Ly, H.-B.; Nguyen, M.D.; Al-Ansari, N.; Tran, V.-Q.; Le, T.-T. Extreme learning machine based prediction of soil shear strength: A sensitivity analysis using Monte Carlo simulations and feature backward elimination. Sustainability 2020, 12, 2339. [Google Scholar] [CrossRef] [Green Version]
- Chiverton, A.; Hannaford, J.; Holman, I.; Corstanje, R.; Prudhomme, C.; Bloomfield, J.; Hess, T.M. Which catchment characteristics control the temporal dependence structure of daily river flows? Hydrol. Process. 2015, 29, 1353–1369. [Google Scholar] [CrossRef] [Green Version]
- Gundogdu, K.S.; Guney, I. Spatial analyses of groundwater levels using universal kriging. J. Earth Syst. Sci. 2007, 116, 49–55. [Google Scholar] [CrossRef] [Green Version]
- Cambardella, C.A.; Moorman, T.B.; Novak, J.; Parkin, T.; Karlen, D.; Turco, R.; Konopka, A. Field-scale variability of soil properties in central Iowa soils. Soil Sci. Soc. Am. J. 1994, 58, 1501–1511. [Google Scholar] [CrossRef]
- Cafarelli, B.; Castrignanò, A.; De Benedetto, D.; Palumbo, A.D.; Buttafuoco, G. A linear mixed effect (LME) model for soil water content estimation based on geophysical sensing: A comparison of an LME model and kriging with external drift. Environ. Earth Sci. 2015, 73, 1951–1960. [Google Scholar] [CrossRef]
- FAO; United Nations Environment Programme; United Nations Educational, Scientific, and Cultural Organization. A Provisional Methodology for Soil Degradation Assessment; FAO: Rome, Italy, 1980. [Google Scholar]
- Abrol, I.; Yadav, J.S.P.; Massoud, F. Salt-Affected Soils and Their Management; Food & Agriculture Organization: Rome, Italy, 1988; p. 131. [Google Scholar]
- Neina, D. The role of soil pH in plant nutrition and soil remediation. Appl. Environ. Soil Sci. 2019, 2009, 5794869. Available online: https://www.hindawi.com/journals/aess/2019/5794869/ (accessed on 3 February 2021). [CrossRef]
- Brady, N.C.; Weil, R.R.; Weil, R.R. The Nature and Properties of Soils; Prentice Hall: Upper Saddle River, NJ, USA, 2008; Volume 13. [Google Scholar]
- White, R.E. Principles and Practice of Soil Science: The Soil as a Natural Resource; John Wiley & Sons: Malden, MA, USA, 2013. [Google Scholar]
- Zhenghu, D.; Honglang, X. Effects of soil properties on ammonia volatilization. Soil Sci. Plant Nutr. 2000, 46, 845–852. [Google Scholar] [CrossRef]
- Curtin, D.; Campbell, C.; Jalil, A. Effects of acidity on mineralization: pH-dependence of organic matter mineralization in weakly acidic soils. Soil Biol. Biochem. 1998, 30, 57–64. [Google Scholar] [CrossRef]
- Clay, D.; Chang, J.; Malo, D.; Carlson, C.; Reese, C.; Clay, S.; Ellsbury, M.; Berg, B. Factors influencing spatial variability of soil apparent electrical conductivity. Commun. Soil Sci. Plant Anal. 2001, 32, 2993–3008. [Google Scholar] [CrossRef] [Green Version]
- Alam, M.; Mishra, A.; Singh, K.; Singh, S.K.; David, A. Response of sulphur and FYM on soil physico-chemical properties and growth, yield and quality of mustard (Brassica nigra L.). J. Agric. Phys. 2014, 14, 156–160. [Google Scholar]
- Fabrizio, A.; Tambone, F.; Genevini, P. Effect of compost application rate on carbon degradation and retention in soils. Waste Manag. 2009, 29, 174–179. [Google Scholar] [CrossRef] [PubMed] [Green Version]
- Hutcheson, G.D.; Sofroniou, N. The Multivariate Social Scientist: Introductory Statistics Using Generalized Linear Models; Sage: Thousand Oaks, CA, USA, 1999; p. 275. [Google Scholar]
- Barrett, K.; Morgan, G. SPSS for Intermediate Statistics; Use and Interpretation; Lawrence Erlbaum Associates Publishers: Mahwah, NJ, USA; London, UK, 2005. [Google Scholar]
- Huck, S.W.; Cormier, W.H.; Bounds, W.G. Reading Statistics and Research; Pearson: Boston, MA, USA, 2012; Volume 566. [Google Scholar]
- Tabachnick, B.; Fidell, L. Multivariate Regression. Using Multivariate Statistics, 5th ed.; Pearson Education: Boston, MA, USA, 2007; pp. 117–159. [Google Scholar]
- Pallant, J. SPSS Survival Manual; McGraw-Hill Education: London, UK, 2013. [Google Scholar]
- Kaiser, H.F. The application of electronic computers to factor analysis. Educ. Psychol. Meas. 1960, 20, 141–151. [Google Scholar] [CrossRef]
- Mohamed, E.; Abdellatif, M.; Abd-Elmabod, S.K.; Khalil, M. Estimation of surface runoff using NRCS curve number in some areas in northwest coast, Egypt. In Proceedings of the E3S Web of Conferences, Barcelona, Spain, 10–12 February 2020; EDP Sciences. Volume 167, p. 02002. [Google Scholar]
- Abd-Elmabod, S.K.; Mansour, H.; Hussein, A.; Mohamed, E.S.; Zhang, Z.; Anaya-Romero, M.; Jordán, A. Influence of irrigation water quantity on the land capability classification. Plant Arch. 2019, 2, 2253–2261. [Google Scholar]
- Yasrebi, J.; Saffari, M.; Fathi, H.; Karimian, N.; Moazallahi, M.; Gazni, R. Evaluation and comparison of ordinary kriging and inverse distance weighting methods for prediction of spatial variability of some soil chemical parameters. Res. J. Biol. Sci. 2009, 4, 93–102. [Google Scholar]
- Aldabaa, A.; Yousif, I.A.H. Geostatistical approach for land suitability assessment of some desert soils. Egypt. J. Soil Sci. 2020, 60, 195–205. [Google Scholar] [CrossRef]
- Abdel-Fattah, M.K.; Abd-Elmabod, S.K.; Aldosari, A.A.; Elrys, A.S.; Mohamed, E.S. Multivariate analysis for assessing irrigation water quality: A case study of the Bahr Mouise Canal, Eastern Nile Delta. Water 2020, 12, 2537. [Google Scholar] [CrossRef]
- Hassan, A.; Belal, A.; Hassan, M.; Farag, F.; Mohamed, E. Potential of thermal remote sensing techniques in monitoring waterlogged area based on surface soil moisture retrieval. J. Afr. Earth Sci. 2019, 155, 64–74. [Google Scholar] [CrossRef]
- Saleh, A.; Belal, A.; Mohamed, E. Land resources assessment of El-Galaba basin, South Egypt for the potentiality of agriculture expansion using remote sensing and GIS techniques. Egypt. J. Remote Sens. Space Sci. 2015, 18, S19–S30. [Google Scholar] [CrossRef] [Green Version]
- Mansour, H.A.; Abd-Elmabod, S.K.; AbdelGawad, S. The impact of sub-surface drip irrigation and different water deficit treatments on the spatial distribution of soil moisture and salinity. Plant. Arch 2019, 2, 384–392. [Google Scholar]
- Abd-Elmabod, S.K.; Jordán, A.; Fleskens, L.; Phillips, J.D.; Muñoz-Rojas, M.; van der Ploeg, M.; Anaya-Romero, M.; El-Ashry, S.; de la Rosa, D. Modeling agricultural suitability along soil transects under current conditions and improved scenario of soil factors. In Soil Mapping and Process Modeling for Sustainable Land Use Management; Elsevier: Amsterdam, The Netherlands, 2017; pp. 193–219. [Google Scholar]
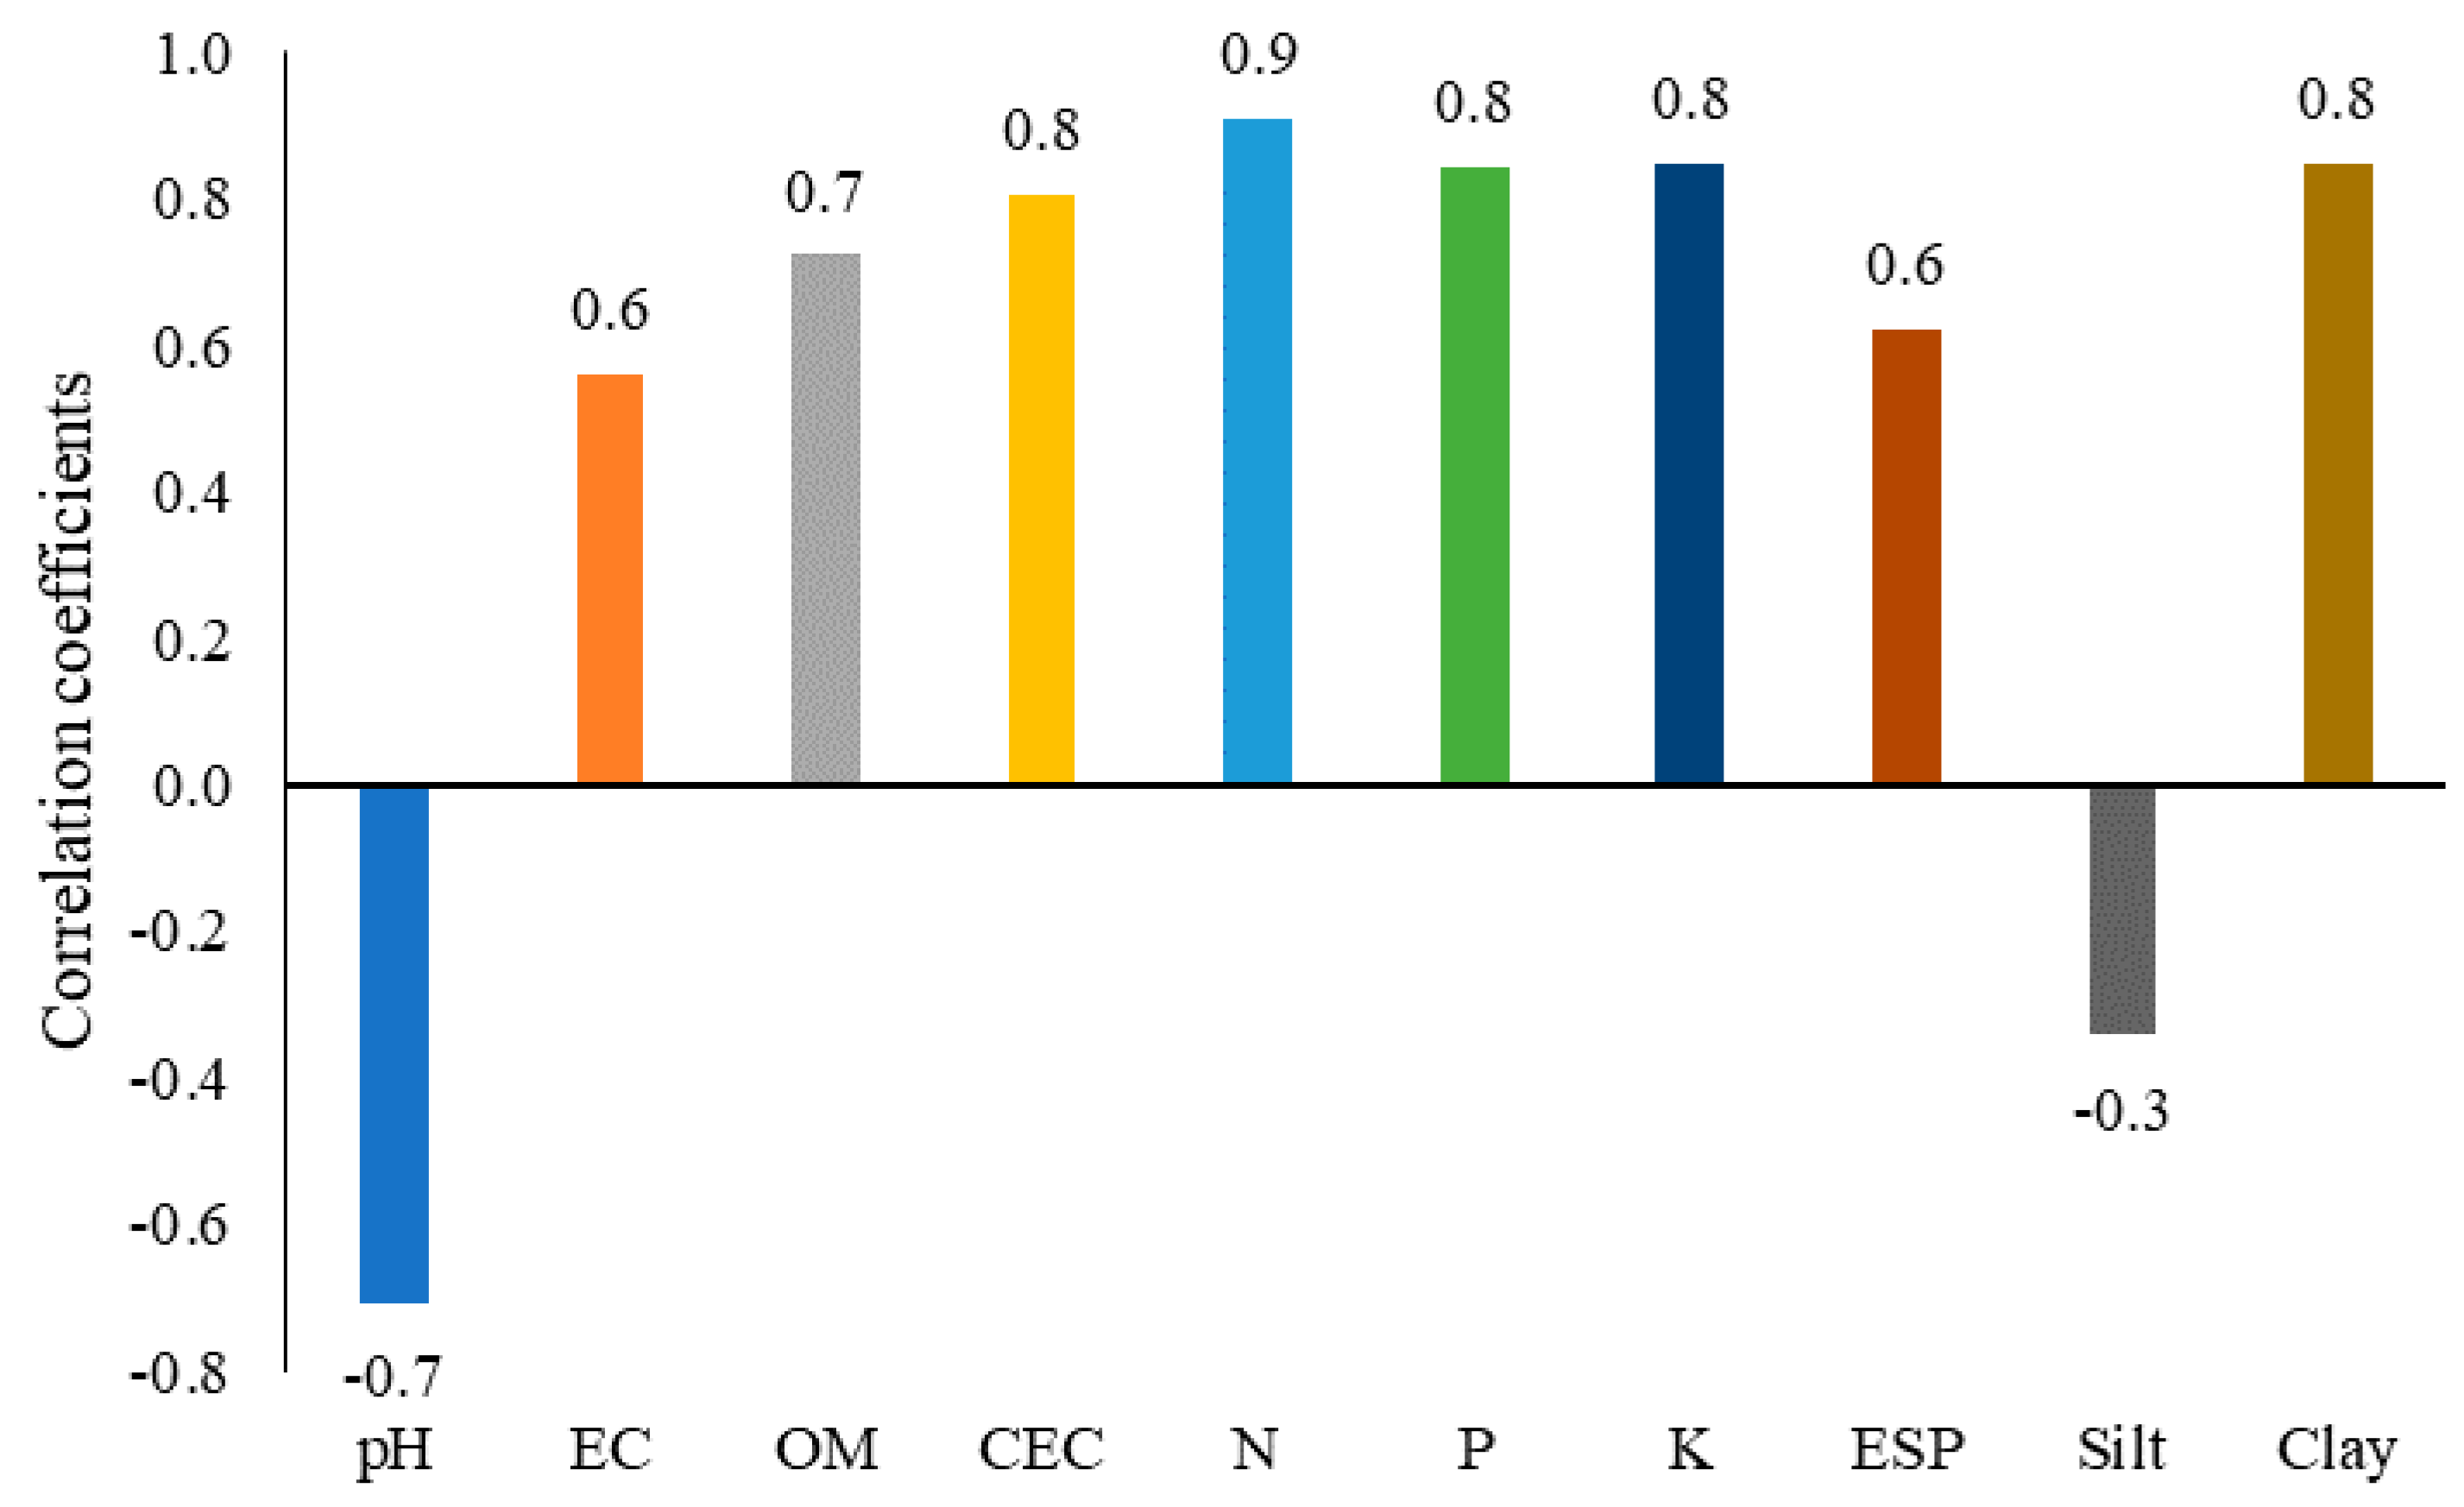
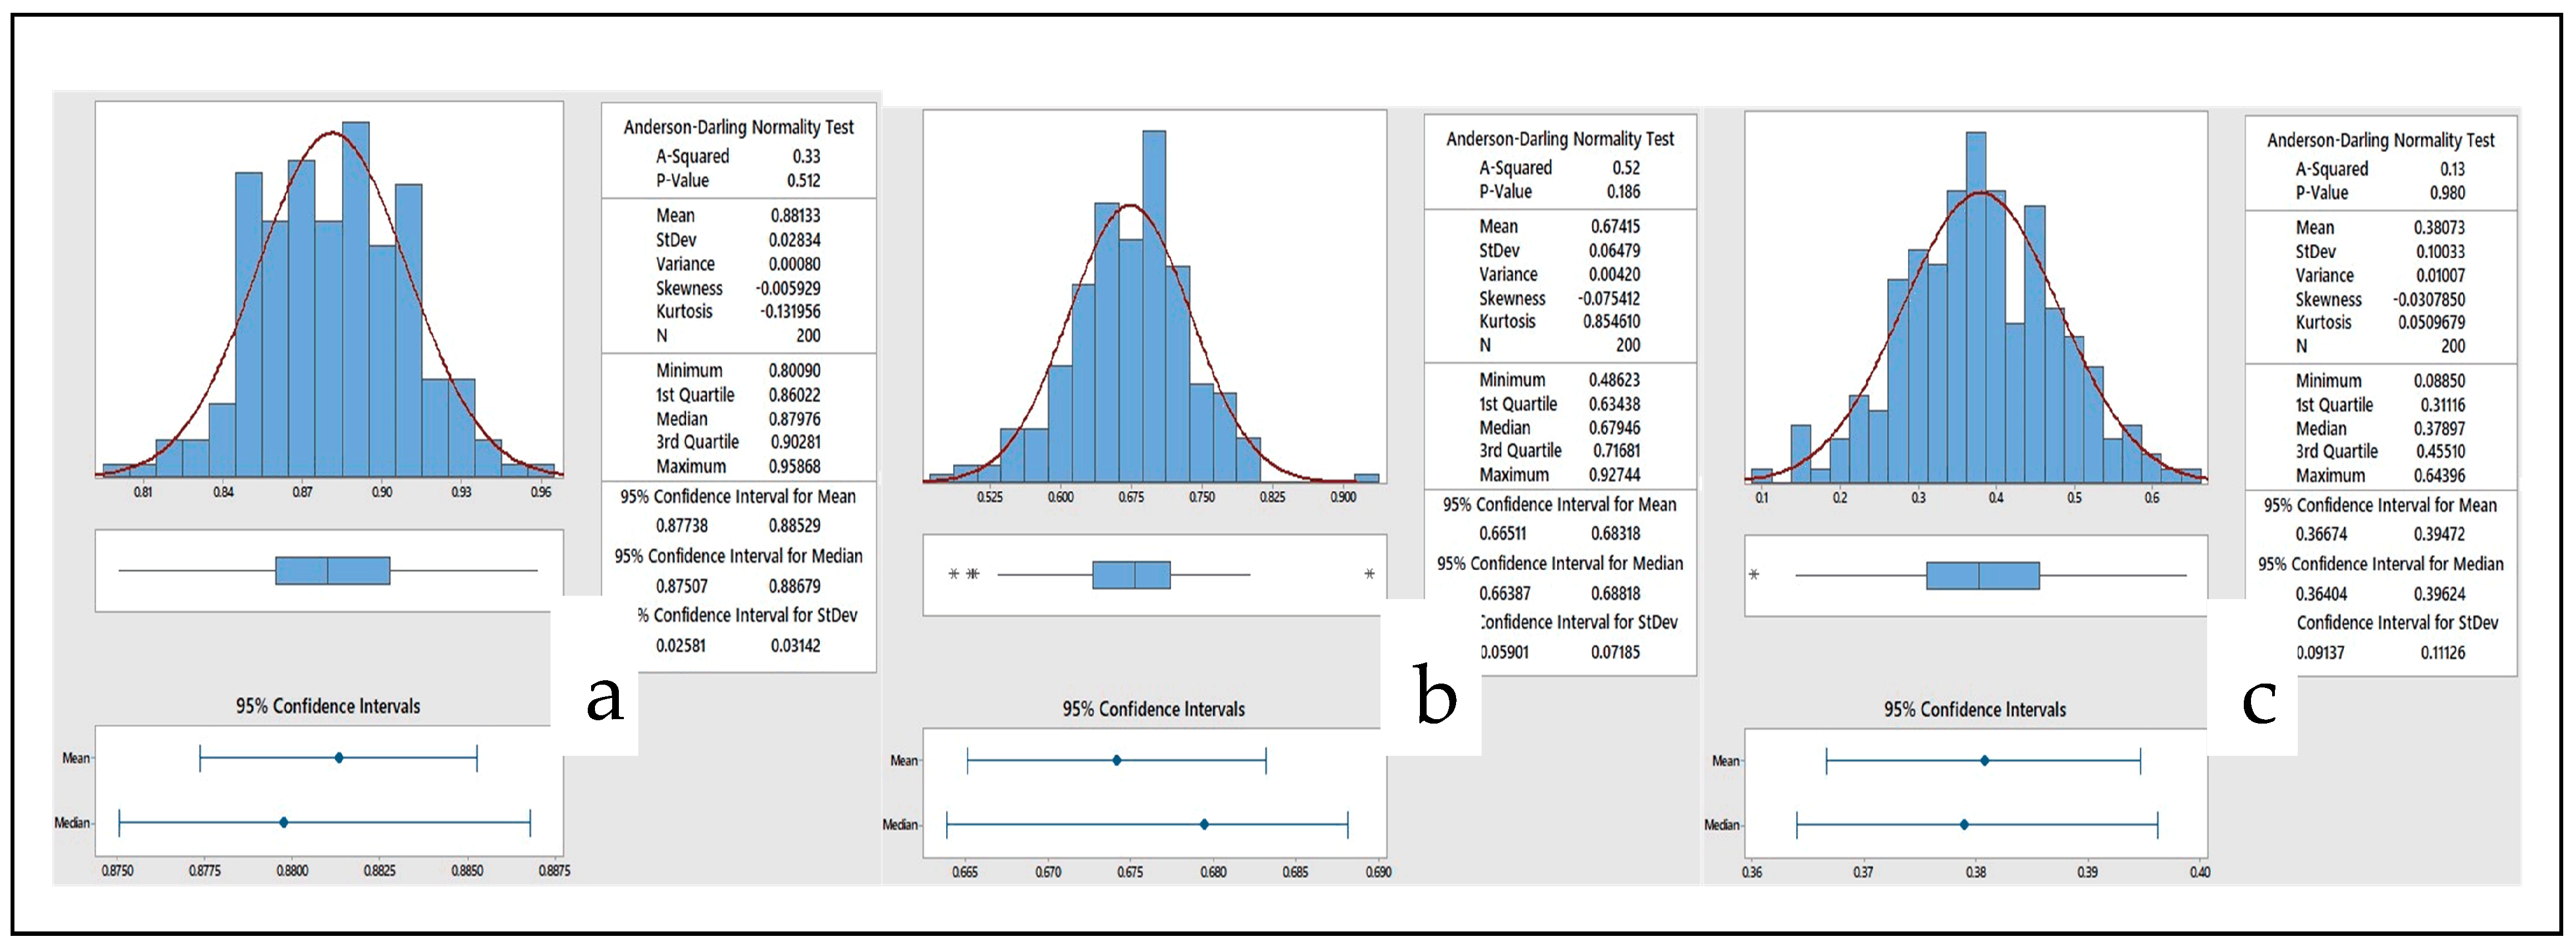
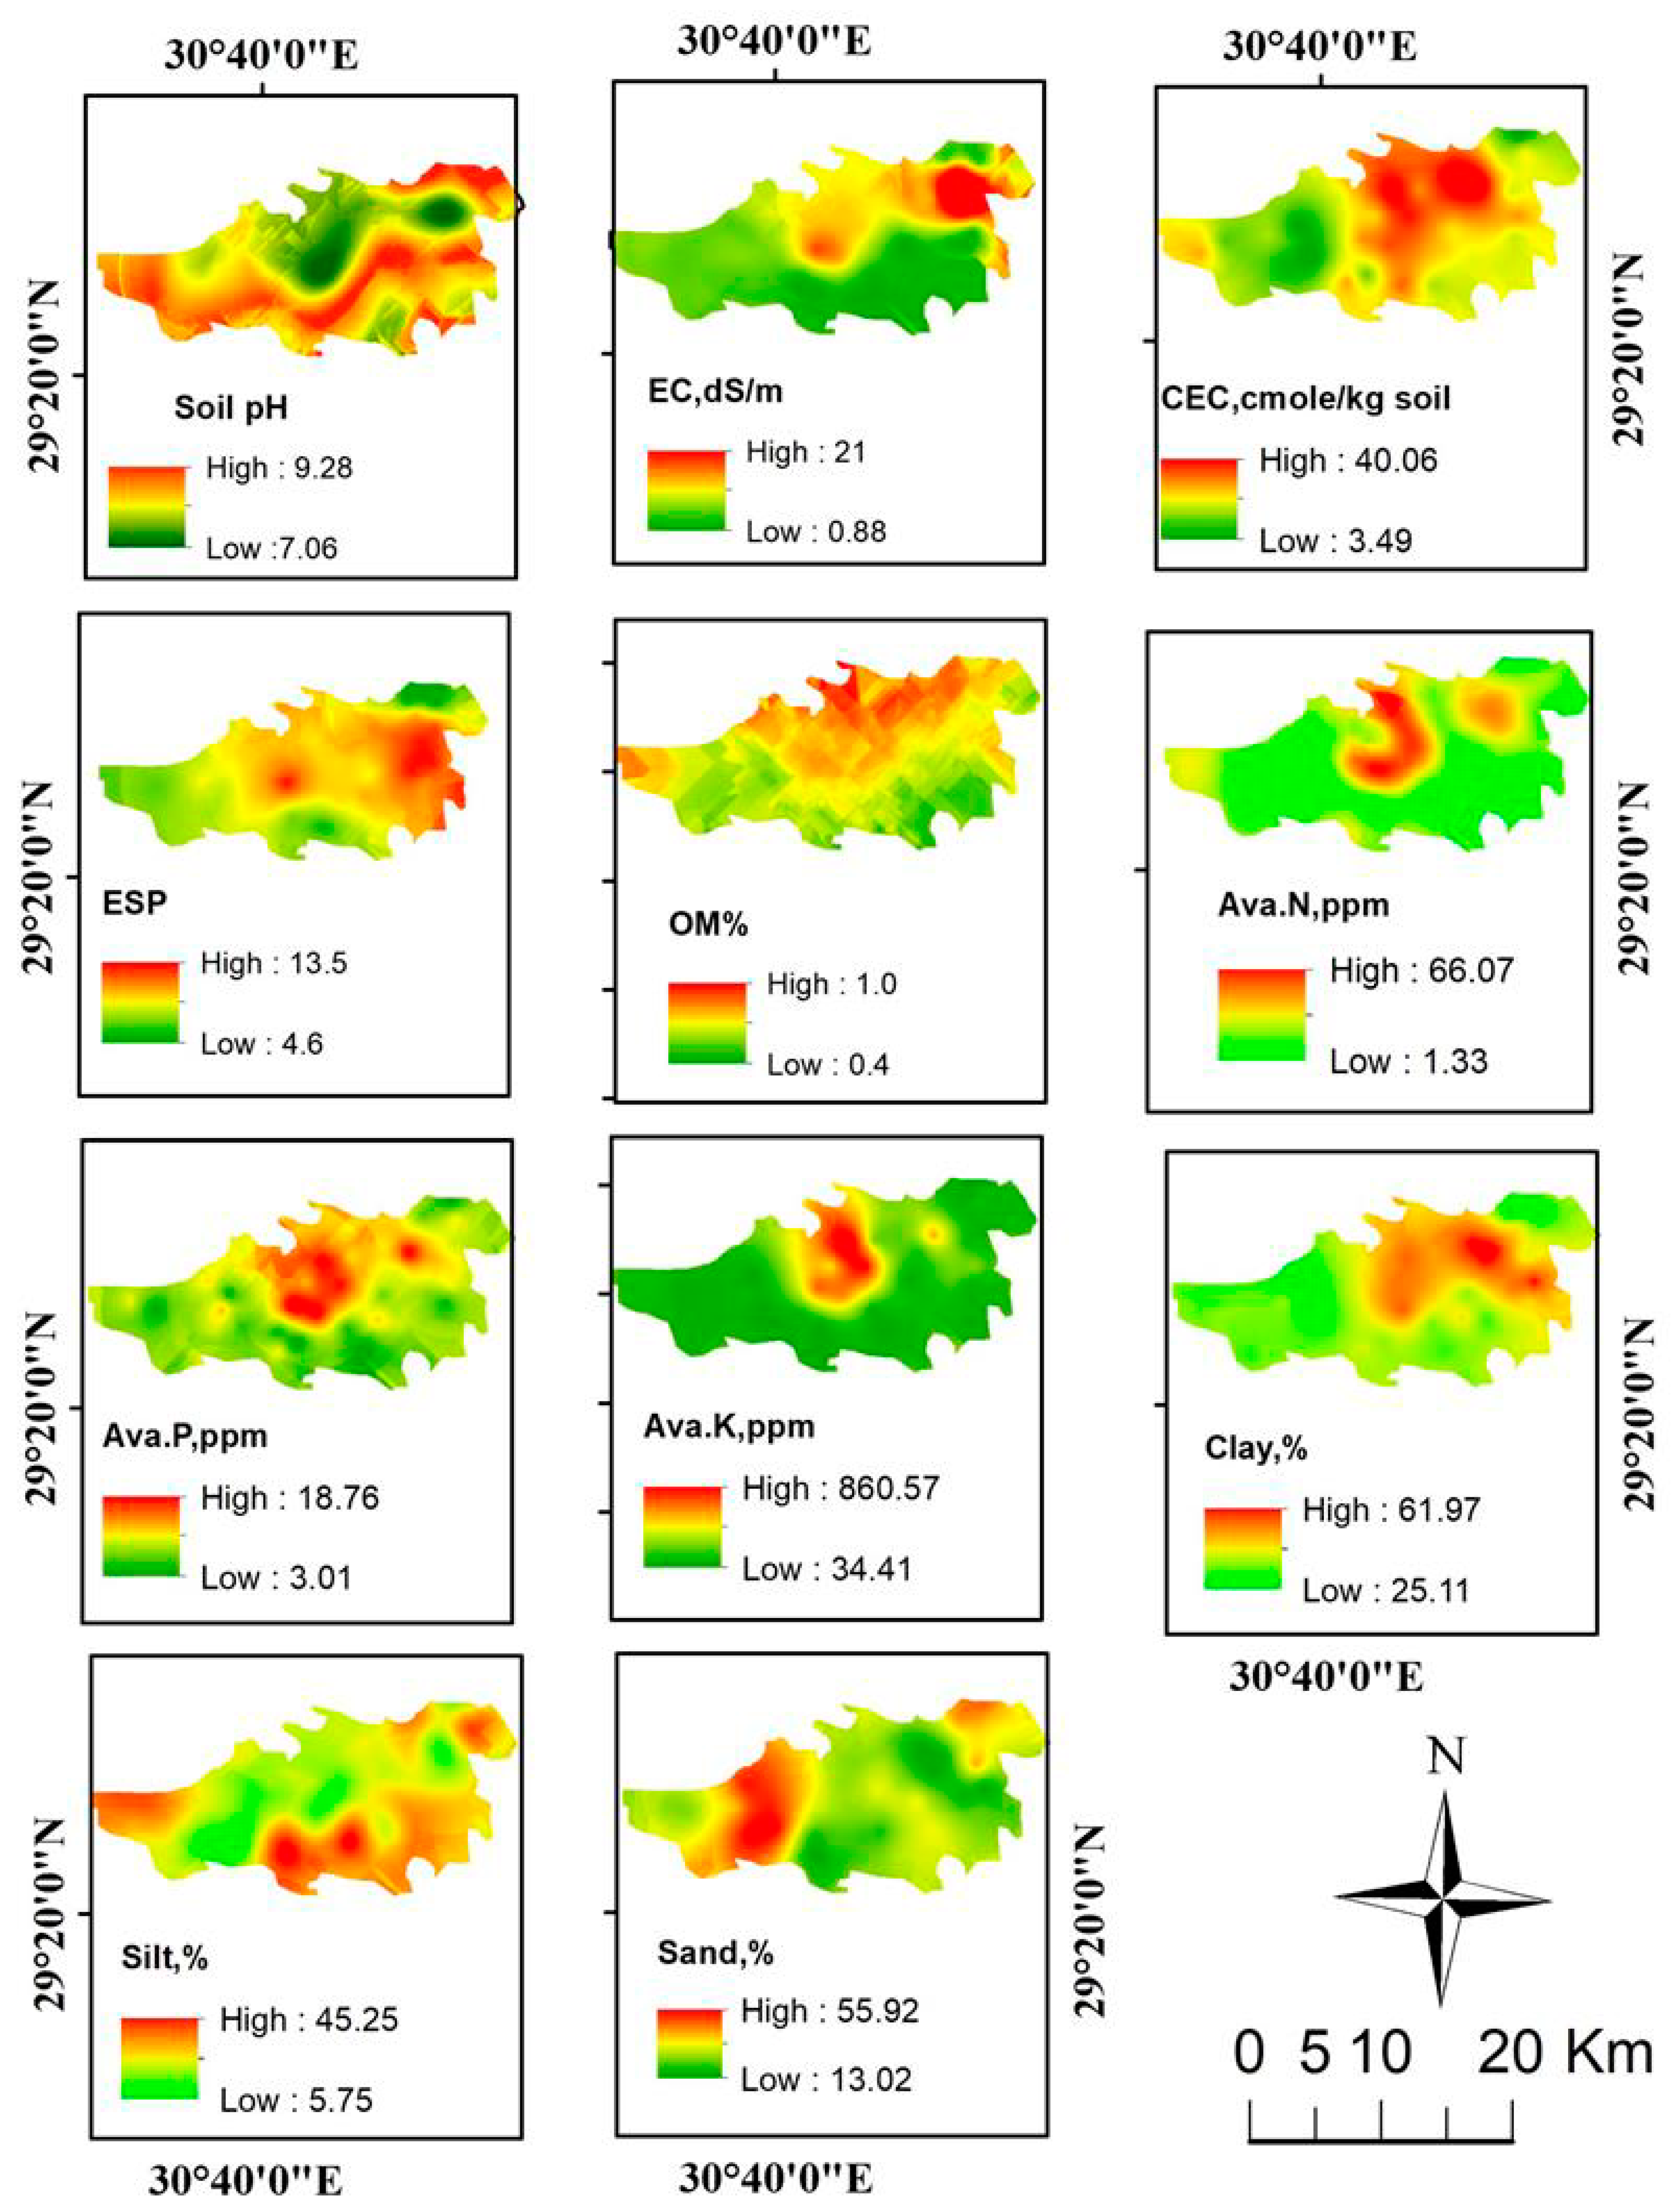
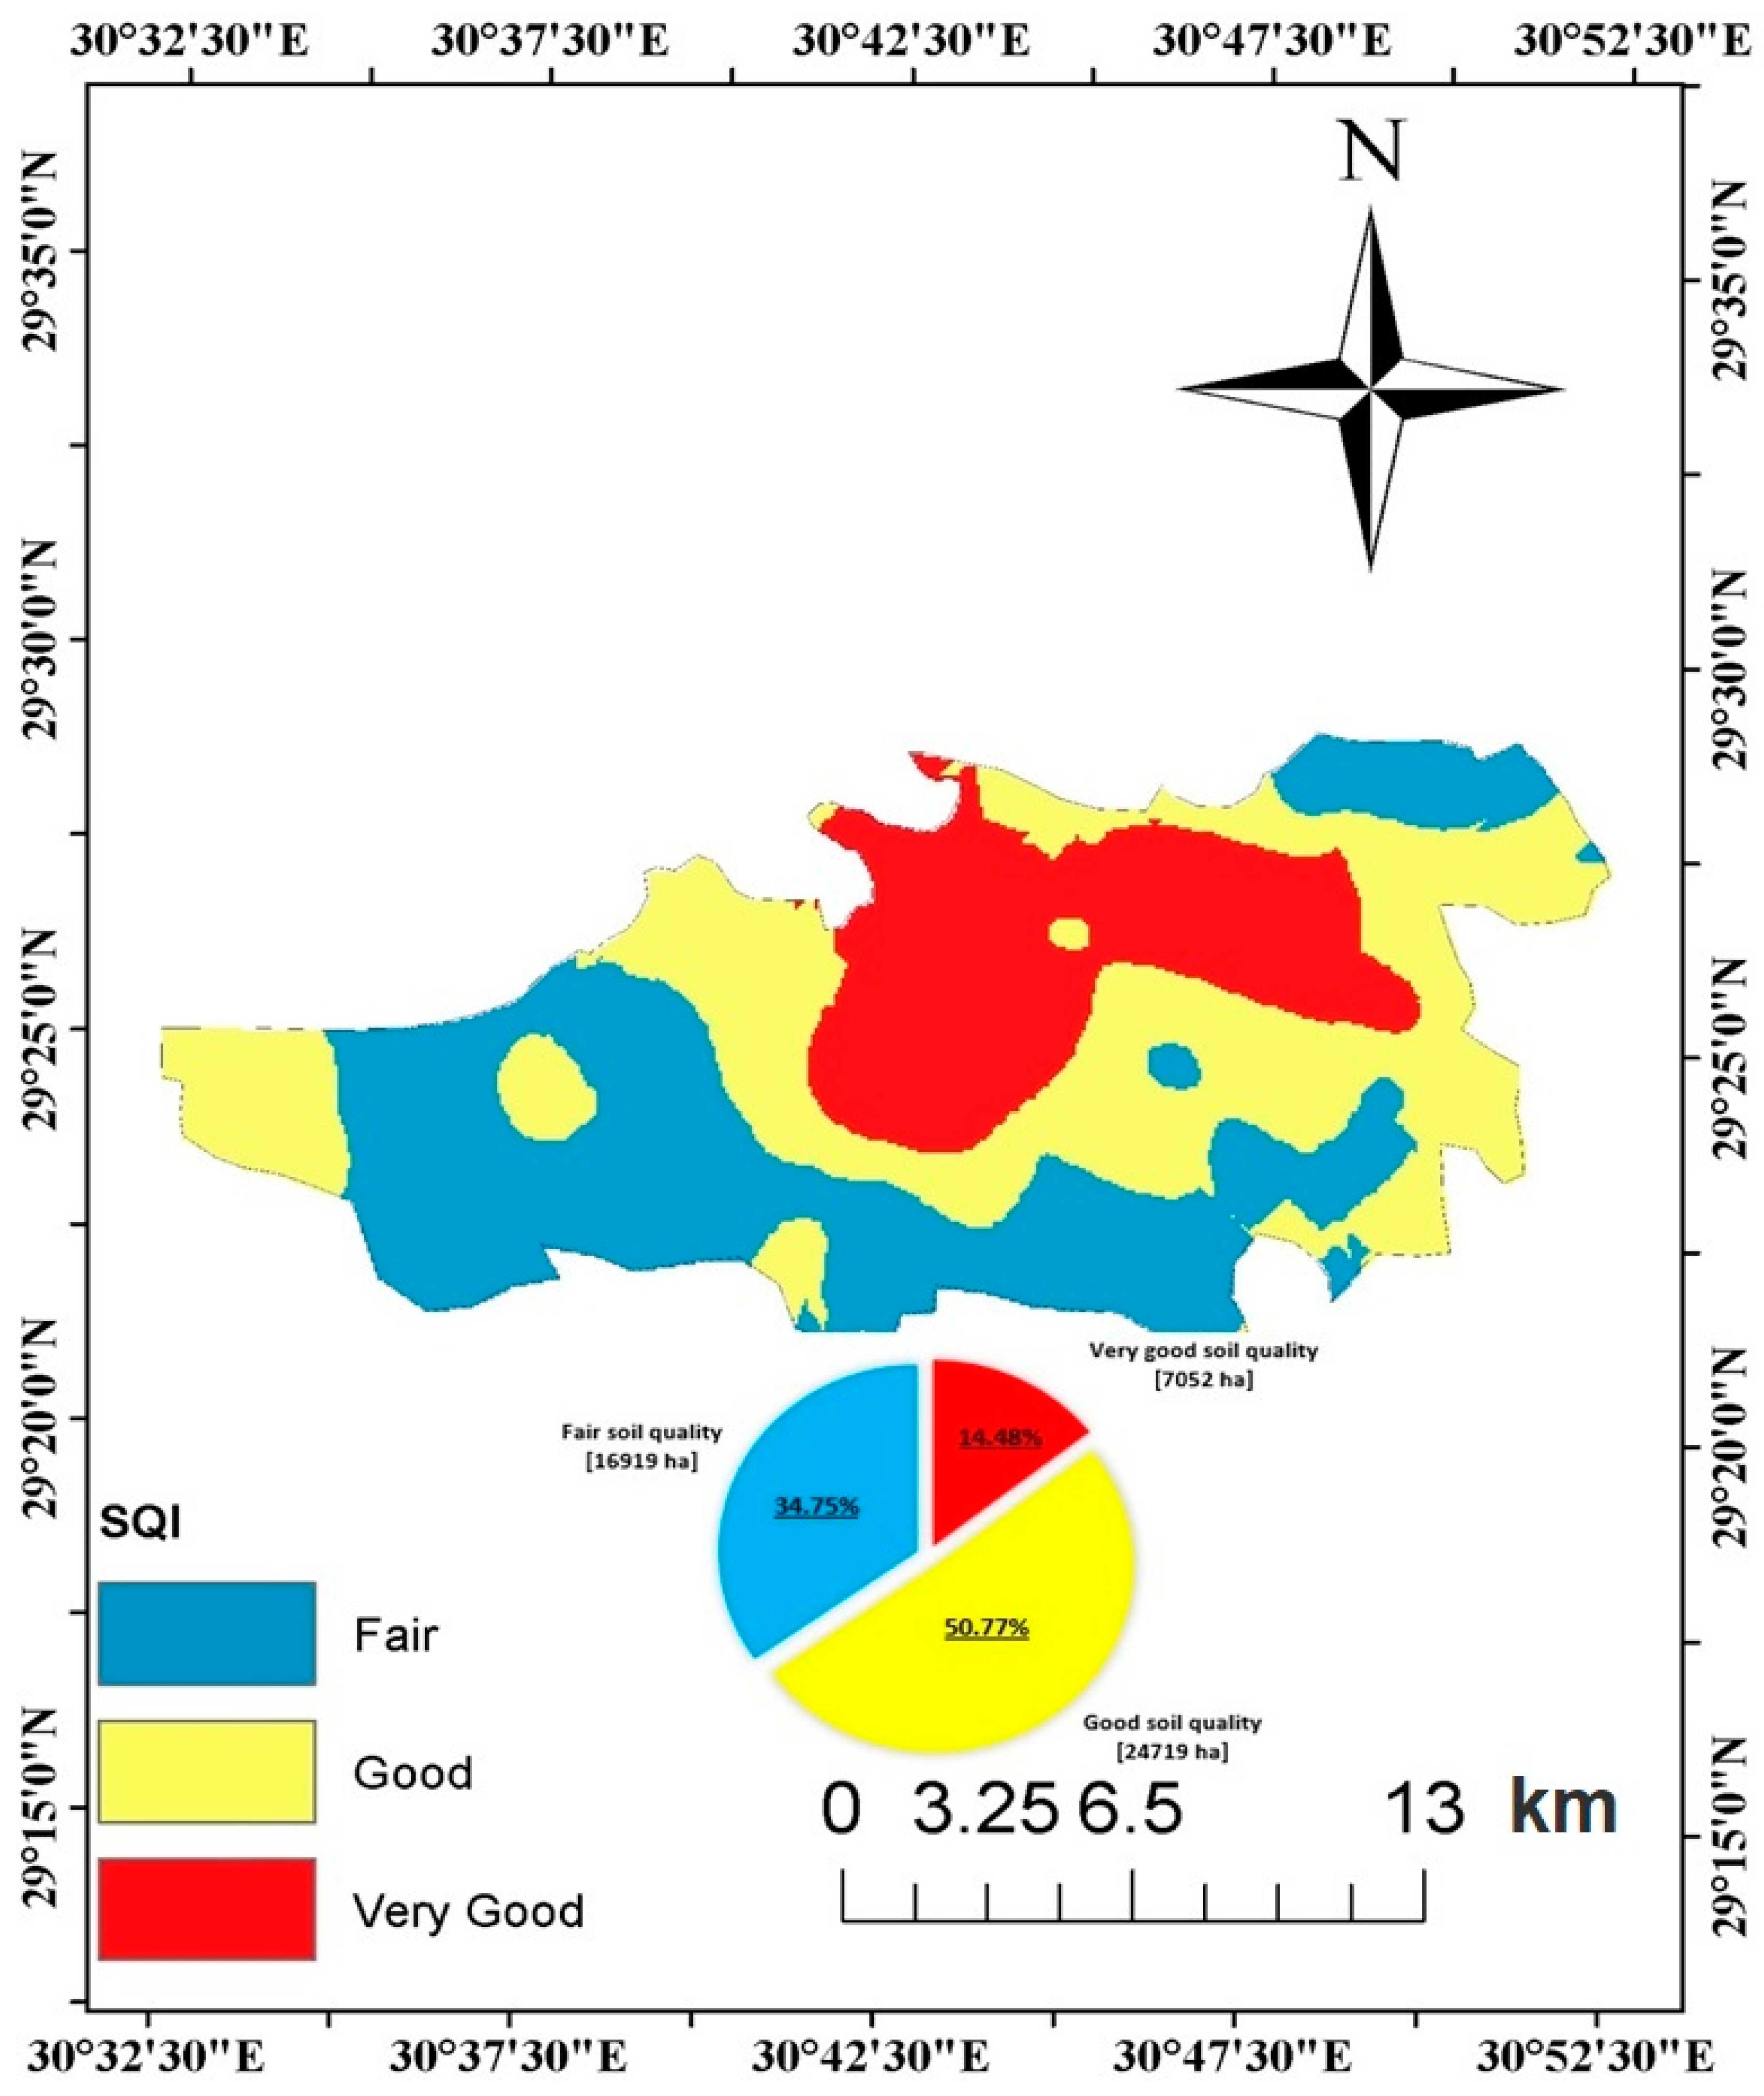
| Property | N | Minimum | Maximum | Mean | Std. Deviation | Shapiro–Wilk |
|---|---|---|---|---|---|---|
| pH | 36 | 7.09 | 8.65 | 7.86 | 0.47 | 0.06 |
| EC, dS/m | 36 | 0.87 | 20.33 | 5.3 | 5.05 | <0.0001 |
| CEC, cmolc/kg soil | 36 | 3.45 | 40.23 | 20.62 | 8.97 | 0.7 |
| ESP | 36 | 1.86 | 17.13 | 9.75 | 3.67 | 0.23 |
| OM, % | 36 | 0.07 | 1.77 | 0.69 | 0.46 | 0.04 |
| N, mg kg−1 | 36 | 1.33 | 61.55 | 19.91 | 17.42 | 0 |
| P, mg kg−1 | 36 | 2.33 | 19.84 | 9.5 | 4.51 | 0.08 |
| K, mg kg−1 | 36 | 32.76 | 733.77 | 183.52 | 193.09 | <0.0001 |
| Silt, | 36 | 8.19 | 44.76 | 26.58 | 8.98 | 0.615 |
| Clay, % | 36 | 24.98 | 62.09 | 42.54 | 10.055 | 0.193 |
| Sand, % | 36 | 12.98 | 55.94 | 30.88 | 12.31 | 0.078 |
| Variables | pH | EC | OM | CEC | N | P | K | ESP | Silt |
|---|---|---|---|---|---|---|---|---|---|
| EC, dS/m | −0.72 | ||||||||
| OM, % | −0.36 | 0.26 | |||||||
| CEC, cmolc/l | −0.33 | 0.23 | 0.66 | ||||||
| N, mg kg−1 | −0.71 | 0.59 | 0.77 | 0.70 | |||||
| P, mg kg−1 | −0.64 | 0.43 | 0.78 | 0.63 | 0.84 | ||||
| K, mg kg−1 | −0.61 | 0.30 | 0.69 | 0.67 | 0.89 | 0.82 | |||
| ESP | −0.58 | 0.55 | 0.24 | 0.34 | 0.39 | 0.40 | 0.32 | ||
| Silt, % | 0.52 | −0.47 | −0.06 | 0.15 | −0.34 | −0.41 | −0.33 | −0.24 | |
| Clay, % | −0.48 | 0.35 | 0.41 | 0.76 | 0.65 | 0.52 | 0.64 | 0.60 | −0.16 |
| Kaiser Meyer Olkin Measure of Sampling Adequacy | KMO | 0.70 |
|---|---|---|
| Bartlett’s sphericity test | Chi-square (Observed value) | 334.63 |
| Chi-square (Critical value) | 61.66 | |
| DF | 45.00 | |
| p-value | <0.0001 | |
| Alpha | 0.05 |
| PC1 | PC2 | PC3 | ||
|---|---|---|---|---|
| Eigenvalue | 5.65 | 1.68 | 1.04 | |
| Variability (%) | 56.45 | 16.76 | 10.41 | |
| Cumulative % | 56.45 | 73.22 | 83.63 | |
| pH | Factor loadings | −0.79 | 0.45 | −0.01 |
| EC, dS/m | 0.63 | −0.57 | 0.15 | |
| OM, % | 0.74 | 0.42 | −0.27 | |
| CEC, cmolc/l | 0.74 | 0.55 | 0.24 | |
| N, mg kg−1 | 0.95 | 0.09 | −0.17 | |
| P, mg kg−1 | 0.89 | 0.09 | −0.29 | |
| K, mg kg−1 | 0.87 | 0.21 | −0.24 | |
| ESP | 0.60 | −0.32 | 0.60 | |
| Silt, % | −0.40 | 0.70 | 0.40 | |
| Clay, % | 0.76 | 0.16 | 0.45 | |
| pH | Component Score Coefficient Matrix (CSC) | −0.14 | 0.27 | −0.01 |
| EC, dS/m | 0.11 | −0.34 | 0.14 | |
| OM, % | 0.13 | 0.25 | −0.26 | |
| CEC, cmolc/l | 0.13 | 0.33 | 0.23 | |
| N, mg kg−1 | 0.17 | 0.05 | −0.16 | |
| P, mg kg−1 | 0.16 | 0.05 | −0.28 | |
| K, mg kg−1 | 0.15 | 0.12 | −0.23 | |
| ESP | 0.11 | −0.19 | 0.58 | |
| Silt, % | −0.07 | 0.42 | 0.38 | |
| Clay, % | 0.13 | 0.09 | 0.43 | |
| Sample No | Standardized z Score | SQI-PC1 | SQI-PC2 | SQI-PC3 | CSQI 1 | CSQI 2 | |||||||||
|---|---|---|---|---|---|---|---|---|---|---|---|---|---|---|---|
| pH | EC | OM | CEC | N | P | K | ESP | Silt | Clay | ||||||
| 1 | 1.55 | 1.08 | 2.32 | 0.58 | 2.39 | 2.29 | 2.16 | 2.01 | 0.64 | 0.70 | 1.64 | 0.73 | −0.15 | 1.03 | 0.85 |
| 2 | 1.64 | 0.64 | 1.18 | 0.93 | 1.89 | 1.86 | 1.79 | 0.25 | 0.92 | 1.33 | 1.14 | 0.91 | −0.19 | 0.78 | 0.78 |
| 3 | 1.60 | 0.60 | 0.74 | 0.03 | 0.70 | 0.38 | 1.06 | 0.38 | 0.73 | 1.03 | 0.40 | 0.31 | 0.36 | 0.32 | 0.62 |
| 4 | 1.30 | 0.49 | 2.06 | 1.81 | 2.21 | 1.80 | 2.85 | 0.15 | 0.81 | 1.23 | 1.59 | 1.58 | −0.66 | 1.09 | 0.86 |
| 5 | 1.17 | 0.40 | 0.90 | 1.28 | 2.05 | 1.53 | 2.79 | 0.01 | 1.18 | 0.84 | 1.20 | 0.92 | −0.48 | 0.78 | 0.78 |
| 6 | 1.25 | 0.29 | 0.87 | 0.49 | 0.38 | 0.28 | 0.09 | 0.34 | 0.50 | 0.74 | 0.25 | 0.45 | 0.46 | 0.27 | 0.61 |
| 7 | 1.10 | 0.56 | 1.76 | 2.19 | 1.52 | 2.01 | 1.63 | 0.86 | 0.03 | 1.94 | 1.59 | 1.64 | 0.28 | 1.20 | 0.89 |
| 8 | 0.63 | 0.77 | 0.62 | 1.93 | 0.91 | 0.23 | 0.29 | 0.53 | 0.11 | 1.81 | 0.85 | 0.81 | 1.24 | 0.74 | 0.77 |
| 9 | 0.03 | 0.62 | 0.24 | 1.28 | 0.53 | 0.01 | 0.17 | 0.47 | 0.25 | 1.52 | 0.61 | 0.27 | 1.21 | 0.52 | 0.70 |
| 10 | 1.27 | 2.97 | 0.14 | 0.34 | 0.69 | 0.48 | 0.33 | 1.21 | 1.16 | 0.07 | 0.52 | −1.13 | 1.30 | 0.24 | 0.59 |
| 11 | 1.08 | 2.77 | 0.40 | 0.25 | 0.75 | 0.03 | 0.42 | 1.29 | 0.90 | 0.34 | 0.56 | −0.97 | 1.34 | 0.29 | 0.61 |
| 12 | 1.13 | 2.42 | 1.13 | 0.21 | 0.14 | 0.17 | 0.58 | 1.48 | 0.24 | 0.03 | 0.57 | −0.46 | 0.84 | 0.33 | 0.63 |
| 13 | 0.31 | 0.19 | 0.25 | 0.98 | 0.63 | 0.74 | 0.45 | 0.58 | 0.96 | 1.18 | 0.58 | 0.12 | 0.98 | 0.45 | 0.67 |
| 14 | 0.20 | 0.44 | 0.96 | 1.38 | 0.73 | 0.03 | 0.56 | 0.53 | 2.05 | 0.66 | 0.54 | −0.19 | 1.24 | 0.40 | 0.66 |
| 15 | 0.42 | 0.37 | 1.34 | 1.87 | 0.95 | 0.83 | 0.72 | 0.05 | 1.58 | 0.95 | 0.82 | 0.53 | 0.61 | 0.62 | 0.73 |
| 16 | 0.42 | 0.39 | 0.38 | 0.76 | 0.61 | 0.45 | 0.42 | 0.31 | 0.40 | 1.75 | 0.60 | 0.36 | 0.89 | 0.49 | 0.69 |
| 17 | 0.61 | 0.24 | 0.51 | 0.53 | 0.54 | 0.24 | 0.56 | 0.37 | 0.36 | 0.37 | 0.35 | 0.31 | 0.24 | 0.28 | 0.61 |
| 18 | 0.31 | 0.35 | 1.30 | 1.73 | 0.93 | 1.20 | 0.78 | 0.05 | 0.86 | 1.19 | 0.95 | 0.80 | 0.31 | 0.71 | 0.76 |
| 19 | 1.25 | 0.47 | 0.92 | 0.12 | 0.04 | 0.31 | 0.31 | 1.96 | 0.80 | 1.36 | 0.45 | −0.08 | 1.70 | 0.42 | 0.66 |
| 20 | 1.51 | 0.50 | 0.57 | 0.32 | 0.02 | 0.71 | 0.53 | 2.15 | 0.31 | 1.46 | 0.56 | 0.18 | 1.65 | 0.52 | 0.70 |
| 21 | 1.70 | 0.62 | 1.24 | 1.91 | 0.98 | 1.25 | 0.71 | 2.14 | 0.75 | 0.86 | 1.01 | 0.74 | 1.41 | 0.84 | 0.80 |
| 22 | 0.27 | 0.19 | 0.96 | 0.02 | 0.29 | 0.23 | 0.36 | 0.51 | 1.37 | 0.75 | 0.31 | −0.28 | 0.72 | 0.20 | 0.58 |
| 23 | 0.57 | 0.32 | 0.32 | 0.37 | 0.10 | 0.46 | 0.43 | 0.43 | 0.59 | 0.37 | 0.25 | 0.03 | 0.43 | 0.19 | 0.58 |
| 24 | 0.50 | 0.41 | 0.91 | 0.99 | 0.69 | 1.27 | 0.66 | 0.73 | 1.03 | 0.45 | 0.71 | 0.19 | 0.44 | 0.48 | 0.68 |
| 25 | 0.61 | 0.80 | 0.17 | 0.47 | 0.48 | 0.25 | 0.47 | 0.21 | 2.02 | 0.03 | 0.16 | −0.71 | 0.82 | 0.06 | 0.52 |
| 26 | 0.54 | 0.76 | 0.35 | 0.13 | 0.61 | 1.12 | 0.51 | 0.37 | 1.55 | 0.19 | 0.39 | −0.54 | 0.40 | 0.17 | 0.57 |
| 27 | 0.50 | 0.86 | 1.15 | 0.99 | 1.07 | 1.56 | 0.76 | 0.96 | 1.48 | 0.46 | 0.91 | −0.08 | 0.57 | 0.56 | 0.71 |
| 28 | 1.27 | 0.88 | 0.14 | 0.86 | 0.54 | 0.39 | 0.35 | 1.68 | 1.21 | 0.39 | 0.41 | −0.34 | 1.59 | 0.34 | 0.63 |
| 29 | 1.10 | 0.70 | 0.11 | 0.49 | 0.73 | 0.90 | 0.56 | 0.45 | 1.83 | 0.54 | 0.34 | −0.41 | 0.86 | 0.22 | 0.59 |
| 30 | 0.18 | 0.82 | 1.04 | 0.57 | 0.98 | 1.59 | 0.70 | 0.58 | 0.96 | 0.72 | 0.89 | −0.02 | 0.22 | 0.52 | 0.70 |
| 31 | 0.44 | 0.70 | 0.17 | 0.15 | 0.66 | 0.52 | 0.22 | 0.53 | 0.41 | 0.37 | 0.36 | −0.19 | 0.40 | 0.22 | 0.59 |
| 32 | 0.80 | 0.72 | 1.13 | 0.21 | 0.91 | 0.03 | 0.30 | 0.46 | 0.64 | 0.78 | 0.45 | 0.12 | 0.47 | 0.32 | 0.63 |
| 33 | 1.51 | 0.87 | 1.32 | 0.01 | 1.03 | 0.56 | 0.61 | 0.54 | 0.23 | 0.46 | 0.52 | 0.44 | −0.10 | 0.35 | 0.64 |
| 34 | 0.82 | 0.63 | 0.81 | 0.56 | 0.12 | 0.25 | 0.24 | 1.30 | 0.08 | 1.75 | 0.60 | 0.32 | 1.39 | 0.53 | 0.70 |
| 35 | 0.80 | 0.66 | 0.27 | 0.30 | 0.31 | 0.44 | 0.17 | 1.48 | 0.37 | 1.06 | 0.46 | −0.12 | 1.32 | 0.38 | 0.65 |
| 36 | 0.72 | 0.72 | 1.02 | 0.42 | 0.83 | 1.02 | 0.59 | 0.24 | 0.45 | 0.36 | 0.60 | 0.30 | −0.17 | 0.37 | 0.64 |
| Observation | Class | Distance to Centroid | Observation | Class | Distance to Centroid |
|---|---|---|---|---|---|
| Sample 1 | 1 | 20,405 | Sample 19 | 3 | 42,857 |
| Sample 2 | 1 | 88,513 | Sample 20 | 3 | 14,292 |
| Sample 3 | 2 | 150,358 | Sample 21 | 3 | 42,775 |
| Sample 4 | 1 | 117,091 | Sample 22 | 3 | 34,889 |
| Sample 5 | 1 | 106,341 | Sample 23 | 3 | 21,216 |
| Sample 6 | 2 | 37,283 | Sample 24 | 3 | 29,534 |
| Sample 7 | 1 | 119,473 | Sample 25 | 3 | 21,470 |
| Sample 8 | 2 | 15,665 | Sample 26 | 3 | 14,196 |
| Sample 9 | 2 | 87,178 | Sample 27 | 3 | 50,381 |
| Sample 10 | 3 | 47,456 | Sample 28 | 3 | 35,095 |
| Sample 11 | 3 | 35,431 | Sample 29 | 3 | 19,728 |
| Sample 12 | 3 | 21,836 | Sample 30 | 3 | 37,255 |
| Sample 13 | 3 | 19,036 | Sample 31 | 3 | 58,097 |
| Sample 14 | 3 | 23,596 | Sample 32 | 3 | 42,278 |
| Sample 15 | 3 | 44,994 | Sample 33 | 3 | 20,554 |
| Sample 16 | 3 | 22,714 | Sample 34 | 2 | 12,668 |
| Sample 17 | 3 | 10,775 | Sample 35 | 2 | 26,036 |
| Sample 18 | 3 | 54,312 | Sample 36 | 3 | 19,239 |
| Soil Attribute | Model | Nugget | Partial Sill | Sill | Nugget/Sill | Major Range | SDC | ME | RMSE | MSE | RMSSE | ASE |
|---|---|---|---|---|---|---|---|---|---|---|---|---|
| pH | K-Bessel | 0.00 | 0.25 | 0.25 | 0.00 | 6834.73 | Strong | −0.025 | 0.26 | −0.07 | 1.97 | 0.16 |
| ECe | Tetraspherical | 0.00 | 28.43 | 28.43 | 0.00 | 4097.26 | Strong | 0.149 | 3.75 | 0.03 | 0.81 | 4.92 |
| CEC | Exponential | 0.00 | 109.91 | 109.91 | 0.00 | 13,286.94 | Strong | 0.205 | 7.48 | 0.02 | 1.13 | 6.59 |
| ESP | Exponential | 6.09 | 7.84 | 13.93 | 0.44 | 6767.76 | Moderate | 0.261 | 3.31 | 0.07 | 0.94 | 3.53 |
| OM | K-Bessel | 0.21 | 0.02 | 0.24 | 0.90 | 8069.50 | Weak | 0.004 | 0.49 | 0.01 | 0.99 | 0.50 |
| Av. N | Exponential | 0.00 | 436.44 | 436.44 | 0.00 | 8997.19 | Strong | 0.418 | 13.39 | 0.02 | 0.86 | 15.45 |
| Av. P | Exponential | 2.16 | 21.11 | 23.27 | 0.09 | 4117.22 | Strong | 0.123 | 4.70 | 0.02 | 1.02 | 4.66 |
| Av. K | Tetraspherical | 0.00 | 64,817.40 | 64,817.40 | 0.00 | 10,056.06 | Strong | 0.814 | 181.6 | 0.01 | 1.24 | 146.1 |
| Clay | Exponential | 0.00 | 113.55 | 113.55 | 0.00 | 7915.15 | Strong | 0.284 | 7.32 | 0.03 | 0.90 | 8.28 |
| Silt | Exponential | 0.00 | 98.41 | 98.41 | 0.00 | 7638.38 | Strong | −0.103 | 6.91 | −0.02 | 0.89 | 7.81 |
| Sand | Spherical | 0.00 | 171.92 | 171.92 | 0.00 | 7698.37 | Strong | −0.323 | 7.85 | −0.02 | 0.99 | 8.09 |
| Indicators | First Zone | Second Zone | Third Zone | Pr > F | Sig. | |||
|---|---|---|---|---|---|---|---|---|
| Value | Rating | Value | Rating | Value | Rating | |||
| pH | 7.22 b | Normal | 7.71a | High | 8.02 a | High | 0.001 | Yes |
| EC, dS/m | 4.46 c | Medium | 6.14 b | Medium | 8.50 a | High | 0.244 | Yes |
| OM, % | 1.46 a | High | 0.68 b | Medium | 0.54 b | Low | 0.000 | Yes |
| CEC, cmolc/kg | 32.8 a | High | 27.49 a | High | 16.54 b | Medium | 0.000 | Yes |
| N, mg kg−1 | 54.96 a | Low | 25.99 b | Low | 11.45 c | Low | 0.000 | Yes |
| P, mg kg−1 | 18.08 a | High | 10.03 b | Medium | 7.67 b | Medium | 0.000 | Yes |
| K, mg kg−1 | 616.84 a | High | 237.47 b | High | 83.9 c | Medium | 0.000 | Yes |
| ESP | 11.93 ab | Low | 12.5 a | Low | 8.65 b | Low | 0.020 | Yes |
| Silt, % | 20.28 a | 24.62 a | 28.31 a | 0.161 | No | |||
| Clay, % | 54.67 a | 55.9 a | 36.93 b | 0.000 | Yes | |||
| SQI | 0.88 a | Very good | 0.67 b | Good | 0.37 c | Fair | 0.000 | Yes |
| Area, ha (%) | 7052 (14.48%) | 24,719 (50.77%) | 16,919 (34.75%) | |||||
Publisher’s Note: MDPI stays neutral with regard to jurisdictional claims in published maps and institutional affiliations. |
© 2021 by the authors. Licensee MDPI, Basel, Switzerland. This article is an open access article distributed under the terms and conditions of the Creative Commons Attribution (CC BY) license (http://creativecommons.org/licenses/by/4.0/).
Share and Cite
Abdel-Fattah, M.K.; Mohamed, E.S.; Wagdi, E.M.; Shahin, S.A.; Aldosari, A.A.; Lasaponara, R.; Alnaimy, M.A. Quantitative Evaluation of Soil Quality Using Principal Component Analysis: The Case Study of El-Fayoum Depression Egypt. Sustainability 2021, 13, 1824. https://doi.org/10.3390/su13041824
Abdel-Fattah MK, Mohamed ES, Wagdi EM, Shahin SA, Aldosari AA, Lasaponara R, Alnaimy MA. Quantitative Evaluation of Soil Quality Using Principal Component Analysis: The Case Study of El-Fayoum Depression Egypt. Sustainability. 2021; 13(4):1824. https://doi.org/10.3390/su13041824
Chicago/Turabian StyleAbdel-Fattah, Mohamed K., Elsayed Said Mohamed, Enas M. Wagdi, Sahar A. Shahin, Ali A. Aldosari, Rosa Lasaponara, and Manal A. Alnaimy. 2021. "Quantitative Evaluation of Soil Quality Using Principal Component Analysis: The Case Study of El-Fayoum Depression Egypt" Sustainability 13, no. 4: 1824. https://doi.org/10.3390/su13041824
APA StyleAbdel-Fattah, M. K., Mohamed, E. S., Wagdi, E. M., Shahin, S. A., Aldosari, A. A., Lasaponara, R., & Alnaimy, M. A. (2021). Quantitative Evaluation of Soil Quality Using Principal Component Analysis: The Case Study of El-Fayoum Depression Egypt. Sustainability, 13(4), 1824. https://doi.org/10.3390/su13041824


