
Moisture, Temperature, and Salinity of a Typical Desert Plant (Haloxylon ammodendron) in an Arid Oasis of Northwest China

 , , , and
Abstract
:1. Introduction
2. Materials and Methods
2.1. Site Description
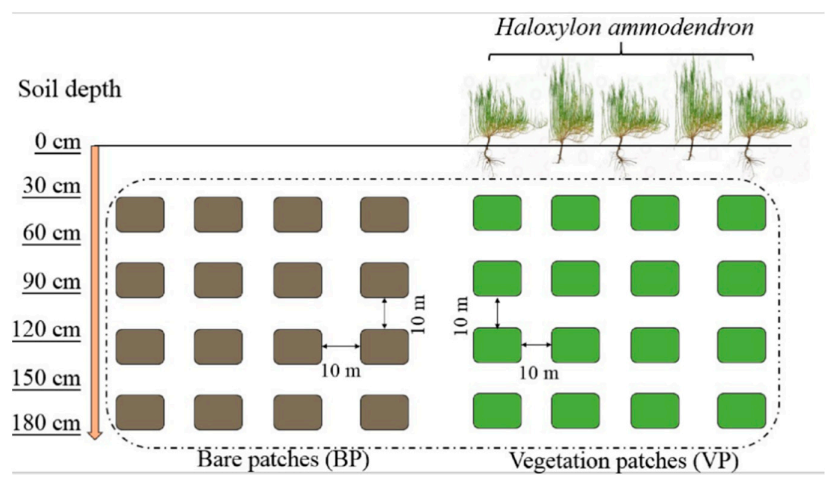
2.2. Experimental Design
2.2.1. Soil Water Content and Soil Salinity
2.2.2. Hydrochemical Ions
2.2.3. Water Stable Isotope Measurement
3. Results
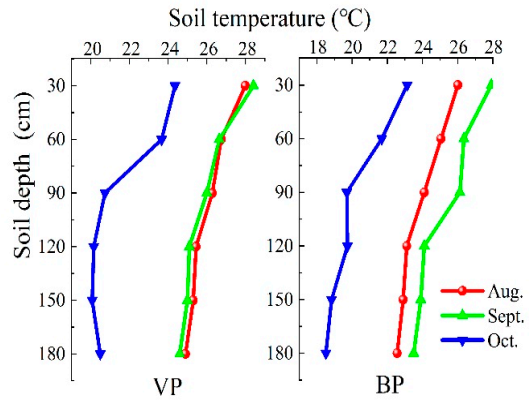
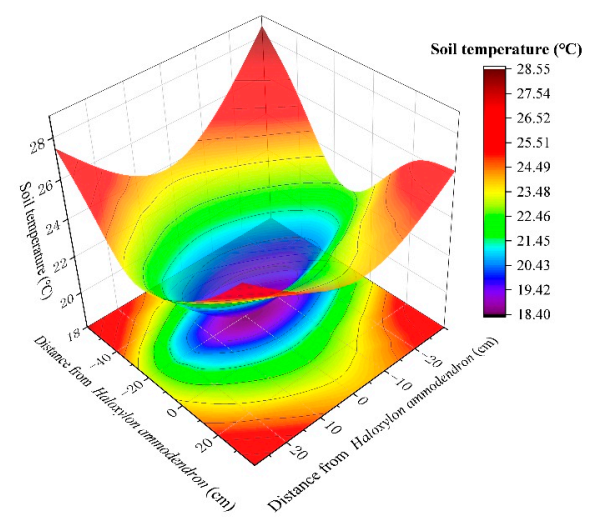
3.1. Soil Temperature
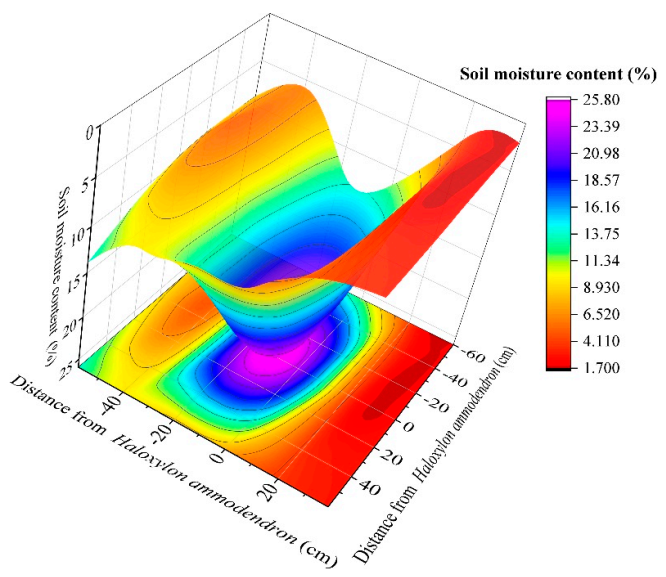
3.2. Soil Moisture
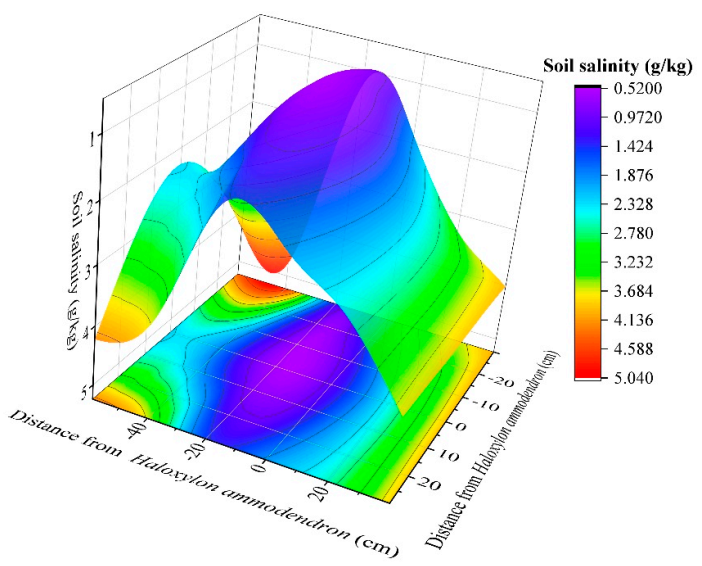
3.3. Soil Salinity
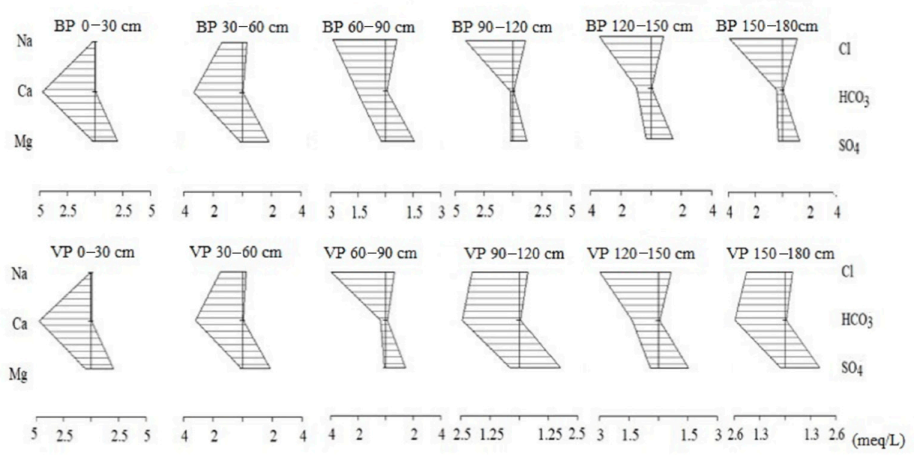
3.4. Soil Major Ions
3.5. Water Source of H. ammodendron
4. Discussion
4.1. Distribution Characteristics of Soil Temperature, Moisture, and Salinity
4.2. Changes of Soil Ions and Hydrochemical Types
4.3. Analysis of Water Sources and Utilization of H. ammodendron
5. Conclusions
Author Contributions
Funding
Institutional Review Board Statement
Informed Consent Statement
Data Availability Statement
Acknowledgments
Conflicts of Interest
References
- Dunkerley, D.L. Banded vegetation: Development under uniform rainfall from a simple cellular automaton model. Plant Ecol. 1997, 129, 103–111. [Google Scholar] [CrossRef]
- Pérez-Barbería, F.; Ramsay, S.; Hooper, R.; Pérez-Fernández, E.; Robertson, A.; Aldezabal, A.; Goddard, P.; Gordon, I. The influence of habitat on body size and tooth wear in Scottish red deer (Cervus elaphus). Can. J. Zool. 2015, 93, 61–70. [Google Scholar] [CrossRef]
- Paschalis, A.; Katul, G.G.; Fatichi, S.; Manoli, G.; Molnar, P. Matching ecohydrological processes and scales of banded vegetation patterns in semiarid catchments. Water Resour. Res. 2016, 52, 2259–2278. [Google Scholar] [CrossRef] [Green Version]
- Wang, G.H.; Zhao, W.Z.; Liu, H.; Zhang, G.F.; Li, F. Changes in soil and vegetation with stabilization of dunes in a desert-oasis ecotone. Ecol. Res. 2015, 30, 639–650. [Google Scholar] [CrossRef]
- Gu, D.X.; Wang, Q.; Otieno, D. Canopy Transpiration and Stomatal Responses to Prolonged Drought by a Dominant Desert Species in Central Asia. Water 2017, 9, 404. [Google Scholar] [CrossRef] [Green Version]
- Li, C.J.; Shi, X.; Lei, J.Q.; Xu, X.W. The scale effect on the soil spatial heterogeneity of Haloxylon ammodendron (C. A. Mey.) in a sandy desert. Environ. Earth Sci. 2014, 71, 4199–4207. [Google Scholar] [CrossRef]
- Yang, G.; He, X.; Zhao, C.; Xue, L.; Chen, J. A saline water irrigation experimental investigation into salt-tolerant and suitable salt concentration of Haloxylon ammodendron from the Gurbantünggüt Desert, Northwestern China. Fresen Environ. Bull 2016, 25, 3408–3416. [Google Scholar]
- Wang, L.; Cai, Q.; Cai, C.; Sun, L. Morphological changes of rill on loess slope and its relationship with flow velocity. Trans. Chin. Soc. Agric. Eng. 2014, 30, 110–117. [Google Scholar] [CrossRef]
- Itoh, A.; Yamakura, T.; Ohkubo, T.; Kanzaki, M.; Palmiotto, P.A.; LaFrankie, J.V.; Ashton, P.S.; Lee, H.S. Importance of topography and soil texture in the spatial distribution of two sympatric dipterocarp trees in a Bornean rainforest. Ecol. Res. 2003, 18, 307–320. [Google Scholar] [CrossRef]
- Enoki, T.; Kawaguchi, H.; Iwatsubo, G. Topographic variations of soil properties and stand structure in a Pinus thunbergii plantation. Ecol. Res. 1996, 11, 299–309. [Google Scholar] [CrossRef]
- Chen, Y.; Yu, F.; Dong, M. Spatial heterogeneity of the psammophytic half-shrub community in Mu Us Sandland. Acta Ecol. Sin. 2000, 20, 568–572. [Google Scholar] [CrossRef]
- Yang, G.; Li, F.; Chen, D.; He, X.; Xue, L.; Long, A. Assessment of changes in oasis scale and water management in the arid Manas River Basin, north western China. Sci. Total Environ. 2019, 691, 506–515. [Google Scholar] [CrossRef]
- Liu, Z.; Liu, T.; Zhang, R.; CHENG, H.-h. Species diversity and spatial differentiation of ephemeral plant community in southern Gurbantunggut Desert. Chin. J. Ecol. 2011, 30, 45–52. [Google Scholar] [CrossRef]
- Sheffer, E.; Yizhaq, H.; Shachak, M.; Meron, E. Mechanisms of vegetation-ring formation in water-limited systems. J. Theor. Biol. 2011, 273, 138–146. [Google Scholar] [CrossRef]
- Oddi, F.; Ghermandi, L.; Lasaponara, R. Dendroecological potential of Fabiana imbricata shrub for reconstructing fire history at landscape scale in grasslands. In Proceedings of the EGU General Assembly Conference Abstracts, Vienna, Austria, 8–13 April 2018. [Google Scholar]
- Meinzer, F.C.; Andrade, J.L.; Goldstein, G.; Holbrook, N.M.; Cavelier, J.; Wright, S.J. Partitioning of soil water among canopy trees in a seasonally dry tropical forest. Oecologia 1999, 121, 293–301. [Google Scholar] [CrossRef]
- Yang, G.; Li, F.; Tian, L.; He, X.; Gao, Y.; Wang, Z.; Ren, F. Soil physicochemical properties and cotton (Gossypium hirsutum L.) yield under brackish water mulched drip irrigation. Soil Tillage Res. 2020, 199, 104592. [Google Scholar] [CrossRef]
- Dawson, L.; Duff, E.; Campbell, C.; Hirst, D. Depth distribution of cherry (Prunus avium L.) tree roots as influenced by grass root competition. Plant Soil 2001, 231, 11–19. [Google Scholar] [CrossRef]
- Zhang, T.; Li, Z.; Li, P.; Xu, G.; Liu, X.; Jin, Y. Response characteristics of soil water use patterns by different plants to precipitation in rocky mountainou areas. J. Appl. Ecol. 2016, 27, 1461–1467. [Google Scholar] [CrossRef]
- Lin, G.; Da S.L. Sternberg, L. Hydrogen isotopic fractionation by plant roots during water uptake in coastal wetland plants. In Stable Isotopes and Plant Carbon-Water Relations; Elsevier: Amsterdam, The Netherlands, 1993; pp. 497–510. [Google Scholar] [CrossRef]
- Zhou, H.; Zhao, W.; Zhang, G. Varying water utilization of Haloxylon ammodendron plantations in a desert-oasis ecotone. Hydrol. Process. 2017, 31, 825. [Google Scholar] [CrossRef]
- Song, L.; Jin, J.; He, J. Effects of Severe Water Stress on Maize Growth Processes in the Field. Sustainability 2019, 11, 5086. [Google Scholar] [CrossRef] [Green Version]
- Aguiar, M.; Sala, O.E. Patch structure, dynamics and implications for the functioning of arid ecosystems. Trends Ecol. Evol. 1999, 14, 273–277. [Google Scholar] [CrossRef]
- Li, J.; Zhao, C.; Zhu, H.; Li, Y.; Wang, F. Effect of plant species on shrub fertile island at an oasis-desert ecotone in the South Junggar Basin, China. J. Arid Environ. 2007, 71, 350–361. [Google Scholar] [CrossRef]
- Wang, Y.G.; Li, Y.; Xiao, D.N. Catchment scale spatial variability of soil salt content in agricultural oasis, Northwest China. Environ. Geol. 2008, 56, 439–446. [Google Scholar] [CrossRef]
- Xu, L.; Du, H.; Zhang, X. Spatial Distribution Characteristics of Soil Salinity and Moisture and Its Influence on Agricultural Irrigation in the Ili River Valley, China. Sustainability 2019, 11, 7142. [Google Scholar] [CrossRef] [Green Version]
- Kéfi, S.; Rietkerk, M.; Alados, C.L.; Pueyo, Y.; Papanastasis, V.P.; ElAich, A.; Ruiter, P.C.d. Spatial vegetation patterns and imminent desertification in Mediterranean arid ecosystems. Nat. Int. Wkly. J. Sci. 2007, 449, 213–217. [Google Scholar] [CrossRef]
- Ludwig, J.A.; Wilcox, B.P.; Breshears, D.D.; Tongway, D.J.; Imeson, A.C. Vegetation Patches And Runoff–Erosion As Interacting Ecohydrological Processes In Semiarid Landscapes. Ecology 2005, 86, 225–236. [Google Scholar] [CrossRef] [Green Version]
- Luo, W.; Zhao, W.; He, Z.; Sun, C. Spatial characteristics of two dominant shrub populations in the transition zone between oasis and desert in the Heihe River Basin, China. Catena 2018, 170, 356–364. [Google Scholar] [CrossRef]
- Xu, G.Q.; Li, Y.; Xu, H. Seasonal variation in plant hydraulic traits of two co-occurring desert shrubs, Tamarix ramosissima and Haloxylon ammodendron, with different rooting patterns. Ecol. Res. 2011, 26, 1071–1080. [Google Scholar] [CrossRef]
- Li, X.; Zhang, Z.; Huang, L.; Wang, X. Review of the ecohydrological processes and feedback mechanisms controlling sand-binding vegetation systems in sandy desert regions of China. Chin. Sci. Bull. 2013, 58, 1483–1496. [Google Scholar] [CrossRef] [Green Version]
- Ke, Z.; Yongzhong, S.; Ting, W.; Tingna, L. Soil properties and herbaceous characteristics in an age sequence of Haloxylon ammodendron plantations in an oasis-desert ecotone of northwestern China. J. Arid Land 2016, 8, 960–972. [Google Scholar] [CrossRef] [Green Version]
- Peng, N.Y.; Song, C.H.; Ke-Lin, W.; Susanne, S. Challenges and probable solutions for using stable isotope techniques to identify plant water sources in karst regions: A review. In J. Appl. Ecol.; 2017; 28, pp. 2361–2368. [Google Scholar] [CrossRef]
- Stromberg, J.; Patten, D. Instream flow and cottonwood growth in the eastern Sierra Nevada of California, USA. Rivers Res. Appl. 1996, 12, 1–12. [Google Scholar] [CrossRef]
- Phillips, D.L.; Gregg, J.W. Source partitioning using stable isotopes: Coping with too many sources. Oecologia 2003, 136, 261–269. [Google Scholar] [CrossRef] [PubMed]
- Zhao, Z.-m.; Shi, F.-x. Contribution of root respiration to spatial-temporal variation of soil respiration in a Haloxylon ammodendrons ecosystem in Gurbantunggut Basin. Acta Ecol. Sin. 2017, 37, 392–398. [Google Scholar] [CrossRef]
- Cecil, R.; McPhee, J. The estimation of thiols and disulphides by potentiometric titration with silver nitrate. Biochem. J. 1955, 59, 234. [Google Scholar] [CrossRef] [Green Version]
- Flaschka, H.A. EDTA Titrations: An Introduction to Theory and Practice; Elsevier: Amsterdam, The Netherlands, 2013; Volume 106, p. 8. [Google Scholar] [CrossRef]
- Mehta, S.A.; Bonakdarpour, A.; Wilkinson, D.P. Impact of cathode additives on the cycling performance of rechargeable alkaline manganese dioxide–zinc batteries for energy storage applications. J. Appl. Electrochem. 2017, 47, 167–181. [Google Scholar] [CrossRef]
- Barnes, R.B.; Richardson, D.; Berry, J.W.; Hood, R.L. Flame photometry a rapid analytical procedure. Ind. Eng. Chem. Anal. Ed. 1945, 17, 605–611. [Google Scholar] [CrossRef]
- Abbaspour, A.; Kamyabi, M.; Khalafi-Nezhad, A.; Soltani Rad, M. Acidity constants and thermodynamic parameters of some phenol derivatives in methanol+ water systems using potentiometry and spectrophotometry methods. J. Chem. Eng. Data 2003, 48, 911–915. [Google Scholar] [CrossRef]
- Phillips, D.L.; Gregg, J.W. Uncertainty in source partitioning using stable isotopes. Oecologia 2001, 127, 171–179. [Google Scholar] [CrossRef]
- Qiu, G.Y.; Li, C.; Yan, C. Characteristics of soil evaporation, plant transpiration and water budget of Nitraria dune in the arid Northwest China. Agric. For. Meteorol. 2015, 203, 107–117. [Google Scholar] [CrossRef]
- Zheng, C.; Wang, Q. Seasonal and annual variation in transpiration of a dominant desert species, Haloxylon ammodendron, in Central Asia up-scaled from sap flow measurement. Ecohydrology 2015, 8, 268. [Google Scholar] [CrossRef]
- Ao, Y.H.; Lyu, S.H.; Han, B.; Li, Z.G. Comparative analysis of the soil thermal regimes of typical underlying surfaces of oasis systems in an Arid Region. Environ. Earth Sci. 2015, 73, 7889–7896. [Google Scholar] [CrossRef]
- Cao, X.M.; Wang, J.L.; Chen, X.; Gao, Z.Q.; Yang, F.; Shi, J.K. Multiscale remote-sensing retrieval in the evapotranspiration of Haloxylon ammodendron in the Gurbantunggut desert, China. Environ. Earth Sci. 2013, 69, 1549–1558. [Google Scholar] [CrossRef]
- Yang, Y.; Zhou, H.; Xu, L. Dynamic variations of soil moisture in Haloxylon ammodendron root zone in Gurbantunggut Desert. J. Appl. Ecol. 2011, 22, 1711–1716. [Google Scholar] [CrossRef]
- Zhou, H.; Zhao, W.; Yang, Q. Root biomass distribution of planted Haloxylon ammodendron in a duplex soil in an oasis: Desert boundary area. Ecol. Res. 2016, 31, 598. [Google Scholar] [CrossRef]
- Nian, W.; Guo, J.; Zhang, J.; Fang, J. Effects of nanosecond pulsed electric field exposure on seed of Saxaul (Haloxylon ammodendron). In Proceedings of the 2013 Abstracts IEEE International Conference on Plasma Science (ICOPS), San Francisco, CA, USA, 16–21 June 2013; p. 1-1. [Google Scholar]
- Gu, F.X.; Chu, Y.; Zhang, Y.D.; Liu, Y.Q.; Anabiek, S.; Ye, Q.; Pan, X.L. Spatial and temporal dynamics of soil moisture and salinity in typical plant communities of Sangonghe Basin. In Ecosystems Dynamics, Ecosystem-Society Interactions, And Remote Sensing Applications for Semi-Arid And Arid Land, Pts 1 And 2; Pan, X.L., Gao, W., Glantz, M.H., Honda, Y., Eds.; Spie-Int Soc Optical Engineering: Bellingham, WA, USA, 2003; Volume 4890, pp. 471–479. [Google Scholar] [CrossRef]
- Lilong, W.; Guanxiang, Z.; Meng, L.; Mingting, Z.; Lifang, Z.; Xinfang, Z.; Lizhe, A.; Shijian, X. C:N:P stoichiometry and leaf traits of halophytes in an arid saline environment, northwest China. PLoS ONE 2015, 10. [Google Scholar] [CrossRef] [Green Version]
- Xingming, H.; Weihong, L. Oasis cold island effect and its influence on air temperature: A case study of Tarim Basin, Northwest China. J. Arid Land 2016, 8, 172–183. [Google Scholar] [CrossRef] [Green Version]
- Maina, J.N.; Wang, Q. Seasonal Response of Chlorophyll a/b Ratio to Stress in a Typical Desert Species: Haloxylon ammodendron. Arid Land Res. Manag. 2015, 29, 321–334. [Google Scholar] [CrossRef]
- Su, Y.Z.; Wang, X.F.; Yang, R.; Yang, X.; Liu, W.J. Soil Fertility, Salinity and Nematode Diversity Influenced by Tamarix ramosissima in Different Habitats in an Arid Desert Oasis. Environ. Manag. 2012, 50, 226–236. [Google Scholar] [CrossRef]
- Yang, W.B.; Feng, W.; Jia, Z.Q.; Zhu, Y.J.; Guo, J.Y. Soil water threshold for the growth of Haloxylon ammodendron in the Ulan Buh desert in arid northwest China. S. Afr. J. Bot. 2014, 92, 53–58. [Google Scholar] [CrossRef] [Green Version]
- Arndt, S.K.; Arampatsis, C.; Foetzki, A.; Li, X.Y.; Zeng, F.J.; Zhang, X.M. Contrasting patterns of leaf solute accumulation and salt adaptation in four phreatophytic desert plants in a hyperarid desert with saline groundwater. J. Arid Environ. 2004, 59, 259–270. [Google Scholar] [CrossRef]
- Wang, S.M.; Wan, C.G.; Wang, Y.R.; Chen, H.; Zhou, Z.Y.; Fu, H.; Sosebee, R.E. The characteristics of Na+, K+ and free proline distribution in several drought-resistant plants of the Alxa Desert, China. J. Arid Environ. 2004, 56, 525–539. [Google Scholar] [CrossRef]
- Kang, J.J.; Duan, J.J.; Wang, S.M.; Zhao, M.; Yang, Z.H. Na compound fertilizer promotes growth and enhances drought resistance of the succulent xerophyte Haloxylon ammodendron. Soil Sci. Plant Nutr. 2013, 59, 289–299. [Google Scholar] [CrossRef]
- Dong, X.J.; Zhang, X.S. Some observations of the adaptations of sandy shrubs to the arid environment in the Mu Us Sandland: Leaf water relations and anatomic features. J. Arid Environ. 2001, 48, 41–48. [Google Scholar] [CrossRef]
- Kang, J.; Zhao, W.; Su, P.; Zhao, M.; Yang, Z. Sodium (Na+) and silicon (Si) coexistence promotes growth and enhances drought resistance of the succulent xerophyte Haloxylon ammodendron. Soil Sci. Plant Nutr. 2014, 60, 659–669. [Google Scholar] [CrossRef]
- Gu, F.X.; Zhang, Y.D.; Pan, X.L.; Chu, Y.; Shi, Q.D.; Ye, Q. Effects of spatial and temporal dynamics of soil water and salinity on new oasis stability. In Ecosystems Dynamics, Ecosystem-Society Interactions, And Remote Sensing Applications for Semi-Arid And Arid Land, Pts 1 And 2; Pan, X.L., Gao, W., Glantz, M.H., Honda, Y., Eds.; Spie-Int Soc Optical Engineering: Bellingham, WA, USA, 2003; Volume 4890, pp. 128–140. [Google Scholar] [CrossRef]
- Su, Y.; Liu, T.; Kong, J. The establishment and development of Haloxylon ammodendron promotes salt accumulation in surface soil of arid sandy land. Sci. Cold Arid Reg. 2019, 11, 116–125. [Google Scholar]
- Li, C.J.; Li, Y.; Ma, J.; Fan, L.L.; Wang, Q.X. Spatial heterogeneity of soil chemical properties between Haloxylon persicum and Haloxylon ammodendron populations. J. Arid Land 2010, 2, 257–265. [Google Scholar] [CrossRef]
- Gries, D.; Zeng, F.; Foetzki, A.; Arndt, S.K.; Bruelheide, H.; Thomas, F.M.; Zhang, X.; Runge, M. Growth and water relations of Tamarix ramosissima and Populus euphratica on Taklamakan desert dunes in relation to depth to a permanent water table. Plant Cell Environ. 2003, 26, 725–736. [Google Scholar] [CrossRef] [Green Version]
- Dai, Y.; Zheng, X.J.; Tang, L.S.; Li, Y. Stable oxygen isotopes reveal distinct water use patterns of two Haloxylon species in the Gurbantonggut Desert. Plant Soil 2015, 389, 73–87. [Google Scholar] [CrossRef]
- Brunel, J.P.; Walker, G.R.; Kennettsmith, A.K. Field Validation Of Isotopic Procedures For Determining Sources Of Water Used By Plants In A Semiarid Environment. J. Hydrol. 1995, 167, 351–368. [Google Scholar] [CrossRef]
- Walker, C.D.; Richardson, S.B. The use of stable isotopes of water in characterising the source of water in vegetation. Elsevier 1991, 94, 145–158. [Google Scholar] [CrossRef]
- Li, B.; Han, Z.; Hu, H.; Bai, C. Study on the effect of groundwater flow on the identification of thermal properties of soils. Renew. Energy 2020, 147, 2688–2695. [Google Scholar] [CrossRef]
- Shan, L.S.; Zhang, X.M.; Wang, Y.K.; Wang, H.; Yan, H.N.; Wei, J.; Xu, H. Influence of moisture on the growth and biomass allocation in Haloxylon ammodendron and Tamarix ramosissima seedlings in the shelterbelt along the Tarim Desert Highway, Xinjiang, China. Chin. Sci. Bull. 2008, 53, 93–101. [Google Scholar] [CrossRef] [Green Version]
- Li, C.J.; Li, Y.; Ma, J.A. Spatial heterogeneity of soil chemical properties at fine scales induced by Haloxylon ammodendron (Chenopodiaceae) plants in a sandy desert. Ecol. Res. 2011, 26, 385–394. [Google Scholar] [CrossRef]
- Yu, T.; Ren, C.; Zhang, J.; He, X.; Ma, L.; Chen, Q.; Qu, Y.; Shi, S.; Zhang, H.; Ma, H. Effect of high desert surface layer temperature stress on Haloxylon ammodendron (C.A. Mey.) Bunge. Flora 2012, 207, 572–580. [Google Scholar] [CrossRef]
- Gu, D.X.; Wang, Q.; Mallik, A. Non-convergent transpiration and stomatal conductance response of a dominant desert species in central Asia to climate drivers at leaf, branch and whole plant scales. J. Agric. Meteorol. 2018, 74, 9–17. [Google Scholar] [CrossRef] [Green Version]
- Wu, X.; Zheng, X.J.; Yin, X.W.; Yue, Y.M.; Liu, R.; Xu, G.Q.; Li, Y. Seasonal variation in the groundwater dependency of two dominant woody species in a desert region of Central Asia. Plant Soil 2019, 444, 39–55. [Google Scholar] [CrossRef]


| Water Source | δ18O | δD | Relative Contribution Rate (%) | |
|---|---|---|---|---|
| Soil water (0–60 cm) | −4.62 | 0.05 | 13.52 | |
| Before the rain | Soil water (60–120 cm) | −7.68 | 0.12 | 23.47 |
| Soil water (120–180 cm) | −10.21 | 0.14 | 28.87 | |
| Groundwater (Below 180 cm) | −11.67 | 0.15 | 34.14 | |
| Soil water (0–60 cm) | −12.83 | 0.15 | 39.93 | |
| After the rain | Soil water (60–120 cm) | −9.64 | 0.08 | 25.17 |
| Soil water (120–180 cm) | −4.93 | 0.05 | 14.27 | |
| Groundwater (Below 180 cm) | −7.12 | 0.06 | 20.63 |
| Water Source | δ18O | δD | Relative Contribution Rate (%) | |
|---|---|---|---|---|
| Soil water (0–60 cm) | −4.98 | 0.05 | 13.24 | |
| Before the rain | Soil water (60–120 cm) | −7.96 | 0.12 | 22.71 |
| Soil water (120–180 cm) | −10.19 | 0.12 | 30.51 | |
| Groundwater (Below 180 cm) | −11.83 | 0.14 | 33.54 | |
| Soil water (0–60 cm) | −11.96 | 0.12 | 39.95 | |
| After the rain | Soil water (60–120 cm) | −11.86 | 0.12 | 25.47 |
| Soil water (120–180 cm) | −3.42 | 0.05 | 13.25 | |
| Groundwater (Below 180 cm) | −10.96 | 0.08 | 21.33 |
| Water Source | δ18O | δD | Relative Contribution Rate (%) | |
|---|---|---|---|---|
| Soil water (0–60 cm) | −4.57 | 0.05 | 8.53 | |
| Before the rain | Soil water (60–120 cm) | −9.74 | 0.06 | 17.96 |
| Soil water (120–180 cm) | −10.12 | 0.08 | 29.80 | |
| Groundwater (Below 180 cm) | −11.59 | 0.12 | 43.71 | |
| Soil water (0–60 cm) | −12.21 | 0.13 | 41.5 | |
| After the rain | Soil water (60–120 cm) | −11.62 | 0.07 | 24.67 |
| Soil water (120–180 cm) | −8.53 | 0.05 | 13.16 | |
| Groundwater (Below 180 cm) | −10.01 | 0.08 | 20.67 |
Publisher’s Note: MDPI stays neutral with regard to jurisdictional claims in published maps and institutional affiliations. |
© 2021 by the authors. Licensee MDPI, Basel, Switzerland. This article is an open access article distributed under the terms and conditions of the Creative Commons Attribution (CC BY) license (http://creativecommons.org/licenses/by/4.0/).
Share and Cite
Zhao, L.; Li, W.; Yang, G.; Yan, K.; He, X.; Li, F.; Gao, Y.; Tian, L. Moisture, Temperature, and Salinity of a Typical Desert Plant (Haloxylon ammodendron) in an Arid Oasis of Northwest China. Sustainability 2021, 13, 1908. https://doi.org/10.3390/su13041908
Zhao L, Li W, Yang G, Yan K, He X, Li F, Gao Y, Tian L. Moisture, Temperature, and Salinity of a Typical Desert Plant (Haloxylon ammodendron) in an Arid Oasis of Northwest China. Sustainability. 2021; 13(4):1908. https://doi.org/10.3390/su13041908
Chicago/Turabian StyleZhao, Li, Wanjing Li, Guang Yang, Ke Yan, Xinlin He, Fadong Li, Yongli Gao, and Lijun Tian. 2021. "Moisture, Temperature, and Salinity of a Typical Desert Plant (Haloxylon ammodendron) in an Arid Oasis of Northwest China" Sustainability 13, no. 4: 1908. https://doi.org/10.3390/su13041908