Abstract
Owing to the development of nanotechnology, biosynthesis of nanoparticles (NPs) is gaining considerable attention as a cost-effective and eco-friendly approach that minimizes the effects of toxic chemicals used in NP fabrication. The present work reports low-cost phytofabrication of zinc oxide (ZnO) NPs employing aqueous extracts of various parts (leaves, stems, and inflorescences) of Tephrosia purpurea (T. purpurea). The formation, structure, morphology, and other physicochemical properties of ZnO NPs were characterized by ultraviolet–visible (UV–Vis) spectroscopy, X-ray diffraction (XRD), scanning electron microscopy (SEM), transmission electron microscopy (TEM), Fourier transform infrared (FTIR) spectroscopy, and dynamic light scattering (DLS). UV–Vis spectral analysis revealed sharp surface plasmon resonance (SPR) at around 250–280 nm, while the XRD patterns confirmed distinctive peaks indices to the crystalline planes of hexagonal wurtzite ZnO NPs. TEM analysis confirmed the presence of spherical-shaped ZnO NPs with average particle sizes (PS) between 25–35 nm, which was in agreement with the XRD results. FTIR analysis revealed that phenolics, flavonoids, amides, alkaloids, and amines present in the plant extract are responsible for the stabilization of the ZnO NPs. Further, the hydrodynamic diameter in the range of 85–150 nm was measured using the DLS technique. The fluorescence resonance energy transfer (FRET) ability of biogenic ZnO NPs was evaluated, and the highest efficiency was found in ZnO NPs synthesized via T. purpurea inflorescences extract. Photoluminescence (PL) spectra of biogenic ZnO NPs showed three emission peaks consisting of a UV–Vis region with high-intensity compared to that of chemically synthesized ZnO NPs. The biosynthesized ZnO NPs showed photocatalytic activity under solar irradiation by enhancing the degradation rate of methylene blue (MB). Among the prepared biogenic ZnO NPs, T. purpurea leaves mediated with NPs acted as the most effective photocatalyst, with a maximum degradation efficiency of 98.86% and a half-life of 84.7 min. This is the first report related to the synthesis of multifunctional ZnO NPs using T. purpurea, with interesting characteristics for various potential applications in the future.
1. Introduction
Nowadays, nanotechnology and nanoscience have gained fascinating meticulous research interest in the areas of physics, chemistry, engineering, and biology. In the domain of nanotechnology, oxide nanoparticles (NPs) have gained importance due to their unique chemical properties, reduced particle size, and high density of corner or edge surface sites [1,2]. In recent years, semiconductor metal oxides NPs (MONPs) play a significant role in material science, that is, the fabrication of novel microelectronic circuits, piezoelectric devices, gas sensors, coatings, fuel cells, transparent conductors, biomedical devices, and catalysts [3,4,5,6,7]. Further, MONPs are preferred as sorbents for wastewater treatment containing pigments or dyes over the conventional purification methods, such as flocculation, filtration, precipitation, incineration, bio-treatment, ozonation, chemical coagulation, chemical oxidation, and adsorption processes based on solid adsorbents [2,5,8]. MONPs display several advantages owing to their environmental feasibility, extreme photocatalytic activity, simplicity of production, dye degradation process, leading to non-toxic end products without affecting medium parameters such as pH, salt ions content, and temperature [8,9,10].
Among MONPs, ZnO NPs are versatile n-type semiconductors, which have high electron mobility, a direct wide bandgap of 3.37 eV, large exciton binding energy of 60 meV at room temperature (RT), and display high optical transparency and luminescent properties in the near UV–Vis regions [3,9,10,11]. Due to these properties, ZnO NPs is one of the most promising materials with diverse areas of application in developing piezo-electronics and optoelectronic devices [2,12,13,14,15,16]. Several different physical and chemical methodologies, such as hydrothermal, sonochemical, sol-gel, solvothermal, microemulsion, laser ablation, homogeneous precipitation, thermal decomposition, and microwave irradiation, were developed to synthesize ZnO NPs with different morphologies [9,17,18,19,20,21,22]. However, these physio-chemical methods require expensive and toxic chemicals as capping agents, hazardous organic solvents, long reflux time of reaction, and toxic byproducts, subsequently leading to eco-toxicity [8,23,24,25]. Nowadays, biomimetic approaches using various biological resources (e.g., plants, bacteria, algae, actinomycetes, viruses, and fungi) emerge as a promising sector for NP fabrication [23,25,26]. Among the various bio-organisms, plants seem to be the best candidates due to their easy availability, low cost, low toxicity, richness in biomolecules, and their simple and reliable capacity for large-scale eco-friendly synthesis of stable, controlled size and shape NPs [8,24,27]. Even though an accepted mechanism has not been explored for the biological synthesis of ZnO NPs, the phytochemicals and proteins present in the plant extracts are considered as capping agents and stabilize the formation of NPs via electrostatic and steric interactions [8,26,27].
Herein, we report, for the first time, facile green synthesis of ZnO NPs via leaves, stems, and inflorescences extracts of T. purpurea. There are about four hundred species of genus Tephrosia distributed throughout the tropical regions of the world [28,29]. Most of the Tephrosia species are highly branched, sub-erect, a herbaceous perennial herb, and are grown like weeds [28]. T. purpurea, also known as Kathurupila, is an important native plant of the Sri Lankan indigenous medicinal system. Traditionally, this plant is mainly used to cure several types of external wounds and gastro-duodenal disorders [28].
It is also used as an anthelmintic and a remedy for asthma, diarrhea, liver disorders, gonorrhea, allergic and inflammatory conditions, hepatitis, rheumatism, ulcers, urinary disorders, bilious febrile attacks, boils, pimples, bleeding piles, fish poison, pain, inflammation, and vomiting-like symptoms [28,29,30,31]. Further, it exhibits insect repellant, larvicidal, piscicidal, antimicrobial, anticancer, and antioxidant properties [28,32]. The main phytochemicals of T. purpurea were found to be tephrosin, isoflavone, 4,5-dihydroxy-3,7-dimethoxyisoflavone, chalcone, tephropurpurin, pongamol, karanjin, lanceolatin B, glycosides (e.g., rutin and quercetin), retenoids (e.g., deguelin, elliptone, and rotenone tephrosin), flavonoids (e.g., purpurin, purpurenone, purpureamethide, and purpuritenin), sterols (e.g., sitosterol), and several fatty acids (e.g., linoleic, oleic, palmitic, stearic, and linolenic acids) [28,30,33]. Though T. purpurea is enriched with high medicinal properties, it is not properly utilized, and thus, this study explores the pharmacological and environmental actions of T. purpurea> through ZnO NPs, providing economic value to the plant with regards to its utility.
Luminescence is one of the fastest-growing, most sensitive, and non-destructive techniques that helps to explain point defects, including extrinsic and intrinsic defects of ZnO NPs [3,13]. In addition, ZnO NPs are being applied as bright fluorescent markers with enhanced photostability in fluorescence microscopy, sensor technology, and microarrays, due to their interaction of fluorophores that leads to various spectral changes, such as enhancement of luminescence intensity, photostability, and quantum yield [13,14]. Fluorescence resonance energy transfer (FRET) is a nonradiative quantum mechanical process that relies on the distance and energy transfer from an excited state donor to a ground state acceptor through dipole–dipole interactions [4,14,34]; it is widely used in polymer science, biochemistry, and structural biology [14,34,35]. The energy transfer between quantum dots has been investigated broadly to design FRET sensors [36,37]. To the best of our knowledge, the present study remains the first attempt to evaluate the efficacy of FRET by ZnO NPs phytosynthesized via T. purpurea. The optical properties of fluorescent molecules located near MONPs are affected by the surface plasmon resonance (SPR) effect [35,38]. Adding MONPs to a dye solution may either cause an enhancement or quenching of the fluorescence, depending on the distance between the dye molecules and the MO surface [4,14,35].
Nowadays, dyes and pigments are the most significant pollutants, and even minimal concentration can cause substantial harm in the aquatic ecosystem, changing the physical properties of water, the activity of photosynthetic processes, the aqueous solubility of gases, and sunlight access [8,39]. Among industrial dyes, methylene blue (MB) is one of the most utilized dyes in many manufactured products (e.g., plastics, textile, papers) and toxicology studies, and is an indicator in clinical medicine, and antidote for methemoglobinemia [9,39,40]. Nonetheless, MB is a hazardous material that causes many dangerous effects, such as eye irritation, nausea, anemia, and vomiting [9]. Thus, treatment of MB-contaminated water is quite important. Hence, the present study was focused on evaluating the photocatalytic degradation proficiency of MB in the presence of ZnO nanocatalysts. During the photocatalytic degradation process, when a photocatalyst is exposed to sunlight, which contains stronger energy than its bandgap energy, the electron–hole pair generated on the surface of NPs diffuses out to the surface and partakes in the chemical reaction with the electron acceptor and donor [2,9,39]. Thus, ZnO NPs behave like a smart tool, providing a fast, economical, and eco-friendly solution to treat polluted water, and controlling the removal of organic spices at interfaces [9,10,40].
To the best of our knowledge, this is the first study reporting the biosynthesis and characterizations of ZnO NPs using aqueous extracts of the leaves, stems, and inflorescences of T. purpurea. Furthermore, we assessed FRET, photoluminescence (PL), and photocatalytic activities of ZnO NPs for sustainable environmental remediation.
2. Materials and Methods
2.1. Chemicals and Reagents
Zinc acetate dihydrate (Anala R grade), and fluorescein were purchased from Sigma-Aldrich, Mumbai, India. Sodium hydroxide pellet (Anala R grade), hydrochloric acid (Anala R grade), and methylene blue were purchased from Sisco research laboratories (Pvt) Ltd., New Mumbai, India. Nylosan rhodamin E-BP300 was purchased from Prym Intimates Lanka (Pvt) Ltd., Biyagama, Sri Lanka. Methanol (Anala R grade) was obtained from BDH Industries Ltd., Mumbai, India.
2.2. Instruments
The following equipment was used in our study: analytical balance (RADWAG Wagi Electroniczne, AS-220. R2, Poland), pH meter (Jenway, 3510, UK), advance vortex mixture (VELP Scientifica ZX3, Italy), centrifuge (GEMMYCO, PLC-036H, China), oven (universal oven-UN 55, Germany), UV–Vis spectrophotometer (U-2910– Hitachi, Tokyo, Japan), FTIR spectrometer (Horizon ABB-MB 3000 ATR FT-IR, Canada), spectrofluorometer (F-2700 FL Hitachi, Tokyo, Japan), SEM (Carl Zeiss, Evo, USA), TEM (Hitachi H-600, Tokyo, Japan), particle size analyzer (Malvern NanoZS90, USA), and XRD (Bruker D8 Advance, Tokyo, Japan).
2.3. Sample Collection and Preparation of Extracts
T. purpurea was collected from local agricultural lands of the Anuradhapura district, Sri Lanka. A sample of plant material was taxonomically identified and authenticated by the National Herbarium, Peradeniya, Sri Lanka.
Healthy plants were marked, and leaves (TPL), stems (TPS), and inflorescences (TPF) were collected, washed thoroughly with running water, and subsequently with deionized water (DI H2O). The plant parts were dried at room temperature (RT) in shade for 14 days and then pulverized using a blender; the powder was then stored in an airtight container at RT. The extracts were prepared by placing 5 g of the finely ground plant material in a flask containing 100 mL of DI H2O, and the solution was heated to 40 ℃, with constant stirring for 30 min. The resulting extracts were cooled to RT and filtered using Whatman No.1 filter paper to separate the plant material from the aqueous extract. The collected extract was then stored in a refrigerator for further experiments.
2.4. Phytogenic Synthesis of ZnO NPs
The experimental parameters, such as the concentration of [Zn(CH3COO)2].2H2O (0.01 M–0.05 M), the volume of plant extract (0.5 mL–3 mL), the pH (9–13), temperature (50 ℃–100 ℃), and reaction time (0.5–3 h), were optimized for the biogenic synthesis of ZnO NPs. For the identified optimum conditions, the following synthesis procedure was carried out at RT.
[Zn(CH3COO)2].2H2O (0.01 M) was first prepared in 50 mL of DI H2O under constant stirring for 10 min, followed by the addition of 1 mL of TPL extract. The pH was then adjusted to 12 by introducing a 2 M sodium hydroxide, which resulted in a pale white solution. The mixture was subjected to vigorous stirring for 2 h and then centrifuged at 4500 rpm for 15 min. The collected pellets were washed with DI H2O, followed by methanol (MeOH) until the supernatant appeared colorless. The residue was oven-dried at 60 ℃ for 12 h, and the obtained ZnO NPs were preserved in airtight vials for further studies. The synthesis of NPs was repeated by varying the concentrations of [Zn(CH3COO)2].2H2O for the TPS and TPF extracts. ZnO NPs synthesized via T. purpurea leaves, stems, and inflorescences were denoted as ZnO NPs/TPL, ZnO NPs/TPS, and ZnO NPs/TPF, respectively.
2.5. Characterization of the Phytogenic ZnO NPs
UV–Vis spectroscopy was used to observe the optical properties of ZnO NPs in the range of 200 nm to 800 nm. The phase purity, crystalline size, and shape were characterized by XRD. The morphological features, such as size (particle diameter) and shape of the biosynthesized NPs, were analyzed using SEM and TEM. FTIR was used to identity phytochemical constituents present in the plant extracts and the synthesized ZnO NPs using the technique of Attenuated Total Reflectance in the range of 400–4000 cm−1. Hydrodynamic diameter, size distribution, and polydispersity index (PDI) were measured as a function of time using dynamic light scattering (DLS).
2.6. FRET Activity of the Phytosynthesized ZnO NPs
The FRET ability exerted by the ZnO NPs in the presence of fluorescein (Flu) and rhodamine B (RhB) dyes was evaluated by fluorescence spectrometry. A concentration series of 50 μg mL−1 to 600 μg mL−1 in MeOH was prepared for ZnO NPs synthesized from all three plant parts. A Flu solution () and a RhB solution () were prepared in MeOH, and equal volumes (400 µL each) of Flu and RhB were mixed with 1000 µL of ZnO NPs, making the final volume 1800 µL. The treated solutions were mixed by vortexing, and then the fluorescence spectra were recorded, while the emission wavelengths were scanned from 450 nm to 700 nm at a fixed excitation of 430 nm.
2.7. PL of the Phytosynthesized ZnO NPs
Using a thin-film solid sample, RT-photoluminescence (RT-PL) analysis was carried out for biogenic ZnO NPs by spectrofluorometer. The light intensity over the cell surface was changed by varying the slit length. The PL of the biogenic ZnO NPs was compared to the sample of chemically synthesized ZnO NPs, following the procedure of previously published works [2,13,41], and with appropriate modifications for chemically synthesized ZnO NPs [42].
2.8. Photocatalytic Activity of Phytosynthesized ZnO NPs
The photocatalytic activity of the phytosynthesized ZnO NPs was evaluated by the degradation of MB under direct sunlight. In a typical process, 20 mg ZnO NPs were added into a beaker containing 50 mL of MB dye solution (5 mg L−1), and the pH was adjusted to 6. Prior to exposure to sunlight, the suspension was magnetically stirred in the dark for 30 min. A control was kept to monitor the activity in the absence of NPs. Degradation of the MB was monitored by withdrawing 5 mL aliquots from the reaction mixture at every 15-min interval. It was then centrifuged to remove all nanocatalysts from the solution, and the absorbance at 662.8 nm was measured by using a UV–Vis spectrophotometer to assess the rate of percentage degradation. The same experimental procedure was repeated with varying different experimental parameters, such as the catalytic load (10, 15, 20, and 25 mg), the concentration of dye (5, 10, and 15 ppm), and pH of the reaction mixture (2, 4, 6, 8, and 10).
3. Results and Discussion
3.1. Synthesis and UV–Vis Spectroscopy
Semiconductor NPs are of great interest due to their ability to demonstrate optical properties in contrast to the bulk materials that arise due to the SPR [43,44]. The nature of the plant extract, its concentration, the concentration of the metal salt, the pH, temperature, and reaction time (incubation time) have been identified as crucial factors for the biosynthesis of MONPs [23,45]. Optimization of these critical parameters could affect the rate of formation and morphological characteristics of the NPs [10,23,45]. The crucial parameters for optimal green synthesis of ZnO NPs have been determined as 0.01 M, 0.02 M, and 0.03 M [Zn(CH3COO)2].2H2O for the NPs synthesized via TPL, TPF, and TPS, respectively. For all NPs, optimum plant extract volume, pH of the reaction mixture, drying temperature, and stirring time were commonly identified as 1 mL, pH 12, 60 °C, and 2 h, respectively. The ZnO NPs synthesized at these optimum conditions exhibited a sharp peak in the range of 350–380 nm, which is in agreement with previous studies [8,23,46].
UV–Vis spectroscopy was used as the preliminary identification method for the formation of ZnO NPs and to characterize optical properties [8,10,23,39]. For this process, pale white NPs obtained from each part of the plant (i.e., TPL, TPS, and TPF) were suspended in DI H2O, and spectrum scans were performed in the range of 200–800 nm. As shown in Figure 1, the optimum λmax values corresponding to the absorption peaks of ZnO NPs/TPL, ZnO NPs/TPS, and ZnO NPs/TPF were observed at 370 nm, 367 nm, and 363 nm, respectively. Previous studies showed that the absorption spectra of ZnO NPs generally depend on the parameters, such as size, shape, and temperature [6,10,23,46]. With the decrease in average particle size (PS), their resonance absorption peak showed a hypsochromic shift and vice versa [2,6]. In this study, the sharp hypsochromic-shifted absorption peaks obtained confirmed the formation of nanoscale ZnO.
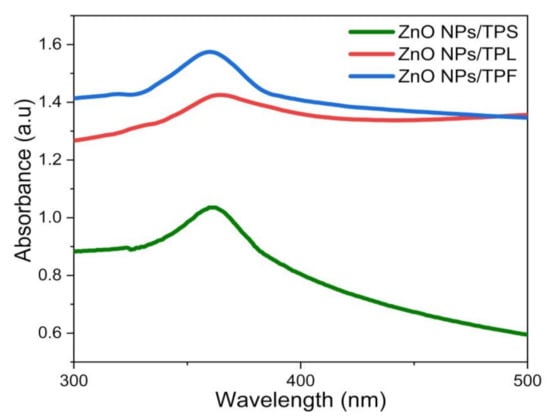
Figure 1.
UV-Vis absorbance spectra obtained for the phytosynthesized ZnO nanoparticles (NPs) at optimized conditions.
3.2. XRD Analysis
The crystallinity and crystal phase structures of the ZnO NPs synthesized using each part of T. purpurea extracts were characterized by XRD analysis, as shown in Figure 2. XRD patterns of NPs showed the diffraction peaks correspond to Bragg reflections with 2θ values at 31.75, 34.39, 36.19, 47.57, 56.58, 62.83, 66.28, 67.88, 69.01, 72.47, and 76.81 and all peaks of the (100), (002), (101), (102), (110), (103), (200), (112), (201), (004), and (202) can be well indexed to hexagonal wurtzite structure. These are in good agreement with the International Center for Diffraction Data (ICDD, Card no. 89-1397), and previous studies on ZnO NPs [2,9,39,46]. Moreover, well-defined, high intense, narrow peaks reflected the high crystallinity of ZnO NPs, and the presence of high intense (100), (002), and (101) planes confirmed the pure wurtzite structure [10,40]. The average crystallite size (D) was calculated using Debye–Scherrer’s formula: D = Kλ/(β cos θ), where D represents the crystal size; λ denotes the wavelength of the X-ray radiation for CuKα; K is the Scherrer constant, θ defines the Bragg diffraction angle, and β stands for the full-width half-maximum (FWHM).
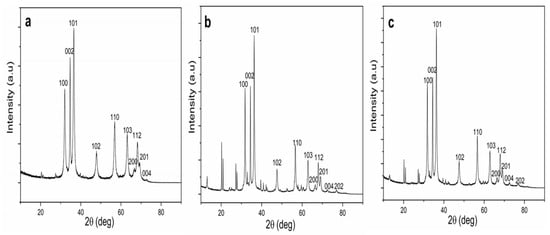
Figure 2.
XRD patterns of biosynthesized ZnO NPs. (a) ZnO NPs/TPL; (b) ZnO NPs/stems (TPS); (c) ZnO NPs/ inflorescences (TPF).
The average crystallite size of 27.35 nm was obtained for ZnO NPs/TPL, corresponding to peak (101) (Table 1). Moreover, the average crystallite size of 25.01 nm and 34.52 nm were obtained for ZnO NPs/TPS and ZnO NPs/TPF, respectively (refer to the Supplementary document).

Table 1.
Crystal size calculated for ZnO NPs/leaves (TPL) using Debye–Scherrer’s formula.
3.3. Surface Morphological Analysis
The identification of physicochemical properties of the NPs, such as size, shape, surface roughness, agglomeration, and aggregation state, is important, as they play a vital role in optoelectrical, biomedical, environmental applications, as well as for the purpose of minimizing toxicity and biological fate [20,47]. The analysis was carried out in different magnitudes (15,000, 25,000, and 50,000) at 10,000 kV, and the obtained SEM micrographs of phytosynthesized ZnO NPs at 25,000 are shown in Figure 3 (SD in Figure 1, Figure 2 and Figure 3 for 15,000 and 50,000). Topographical images displayed flower-like ZnO NPs/TPL composed of clusters of individual nanocrystals with a roughly spherical shape (Figure 3a), while the quasi-spherical shape was prominent for ZnO NPs/TPS (Figure 3b) and ZnO NPs/TPF (Figure 3c). ZnO NPs/TPL shows different surface morphology compared to that of ZnO NPs synthesized from TPS and TPF, and this may be due to the amount and types of biomolecules present in the plant extracts. SEM depicted both individual and some aggregate NPs with a consistent average size of 85–89 nm, precisely 87.5 ± 14.45 nm in ZnO NPs/TPL, 85.43 ± 7.11 nm in ZnO NPs/TPS, and 88.14 ± 9.15 nm in ZnO NPs/TPF.
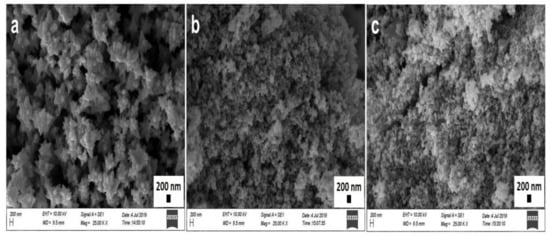
Figure 3.
SEM micrographs of ZnO NPs (magnification: 25×, scale bar: 200 nm). (a) ZnO NPs/TPL; (b) ZnO NPs/TPS; (c) ZnO NPs/TPF.
SEM images of biomimetically synthesized ZnO NPs obtained from T. purpurea extract proved that the NPs are smaller than those reported previously [48].
As a complementary technique, TEM analysis was performed to identify the morphology, nature, and size of the phytosynthesized ZnO NPs. TEM micrographs revealed that all the phytosynthesized NPs were spherical-shaped, falling within the nano range (Figure 4). The previous studies suggest that the high annealing temperatures (100–500 °C) exert an effect on crystal growth, loss of bioactive compounds (stabilizers), and transform the shape of the NPs [6,8,46]. Wherein a moderate temperature of 60 °C was selected as the drying temperature, protected surface-adhered phytochemicals resulted in the formation of well-distributed NPs without aggregation (Figure 4) [49]. The average particle diameter of ZnO NPs varied from 26 nm to 35 nm and was found to be 27.23 ± 14.04 nm (ZnO NPs/TPL), 26.64 ± 6.22 nm (ZnO NPs/TPS), and 34.58 ± 10.8 nm (ZnO NPs/TPF). The crystallinity and the PS determined for all the samples by TEM are in good agreement with the XRD results.
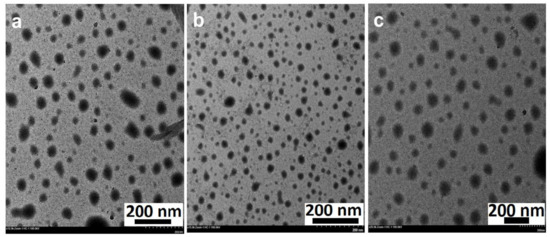
Figure 4.
TEM images of ZnO NPs (magnification: 20×, scale bar: 200 nm). (a) ZnO NPs/TPL; (b) ZnO NPs/TPS; (c) ZnO NPs/TPF.
3.4. FTIR Spectroscopic Analysis
To identify the surface-adhered functional groups present in the NPs, FTIR spectroscopy was performed and the resulting spectra are depicted in Figure 5. Substance-specific IR vibrations of the molecules led to specific signals in the range of 400–4000 cm−1. The low-intensity IR peaks observed in the ZnO NPs may be due to the removal of surface-adhered phytochemicals in the washing step with MeOH. Consistently, prominent peaks in all spectra from plant extracts were observed in the wavelength ranges of 3200–3350 cm−1, 1550–1650 cm−1, and 500–600 cm−1, which are attributed to –OH, C = O or C = C, and C–Br stretching, respectively. The peak at 2100–2260 cm−1 appeared only in the TPS extract, which corresponds to C C vibration. All the phytosynthesized NPs exhibit prominent peaks in the ranges of 3200–3300 cm−1, 2850–3000 cm−1, 2100–2260 cm−1, and 800–1000 cm−1, indicating the presence of –OH stretch, CH alkene stretch, C C stretch, and =CH bending, respectively. As per the published literature, the Zn-O peak that appears within the range of 500–600 cm−1 indicates the presence of hexagonal wurtzite ZnO NPs [20,46,50,51], confirming our previous observations by XRD analysis.
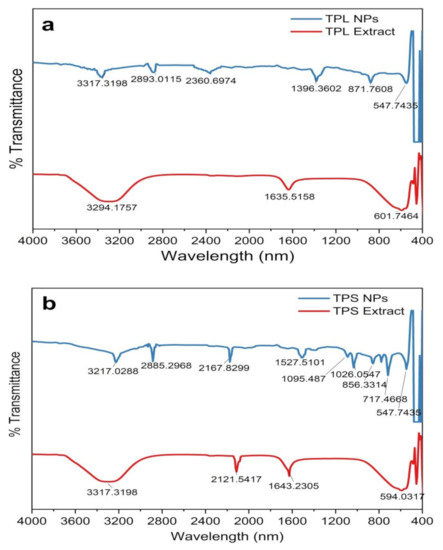
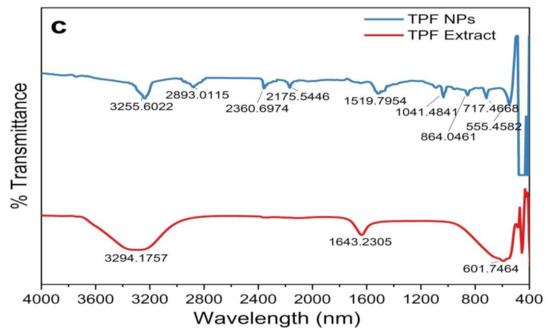
Figure 5.
FTIR spectrogram of plant parts and synthesized ZnO NPs. (a) ZnO NPs/TPL; (b) ZnO NPs/TPS; (c) ZnO NPs/TPF.
ZnO NPs/TPS and ZnO NPs/TPF showed miniature peaks in the ranges of 1500–1650 cm−1, 1000–1200 cm−1, 1000–1100 cm−1, and 650–750 cm−1, corresponding to the symmetric stretching of the carbonyl side groups in the amino acid residues of the protein molecules, the CN stretch of aliphatic amines, alkanes, and supposedly, the CH bend in alkynes, respectively. The peak at 1350–1400 cm−1 is assigned to CH bending in the −CH2 group found only in ZnO NPs/TPF. The IR bands rationalize that the aqueous extract of T. purpurea is rich in phenolic compounds, saponins, flavonoids, amide, tannins, alkaloids, and amines. Thus, the involvement of these secondary metabolites as capping agents induced NP stabilization, thus aiding the formation of ZnO NPs [8,23,48,49].
3.5. DLS Analysis
The variation in PS could be attributed to the polydisperse nature of NPs. The PDI represents the degree of ‘‘non-uniformity” of the distribution and is related to the existence of NPs as aggregates or agglomerates, causing variability in the calculated PS in comparison with the theoretical size [23]. DLS is an emerging non-invasive technique that is extensively used to determine the PS and the PS distribution of NPs. The PS was calculated by the hydrodynamic diameter based on Brownian movements exhibited by the particles. The average hydrodynamic diameter was in the range of 85–150 nm, which is quite larger than the theoretical size reported by XRD and TEM (Figure 6). The average PS was found to be 140.19 nm (PDI = 0.213) in ZnO NPs/TPL, 147.63 nm (PDI = 0.192) in ZnO NPs/TPS, and 141.62 nm (PDI = 0.2) in ZnO NPs/TPF.
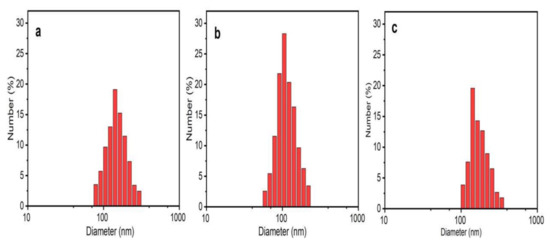
Figure 6.
ZnO NPs size distribution by DLS. (a) ZnO NPs/TPL; (b) ZnO NPs/TPS; (c) ZnO NPs/TPF.
3.6. FRET Ability of Phytosynthesized ZnO NPs
The FRET is a non-radiative quantum mechanical process that strongly depends on distance (1–10 nm between donor–acceptor), where energy transfer occurs from an excited state donor to a ground state acceptor through dipole–dipole interactions [4,14,37]. This process has wide applications in structural biology, detection and visualization of intermolecular association, biomolecular conformations and dynamics, development of intermolecular binding assays, polymer science, and laser dyes [4,14,34,35]. It has been identified that NPs are capable of manipulating the FRET process (donor–acceptor interaction) by increasing the local electrical field surrounding them and manipulating the radiative and non-radiative decay of fluorescent dyes [4]. Hence, the interest in studying FRET in the presence of NPs has increased, and several studies have reported the usage of ZnO NPs as an energy donor or to control the energy transfer process [14]. It has been shown that the spectral overlap integral, the orientation of transition dipole moment of the donor and acceptor, fluorescence lifetime, size and shape of the NPs, radiative decay rate, and quantum yield of the donor molecule affect the strength of FRET [35,52].
Fluorescence enhancement near the NPs’ surfaces occurred due to interaction with SPR, a decrease in non-radiative decay, an increase in photostability of the dye, and the change in local dielectric properties of the medium [14,35,52]. Thus, to observe a sufficient fluorescence enhancement, the dye molecules should be located at a greater distance (>10 nm) from the metal surface [52]. Moreover, the size and morphology alter the energy band gap of the NPs, which in turn affect the spectral characteristics and FRET efficiency [4]. However, the exact mechanism for the enhanced fluorescence intensity of the dyes in the presence of ZnO NPs is yet to be explored.
The present study investigated the FRET between two organic dyes, Flu (donor) and RhB (acceptor), which were prepared in a MeOH solution in the presence and absence of the greenly synthesized ZnO NPs. In FRET studies, Flu and RhB dyes are extensively used, due to their excellent luminescence properties, such as a high absorption coefficient, high photostability, high fluorescence quantum yield, and relatively long emission wavelength [14,38]. Flu and RhB show maximum absorbance at around 475 nm and 525 nm, with the prominent monomer fluorescence bands around 510 nm and 552 nm, respectively [14,38,53,54]. The analysis was carried out at a fixed excitation wavelength of 430 nm, which was chosen to direct excited Flu, avoiding the emission and absorption spectral overlap of Flu and RhB. Further, at this wavelength, ZnO NPs show negligible fluorescence, which does not affect FRET parameters between Flu and RhB. To obtain a solid understanding of FRET, fluorescence emission was recorded for Flu, RhB, and the Flu–RhB mixture in the presence of ZnO NPs (i.e., ZnO NPs/TPL, ZnO NPs/TPS, and ZnO NPs/TPF), and compared with their controls (pure dyes without NPs). Interestingly, it has been noted that the significant fluorescence enhancement of Flu occurred in the presence of ZnO NPs (Figure 7a), whereas RhB fluorescence enhancement was almost insignificant (Figure 7b).
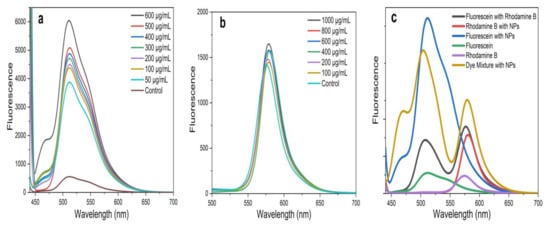
Figure 7.
(a) Fluorescence spectrum of fluorescein (Flu) with ZnO NPs/TPS; (b) fluorescence spectrum of rhodamine B (RhB) with ZnO NPs/TPS; (c) variation of fluorescence emission intensity of Flu and/or RhB in the presence and absence of ZnO NPs/TPS (500 µg/mL) at an excitation wavelength of 430 nm.
According to the literature, fluorescence enhancement of Flu is due to the interaction caused by Zn2+ ions in the ZnO matrix with a carbonyl group present in Flu [14,55]. These interactions reduce the energy of the conduction band and increase the energy of the valence band of Flu, thus increasing the excitation rate of the fluorophores, leading to fluorescence enhancement [55]. A similar effect cannot be observed with RhB due to the absence of carbonyl groups, and, at 430 nm excitation, RhB showing negligible absorption [14]. However, when compared to their pure counterparts, the fluorescence spectrum of the Flu–RhB mixed solution (Figure 7c) showed that the fluorescence intensity of Flu decreased when RhB increased. Also, a sufficient fluorescence spectral overlap of Flu and/or RhB with and without TPS-mediated NPs at 500 µg/mL concentration is depicted in Figure 7c. This increase in RhB fluorescence was due to the light absorption by Flu molecules, which did transfer the energy to RhB via FRET. It has been observed that biogenic ZnO NPs act as energy donors and manipulate energy transfer processes by enhancing FRET efficiency. Interestingly, with the increase in the concentration of ZnO NPs, the FRET efficiency increased between Flu and RhB.
The FRET efficiency was calculated by using the following formula: E = 1 − (FAD/FD) × 100% (at 600 µg/mL of NPs) [14,34,56], where FDA is the relative fluorescence intensity of the donor in the presence of the acceptor and FD is the fluorescence intensity of the donor in the absence of the acceptor. A FRET efficiency of 77.45% was found for ZnO NPs/TPF, while 41.32% and 26.33% were observed for ZnO NPs/TPS, and ZnO NPs/TPL, respectively (Figure 8).
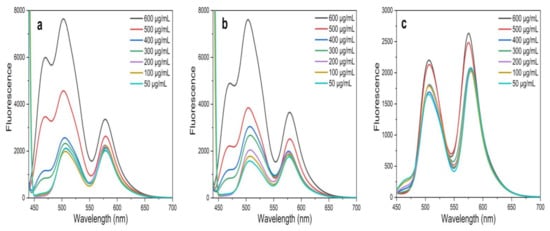
Figure 8.
FRET spectra in the presence of Flu–RhB at an excitation wavelength of 430 nm. (a) ZnO NPs/TPL; (b) ZnO NPs/TPS; (c) ZnO NPs/TPF.
3.7. PL Activity of Synthesized ZnO NPs
The optoelectronic properties of semiconductor NPs like ZnO NPs have gained tremendous interest in recent years, and the photoconductivity of these NPs arises due to the photogeneration of electron–hole pairs after the absorption of photons [13]. Besides, ZnO NP properties are strongly affected by extrinsic and intrinsic defects and impurities [3,13]. PL spectroscopy was used to identify the efficiency of the charge carrier separation and point defects in ZnO NPs, such as oxygen vacancies (Vo), oxygen interstitials (Oi), zinc vacancies (VZn), zinc interstitials (Zni), and oxygen antisites in ZnO NPs [3,13].
Figure 9 illustrates the RT-PL emission spectrum of ZnO NPs/TPL, ZnO NPs/TPS, and ZnO NPs/TPF in comparison with chemically synthesized ZnO NPs, at the excitation wavelength of 295 nm. Previous studies revealed that PL emission depends on the excitation wavelength [11,57]. Interestingly, our data revealed that the maximum PL intensity can be achieved only when the excitation wavelength is at 295 nm and a wavelength above or below this value causes changes in the position of the peaks. Indeed, at this excitation, all the ZnO samples exhibited band edge emission at 392 nm in the UV region and deep trap state emission related to blue emission at 453 nm and yellow emission at 597 nm in the visible region (Figure 10). Generally, the less intense and broad peaks found at 392 nm are attributed to the free recombination of excitons that originated from the localized level slightly below the conduction band to the valence band, due to the electron transition [3,12,58]. Besides, peaks that appeared at around 453 nm were related to intrinsic surface defects of ZnO nanostructures originating from the zinc interstitials and/or oxygen vacancies and may have been due to singly ionized chargers located at ~0.21 eV above the valence band [3,20,58]. Studies reported that the apparition of electron capture on the surfaces of NPs causes quenching of blue emission [12]. However, the detailed mechanism for blue emission at 453 nm has not yet been explored.
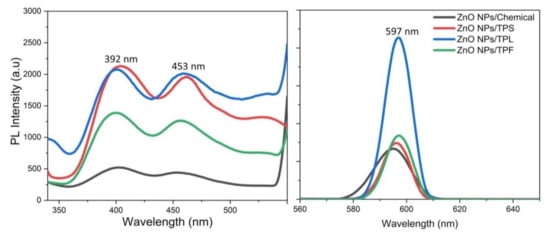
Figure 9.
Photoluminescence (PL) spectrums of ZnO NPs recorded with the excitation wavelength of 295 nm.
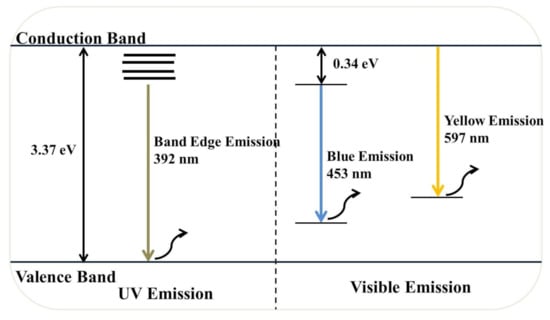
Figure 10.
Schematic illustration of the phytogenic ZnO NP-mediated PL mechanism.
Eventually, the third major emission edge was observed at 592 nm, attributing to pure yellow emission. Thus, the sharp emission resulted from the recombination of photogenerated holes in oxygen interstitial with singly ionized charge/delocalized electrons of intrinsic defects of oxygen vacancies and zinc interstitials [2,20]. The green emission reported by many authors at 524 nm was not observed in this study [3,58,59]. The absence of green emission implies that synthesized NPs are highly pure and free of contaminants, confirming the obtained XRD results. Moreover, the reduction of Zn2+ ions did not occur in the synthesis process, and green synthesis carried out in the absence of a reducing atmosphere inhibits the presence of oxygen vacancies, thereby quenching the green emission. Taken together, the obtained results revealed higher PL intensity for all biogenic ZnO NPs, compared to that of the chemically synthesized.
3.8. Photocatalytic Activity of Phytosynthesized ZnO NPs
Recently, various studies reported the catalytic effect of bio-fabricated ZnO NPs in the degradation of organic pollutants [8,39,40]. Interestingly, nanosized ZnO acts as an effective photocatalyst for the degradation of dye contaminants in water under UV light and/or sunlight [2,5,60]. The particle size, shape, phase composition, surface area, surface hydroxyl group density, and bandgap of the photocatalyst are considered as major factors that affect the efficiency of photodegradation [5,8]. Hence, the present study was carried out by utilizing phytofabricated ZnO NPs/TPL, ZnO NPs/TPS, and ZnO NPs/TPF for the degradation of MB under solar irradiation.
The simplest mechanism of MB photodegradation in the presence of phytosynthesized ZnO NPs has been clarified in this study (Figure 11). Thereby, under irradiation, photo-induced molecular reactions take place at the surface of the nanocatalyst. ZnO NPs absorbed photon energy equal to or higher than the bandgap energy to create holes (h+) in the valence band and the electrons (e−) in the conduction band. The free holes oxidized neighboring H2O molecules into hydroxyl radicals (•OH), while the electron in the conduction band lessened the O2 adsorption by converting O2 into superoxide radicals (O2•−). These species act as strong oxidizing agents that are highly reactive and oxidize MB to CO2, H2O, and inorganic acids [5,9,40].
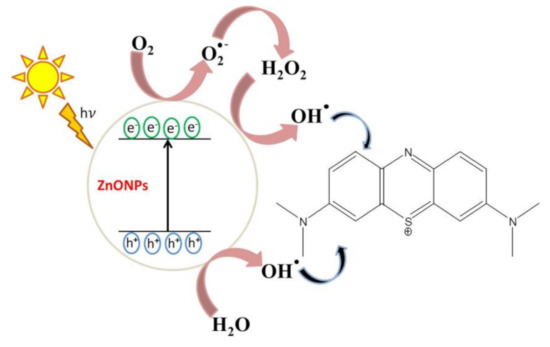
Figure 11.
Proposed photocatalytic reaction mechanism of phytosynthesized ZnO NPs.
Photocatalytic activity of ZnO NPs mainly depends on the amount of the catalyst, the initial concentration of MB dye, and the pH of the reaction mixture [39,40,61]. The results obtained for ZnO NPs/TPL (Figure 12a–c) are elaborately discussed here and reflect what was noticed also with ZnO NPs/TPS and ZnO NPs/TPF when tested in the same experimental conditions.
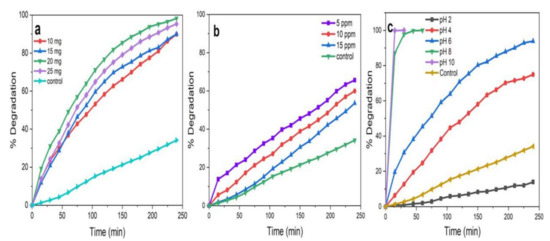
Figure 12.
ZnO NPs/TPL-mediated photocatalytic degradation in various physio-chemical conditions. (a) Catalytic load concentration; (b) methylene blue (MB) concentrations at a fixed catalytic load of 20 mg; (c) pH at a fixed catalytic load of 20 mg and 5 ppm dye concentration.
Figure 12a displays the degradation of MB dye by keeping the concentration of MB constant (5 ppm) and varying the catalytic load (10, 15, 20, and 25 mg) at pH 6. It was revealed that with the increase in catalytic load from 10 to 20 mg, the rate of dye degradation increased by 9%. This is because the availability of active sites of the photocatalyst increased on the surface, making them easily participate in photoactivity [2,9,40]. However, the further increment of photocatalyst concentration (>20 mg), caused the aggregation of NPs, resulting in a decrease in the number of surface active sites and specific surface area. Further, this affected the penetration of light through the medium, leading to poor opacity and scattering of light, resulting in poor degradation [9,10]. Therefore, the catalytic load of 20 mg of the reaction mixture was considered for further studies.
To investigate the maximum concentration of dye for efficient degradation, the reaction mixture was tested at varying concentrations of dye (5, 10, 15 ppm), keeping a constant catalytic load (20 mg) and pH (6) in the presence of sunlight (Figure 12b). The data analysis proved that when the dye concentration increased from 5 to 15 ppm, the photocatalytic degradation was reduced by 12%. Thus, 5 ppm of MB having a catalytic load of 20 mg would be the optimum concentration for further studies. Generally, as the concentration of dye increased, the rate of degradation was decreased by reducing active site densities (•OH) on the surface of the NPs [5,9,10].
The effect of pH on the degradation of dye was assessed by varying pH in the range of 2–10 by maintaining a constant the catalyst load (20 mg) and concentration of dye (5 ppm), as represented in Figure 12c. The results revealed that the degradation of MB was excellent in alkaline pH, with the highest rate of degradation observed at pH 10. This degradation may also be attributed to the instability of the dye in alkaline pH and can be explained based on zero potential charges [62]. Conversely, ZnO NPs tended to dissolve at acidic pH (pH 2 and pH 4), resulting in quite a low degradation efficiency. Therefore, pH 6 was selected, which facilitated monitoring the degradation of MB without self-degrading the MB or dissolving the ZnO NPs.
By using the above-mentioned optimized conditions (20 mg catalyst, 5 ppm MB, and pH 6), the photocatalytic degradation of MB was tested for 240 min under direct sunlight for the mixture without ZnO NPs (control) (Figure 13a), ZnO NPs/TPL (Figure 13b), ZnO NPs/TPS (Figure 13c), ZnO NPs/TPF (Figure 13d). UV–Vis absorbance spectra of the MB treated with any of the biogenic ZnO NPs under sunlight, demonstrated a significant and time-dependent degradation of the MB compared to the control. Moreover, it could be observed that the absorption intensity decreased with time considerably, within the first 30 min in samples, compared to the control.
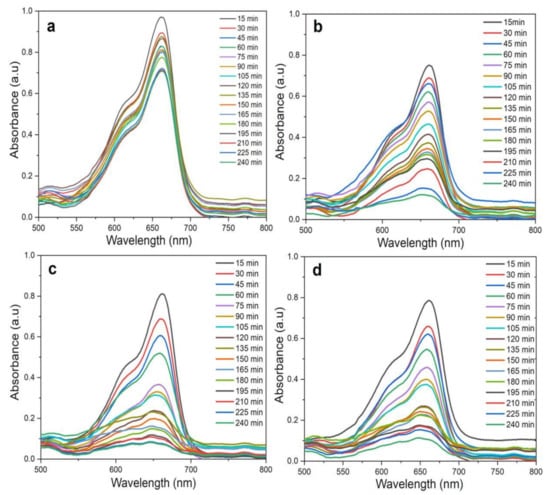
Figure 13.
UV–Vis spectra of MB photodegradation under radiation under optimized conditions (20 mg catalyst, 5 ppm MB, and pH 6, at RT) during a time course period of 240 min. (a) Control (without ZnO NPs); (b) ZnO NPs/TPL; (c) ZnO NPs/TPS; (d) ZnO NPs/TPF.
The half-life of the MB dye degradation by biosynthesized NPs was taken at the crossover point of curves C/Co and [1 − C/Co] × 100% (Figure 14). Degradation efficiency for ZnO NPs/TPL (Figure 14a), ZnO NPs/TPS (Figure 14b), ZnO NPs/TPF (Figure 14c) was measured for the duration of 240 min, and the plots were generated for calculating the half-life and degradation efficiencies.
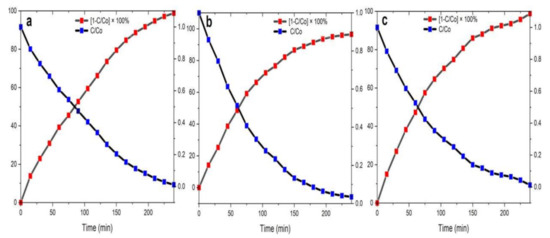
Figure 14.
Half-life of the photocatalytic degradation rate of MB by NPs as the catalyst. (a) ZnO NPs/TPL;(b) ZnO NPs/TPS;(c) ZnO NPs/TPF.
The following equation was used to calculate the degradation efficiency of the MB:
Degradation efficiency (%) = where Co is the initial concentration of MB dye solution (mg L−1) and C is the concentration of the MB dye solution (mg L−1) after a certain time of irradiation.
Importantly, when the MB dye solution was exposed to sunlight for 240 min in the presence of the biosynthesized ZnO NPs, the degradation efficiency of the MB dye reached up to 99%. Indeed, the highest degradation of 98.86% was obtained for ZnO NPs/TPL, with a half-lifetime of 84.7 min, negligibly followed by ZnO NPs/TPS and ZnO NPs/TPF of 98.15% and 95.80%, with half-lifetimes of 52.9 min and 65.1 min, respectively.
Altogether, these data exhibit strong photostability of ZnO NPs synthesized from different parts of the same plant. It was found that small crystallite size enhances the probability of charge recombination outside the barrier region and photodegradation. As per the XRD and TEM analysis, the ZnO NPs/TPS showed the highest surface area, followed by ZnO NPs/TPL and ZnO NPs/TPF. Nevertheless, PL studies revealed that ZnO NPs/TPL exhibit maximum PL effect, which reduced the electron–hole recombination on the surface of the catalyst, subsequently leading to the highest photodegradation effect.
4. Conclusions
To the best of our knowledge, this is the first study using leaves, stem, and inflorescence of the Sri Lankan native medicinal plant T. purpurea to phytofabricate multifunctional ZnO NPs. The freshly made phytogenic ZnO NPs exhibited a hexagonal wurtzite structure with an absorption maximum in the range of 350–380 nm. FTIR analysis showed the presence of surface-adhered phytoconstituents, like flavonols, phenols, alcohol, tannins, and amines, which actively contributed to the stabilization of the ZnO NPs. SEM micrographs produced flower- and spherical-like arrangements of nanocrystals. TEM images confirmed the formation of spherical NPs with an average crystallite size of 25–35 nm. Importantly, FRET activity of the phytogenic ZnO NPs between the two fluorescent dyes, Flu and RhB, was evaluated for the first time. It was found that energy transfer efficiency between the dye molecules increased in the presence of ZnO NPs, and the maximum efficiency of 77.45% was found for the ZnO NPs synthesized via inflorescences extract. PL intensities of phytosynthesized ZnO NPs were higher and asymmetric compared with the chemically synthesized ZnO NPs, which is a valuable finding since luminescence represents a key feature in the development of optoelectric devices. Besides, synthesized ZnO NPs elicited a fascinating photocatalytic degradation of MB, which reduced the electron–hole recombination on the surface of the NPs. The highest photocatalytic performance of 99% was exhibited by ZnO NPs synthesized via leaves extract. Overall, the obtained results showed that greenly synthesized ZnO NPs should be a preferred option compared to chemically synthesized ZnO NPs in many areas encompassing biomedical, environmental, and industrial applications.
Supplementary Materials
The following are available online at https://www.mdpi.com/2071-1050/13/4/2004/s1, Figure S1: SEM Images of obtained for ZnO NPs/TPL at magnitudes of 15,000 and 50,000 at 10 000 kV, Figure S2: SEM Images of obtained for ZnO NPs/TPS at magnitudes of 15,000 and 50,000 at 10,000 kV, Figure S3: SEM Images of obtained for ZnO NPs/TPF at magnitudes of 15,000 and 50,000 at 10,000 kV, Table S1: Crystal size calculated for ZnO NPs/TPS using Debye-Scherrer’s formula, Table S2: Crystal size calculated for ZnO NPs/TPF using Debye-Scherrer’s formula.
Author Contributions
Conceptualization; G.T.; Data curation; G.T., U.W., F.M.; Formal analysis G.T., U.W., F.M.; Funding acquisition G.T.; Investigation G.T., U.W.; Methodology G.T., U.W., H.I., F.M.; Project administration G.T.; Resources G.T.; Software G.T., U.W., H.I.; Supervision G.T.; Validation G.T., F.M.; Visualization G.T.; Roles/Writing—original draft G.T., U.W.; Writing—review & editing G.T., U.W., F.M. All authors have read and agreed to the published version of the manuscript.
Funding
This research was funded by Institute of Chemistry Ceylon, College of Chemical Sciences.
Institutional Review Board Statement
Not Applicable.
Informed Consent Statement
Not applicable.
Data Availability Statement
The data presented on this study are available on request from the corresponding author.
Acknowledgments
College of Chemical Sciences, Institute of Chemistry Ceylon, Sri Lanka, is acknowledged for the continued support.
Conflicts of Interest
The authors declare that they have no conflict of interest.
Submission Declaration and Verification
This study was not pre-registered.
List of Main Abbreviations
| DI H2O | Deionized water |
| DLS | Dynamic light scattering |
| Flu | Fluorescein |
| FRET | Fluorescence resonance energy transfer |
| FTIR | Fourier transform infrared |
| MB | Methylene blue |
| MeOH | Methanol |
| MONPs | Metal oxide nanoparticles |
| NPs | Nanoparticles |
| •OH | Hydroxyl radicals |
| PDI | Polydispersity index |
| PL | Photoluminescence |
| PS | Particle size |
| RhB | Rhodamine B |
| RT | Room temperature |
| SEM | Scanning electron microscopy |
| SPR | Surface plasmon resonance |
| TEM | Transmission electron microscopy |
| T. purpurea | Tephrosia purpurea |
| UV-Vis | Ultraviolet-Visible |
| XRD | X-ray diffraction |
| ZnO | Zinc oxide |
References
- Gnanasekaran, L.; Hemamalini, R.; Saravanan, R.; Ravichandran, K.; Gracia, F.; Agarwal, S.; Gupta, V.K. Synthesis and characterization of metal oxides (CeO2, CuO, NiO, Mn3 O4, SnO2 and ZnO) nanoparticles as photo catalysts for degradation of textile dyes. J. Photochem. Photobiol. B Biol. 2017, 173, 43–49. [Google Scholar] [CrossRef]
- Suresh, D.; Shobharani, R.; Nethravathi, P.; Kumar, M.P.; Nagabhushana, H.; Sharma, S. Artocarpus gomezianus aided green synthesis of ZnO nanoparticles: Luminescence, photocatalytic and antioxidant properties. Spectrochim. Acta Part A Mol. Biomol. Spectrosc. 2015, 141, 128–134. [Google Scholar] [CrossRef]
- Mishra, S.; Srivastava, R.; Prakash, S.; Yadav, R.S.; Panday, A. Photoluminescence and photoconductive characteristics of hydrothermally synthesized ZnO nanoparticles. Opto-Electron. Rev. 2010, 18, 467–473. [Google Scholar] [CrossRef]
- Hahm, J.-I. Zinc Oxide Nanomaterials for Biomedical Fluorescence Detection. J. Nanosci. Nanotechnol. 2014, 14, 475–486. [Google Scholar] [CrossRef] [PubMed]
- Basavalingiah, K.R.; Harishkumar, S.; Udayabhanu; Nagaraju, G.; Rangappa, D. Chikkahanumantharayappa Highly porous, honeycomb like Ag–ZnO nanomaterials for enhanced photocatalytic and photoluminescence studies: Green synthesis using Azadirachta indica gum. SN Appl. Sci. 2019, 1. [Google Scholar] [CrossRef]
- Koshy, J.; Samuel, M.S.; Chandran, A.; George, K.C.; Predeep, P.; Thakur, M.; Varma, M.K.R. Optical Properties of CuO Nanoparticles. AIP Conf. Proc. 2011, 1391, 576–578. [Google Scholar] [CrossRef]
- Jeevanandam, J.; Chan, Y.S.; Danquah, M.K. Biosynthesis of Metal and Metal Oxide Nanoparticles. ChemBioEng Rev. 2016, 3, 55–67. [Google Scholar] [CrossRef]
- Kuruppu, K.A.S.S.; Perera, K.M.K.G.; Chamara, A.M.R.; Thiripuranathar, G. Flower shaped ZnO—NPs; phytofabrication, photocatalytic, fluorescence quenching, and photoluminescence activities. Nano Express 2020, 1, 020020. [Google Scholar] [CrossRef]
- Saleh, S.M. Metal Oxide Nanomaterials as Photo-Catalyst for Dye Degradation. Res. Dev. Mater. Sci. 2019, 9, 1–8. [Google Scholar] [CrossRef]
- Suresh, D.; Nethravathi, P.; Udayabhanu; Rajanaika, H.; Nagabhushana, H.; Sharma, S. Green synthesis of multifunctional zinc oxide (ZnO) nanoparticles using Cassia fistula plant extract and their photodegradative, antioxidant and antibacterial activities. Mater. Sci. Semicond. Process. 2015, 31, 446–454. [Google Scholar] [CrossRef]
- Babu, K.S.; Reddy, A.R.; Sujatha, C.; Reddy, K.V. Optimization of UV emission intensity of ZnO nanoparticles by changing the excitation wavelength. Mater. Lett. 2013, 99, 97–100. [Google Scholar] [CrossRef]
- Giri, P.K.; Bhattacharyya, S.; Singh, D.K.; Kesavamoorthy, R.; Panigrahi, B.K.; Nair, K.G.M. Correlation between microstructure and optical properties of ZnO nanoparticles synthesized by ball milling. J. Appl. Phys. 2007, 102, 093515. [Google Scholar] [CrossRef]
- Talakonda, P.R. Excitation-Intensity (EI) Effect on Photoluminescence of ZnO Materials with Various Morphologies. Lumin. Outlook Phenom. Appl. 2016, 16. [Google Scholar] [CrossRef]
- Saha, J.; Roy, A.D.; Dey, D.; Bhattacharjee, D.; Paul, P.K.; Das, R.; Hussain, S. Effect of Zinc oxide nanoparticle on Fluorescence Resonance Energy transfer between Fluorescein and Rhodamine 6G. Spectrochim. Acta Part A Mol. Biomol. Spectrosc. 2017, 175, 110–116. [Google Scholar] [CrossRef]
- Sabir, S.; Arshad, M.; Chaudhari, S.K. Zinc Oxide Nanoparticles for Revolutionizing Agriculture: Synthesis and Applications. Sci. World J. 2014, 2014, 1–8. [Google Scholar] [CrossRef]
- Kumar, A. Performance analysis of Zinc oxide based alcohol sensors. Int. J. Appl. Sci. Eng. Res. 2015, 4, 427–436. [Google Scholar]
- Solati, E.; Dorranian, D. Effect of temperature on the characteristics of ZnO nanoparticles produced by laser ablation in water. Bull. Mater. Sci. 2016, 39, 1677–1684. [Google Scholar] [CrossRef]
- Kumar, H.; Rani, R. Structural and Optical Characterization of ZnO Nanoparticles Synthesized by Microemulsion Route. Int. Lett. Chem. Phys. Astron. 2013, 19, 26–36. [Google Scholar] [CrossRef]
- Sharma, A.; Singh, B.; Dhar, S.; Gondorf, A.; Spasova, M. Effect of surface groups on the luminescence property of ZnO nanoparticles synthesized by sol–gel route. Surf. Sci. 2012, 606, L13–L17. [Google Scholar] [CrossRef]
- Alamdari, S.; Ghamsari, M.S.; Lee, C.; Han, W.; Park, H.-H.; Tafreshi, M.J.; Afarideh, H.; Ara, M.H.M. Preparation and Characterization of Zinc Oxide Nanoparticles Using Leaf Extract of Sambucus ebulus. Appl. Sci. 2020, 10, 3620. [Google Scholar] [CrossRef]
- Rashad, M.; Shaalan, N.M.; Abd-Elnaiem, A.M. Degradation enhancement of methylene blue on ZnO nanocombs synthesized by thermal evaporation technique. Desalin. Water Treat. 2016, 57, 26267–26273. [Google Scholar] [CrossRef]
- Jin, S.-E.; Jin, H.-E. Synthesis, Characterization, and Three-Dimensional Structure Generation of Zinc Oxide-Based Nanomedicine for Biomedical Applications. Pharmaceutics 2019, 11, 575. [Google Scholar] [CrossRef]
- Jamdagni, P.; Khatri, P.; Rana, J. Green synthesis of zinc oxide nanoparticles using flower extract of Nyctanthes arbor-tristis and their antifungal activity. J. King Saud Univ. Sci. 2018, 30, 168–175. [Google Scholar] [CrossRef]
- Iravani, S. Green synthesis of metal nanoparticles using plants. Green Chem. 2011, 13, 2638–2650. [Google Scholar] [CrossRef]
- Hussain, I.; Singh, N.B.; Singh, A.; Singh, H.; Singh, S.C. Green synthesis of nanoparticles and its potential application. Biotechnol. Lett. 2016, 38, 545–560. [Google Scholar] [CrossRef]
- Shah, M.; Fawcett, D.; Sharma, S.; Tripathy, S.K.; Poinern, G.E.J. Green Synthesis of Metallic Nanoparticles via Biological Entities. Materials 2015, 8, 7278–7308. [Google Scholar] [CrossRef] [PubMed]
- Akhtar, M.S.; Panwar, J.; Yun, Y.-S. Biogenic Synthesis of Metallic Nanoparticles by Plant Extracts. ACS Sustain. Chem. Eng. 2013, 1, 591–602. [Google Scholar] [CrossRef]
- Kalra, S.; Khanna, D. Tephrosia Purpurea—A Magical Herb with Blessings in Human Biological System. Int. J. Recent Adv. Pharm. Res. 2013, 3, 12–22. [Google Scholar]
- Jisha, E.; Balamurugan, G. Biogenic synthesis of Gold Nanoparticles using leaf extract of Tephrosia purpurea and study of their antibacterial effect. Int. J. Pharm. Tech. 2012, 4, 1323–1331. [Google Scholar]
- Lodhi, S.; Jain, A.; Jain, A.P.; Pawar, R.S.; Singhai, A.K. Effects of flavonoids from Martynia annua and Tephrosia purpurea on cutaneous wound healing. Avicenna J. Phytomed. 2016, 6, 578–591. [Google Scholar]
- Patel, A.; Patel, A.; Patel, N.M. Estimation of Flavonoid, Polyphenolic Content and In-Vitro Antioxidant Capacity of leaves of Tephrosia purpurea. Int. J. Pharma. Sci. Res. 2010, 1, 66–77. [Google Scholar]
- Nile, S.H.; Khobragade, C.N. Phytochemical analysis, antioxidant and xanthine oxidase inhibitory activity of Tephrosia purpurea Linn. Root Extract. Indian J. Nat. Prod. Resour. 2011, 2, 52–58. [Google Scholar]
- Padmapriya, R.; Ashwini, S.; Raveendran, R. In vitro antioxidant and cytotoxic potential of different parts of Tephrosia purpurea. Res. Pharm. Sci. 2017, 12, 31–37. [Google Scholar] [CrossRef]
- Dey, D.; Bhattacharjee, D.; Chakraborty, S.; Hussain, S. Development of hard water sensor using fluorescence resonance energy transfer. Sensors Actuators B Chem. 2013, 184, 268–273. [Google Scholar] [CrossRef]
- Tovmachenko, O.G.; Graf, C.; Heuvel, D.J.V.D.; Van Blaaderen, A.; Gerritsen, H.C. Fluorescence Enhancement by Metal-Core/Silica-Shell Nanoparticles. Adv. Mater. 2006, 18, 91–95. [Google Scholar] [CrossRef]
- Yue, Q.; Cheng, J.; Li, G.; Zhang, K.; Zhai, Y.; Wang, L.; Liu, J. Fluorescence Property of ZnO Nanoparticles and the Interaction with Bromothymol Blue. J. Fluoresc. 2010, 21, 1131–1135. [Google Scholar] [CrossRef] [PubMed]
- Saha, J.; Roy, A.D.; Dey, D.; Bhattacharjee, D.; Hussain, S. Role of quantum dot in designing FRET based sensors. Mater. Today Proc. 2018, 5, 2306–2313. [Google Scholar] [CrossRef]
- Kalele, S.; Deshpande, A.C.; Singh, S.B.; Kulkarni, S.K. Tuning luminescence intensity of RHO6G dye using silver nanoparticles. Bull. Mater. Sci. 2008, 31, 541–544. [Google Scholar] [CrossRef]
- Aminuzzaman, M.; Ying, L.P.; Goh, W.-S.; Watanabe, A. Green synthesis of zinc oxide nanoparticles using aqueous extract of Garcinia mangostana fruit pericarp and their photocatalytic activity. Bull. Mater. Sci. 2018, 41, 50. [Google Scholar] [CrossRef]
- Nethravathi, P.; Shruthi, G.; Suresh, D.; Udayabhanu; Nagabhushana, H.; Sharma, S. Garcinia xanthochymus mediated green synthesis of ZnO nanoparticles: Photoluminescence, photocatalytic and antioxidant activity studies. Ceram. Int. 2015, 41, 8680–8687. [Google Scholar] [CrossRef]
- Osman, D.; Mustafa, M. Synthesis and Characterization of Zinc Oxide Nanoparticles using Zinc Acetate Dihydrate and Sodium Hydroxide. J. Nanosci. Nanoeng. 2015, 1, 248–251. [Google Scholar]
- Gnanasangeetha, D.; Saralathambavani, D. One Pot Synthesis of Zinc Oxide Nanoparticles via Chemical and Green Method. Res. J. Mater. Sci. 2013, 1, 1–8. [Google Scholar]
- Jung, D.-R.; Kim, J.; Nahm, C.; Choi, H.; Nam, S.; Park, B. Review paper: Semiconductor nanoparticles with surface passivation and surface plasmon. Electron. Mater. Lett. 2011, 7, 185–194. [Google Scholar] [CrossRef]
- Choyke, W.J. Optical and Electronic Properties of SiC. Phys. Chem. Carbides Nitrides Borides 1990, 1990, 563–587. [Google Scholar] [CrossRef]
- Kuppusamy, P.; Yusoff, M.M.; Maniam, G.P.; Govindan, N. Biosynthesis of metallic nanoparticles using plant derivatives and their new avenues in pharmacological applications–An updated report. Saudi Pharm. J. 2016, 24, 473–484. [Google Scholar] [CrossRef] [PubMed]
- Bhuyan, T.; Mishra, K.; Khanuja, M.; Prasad, R.; Varma, A. Biosynthesis of zinc oxide nanoparticles from Azadirachta indica for antibacterial and photocatalytic applications. Mater. Sci. Semicond. Process. 2015, 32, 55–61. [Google Scholar] [CrossRef]
- Vaseem, M.; Umar, A.; Hahn, Y. ZnO Nanoparticles: Growth, Properties, and Applications. Metal Oxide Nanostruct. Their Appl. 2010, 5, 1–36. [Google Scholar]
- Attar, A.; Yapaoz, M.A. Biomimetic synthesis, characterization and antibacterial efficacy of ZnO and Au nanoparticles using echinacea flower extract precursor. Mater. Res. Express 2018, 5, 055403. [Google Scholar] [CrossRef]
- El Shafey, A.M. Green synthesis of metal and metal oxide nanoparticles from plant leaf extracts and their applications: A review. Green Process. Synth. 2020, 9, 304–339. [Google Scholar] [CrossRef]
- Gnanasangeetha, D.; Thambavani, D. Biological and Physical Sciences Biogenic Production of Zinc Oxide Nanoparticles Using Acalypha Indica. J. Cjemical. Biol. Phys. Sci. 2014, 4, 238–246. [Google Scholar]
- Handore, K.; Bhavsar, S.; Horne, A.; Chhattise, P.; Mohite, K.; Ambekar, J.; Pande, N.; Chabukswar, V.V. Novel Green Route of Synthesis of ZnO Nanoparticles by Using Natural Biodegradable Polymer and Its Application as a Catalyst for Oxidation of Aldehydes. J. Macromol. Sci. Part A 2014, 51, 941–947. [Google Scholar] [CrossRef]
- Sakr, M.E.M.; Kana, M.T.H.A.; Fattah, G.A. Fluorescence enhancement monitoring of pyrromethene laser dyes by metallic Ag nanoparticles. Luminescence 2014, 29, 938–944. [Google Scholar] [CrossRef] [PubMed]
- Tishchenko, K.; Muratova, M.; Volkov, D.; Filichkina, V.; Nedosekin, D.; Zharov, V.; Proskurnin, M. Multi-wavelength thermal-lens spectrometry for high-accuracy measurements of absorptivities and quantum yields of photodegradation of a hemoprotein–lipid complex. Arab. J. Chem. 2017, 10, 781–791. [Google Scholar] [CrossRef]
- Klonis, N.; Clayton, A.H.A.; Voss, E.W.; Sawyer, W.H. Spectral Properties of Fluorescein in Solvent–Water Mixtures: Applications as a Probe of Hydrogen Bonding Environments in Biological Systems. Photochem. Photobiol. 1998, 67, 500. [Google Scholar] [CrossRef]
- Li, H.; Zhang, C.; Li, X.-F.; Xiang, J.; Tie, S.-L.; Lan, S. Enhanced upconversion luminescence from ZnO/Zn hybrid nanostructures induced on a Zn foil by femtosecond laser ablation. Opt. Express 2015, 23, 30118–30126. [Google Scholar] [CrossRef]
- Dey, D.; Saha, J.; Roy, A.D.; Bhattacharjee, D.; Hussain, S.A. Development of an ion-sensor using fluorescence resonance energy transfer. Sensors Actuators B Chem. 2014, 195, 382–388. [Google Scholar] [CrossRef]
- Singh, R.P.; Baghel, R.S.; Reddy, C.R.K.; Jha, B. Effect of quorum sensing signals produced by seaweed-associated bacteria on carpospore liberation from Gracilaria dura. Front. Plant Sci. 2015, 6, 117. [Google Scholar] [CrossRef]
- Chitradevi, T.; Lenus, A.J.; Jaya, N.V. Structure, morphology and luminescence properties of sol-gel method synthesized pure and Ag-doped ZnO nanoparticles. Mater. Res. Express 2019, 7, 015011. [Google Scholar] [CrossRef]
- Wang, Z.; Huang, B.; Liu, X.; Qin, X.; Zhang, X.; Wei, J.; Wang, P.; Yao, S.; Zhang, Q.; Jing, X. Photoluminescence studies from ZnO nanorod arrays synthesized by hydrothermal method with polyvinyl alcohol as surfactant. Mater. Lett. 2008, 62, 2637–2639. [Google Scholar] [CrossRef]
- Siddiqi, K.S.; Rahman, A.U.; Tajuddin; Husen, A. Properties of Zinc Oxide Nanoparticles and Their Activity Against Microbes. Nanoscale Res. Lett. 2018, 13, 1–13. [Google Scholar] [CrossRef] [PubMed]
- Taha, S.A.; Abd-Elnaiem, A.M.; Mohamed, M.; Mostafa, S.; Mostafa, M. Structural study and photocatalytic performance of ZnO thin films prepared by electrochemical deposition. Desalin. Water Treat. 2017, 100, 160–167. [Google Scholar] [CrossRef]
- Fatehah, M.O.; Aziz, H.A.; Stoll, S. Stability of ZnO Nanoparticles in Solution. Influence of pH, Dissolution, Aggregation and Disaggregation Effects. J. Colloid Sci. Biotechnol. 2014, 3, 75–84. [Google Scholar] [CrossRef]


Publisher’s Note: MDPI stays neutral with regard to jurisdictional claims in published maps and institutional affiliations. |
© 2021 by the authors. Licensee MDPI, Basel, Switzerland. This article is an open access article distributed under the terms and conditions of the Creative Commons Attribution (CC BY) license (http://creativecommons.org/licenses/by/4.0/).