1. Introduction
As a key node of road traffics, bridges are lifelines of transport infrastructure systems, ensuring smooth traffics, and playing an important role in the connectivity development of regional transportation [
1]. With the continuous strengthening of scientific research capabilities and the continuous development of social economy, many countries have achieved significant results in the fields of construction equipment, construction technology, and building materials. However, the rapid development of transportation has also led to the increasing number and types of freight vehicles on the road. As vehicle tonnage and truck traffic are increasing, full-load operation of various bridges has become more common [
2]. According to Ding et al. [
3], various natural disasters and man-made influences have also led to many bridges that have not been maintained in time, leading to increased risks. Ensuring the safe operation of bridge structures has become an important issue of concern to the government and the public worldwide.
The increasingly mature application of Building Information Modeling technology in the construction industry has opened up new ideas for bridge health monitoring [
4]. Building information modeling (BIM) or referred to as ‘digital twins’ (DT) aims to digitize and informatize various physical and functional characteristics of a construction project throughout its life cycle [
5,
6,
7,
8,
9,
10,
11]. BIM technology and its application belong to a new academic field with great development space [
12]. Since Chuck Eastman proposed it in the 1970s, BIM has gained a good reputation in the engineering field for its strong visualization performance, high coordination, and convenient drawing [
13]. At present, BIM technology is widely used in the field of housing construction, and applied research in infrastructure such as bridges is also gradually advancing.
At present, structural health monitoring system evaluates the safe performance of bridges through real-time monitoring of the state of the bridge. This technology has been applied in many countries [
14]. However, current visual inspection methods are limited by many conditions:
- (1)
Human visual inspection can be subjective and relies on inspectors to obtain all information accurately.
- (2)
The entire manual process is expensive and time-consuming.
- (3)
When inspectors check risks, there will be many hidden safety hazards.
- (4)
The inspection requires experienced and well-trained personnel, and most bridge authorities currently face the problem of lack of qualified inspectors [
15,
16,
17]. At the same time, various sensors in the bridge health monitoring system collect a large amount of monitoring data every day. How to manage and use this monitoring data scientifically and effectively is a prominent problem faced by the bridge health monitoring system.
The content of this article has been developed around the above-mentioned practical problems in real life, with the inspection of bridge risks as the main research focus. Combining BIM visualization technology and its BIM model application, an unprecedented “BIM + bridge risk inspection model” has been proposed for vulnerability assessment and risk-based maintenance planning function, which realizes an integrated management model of bridge inspection, monitoring and maintenance, and provides new ideas and methods for the application of BIM technology in bridge risk inspection.
2. Literature Review
2.1. Risk Inspection
2.1.1. Research Background
Since the beginning of the 21st Century, with the rapid development of highway construction, China’s highway and bridge construction has continued to develop towards large cross-border constructions, using new and high quality materials. According to data from the Ministry of Transport of the People’s Republic of China, at the end of 2019, a total of 878,300 road bridges had been built in China, with a total length of 60,634,600 m, an increase of 26,800 and 4.9486 million meters from the end of the previous year, respectively.
However, as the number of bridges continues to increase, the proportion of dangerous bridges and bridges with hidden risks is also increasing. According to the data source, about 20% of the bridges in China’s highway network have been in use for more than 20 years, of which 30% are dangerous bridges with technical grades 3 and 4, and more than 100,000 bridges have been assessed as dangerous bridges. In recent years, bridge collapse has occurred due to various factors in the construction and operation process, causing serious casualties and property losses, as shown in
Table 1.
The above-mentioned incidents are all caused by a series of tragic accidents due to inadequate supervision and untimely maintenance. In many countries around the world, the failure of effective supervision and risk inspection during bridge operation has led to many bridge collapse accidents. From 1989 to 2000, more than 44 bridges in the United States failed due to poor maintenance and unsuitable inspection methods [
18,
19]. It can be seen that bridge supervisors have not yet realized the importance of risk inspection to bridge safety. Faced with these problems, we must adopt a modern inspection management model. This article will try to apply advanced BIM technology to bridge risk inspections to provide reference for the future development and application of BIM inspection systems.
2.1.2. The Purpose of the Risk-Based Inspection
According to the risk-based inspection of highway structures published by London Bridges Engineering Group, the structural safety of most roads and bridges previously required the following two factors to be assured:
- (1)
Design, assessment, and maintenance in accordance with codes or rules incorporating empirical safety factors.
- (2)
Regular inspections to provide assurance that no accidental damage or unanticipated deterioration has occurred.
However, the live load may exceed the design load, and as bridges are used for longer and longer time periods, the safety factor of the road and bridge materials will also decrease. Therefore, the inspector should conduct regular inspections to determine the actual condition of the structural materials and take corresponding maintenance measures.
A risk-based inspection strategy overcomes the limitations of the time-based approach. Not only does risk consider the possibility of failure, but it also considers the severity of the consequences of failure. These may include consequences such as loss of profits, maintenance and readjustment costs, casualties, reduced service levels, and environmental costs. Such a strategy can optimize the costs and benefits of risk inspection work [
20]. The maintenance and inspection strategy is shown in
Figure 1, which results in the development of the next generation framework for vulnerability and risk-based maintenance planning of bridge infrastructures.
2.2. New Risk-Based Inspection System Using BIM
The traditional bridge management system (BMS) has mainly gone through three stages [
21]. With the development of information technology, the most widely used bridge inspection system in the United States at present is the points system developed by the Federal Highway Administration [
22]. Highway asset owners face many problems when obtaining bridge status data. The data available in many BMS does not meet the information standards required for subsequent bridge repair, renovation, and reconstruction work. In this case, the value of using BIM in asset management has become increasingly clear [
23]. Although bridge health inspection systems are widely used around the world, it has been found through this investigation that there are still many problems with traditional bridge inspection systems:
- (1)
Self-diagnosis and processing of data.
The data acquired by the bridge monitoring system has characteristics of massiveness, multidimensionality, complexity, and randomness. A lot of invalid data will lead to deviations in the test results.
- (2)
Visualization for monitoring data.
The data for monitoring bridges has the characteristics of 4Vs: Volume, Velocity, Variety, Value, and therefore a special kind of “big data”. However, for some non-professionals, there are too many charts and graphs obtained from data detection, which are difficult to understand.
- (3)
The real-time nature of bridge safety warnings.
In the decades of bridge operation, accidents such as collisions of vehicles and ships, typhoons, and earthquakes are inevitable [
24]. In addition, various risks will gradually appear on the bridge, leading to the continuous deterioration of the structure and posing a threat to the safety of a bridge. In order to meet the long-term service requirements of the bridge, it is necessary to carry out timely risk warning for the key nodes of the bridge [
25].
When one bridge board is at risk instead of all components, it can be attributed to many problems, including defects in design and construction. Taking the bridge deck in
Figure 2 as an example, the bridge head and the middle part of the bridge deck have different stress modes, when they produce the same failure form. In the manual recording, they may be recorded as a type of risk element, and the same maintenance measures will be taken. However, after a few weeks, their shape may be quite different [
26].
2.3. Traditional Risk Inspection System
2.3.1. Building Information Modeling
The BIM originated in the United States in the 1970s. The National Building Information Model Standard (US) defines it as follows: BIM is not only to build a three-dimensional model, but also to build an information integration platform, which includes all the life cycles of the project, and realizes the storage and sharing of data. BIM technology can not only realize the dynamic link between the plan and the engineering profession, but also the main means to manage engineering data information [
27]. With the improvement in construction technology and information transmission technology, BIM has become another new topic explored by the construction industry. It has applications in many fields such as housing construction, road drainage, water, urban rail, roads and bridges. This article mainly explores the application of BIM technology to risk-based inspection, vulnerability assessment and risk-based maintenance planning.
2.3.2. Characteristic of BIM
BIM technology can express each part of a construction project in an informationized way, and this informationized expression enables the attributes of each substance to be accurately displayed. In this way, a sound platform for the joint coordination and communication of all participants can be established to better promote decision-making and make project construction more efficient.
Coordination ability determines efficiency. For construction engineering, which involves a large number of personnel and projects, a strong ability to coordinate is even more necessary. To a certain extent, BIM technology provides such a platform that can place participants on the same platform, realize resource sharing and information complementation, and maximize the strength of all parties, thereby forming a powerful platform for advancing project progress.
BIM can carry out relevant simulations at all stages of a construction project, and this kind of simulation helps to promote a solution to various problems during each stage of the project. This can prevent problems before they happen, and promote the solution of specific problems. BIM can simulate the lighting, ventilation, and load of the construction site to ensure the scientific nature of every decision. At the same time, in the initial stages of the construction process, the site layout can be simulated, and the project schedule can also be simulated to ensure a reasonable construction schedule.
The characteristics of BIM optimization are concentrated in two aspects, one is the optimization of the scheme, and the other is the optimization of the design. The optimization of the plan is mainly reflected in the ability to link the plan design with the cost. In terms of design optimization, places with complex processes such as roofs and walls can be simplified and, so that the engineering volume is reduced, the economic benefits are greater, and the building environment is more livable.
At present, construction according to drawings is a common practice of various companies, and the use of BIM software can generate drawings of various angles of a building, saving a lot of time and energy among relevant personnel. In a sense, the application of BIM technology has also brought profits to enterprise development and improved work efficiency.
2.3.3. Risk-Based Inspection System of “BIM+” Mode
In today’s “Internet+” world, industrial informatization is the general trend, and vigorous promotion of BIM technology will help the transformation and upgrading of the construction industry. The concept of “BIM + Bridge Risk Inspection Mode” proposed in this article combines technologies such as models and spatial positioning to provide complete information solutions for risk data collection, data analysis, data sharing, and other services. Combined with BIM technology, a BIM collaboration platform for risk inspection of bridge engineering was constructed. It provides timely, accurate, and unified risk monitoring services for management personnel of various professions, departments, and entities.
The “BIM + Bridge Risk Inspection Mode” system includes a monitoring module, a data analysis module, and a data sharing module. The stress, displacement, and other information obtained from the detector monitoring and manual inspection are transmitted to the computer data center for analysis. The results of the analysis will be sent to the inspectors in the form of data or charts, etc., and there are methods for them to judge the risk treatment. The module structure is shown in
Figure 3 and its operation method will be explained in
Section 3. From
Figure 3, the module structure is organized by using the numbering system. For the first six rows, the first digit represents the categories of the risks and the second digit represents the step of the assessment. For 7–10, every category of the risks shares the same process. Therefore, there is only one digit representing the step of the assessment process.
3. Methodology
3.1. BIM Modeling
Based on the Computer Aided Design (CAD) drawings of the Zhongcheng Village Bridge, Revit 2018 software has been used to construct a three-dimensional model. The family system of bridge piers, bridge abutments, and T-beams are established first, and then poured into the project for reinforcement, and finally combined as the main body of the project.
The project discussed is the Zhongcheng Village Bridge in Zhejiang Province, China. The project drawing is shown in
Figure 4. The design grade of the bridge is Class 1, and the design service life is 100 years. The Zhongcheng Village Bridge is a prestressed concrete bridge with a total length of 210 m. The half width of the bridge deck is 16.25 m, and the longitudinal slope of the longitudinal section is 2%. The bridge consists of 17 spans with a total length of 400 m. The upper structure of Zhongcheng Village Bridge adopts prestressed concrete (post-tensioning method) T-beams, which are first simply supported and then continuous. The lower part of No. 0 abutment adopts a slab platform, the No. 1-3~3 abutment adopts a ribbed platform, the pier adopts a column pier, and the pier adopts a pile foundation.
3.2. Risk Analysis and Inspection Methods
The main content of bridge real-time risk inspection is the safety, applicability, and durability of the structure. The research content is mainly to scientifically detect the durability of reinforced concrete bridges and record them in the BIM database in order to take correct measures.
3.2.1. Internal Risk
The internal risks of a bridge are mainly related to the environmental exposures and the area where the bridge is located, and whether a bridge is exposed to various quality levels of water conditions. The internal risks arise during the exploitation of bridges and components, such as concrete which are independent from other external factors. This study mainly considers the following points:
Chloride ion erosion is the main cause of steel corrosion. Chloride ions have a strong corrosive effect. When they enter the steel bars, a series of complex chemical reactions will occur, which will damage the passive film of the steel bars and corrode them [
28]. When the chloride ion enters the concrete, after the concentration reaches a critical value, it will cause the corrosion of the steel bar. Therefore, it is necessary to strictly control the chloride ion content in the concrete. Therefore, the chloride ion content in concrete has clear limits that are shown in
Table 2.
Since the chloride ion content needs to be measured through experiments, most of the current methods of chloride ion risk inspection still rely on manual completion.
The essence of concrete carbonization is the phenomenon by which hydration products in cement interact with carbon dioxide in the atmosphere to produce calcium carbonate and other substances [
29,
30]. When carbon dioxide in the atmosphere penetrates into the concrete body through its pores, it will chemically react with the water-containing mineral particles in the air, resulting in a decrease in alkalinity, and the PH value can be reduced to below 9. When the carbonization depth reaches the surface of the steel bar, the steel bar will begin to corrode and ultimately affect the durability of the structure. The prerequisite for corrosion of the steel bar in the general atmospheric environment is concrete carbonization [
31].
Cracks mainly cause corrosion of bridge steel bars and damage to the bridge structure. Under the action of initial tension and stress, the concrete cracks have little effect on the beam. According to the durability requirements, if the width of the concrete crack is not greater than or slightly more than 0.2 mm, and the width tends to be stable, the strength of the beam will not be significantly affected. When the width of cracks become larger, the stiffness of the beam will decrease, the steel bar will be susceptible to corrosion, and the service life of the structure will be reduced [
32,
33,
34].
In the “BIM + bridge risk inspection mode”, the concrete cracks and carbonized area are scanned and uploaded by the scanner. This article uses the concrete multi-function tester (SCC-MATS) produced by Sichuan Shengtuo Testing Technology Co., Ltd. (in Chengdu, China). The risk checking steps are as follows (as shown in
Figure 3, step 0):
- 1.
Scan the concrete to obtain disease information;
- 2.
Analyze data through software to obtain disease information such as cracks.
- 3.
Upload the disease information to the database and mark the specific position of the BIM three-dimensional model component, so that the corresponding concrete, steel bar model, or reproduced component can be checked during future maintenance. At the same time, it can be compared with the standard value and finally outputs the inspection result.
3.2.2. Natural Hazard Risks
Natural hazard risks must consider the risk loss that may be caused to the project by factors such as the geographical environment, geology, hydrology, and meteorological conditions where the bridge is located. One can check the frequency and level of local natural disasters such as floods, earthquakes, hurricanes, etc., to evaluate risk indicators. In this article, CSI-Bridge 2015 will be used to simulate the deformation of the bridge (
Figure 3, step 2). In this step, all collected parameters are used to calculated specific variables such as deformation, force, and stress. Calculated variables are to be compared with defined values to assess the risks of the bridge. Based on the data reported by the Ministry of Transport of the People’s Republic of China, the risks and vulnerable assets can be identified for road networks in Zhejiang Province. The hazard risk analysis based on expert interviews (Highways department, Zhongcheng office) can be illustrated in
Table 3. This hazard risk can be updated to help engineers prioritize inspection, repair, and maintenance tasks as shown in
Table 4, which underpin the digital twins framework in
Figure 3. Note: the risk analysis and planning prioritization are based on the Zhongcheng Village Bridge (at the infrastructure level).
3.2.3. Human Risk
Human risk (or man-made hazard risk) mainly considers collision (including vehicle collisions and ship collisions), load (including vehicle overload and bridge structural fatigue), arson, terrorist attack, explosion, and other intentional damage by humans [
35,
36].
At present, for the overload phenomenon, the “BIM + Bridge Risk Inspection Mode” can perform the following inspections (
Figure 3, step 1):
- 1.
Place load sensors on the bridge and nearby roads at strategic locations.
- 2.
The load of the vehicle is judged according to the stress parameters read when the vehicle passes the corresponding sensor and compared with the verified load of the vehicle.
- 3.
Analyze and process the data. If overloading is destructive to the bridge, the system will deal with it immediately and warn passing vehicles the risks of bridge. This study uses CSI-Bridge to simulate overload conditions.
In this step, it mainly focuses on data collection. Data collection is done using installed sensors at the bridge. The early safety warning system of bridges generally adopts a multi-neural network model and establishes the multi-element mapping mathematical model of wind, temperature, and vehicle load and bridge frequency, strain, and deformation [
37,
38,
39,
40]. According to the correlation characteristics of different environmental loads and structural responses, Bayesian regularization technology is used in this study to optimize the weights of coupled environmental load fields. On the basis of this method, combined with BIM technology, the performance tracking and real-time safety warning of each component of the full bridge are carried out [
41,
42,
43,
44,
45,
46,
47,
48,
49,
50].
4. Results and Discussions
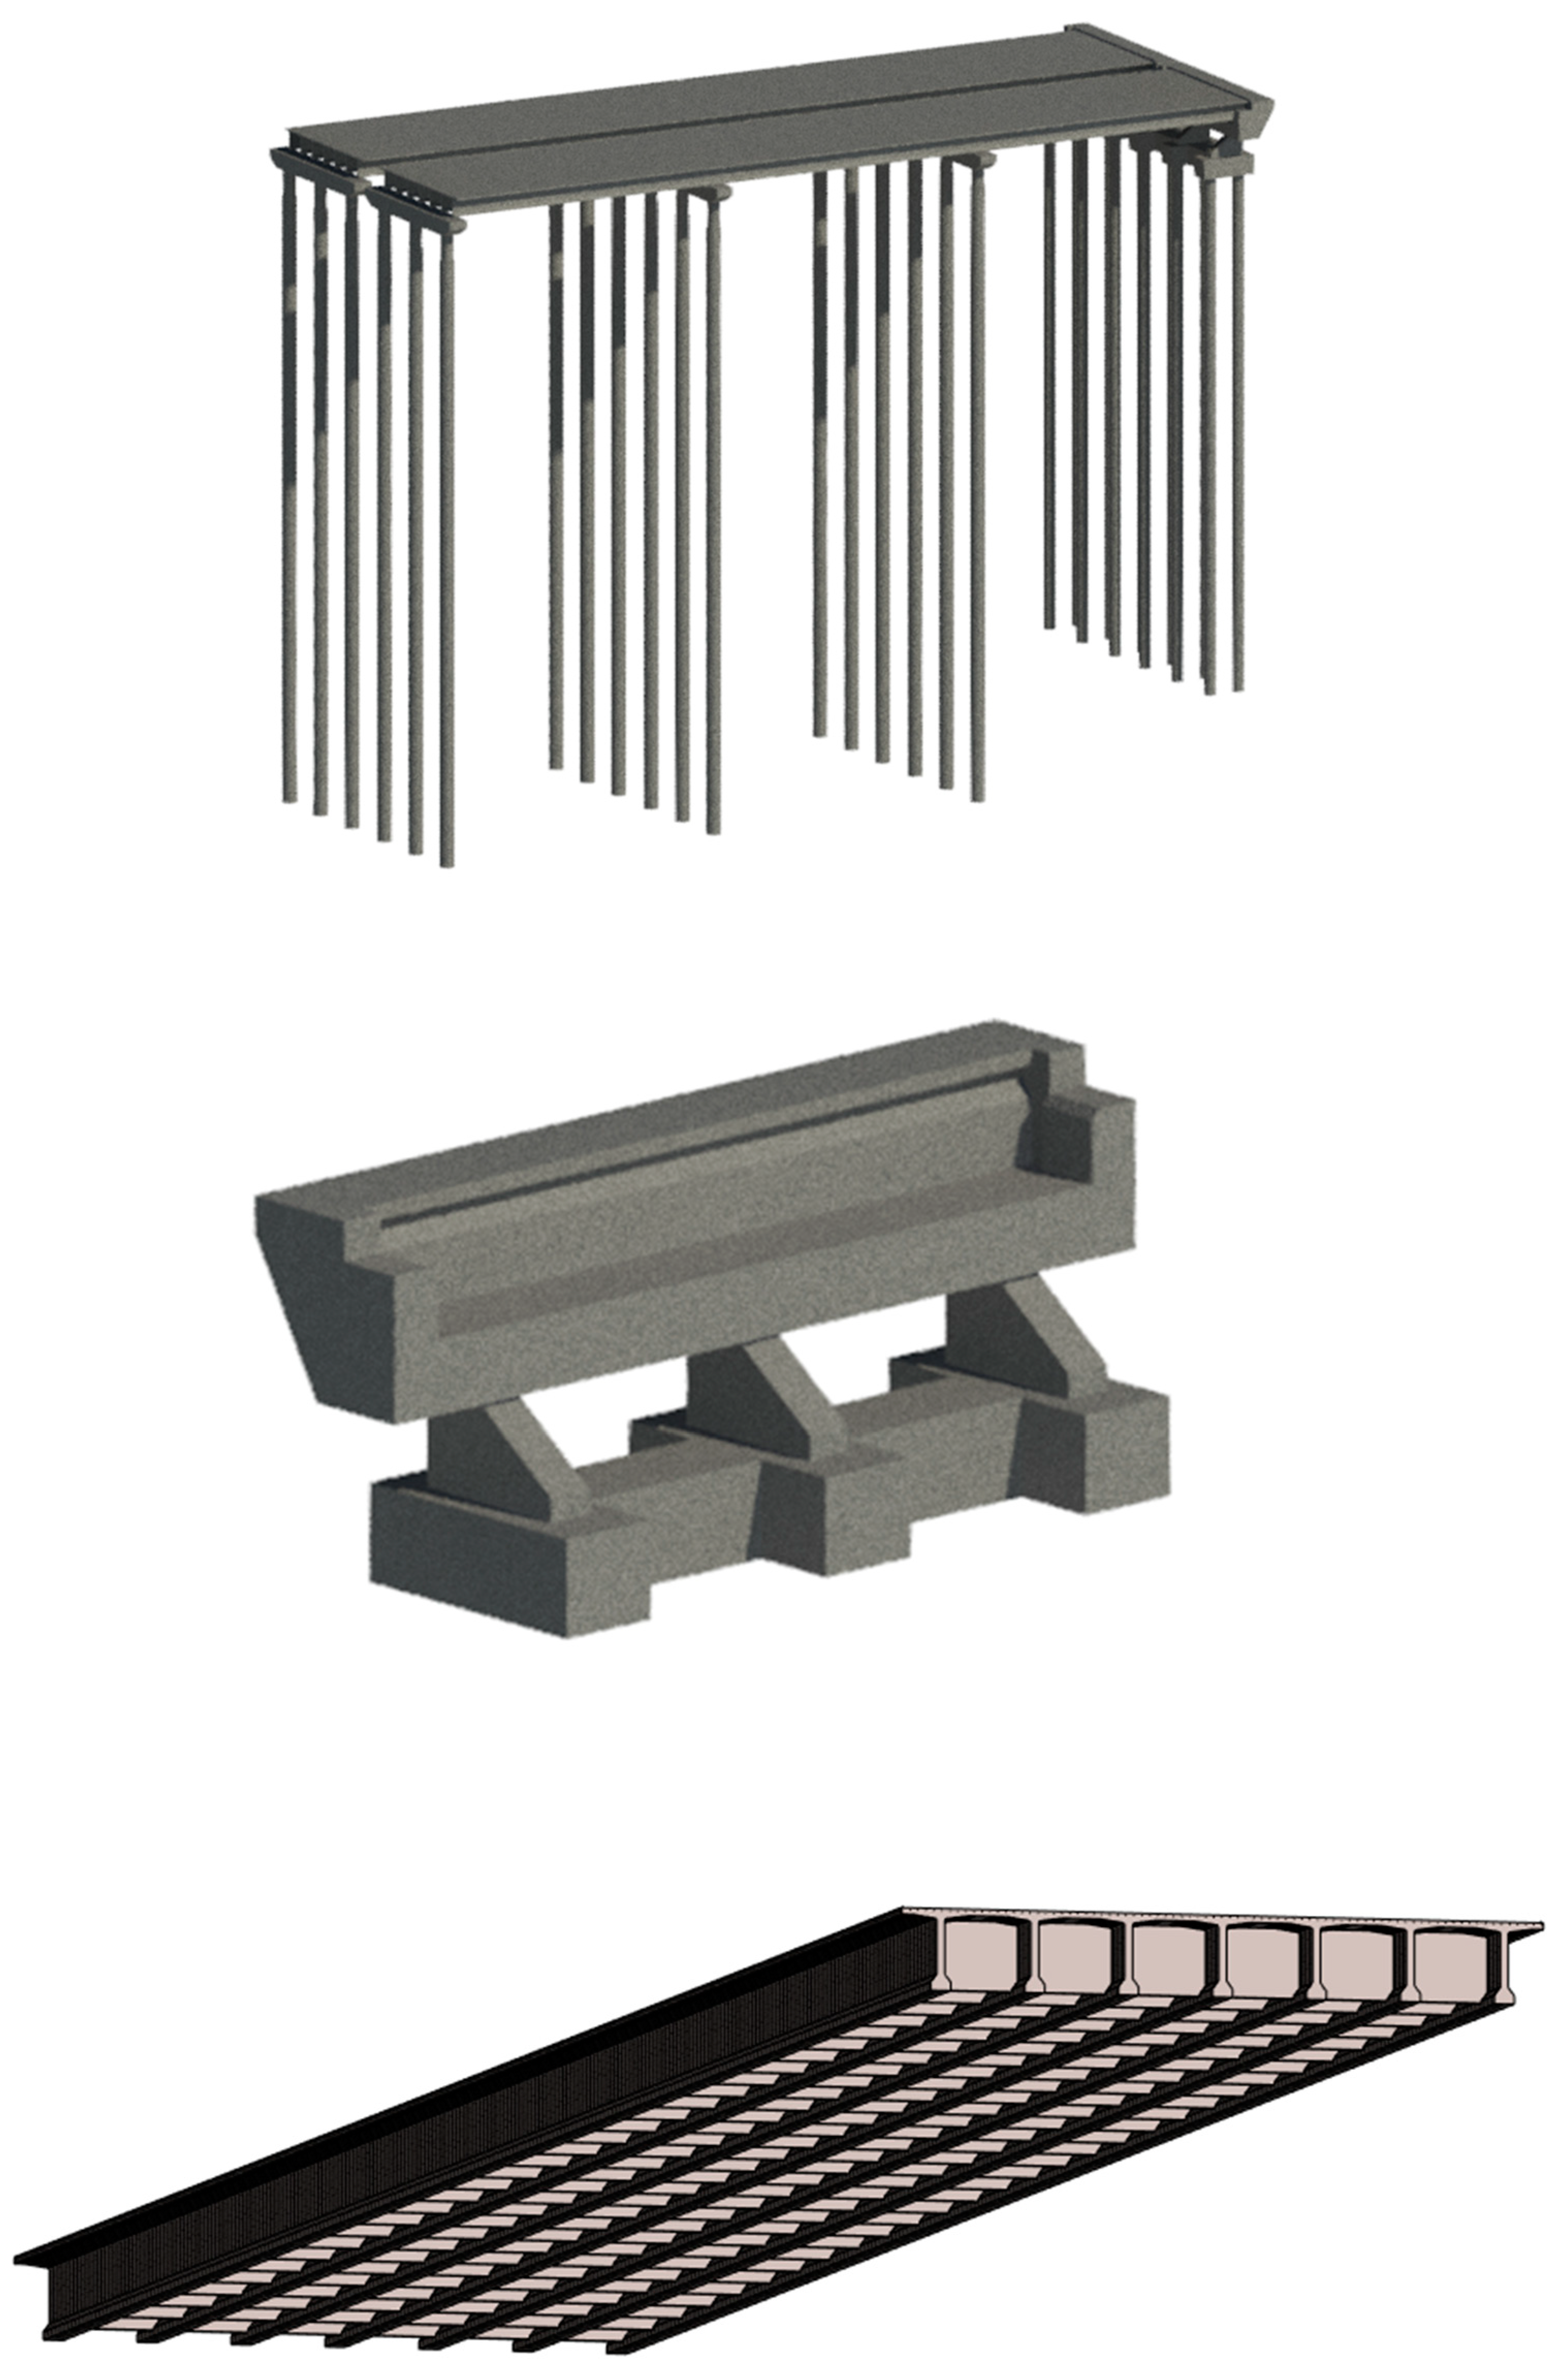
4.1. Build the 3D Model of the Bridge
Based on the 2D plan drawing of the project, Revit2018 is used to build the 3D model of the project, as shown in
Figure 5. The establishment of the model includes not only the 3D geometric model, but also the corresponding module and link information. Among these, the method of information implantation and construction splitting of the modules in the establishment of the three-dimensional model is very important. If the splitting is too fine, the number of components will be large. The database will be occupied by a large amount of low-value data, which increases the cost of data storage and system operation. Inadequate splitting will result in a lack of key information and limit operational analysis. At the same time, the link between components and various sensors must be accurate, which is essential for the accurate mapping of bridge diseases in the 3D model. The 3D model of the bridge structure and related components of in project are shown in
Figure 5.
4.2. The Results of Risk Inspection
4.2.1. Internal Risk
Compared with the traditional manual method of measuring crack width and the carbonized area, it is more efficient and convenient to use the concrete multi-function detector (SCC-MATS) to measure concrete diseases. The scanned concrete surface data will be stored in the computer, and the image can be analyzed and processed. The software interface is shown in
Figure 6.
After selecting the crack treatment method, the corresponding components should be located in the 3D model and relevant information obtained, as illustrated in
Figure 7 and
Figure 8.
In order to confirm what type of concrete and steel bar type, other sets of information are used. After data processing, the following measures should be taken to reduce or eliminate risks:
- 1.
Chloride ion erosion
If the carbonization depth is too large and the steel bars are corroded, the components should be replaced immediately.
The components with low carbonization depth and which are less than the thickness of the steel protection layer should be sealed with high-quality paint.
The depth of carbonization is greater than the depth of the protective layer, and components whose carbonized layer easily falls off should be painted with high-strength mortar or concrete.
- 2.
Concrete carbonization
The thickness and quality of the concrete protective layer should be improved to extend the time for chloride ions to penetrate into the concrete to reach the surface of the steel bar.
The concrete surface should be painted. In order to prevent the penetration of corrosive media such as chloride ions, applying a coating on the surface of the repaired concrete structure or new concrete structure is a simple, economical and effective auxiliary protective measure.
- 3.
Cracks
For cracks that do not exceed the allowable value, in order to prevent them from being affected by atmospheric factors, the method of painting water glass or epoxy resin can generally be used to seal the cracks.
When the crack is greater than the allowable value, the crack is generally filled with epoxy resin.
When the crack is larger than 0.4-0.5mm, the crack should be cut open, brushed clean, and then filled with epoxy mortar or high-strength cement mortar. If the volume is large, small gravel concrete can be used to fill the cracks.
If the cracks greatly exceed the values listed in the above table, the components should be reinforced or replaced, but the cause of the cracks should be found through calculations.
4.2.2. Natural Hazard Risk and Human Risk
In the risk-based inspection, the unique functional advantages of BIM technology, such as simulation and visualization, should be fully exploited to simulate the structural safety of the bridge under conditions such as severe overload, ship collision, and explosion. BIM’s 4D technology should be used to conduct bridge safety assessments under emergency events such as overload, earthquake, and explosion. The system compares and analyzes the various sensor monitoring data of the bridge after the emergency occurs with the monitoring data under daily conditions, and judges the current working conditions of the bridge and makes corresponding responses.
For overload conditions, a load detector can be used. When a vehicle is seriously overloaded, it will be destructive to the bridge. It will warn drivers of overloaded vehicles and passing vehicles to reduce damage to the bridge and reduce human risks. The system structure is shown in
Figure 9. In this study, CSI-Bridge 2015 is used to simulate the deformation of the bridge, and the safety assessment is carried out under the conditions of overloaded vehicles passing as shown in
Figure 9 and
Figure 10.
Through the deformation simulations stemming from extreme conditions, a series of data can be established and stored in the BIM database for the comparison process of real-time data in steps 1.6–7, as shown in
Figure 3. In this way, online data self-diagnosis can be realized, and the accuracy and efficiency of risk inspection can be improved. Another example of an extreme condition is flooding which caused by heavy rain. Rainwater information can also be stored in the BIM model as the 4D and measured by using a sensor. When the amount of rainwater exceeds a defined level, the use of the bridge is not allowed. In addition, time-series information can be tracked along the time to see a trend of rainwater. When the trend is increasing, a plan for improving the bridge shall be made to ensure that the bridge is applicable. This concept can be applied to other extreme conditions due to other extreme conditions such as wind, temperature, or earthquake.
4.3. Discussion
Many countries, including China, have made significant progress and leap in the technical level of bridge construction, but bridge builders always emphasize construction and neglect risk, uncertainty, and hazard management. Managers do not realize the importance of risk checking. At the same time, because the entire life cycle of the bridge is nearly a hundred years, it is easy to lose data (and/or perhaps motivation) and the bridge cannot be maintained in time, which is also the cause of the accident. The application of BIM can help solve these problems because BIM can contain data taking place along the project in the model. To exploit BIM, related components have to be defined at the beginning of the project such as the level of detail, parameters required to store in BIM, or categories of parameters used by different parties. This definition clarifies required tasks and provides the background of the project for each party. The workflow is then smooth.
However, there is currently no unified bridge information modeling standard for the bridge industry in the world as data support, which means the popularity of BIM in the bridge industry has lagged behind the construction industry for many years. This is a challenge for applying BIM to other functions for all stakeholders in the bridge industry. There are still many unknown areas in the application of BIM in the bridge industry that need to be explored. Moreover, BIM software nowadays does not fully support the bridge industry. Designers have to create each bridge element manually which different from buildings that software more supports.
The results of this study show that if BIM can be fully integrated with the bridge industry, BIM can provide a number of benefits to the industry and indeed inclusiveness to all stakeholders, for example, to enhance risk management, sustainability, vulnerability assessment, inspection planning, cost management, or maintenance aspects. The risks demonstrated in this study consist of internal, natural, and human risks. Each risk profile can be fully integrated with BIM using an associated support software that related to each, such as scanners to investigate cracks or simulations to simulate the bridge behavior when load applies. More information and aspects can also be included in the BIM model for more comprehensive consideration. The BIM model then can be used to monitor the condition of the bridge and manage the risks related to the bridge. All of these lead to efficient asset management. However, the information integration in BIM should be conducted efficiently because if the information is not integrated properly, the BIM model contains too much information which may obstruct the utilization due to the size and complexity of the model. From the study, the functions of BIM are extended to asset management not only the design and construction that traditionally used nowadays.
5. Conclusions
According to World Green Building Council, the activities related to building and construction are responsible for 39% of all carbon emissions in the world, with operational emissions (from energy used to heat, cool, and light buildings) accounting for 28%. The remaining 11% stems from embodied carbon emissions, or ‘upfront’ carbon that is directly related to materials, construction, and maintenance processes throughout the whole building lifecycle. This has led to the drastic concern for better, greener, and more sustainable development (including building, construction, and maintenance stages) of critical infrastructures, including bridge infrastructures and their assets along the corridor. This paper mainly studies the application of BIM technology in the risk inspection of bridge operations. First, it briefly introduces the necessity of risk inspection, and compares the traditional risk inspection mode with the application of BIM for risk inspection and maintenance planning, as well as proposes the “BIM + bridge risk inspection model”. The advantages of this model are mainly reflected in the following aspects:
Breaking the inherent two-dimensional risk management model, making the content more intuitive and specific.
The risk can be used as information points and directly mapped onto the three-dimensional model to obtain component material information and repair them immediately also the preventive maintenance.
Through various sensors, real-time monitoring of bridge operation status can be achieved by integrating with BIM or digital twin.
Through computer model simulation, a “safety value” can be established for the bridge that can be compared with real-time data. The safety values can be based on defined standards which used in specific countries or defined engineering codes.
The database can store all information of the entire life cycle of the bridge, which is convenient for managers to view and use the data at any time.
It provides new ideas for the application of BIM to bridge risk inspection, vulnerability assessment and maintenance planning. In conclusion, the inspection model proposed in this study provides new ideas and techniques for bridge risk inspection, making it more convenient and greatly improving work efficiency.
Risks in different aspects can be tracked and managed efficiently using the proposed technique in this article which consist of internal risk, natural risk, and human risk. All risks can be assessed in real-time and combined to determine the overall risk level and prepare an appropriate plan to manage the risks.
At present, there is no BIM standard applying to bridges’ inspection and risk-based planning, although the popularity of using BIM in this industry tends to increase significantly. The standard should be considered carefully and launched to make the BIM applications in the construction industry as comprehensive as other industries which is a challenge for relevant agencies. In addition, there are research gaps in this area that need to be explored. Similarly, the software that does not fully support BIM in the bridge industry.
In the near future, operational staff (e.g., engineers, inspectors, maintainers, etc.) should adopt this new framework and tailor the developed model to be more suitable for their practice. Comprehensive field data will further extend the use of digital twin to robust asset management, with a model that contains all information, along with the dynamic risk profiles throughout the entire project life [
51].
6. Recommendations
From the study, the recommendations for future work can be concluded as follows:
Although this study proposes the concept and method of “BIM + bridge risk inspection model”, it has not conducted in-depth exploration into the automated interaction of data. In the future, the automation of data analysis using Dynamo Script will be carried out.
Although BIM can promote speed and efficiency in bridge inspection, for many bridges in reality, drawing their 3D models manually requires a lot of manpower and time. Therefore, how to model quickly is an urgent problem to be solved. This aspect requires the development of spatially and semantically correct digital twins for infrastructure maintenance and monitoring.
Other types of risk could be included in a BIM model for the comprehensiveness of risk assessment and benefit of asset management. In the future, man-made hazards will be considered. Risks in internal, natural, and human aspects will be extended to other kinds of risks and studied in detail such as storm surge and other human activities in the human risk.
Support information will be further integrated into a BIM model for the benefits of assessment. For example, the weather forecast can be used to assess the natural risk or real-time traffic information can be used to assess human risk.
Author Contributions
Conceptualization, S.K.; methodology, S.K., W.M., O.P.-E.; software, W.M.; validation, S.K., J.S., and W.M.; formal analysis, S.K., W.M.; investigation, S.K., W.M., J.S., O.P.-E.; resources, S.K.; data curation, W.M., J.S.; writing—original draft preparation, W.M., J.S.; writing—review and editing, S.K., O.P.-E.; visualization, W.M., J.S.; supervision, S.K.; project administration, S.K. All authors have read and agreed to the published version of the manuscript.
Funding
This research was funded by Japan Society for the Promotion of Sciences for his Invitation Research Fellowship (Long-term), Grant No. JSPS-L15701 and the European Commission for the H2020-RISE Project No. 691135 “RISEN: Rail Infrastructure Systems Engineering Network”. The APC is sponsored by MDPI’s invited paper program.
Institutional Review Board Statement
Not applicable.
Informed Consent Statement
Not applicable.
Data Availability Statement
Data can be made available upon reasonable request.
Acknowledgments
The corresponding author is sincerely grateful to the Australian Academy of Science and the Japan Society for the Promotion of Sciences for his JSPS Invitation Research Fellowship (Long-term), Grant No. JSPS-L15701 at the Railway Technical Research Institute and the University of Tokyo, Japan. The authors are also wishes to thank to the European Commission for the financial sponsorship of the H2020-RISE Project No. 691135 “RISEN: Rail Infrastructure Systems Engineering Network”, which enables a global research network that tackles the grand challenge of railway infrastructure resilience and advanced sensing in extreme environments (
www.risen2rail.eu (accessed on 10 August 2020)).
Conflicts of Interest
The authors declare no conflict of interest.
References
- Zhang, Q. Discussion on the construction of bridge safety and health perception system in the Internet of Things era. Munic. Technol. 2010, 124–125. [Google Scholar]
- Dong, L.; Li, Y. Talking about the development status and development trend of roads and bridges in our country. World Homes 2018, 2018. [Google Scholar]
- Ding, Y.-L.; Zhao, H.-W.; Deng, L.; Li, A.-Q.; Wang, M.-Y. Early Warning of Abnormal Train-Induced Vibrations for a Steel-Truss Arch Railway Bridge: Case Study. J. Bridg. Eng. 2017, 22, 05017011. [Google Scholar] [CrossRef]
- Xu, P.; Xiong, F. Bridge Information Integrated Management Based on BIM System Research. CT 2016, 45, 119–123. [Google Scholar]
- Binfeng, Y.; Xiaojun, M. Application of BIM and RFID in Open-building Whole Life Cycle Information Management. CT 2015, 10, 26. [Google Scholar]
- Kaewunruen, S.; Xu, N. Digital Twin for Sustainability Evaluation of Railway Station Buildings. Front. Built Environ. 2018, 4, 77. [Google Scholar] [CrossRef]
- Kaewunruen, S.; Sresakoolchai, J.; Zhou, Z. Sustainability-Based Lifecycle Management for Bridge Infrastructure Using 6D BIM. Sustainability 2020, 12, 2436. [Google Scholar] [CrossRef]
- Kaewunruen, S.; Sresakoolchai, J.; Kerinnonta, L. Potential Reconstruction Design of an Existing Townhouse in Washington DC for Approaching Net Zero Energy Building Goal. Sustainability 2019, 11, 6631. [Google Scholar] [CrossRef]
- Kaewunruen, S.; Rungskunroch, P.; Welsh, J. A Digital-Twin Evaluation of Net Zero Energy Building for Existing Buildings. Sustainability 2018, 11, 159. [Google Scholar] [CrossRef]
- Kaewunruen, S.; Sresakoolchai, J.; Peng, J. Life Cycle Cost, Energy and Carbon Assessments of Beijing-Shanghai High-Speed Railway. Sustainability 2019, 12, 206. [Google Scholar] [CrossRef]
- Kaewunruen, S.; Lian, Q. Digital twin aided sustainability-based lifecycle management for railway turnout systems. J. Clean. Prod. 2019, 228, 1537–1551. [Google Scholar] [CrossRef]
- Zhao, X.; Xiayan, X.; Qiming, L.; Xing, Z. Visual analysis method of building information model based on WebGL and IFC. JSEU(EE) 2016, 46, 444–449. [Google Scholar]
- Hengwei, W.; Zhenzhong, H.; Jiarui, L.; Jianping, Z. Web-oriented BIM 3D viewing and information management. ITcon 2013, 5, 1–7. [Google Scholar]
- Newhook, J.P.; Edalatmanesh, R. Integrating reliability and structural health monitoring in the fatigue assessment of concrete bridge decks. Struct. Infrastruct. Eng. 2013, 9, 619–633. [Google Scholar] [CrossRef]
- Bu, G.; Lee, J.; Guan, H.; Blumenstein, M.; Loo, Y.-C. Development of an Integrated Method for Probabilistic Bridge-Deterioration Modeling. J. Perform. Constr. Facil. 2014, 28, 330–340. [Google Scholar] [CrossRef][Green Version]
- Griffin, D.W.; Mirza, O.; Kwok, K.; Kaewunruen, S. Composite slabs for railway construction and maintenance: A mechanistic review. IES J. 2014, 7, 243–262. [Google Scholar]
- Kaewunruen, S.; Wu, L.; Goto, K.; Najih, Y.M. Vulnerability of Structural Concrete to Extreme Climate Variances. Climate 2018, 6, 40. [Google Scholar] [CrossRef]
- Wardhana, K.; Hadipriono, F.C. Analysis of Recent Bridge Failures in the United States. J. Perform. Constr. Facil. 2003, 17, 144–150. [Google Scholar] [CrossRef]
- Osman, M.H.; Kaewunruen, S. Value of rescheduling of rail inspection. Proc. Inst. Mech. Eng. Part F J. Rail Rapid Transit. 2018, 234, 321–330. [Google Scholar] [CrossRef]
- London Bridges Engineering Group. Risk-Based Inspection of Highway Structures—LoBEG. 2019. Available online: https://www.lobeg.com/download/9/technical-advice-documents/1404/risk-based-inspection-of-highway-structures-2.pdf (accessed on 10 August 2020).
- Guo, R. Research on Key Issues of Urban Bridge Management System; Tongji University: Shanghai, China, 2014. [Google Scholar]
- Zhou, X.; Chen, A. Overview of European bridge management. World Bridge 2004, 2004, 52–55. [Google Scholar]
- Chan, B.; Guan, H.; Hou, L.; Jo, J.H.; Blumenstein, M.; Wang, J. Defining a conceptual framework for the integration of modelling and advanced imaging for improving the reliability and efficiency of bridge assessments. J. Civ. Struct. Health Monit. 2016, 6, 703–714. [Google Scholar] [CrossRef]
- Ding, Y.; An, Y.; Wang, C. Field monitoring of the train-induced hanger vibration in a high-speed railway steel arch bridge. Smart Struct. Syst. 2016, 17, 1107–1127. [Google Scholar] [CrossRef]
- Arangio, S.; Beck, J.L. Bayesian neural networks for bridge integrity assessment. Struct. Control. Health Monit. 2010, 19, 3–21. [Google Scholar] [CrossRef]
- Sacks, R.; Kedar, A.; Borrmann, A.; Ma, L.; Brilakis, I.; Hüthwohl, P.; Daum, S.; Kattel, U.; Yosef, R.; Liebich, T.; et al. SeeBridge as next generation bridge inspection: Overview, Information Delivery Manual and Model View Definition. Autom. Constr. 2018, 90, 134–145. [Google Scholar] [CrossRef]
- Kaewunruen, S.; Peng, S.; Phil-Ebosie, O. Digital Twin Aided Sustainability and Vulnerability Audit for Subway Stations. Sustainability 2020, 12, 7873. [Google Scholar] [CrossRef]
- Shi, J.; Sun, W. Research Status and Hot Issues of Rebar Corrosion in Concrete. CCS 2010, 38, 1753–1764. [Google Scholar]
- Baidu. Carbonization of Concrete and Its Influencing Factors. 2011. Available online: https://wenku.baidu.com/view/5992a67102768e9951e738a7.html (accessed on 10 August 2020).
- Huang, X.; Ge, J.; Kaewunruen, S.; Su, Q. The Self-Sealing Capacity of Environmentally Friendly, Highly Damped, Fibre-Reinforced Concrete. Materials 2020, 13, 298. [Google Scholar] [CrossRef] [PubMed]
- Chen, C. The Effect of Carbonation on Reinforced Concrete Bridges; China Highway: Zhejiang, China, 2009. [Google Scholar]
- Sun, X. Influence of Crack on Bridge and Crack Treatment; Highway Adminstration Bureau of Taian City: Tai’an, China, 2004; pp. 37–41. [Google Scholar]
- Remennikov, A.M.; Kaewunruen, S. Determination of Prestressing Force in Railway Concrete Sleepers Using Dynamic Relaxation Technique. J. Perform. Constr. Facil. 2015, 29, 04014134. [Google Scholar] [CrossRef]
- Setsobhonkul, S.; Kaewunruen, S.; Sussman, J.M. Lifecycle Assessments of Railway Bridge Transitions Exposed to Extreme Climate Events. Front. Built Environ. 2017, 3, 35. [Google Scholar] [CrossRef]
- Kaewunruen, S.; Bin Osman, M.H.; Rungskunroch, P. The Total Track Inspection. Front. Built Environ. 2019, 4, 84. [Google Scholar] [CrossRef]
- Ren, L.-c.; Li, Z.-f.; Xing, J.-X.; Cheng, J.-z.; Zhai, W.-q.; Han, F. Research on a New Model in Bridge Engineering Risk Assessment Based on the Modified AHP Algorithm. J. Taiyuan Univ. Sci. Technol. 2016, 1, 13. [Google Scholar]
- Geng, F.; Yi, F. Research on Bridge Health Monitoring System based on BIM. Mod. Transp. Technol. 2018, 15, 35–38. [Google Scholar]
- Baidu. Carbonation Depth of Concrete and Treatment Measures. 2017. Available online: https://wenku.baidu.com/view/75f8623adcccda38376baf1ffc4ffe473268fd64.html?fr=search-3 (accessed on 10 August 2020).
- Sa’Adin, S.L.B.; Kaewunruen, S.; Jaroszweski, D. Operational readiness for climate change of Malaysia high-speed rail. In Proceedings of the Institution of Civil Engineers-Transport; Thomas Telford Ltd.: Telford, UK, 2016; Volume 169, pp. 308–320. [Google Scholar]
- Sresakoolchai, J.; Kaewunruen, S. Comparative studies into public private partnership and traditional investment approaches on the high-speed rail project linking 3 airports in Thailand. Transp. Res. Interdiscip. Perspect. 2020, 5, 100116. [Google Scholar] [CrossRef]
- Wang, T.; Samsom, S.; Ng, A.K.Y.; Earl, P. Climate Change and the Adaptation Planning of Inland Port and Rail Infrastructures in the Province of Manitoba in Canada; Routledge: New York, NY, USA, 2015. [Google Scholar]
- Eisenack, K.; Stechker, R. A framework for analyzing climate change adaptations as actions. Mitig. Adapt. Strateg. Glob. Chang. 2012, 17, 243–260. [Google Scholar] [CrossRef]
- Badrul Hisham, A.; Marzukhi, M.; Daud, A. The worst flood in 100 years: Johore experience. Malays. J. Community Health 2009, 15, 1–14. [Google Scholar]
- Jaroszweski, D.; Hooper, E.; Baker, C.; Chapman, L.; Quinn, A.; Baker, C. The impacts of the 28 June 2012 storms on UK road and rail transport. Meteorol. Appl. 2014, 22, 470–476. [Google Scholar] [CrossRef]
- Vagnoli, M.; Remenyte-Prescott, R.; Andrews, J. Railway bridge structural health monitoring and fault detection: State-of-the-art methods and future challenges. Struct. Health Monit. 2017, 17, 971–1007. [Google Scholar] [CrossRef]
- Frangopol, D.M.; Saydam, D.; Kim, S. Maintenance, management, life-cycle design and performance of structures and infrastructures: A brief review. Struct. Infrastruct. Eng. 2012, 8, 1–25. [Google Scholar] [CrossRef]
- Washer, G.; Connor, R.; Nasrollahi, M.; Reising, R. Verification of the Framework for Risk-Based Bridge Inspection. J. Bridg. Eng. 2016, 21, 04015078. [Google Scholar] [CrossRef]
- Quirk, L.; Matos, J.; Murphy, J.; Pakrashi, V. Visual inspection and bridge management. Struct. Infrastruct. Eng. 2017, 14, 320–332. [Google Scholar] [CrossRef]
- Jeong, Y.; Kim, W.; Lee, I.; Lee, J. Bridge inspection practices and bridge management programs in China, Japan, Korea, and U.S. J. Struct. Integr. Maint. 2018, 3, 126–135. [Google Scholar] [CrossRef]
- Pellegrino, C.; Pipinato, A.; Modena, C. A simplified management procedure for bridge network maintenance. Struct. Infrastruct. Eng. 2011, 7, 341–351. [Google Scholar] [CrossRef]
- Kaewunruen, S.; Sussman, J.M.; Matsumoto, A. Grand Challenges in Transportation and Transit Systems. Front. Built Environ. 2016, 2, 4. [Google Scholar] [CrossRef]
| Publisher’s Note: MDPI stays neutral with regard to jurisdictional claims in published maps and institutional affiliations. |
© 2021 by the authors. Licensee MDPI, Basel, Switzerland. This article is an open access article distributed under the terms and conditions of the Creative Commons Attribution (CC BY) license (http://creativecommons.org/licenses/by/4.0/).


