Article

Optimizing of Microalgae Scenedesmus sp. Biomass Production in Wet Market Wastewater Using Response Surface Methodology

by
Najeeha Mohd Apandi
1,*,
Mimi Suliza Muhamad
1,*,
Radin Maya Saphira Radin Mohamed
2,
Norshuhaila Mohamed Sunar
1,
Adel Al-Gheethi
2,
Paran Gani
3 and
Fahmi A. Rahman
1
1
Department of Civil Engineering Technology, Faculty of Civil Engineering Technology, Universiti Tun Hussein Onn Malaysia, Pagoh Education Hub, Pagoh, Johor 84600, Malaysia
2
Micro-Pollutant Research Centre (MPRC), Department of Civil Engineering, Faculty of Civil Engineering, Faculty of Civil Engineering and Built and Environment, University Tun Hussein Onn Malaysia, Parit Raja, Batu Pahat, Johor 86400, Malaysia
3
Faculty of Science and Technology Quest International University Perak, N. 227, Plaza The Teng Seng (Level 2), Jalan Raja Permaisuri Bainun, Ipoh, Perak 30250, Malaysia
*
Authors to whom correspondence should be addressed.
Sustainability 2021, 13(4), 2216; https://doi.org/10.3390/su13042216
Submission received: 31 December 2020 / Revised: 31 January 2021 / Accepted: 2 February 2021 / Published: 19 February 2021
(This article belongs to the Special Issue Sustainable Materials for Environmental Applications)

Abstract

:
The present study aimed to optimize the production of Scenedesmus sp. biomass during the phycoremediation process. The biomass productivity was optimized using face centred central composite design (FCCCD) in response surface methodology (RSM) as a function of two independent variables that included wet market wastewater concentrations (A) with a range of 10% to 75% and aeration rate (B) with a range of 0.02 to 4.0 L/min. The results revealed that the highest biomass productivity (73 mg/L/d) and maximum growth rate (1.19 day−1) was achieved with the 64.26% of (A) and 3.08 L/min of (B). The GC-MS composition analysis of the biomass yield extract revealed that the major compounds are hexadecane (25%), glaucine (16.2%), and phytol (8.33%). The presence of these compounds suggests that WMW has the potential to be used as a production medium for Scenedesmus sp. Biomass, which has several applications in the pharmaceutical and chemical industry.

1. Introduction

Microalgae biomass are well known as a substrate for production of biohydrogen, biogas, and biodiesel due to the natural source of chemical hydrocarbon and other bioactive compounds which possess functional properties [1,2,3]. Scenedesmus sp. has the most sufficient fatty acid profile compared to Chlorococcum sp., Chlorella sp., and Botryococuss sp. [4]. Scenedesmus sp. is suitable for biomass in terms of biodiesel production for its high lipid content and has been selected for higher scale studies in the literature [5,6,7,8]. However, the main limits lie in the cost associated with the production of the microalgae biomass in the commercial media. Hence, the new directions have been shifted to use wastewater such as wet market wastewater (WMW) as a production media for microalga biomass due to the available nutrients and trace elements in these wastes which improve microalgae growth. Besides, the production process is carried out without chemicals, nutrient additions, or adjustments for the wastewater medium since the microalgae is photosynthetic organisms and able to grow in an ambient environment [1,9,10]. On the other hand, the microalgae growth and their cellular biochemical composition can possibly be affected by culture and environmental conditions in nutrient balance, which play major roles in growth, biomass production, and lipid accumulation [11,12]. Hence, these nutrients, e.g., nitrogen and phosphorus should be optimized to achieve high biomass productivity.
Several studies have been implied that using wastewater such as poultry leachate, meat processing, and piggery wastewater gives rise to excellent biomass yield compared to industrial wastewater [13,14,15]. Although, the concentration of nitrogen and phosphorus in wastewater from poultry, piggery and wet market would be potential nutrient sources, it might possess extremely high concentrations and need to be diluted before microalgae culturing or cultivation, as it is important for algal growth and wastewater treatment [14,16,17]. The experiment by Markou et al. [13] observed that 25× diluted raw poultry leachate to Chlorella Vulgaris is the optimal condition for biomass productivity with a total yield of 465 mg/g. Kuo et al. [14] examined microalgae Chlorella sp., where they discovered that the highest biomass production was 4730 mg/L in 25% of piggery wastewater. Moreover, among studies related to Scenedesmus sp., there have been relatively few established, and there is a lack of information about a stable growth of the microalgae Scenedesmus sp. cultivation system with WMW replacement.
The response surface methodology (RSM) is a statistical experimental design tool that gives maximum performance in the process. The use of RSM allows the assessment of interaction between the factors, and also allows the development of this design to predict the biomass productivity [18,19]. Cultivation of microalgae and biomass production in the wastewater media, the WMW dilution, and aeration rate, may have the ability to minimize the significant costs of CO2 and flue gas treatment. The current work is motivated by the increasing practice in the applications of microalgae biomass and the implementation of environmentally-friendly tools for recycling of wastewater. The aim of the study was to maximize the biomass production by Scenedesmus sp. based on the optimization for the environmental factors including different concentration of WMW and aerations rates. The efficiency of WMW as a production medium was evaluated based on the GC-MS composition analysis of the biomass yield.

2. Materials and Methods

2.1. Preparation of Wastewater Samples and Microalgae Inoculum

The wet market wastewater (WMW) was obtained in Polyethylene Terephthalate (PET) from a public market located in Rengit Batu Pahat, Johor, Malaysia (1°40′46.4” N 103°08′48.1” E). The collected WMW samples were immediately transferred to the analytical laboratory according to the procedures described by APHA standard [20]. The WMW samples were filtered using a membrane filter (Whatman) with a 0.45 um pore size to remove suspended solids and other microorganisms to avoid the antagonistic competition with Scenedesmus sp. The WMW samples were characterized in terms of physiochemical and heavy metal content based on the standard method according to APHA [20].

2.2. Microalgae Isolation and Identification of Scenedesmus sp.

Scenedesmus sp. was obtained from inland waters in river basin of Endau Rompin, Johor at tropical rainforest located in the southern region of Peninsular Malaysia (between 02°30.711”N 103°20.984”E and 02°30.740”N 103°20.996”E ). The algae samples were collected via 25 um-planktonic net and then kept in a sterilized glass bottle until transferring to the laboratory using a portable cooler box, before it goes under the isolation process. The top of the bottle must be covered with sterile cotton wool plugs and use organic-free water in order to avoid contamination. The isolated algae sample was examined under morphologically in a light microscope (OLYMPUS CX22LED) attached to a digital camera and connected to the computer. The Scenedesmus sp. were identified through its shape, colour, structure, length of the spines, width details of outer cells, and pattern by a field guide according to Prescott [18]. Lastly, in order to confirm the Scenedesmus sp. identification, the process was done according to DNA sequence and blasted using GenBank database online (www.ncbi.nlm.nih.gov/BLAST/) [21].
Extraction of DNA from isolated species was performed using cetyl trimethyl ammonium bromide [22,23]. Five μL of extracted liquids was run on test gel, and as a result, one DNA species was obtained. The 18rS rRNA of nuclear encoded was amplified by polymerase chain reaction (PCR) as it ran repeatedly in 30 cycles of 95 °C, 5 min; 94 °C, 45 s (denaturation); 55 °C, 30 s (annealing); 72 °C, 2 min (DNA synthesis, elongation); 72 °C, 10 min; and 4 °C hold. Following the amplification, the PCR were then purified using a purification kit by Sigma and checked on 1% agarose gel for sequencing preparation. The DNA of Scenedesmus sp. profile was also verified by National Center Biotechnology Information (NCBI) and Molecular Biology Services, Species Barcoding Report; www.base-asia.com [24]. The preparation of Scenedesmus sp. isolated were cultured in Bold Basal Medium (BBM) (Bischoff and Bold) [25] as described in the previous work [26].

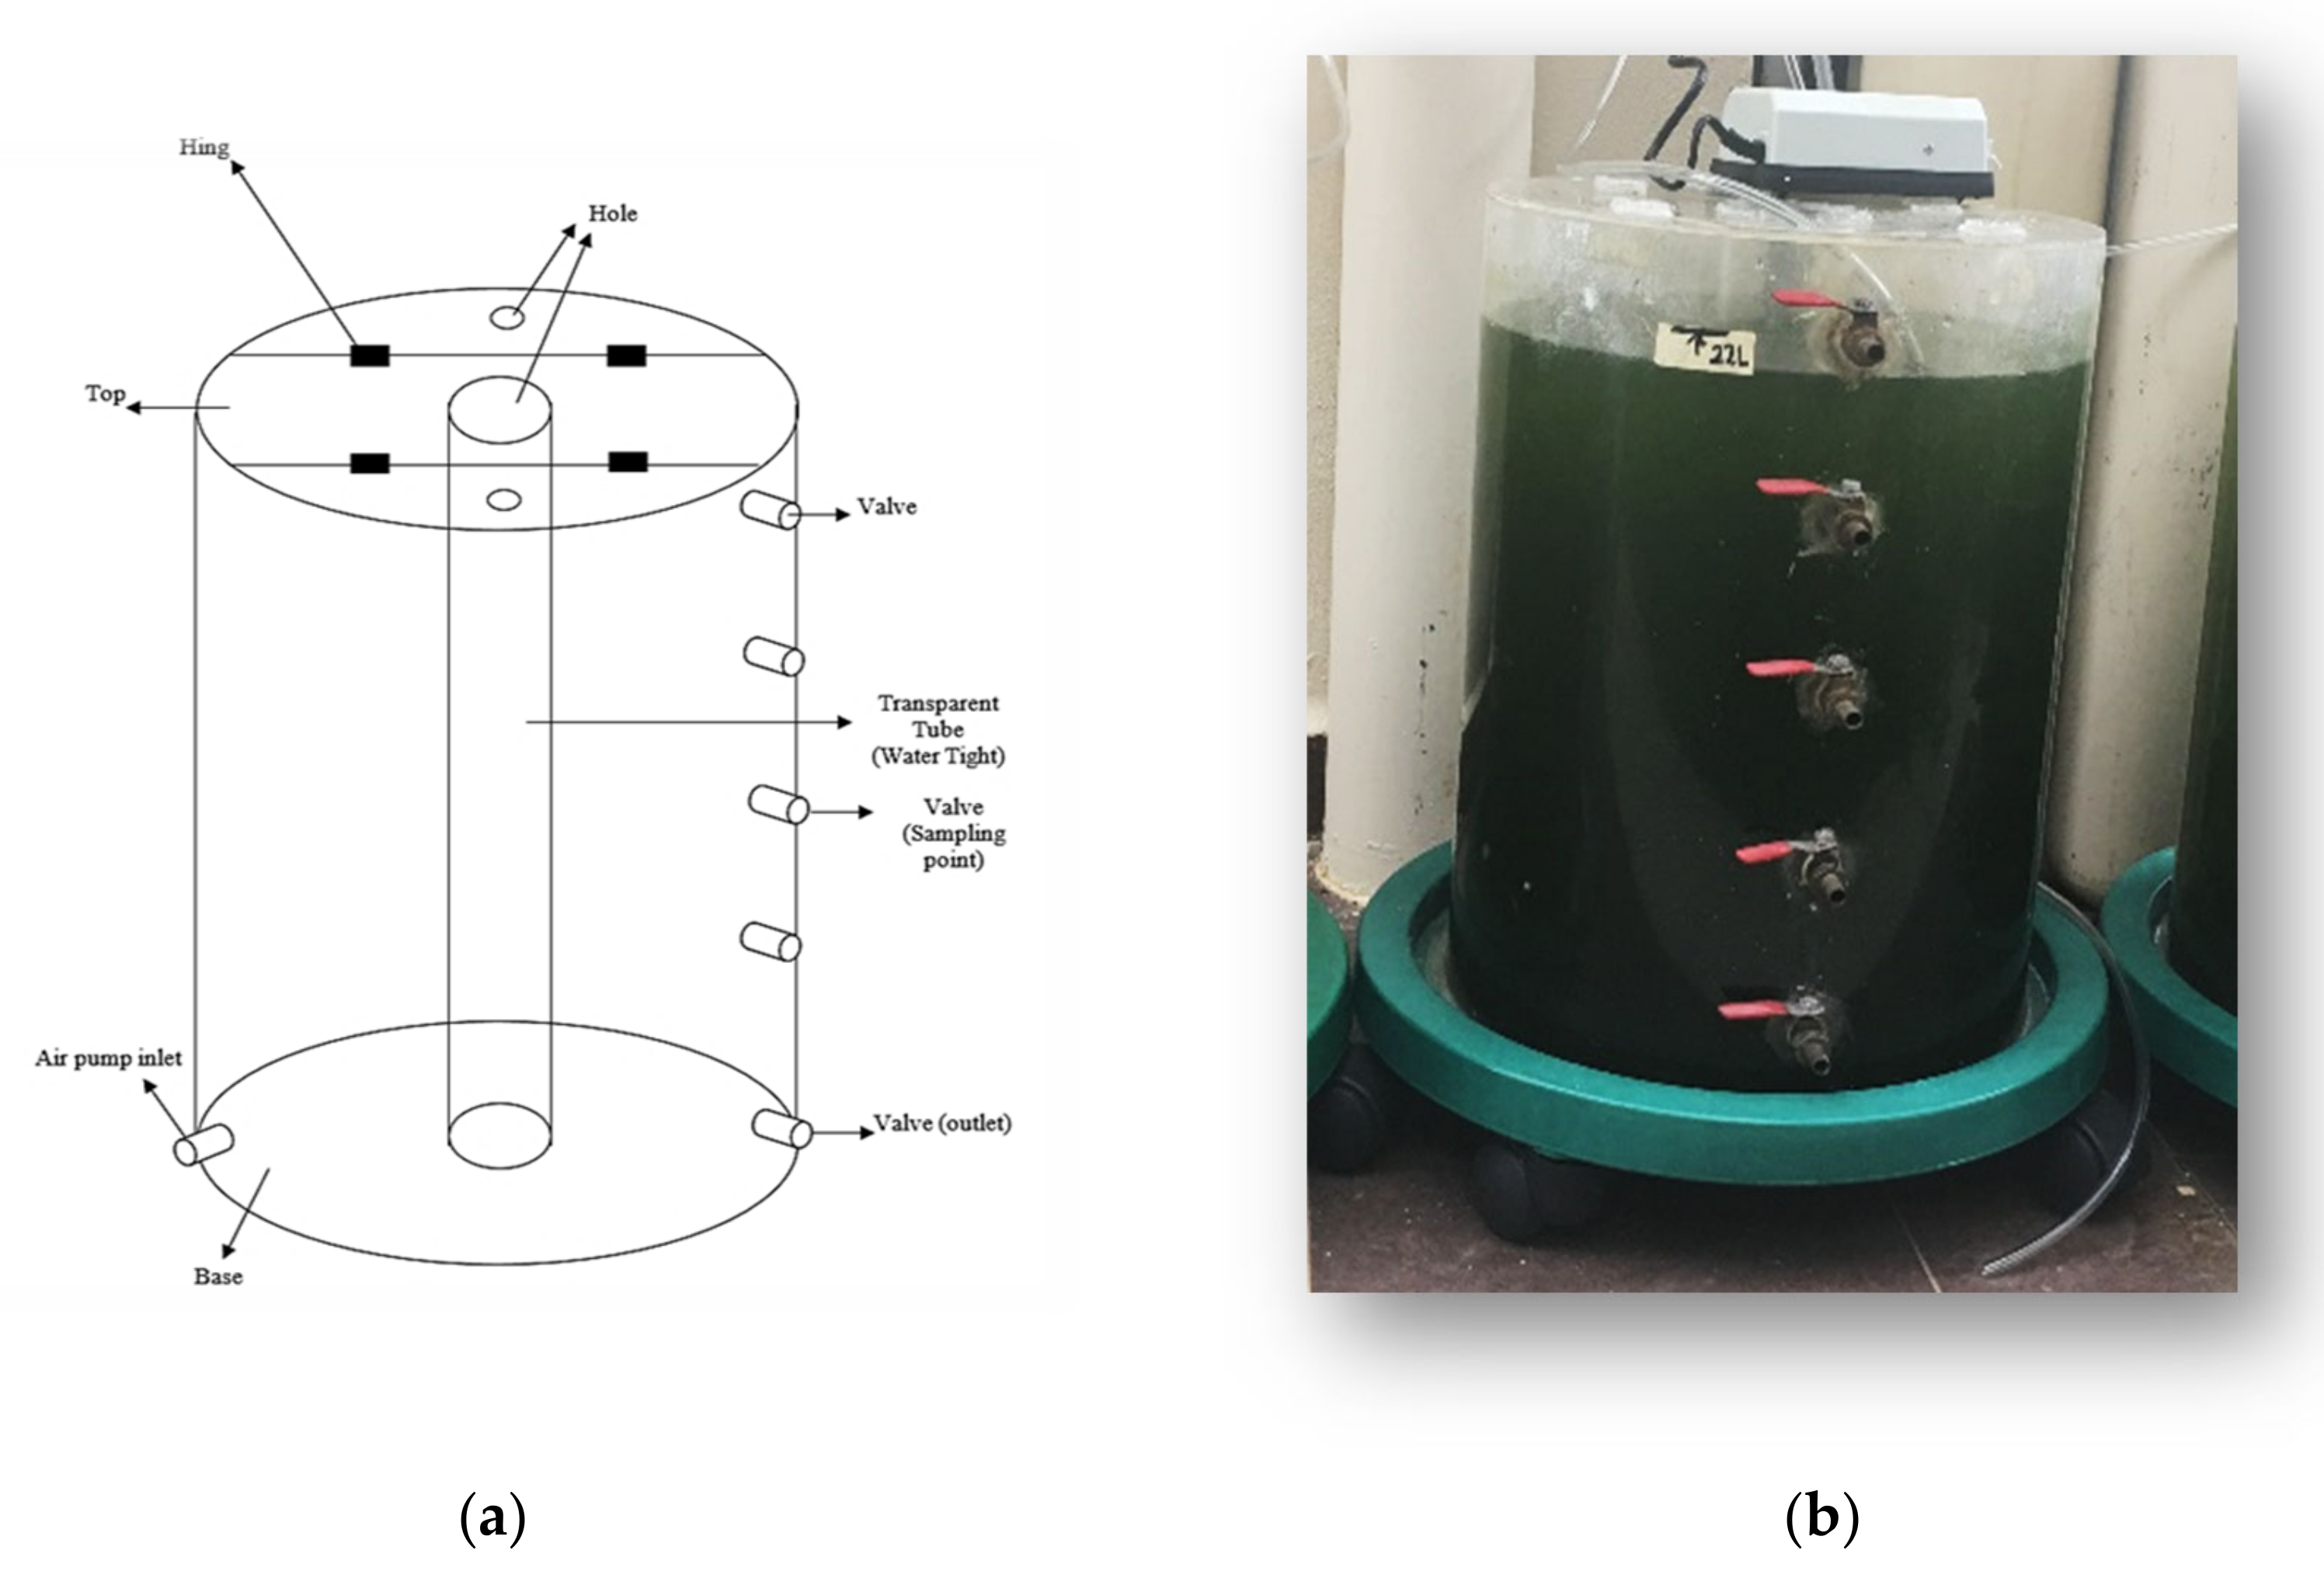
2.3. Experimental Set Up

The biomass production was performed in the photobioreactors scale up depicted in Figure 1. The construction of the photobioreactor was performed based on Yen et al. [27] with some modifications, such as diameter and height of photobioreactor tube (Figure 1a,b). Four tabular vertical closed photobioreactors were designed and constructed using transparent acrylic materials with the total working volume of 25 L. The photobioreactors were washed using Decon 90 detergent for surface disinfection, followed by three washes with sterile distilled water. A total of 20 L with different concentrations of WMW was transferred to each photobioreactor with different aeration rates (triplicates) (Figure 1c). The initial microalgae density used was 8.9 × 10⁶ cells mL−1. The photobioreactors were placed under outdoor sunlight at temperatures ranging from 24 °C to 34 °C. The microalgae were allowed to grow for 14 days before the harvesting process.
The influence of WMW concentrations and aeration rate (independent variables) on biomass productivity and growth rate (dependent variables) of Scenedesmus sp. was assessed through a face centred central composite design (FCCCD) in Design Expert V7.0 software. RSM was used to construct a geometrical model for factors prediction and enabled the independent evaluation of each factor and their interaction within the proposed model. This was proven by the highly significant statistical analysis obtain through RSM.
The experimental result was fitted by a second-order model in the form of quadratic polynomial equation as a function of the independent process variables according to Equation (1) [28].
Y = β 0 + i = 1 k β i x i + i = 1 k β i i x i 2 + i = 1 n i j n β i j x i x j
Here, Y is the predicted response for the reduction percentage β 0 ,   β i ,   β i i and β i j represents the regression coefficients, x i represents the coded variables, and x j represents independent variables in coded form, while k is the number of n dependent variables.
The relationship between the natural variable ε i and coded variables x i is:
x i = ε i M I + I I / 2 M I I I / 2
where x i is the coded variable, ε i is the natural variable, M I is the maximum value of the independent variable, and I I is the minimum value of the independent variable. The minimum, intermediate, and maximum values of each variable were labelled as +1, 0, and −1, respectively. The range and the levels of the variables are stated in Table 1.
The experimental runs were carried out with WMW concentrations (10% to 75%) and aeration rate (0.02 L/min to 4.0 L/min) to study the linear and quadratic model of independent variables and obtain the relationship between the variables coded Equations where x i (coded and real value), x o (real value at the center point of the investigated area), and δ x is the value of step change.
x i = x i x o δ x
The response in terms of biomass productivity and maximum growth rate at different experimental has 21 runs with face-centring and five centre points are given in Table 2, which shows the design of experiments together with the experimental results.
The range of WMW concentrations and aeration rate was adapted for maximum output from previous studies [26,29]. As for graphical analyses of data determination, ANOVA (analysis of variance) was used to define the interaction between the process variables and the responses to estimate the statistical parameters. The statistical software has been used to determine the regression analysis of experimental data; to contour plot the optimized condition and plot the responses surfaces. The statistical significance was determined by the F-test within the same program. The accuracy of the fitted polynomial was decided by the coefficient of R2. The significant model terms were assessed by the probability value (p-value) at 95% confident interval.
However, the purpose of this optimization was to develop the best range for biomass production using WMW. The interactive effects of the independent variable on the dependent one were illustrated by 3D response surface and contour plot.

2.4. Analytical Methods

Determination of Microalgae Biomass Productivity and Specific Growth Rate

The concentrations of Scenedesmus sp. cultivated in photobioreactors were measured by using Haemocytometer. In contrast, the microalgae biomass productivity was determined by the OD650 (the optical density of microalgae culture at 650 nm) for every 24 hrs using DR-6000, UV-Vis Spectrophotometer (Hach-USA). The relationship between the concentrations of the dry biomass and the optical density was estimated using the linear Equations (4) and (5).
Biomass concentration/Dry weight (mg/L) = 458.2 * OD650 + 280.08, (R2 = 0.9454)
The biomass productivity (mg/L/day) was calculated using Equation (5).
Biomass   productivity   P max = x 2 x 1 / t x t 0
where x 2 represent the biomass concentrations in mg/L at the end of the cultivation period ( t x ) and x 1 is the initial biomass concentration at t 0 (day).
Specific growth rate, µmax was calculated from Equation (6) according to Anjos et al. [30].
µ max = ( ln N 2 ln N 1 ) / t 2 t 1
where N1 and N2 are the concentration of microalgae cells at the beginning ( t 1 ) and the end ( t 2 ) of the exponential growth phase, respectively.

2.5. Biomass Characterization by GC-MS

Lipid Extraction Procedure

In order to study the composition of Scenedesmus sp. biomass four boiling chips were placed into the solvent vessel. The solvent vessel was dried in a drying oven to constant weight (about 1 h) at 103 °C. The solvent vessel was placed in the desiccators and allowing it to cool to room temperature (about 30 min). The solvent vessel containing the boiling chips was weight to an accuracy of ±1 mg. The algae pastes were dried in the universal oven for about 24 h.
For lipid extraction, the biomass was harvested in stationary phase at the 14th day using a centrifuge at 3500 rpm for 10 min. The cells were dried at 105 °C for 24 h. A fixed 50 mg of dried algae paste were homogenised with mortar and pestle, then blended with anhydrous sodium sulphate surrogate standard spiking solution poured onto the sample mixed using the Soxhlet extraction procedure. The homogenised pastes were transferred to an extraction thimble. The n-Hexane (95%) solvent was filled into the vessel for about 250 mL, and the vessel was attached to the Soxhlet apparatus. The sample was extracted at a temperature of 130 °C for 6 hrs. The solvent vessel was to evaporate the solvents. The vessel containing the oil residue was placed in a drying oven at 103 °C and heated to a constant weight. The vessel containing the oil was allowed to cool to a room temperature by putting it in the desiccators for about 30 min.
The process was followed by quantifying the qualitative analysis using GC-MS equipment to screen the possible chemical compounds available in this microalgae oil. The sample was analysed through DB5 MS column (30 m × 0.32 mm ID × 0.25 μm film thickness). The initial temperature was set at 130 °C for 5 min and slowly increased up to 200 °C at 8 °C per minute. The temperature was then maintained at 200 °C for two minutes before continued to increase at the rate of 5 °C per minute until it reached 280 °C. Once it reached 280 °C, the temperature was maintained for 15 min. The peaks received were identified based on library research or from the National Institute of Standard and Technology (NIST) database).

3. Results and Discussion

3.1. Characteristic of WMW

The physiochemical and heavy metals parameters of the WMW are discussed with the comparison to effluent standard limits set by the Environmental Quality Act of Malaysia, (1974) under Sewage & Industrial Effluent Regulation, DOE, [31,32] discharge limit (Table 3). The result shows that the characteristics of the WMW are highly variable to the regulation standard.
The WMW has TN (960.83 mg/L), TP (173.33 mg/L), and TOC (1580 mg/L). Danial et al. [33] reported that WMW has 66 mg/L of TP and 288 mg/L of TN. The effluents discharge is highly polluted in terms of BOD and COD with the values of 1784 mg/L and 3507 mg/L, respectively; which are tremendously high compared to the allowable effluents in standard A of 20 mg/L (BOD), 80 mg/L (COD), and standard B of 50 mg/L (BOD), 200 mg/L (COD). The high BOD and COD concentrations could be explained by the major contributors of the blood residues from meat cutting, chicken carcasses, and seafood entrails. These concentrations are slightly lower than the values reported by Rosmawani et al. [34], who obtained BOD (2350 mg/L) and COD (5120 mg/L).
The oil and grease (1169 mg/L) in WMW most probably came from vehicle emissions, and washing and cleaning procedure exceeded the allowable standard discharge of 10 mg/L in standard B. These concentrations were much greater than the WMW reported by Jais et al. [35], who revealed the presence of 5.22 mg/L, but lower than Rosmawanie et al. [34], where the value was 2500 mg/L. The differences between physiochemicals of different WMW might be due to the activities of the wet market in terms of seasonality and geography.
The pH value showed an acceptable concentration (6.8–7.4) compared to the effluent standard, indicating that this wastewater was in neutral to alkaline states and perfectly adequate for microalgae growth [35,36]. Total suspended solid could be seen in higher state 125 NTU, since all the others parameter exceeded more than the regulation standard. Nevertheless, the heavy metal content of the WMW was lower than the allowable limit, except for Fe and Zn. This phenomenon of exceeded heavy metals (Fe, Zn, Cu) is typically associated with natural processes as well as contaminants from human activities, transportation of animals, receiving and holding, washing and cleaning procedure, and labours behaviour [37].

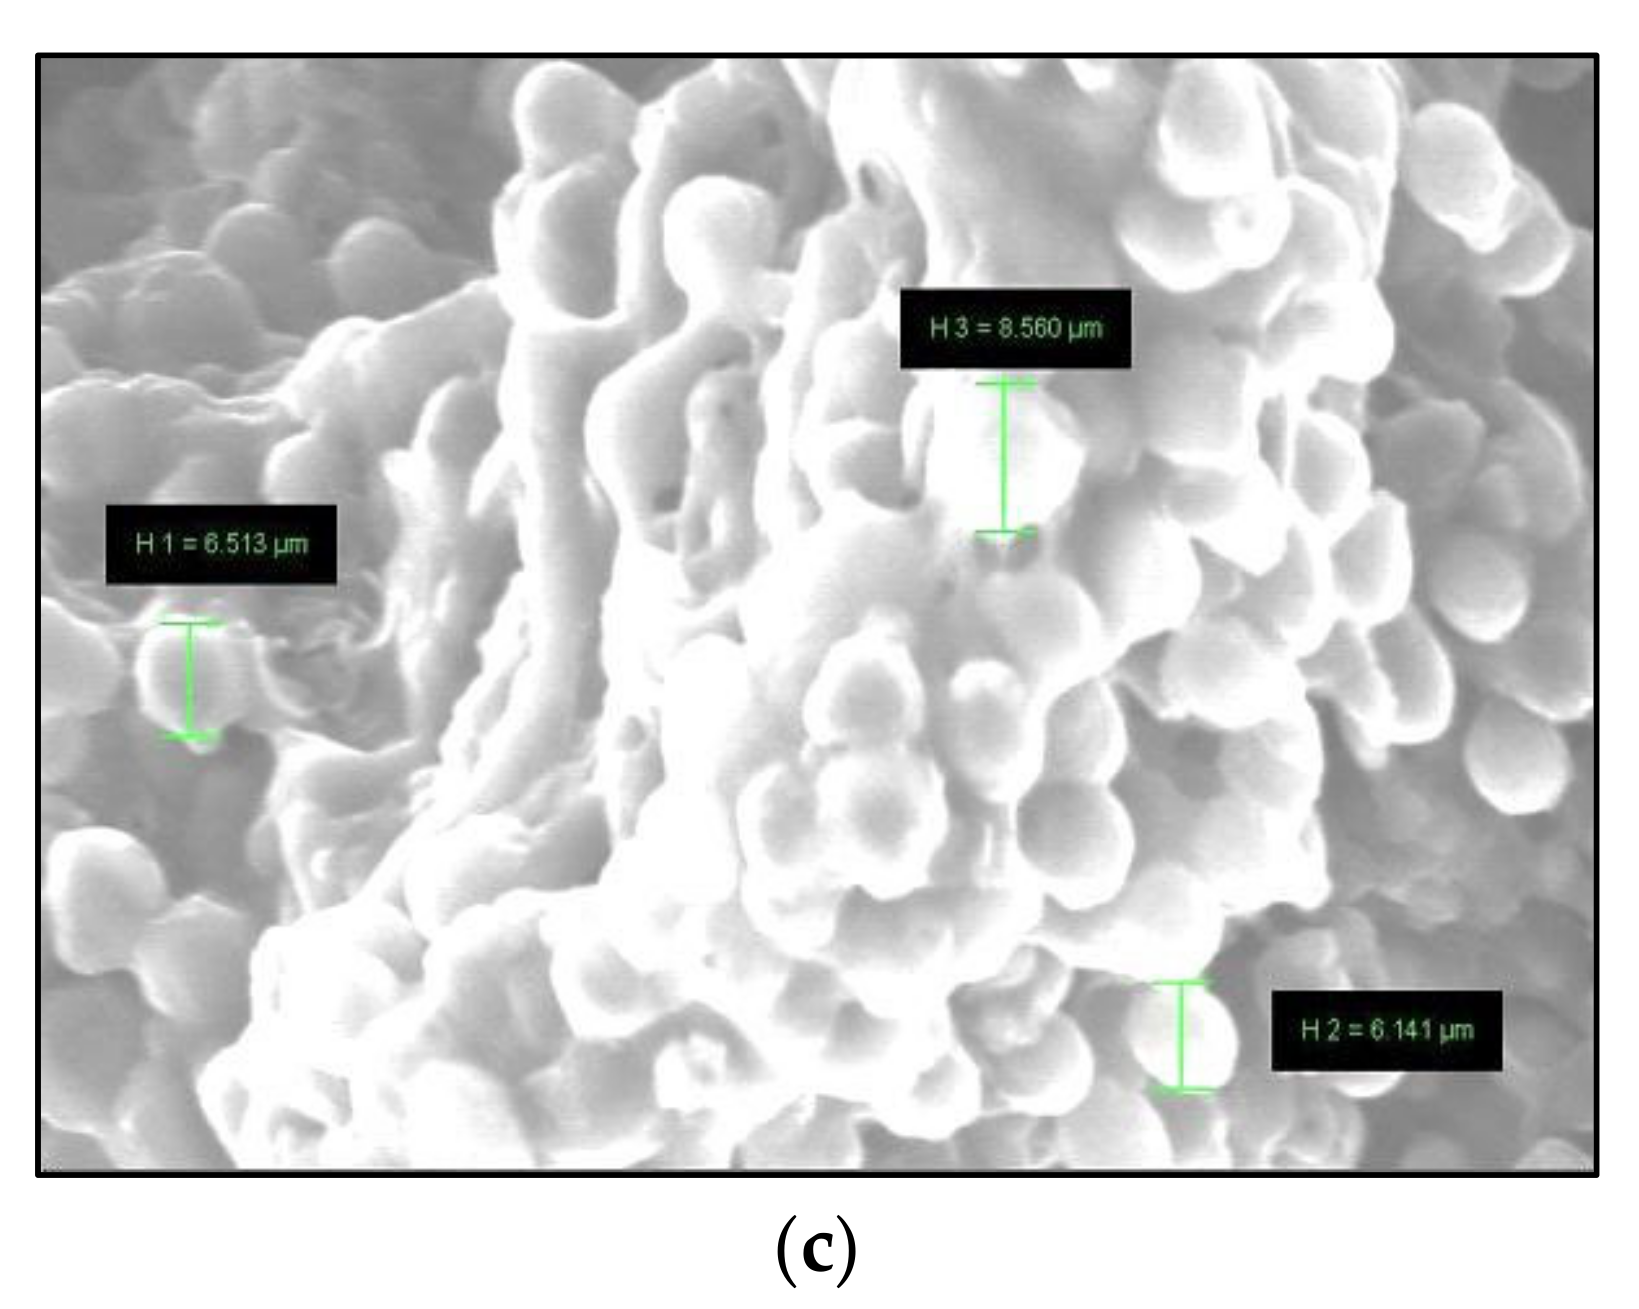
3.2. Isolation and Morophological

The obtained single colony was isolated and identified based on the morphological features observed under scanning electron microscope (SEM) and optical light microscope. Scenedesmus sp. showed in liquid green colour, unicellular and appeared to form colonies. They were slightly curved, attached side by side, were laterally arranged in linearly or zigzag; and appeared as spiny, ovoid, or fusiform as shown in Figure 2a,b. The correlation of Scenedesmus sp. cells number in a colony has the amount of protoplasm which is required for cell division.
Microscopic and SEM analysis allowed preliminary identification of the microalgae as Scenedesmus sp. It is observed that chloroplast in Scenedesmus sp. is located in the cellular periphery. The cells were aligned in a flat plate approximately ranged from 15–22 um in length depending on different growth stages. Similarly, Alam et al. [38] have reported that the Scenedesmus sp. was ornamentation four-celled structure with or without spines and prominently depends on rough surface cell morphology. The DNA identification at the molecular level was extracted with sufficient amount for PCR amplification from Scenedesmus sp. And were amplified as 18 s rRNA gene fragments in the range between 1500–2154 bp in size.
The molecular neighbour-joining analyses using the longest 18S rRNA query coverage are depicted in Figure 3. The microalgal genomic DNA in molecular phylogenetic tree analysis indicated that this strain had a close relationship with Scenedesmus sp. The 18S rRNA of Scenedesmus sp. partial gene sequence obtained was matched with the database available in GenBank and found high similarity to Scenedesmus sp.at about 98% to BLAST database with an accession number of JQ315576.1. Gour et al. [39] have reported the partial gene sequencing of 18S rRNA of Scenedesmus sp.

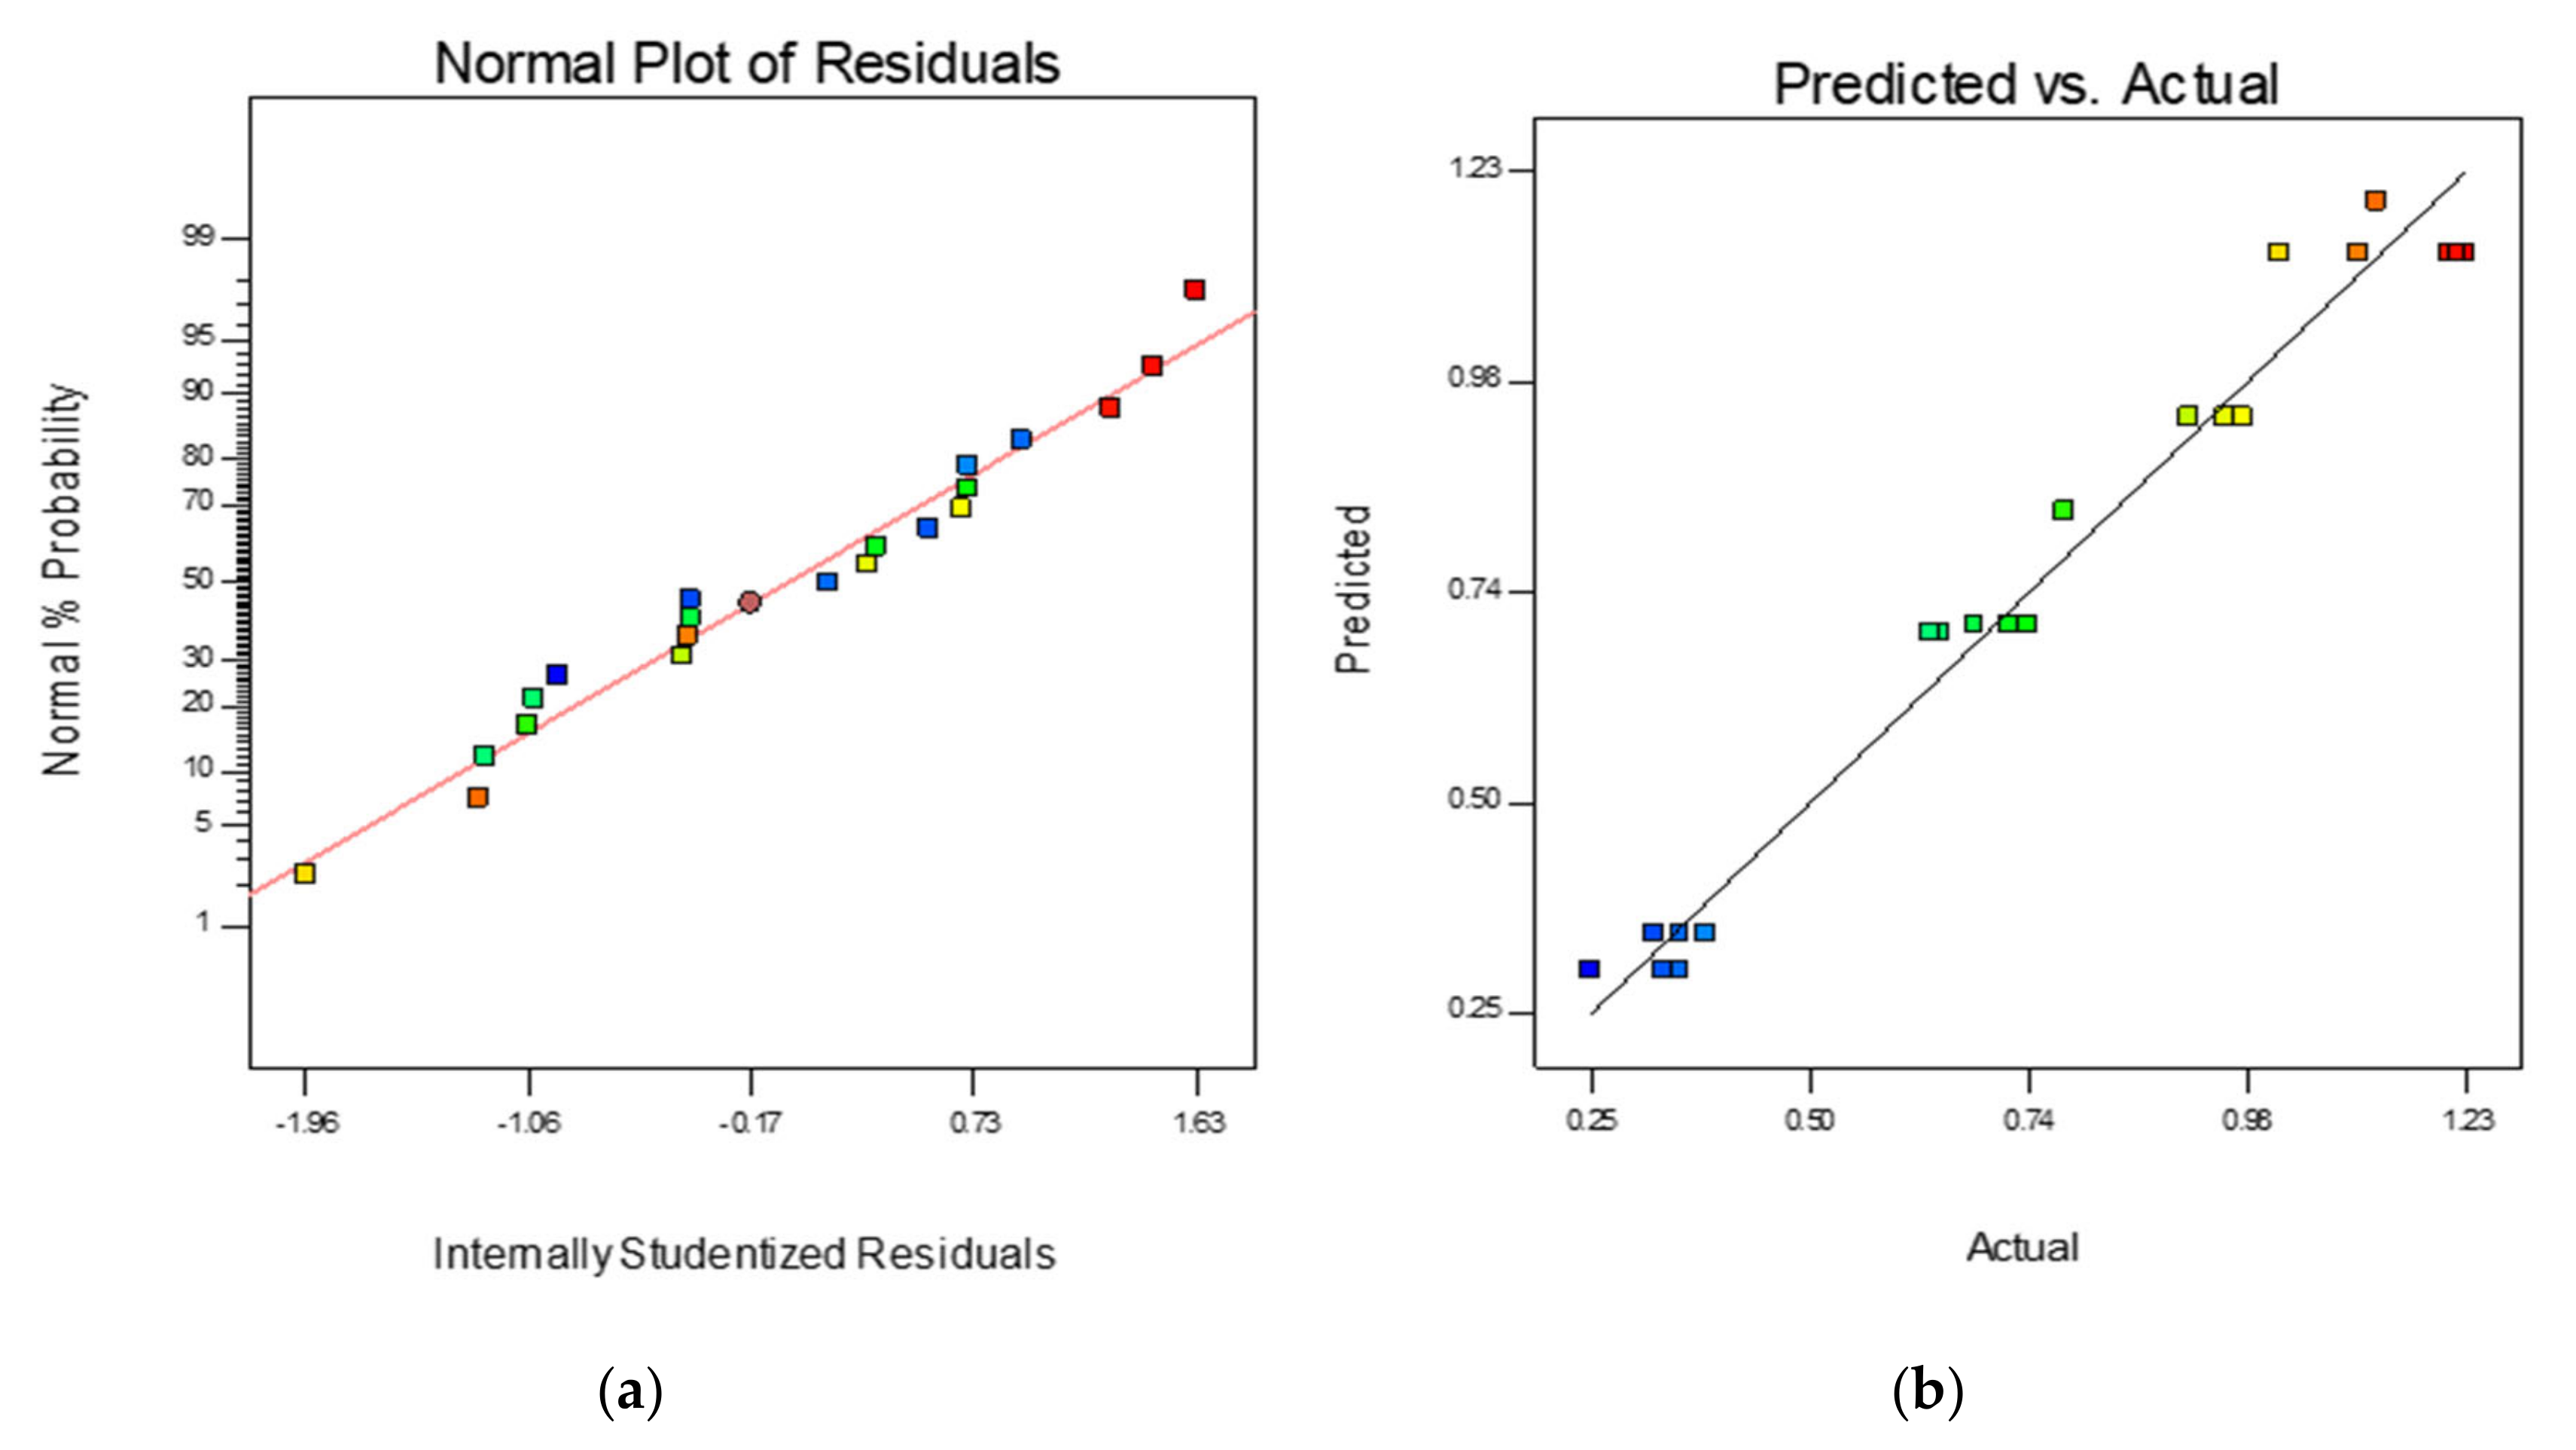
3.3. Optimization of Biomass Production

The final biomass productivity and maximum growth rate of Scenedesmus sp. cultivated under different WMW concentrations and aeration rates are attainable and have a strong influence on the volumetric or productivity. Hence, it is necessary to understand how this response can be optimized. Based on Table 4, the analysis of variance (ANOVA) for the response surface model for biomass productivity was significant in the regression model, F value of 106.80, and p-value less than 0.0001, stated that the model obtained was statistically at 95% of confidence level.
The R2 value was 0.9727, which indicates that the model was fit in the comparison between the actual and predicted values for biomass productivity. In addition, the adjusted and predicted determination coefficients (R2 adj = 0.9636 and R2 pred = 0.9464) were in a good match with R2. Moreover, it showed that the lack of fit was not significant, revealing that the indicated model terms were significant for the considered response. The developed equation is a regression model for biomass production that is stated as follows, where A is WMW and B is aeration rate;
Biomass   productivity   =   65.97   +   14.20 A     12.11 B     11.35 B     11.02 A 2     23.09 B 2
The smaller p-value and larger F-value (Prob. > F) make the model more significant of the corresponding coefficient [40]. According to Table 4, the lack of fit value was 1.37, and there was a 30% possibility that lack of fit value can occur due to numerical noise and showed that this model is good. The noise signal was measured by the adequacy precision, where it comprised the predicted value at the average prediction error and the design points. The adequacy precision in the present work was 22.739, which means this desirable ratio is greater than 4, and the developed model can be used to guide the design space. In order to check the data analysis of the experiment, the adequacy of the developed model was the main part for this design. The adequacy of the model was evaluated using a diagnostic plot for normal probability plot and predicted vs. actual plot, and can be seen in Figure 4a,b. Figure 4a illustrates the residual points were located on the straight line for biomass productivity response and considered that the residual points were in normal distribution for the response of the model. Hence, the predicted vs. actual plots obtained from the presented model indicated that the data were matched well between actual and predicted (Figure 4b).
Little scattering plots in the data were expected, as it could be presumed that the data were normally distributed. Figure 5a,b demonstrates the contour plot and three-dimensional (3D) surface response as a function of the WMW concentration and aeration rate. The 3D surface shows that the maximum response for biomass productivity was 74.33 mg/L/d at 42.5% of WMW and aeration rate of 3.25 L/min. Increasing the aeration rate (4.0 L/min) and decreasing the WMW (10%) had the minimum result of biomass productivity (11.36 mg/L/d). In other words, the effects of WMW were opposite to the aeration rate effects when the figure revealed that, by the increasing of WMW and decreasing of aeration rate, the biomass productivity was increasing accordingly. Mutual interaction of WMW concentration and aeration rate also achieved the highest growth rate by using statistical analysis. The results of the quadratic model for maximum growth rate in the form of analysis of variance (ANOVA) are as shown in Table 5.
The quadratic model predicted for the response variables of growth rate using significant coefficients are stated in Equation (8). According to Table 5, the second order polynomial function indicated that the model was significant, as the F-test was 105.53 with the probability value of less than 0.0001. In addition, the ANOVA for the model indicated the suitability of the model, which is summarized as follows: Lack of fit was insignificant (p = 0.2434), the R2 was high (R2 = 0.9724), the R2 implies this cultivation model was statistically significant and in reasonable agreement with the adjusted R2 value of 0.9631, and the prediction R2 = 0.9497. All the mutual interactions were found to be significant (p < 0.05) in the model. It was observed that the data for maximum growth rate to attain these values were slightly varied in each run (Table 2). This was obvious, as the cultivation where A (WMW) and B (aeration rate) were strongly independent variables in increased biomass production and growth rate of microalgae.
Maximum growth rate = 1.13 + 0.25A + 0.071B + 0.050AB − 0.19A2 − 0.37B2
Basically, to achieve the highest growth rate, both WMW and aeration rate should be increased, since microalgae is inhibited by high nutrients and photosynthetic oxygenation to grow with. However, the cultivation conditions in the present study that increased the aeration rate and WMW could adversely reduce biomass growth rate and biomass productivity. Figure 6a,b show the normal plot of residual and a plot of predicted vs. actual values. These plots in each figure indicated that the residual points were in normal distribution. Therefore, Figure 7a,b were the graphical interpretation of 3D surface and contour plot effect of WMW and aeration rate on the maximum growth rate, respectively. At low WMW and low aeration rate (10% and 2.00 L/min), maximum growth rate were 0.35 day−1, 0.25 day−1, and 0.33 day−1, respectively (Run 1, 2, and 3). When WMW and aeration rate were increased by 42.5% and 3.25 L/min, the maximum growth rate was the highest, (1.22, 1.21, and 1.02 day−1). However, the response at the highest WMW = 75% and aeration rate = 3.25 L/min (Run 14) also obtained the similar value of 1.13 day−1 (Table 2).
Furthermore, by increasing the aeration rate at 4.5 L/min, the biomass productivity and maximum growth rate were among the lowest. This situation might be due to the increase of shear stress and breakage of microalgae cell of high aeration rate since a study by Alipourzadeh et al. [41] had the same situation, where they recorded the optimum aeration rate at 3.1 L/min and negative growth effect at 5 L/min. The determination for optimum performance was established by a desirability function that can come out with one or more responses. The goal fields in the model had five options; maximize, target, in range, and equal to. Meanwhile, the main goal of this model was to maximize biomass productivity and growth rate. In the present model, the numerical optimization was chosen in order to find the optimum point that suited the desirability function as shown in Figure 8.
The result of optimization, as shown in the figures, had only one solution suggested by this model, where the optimum values of WMW and aeration rate were 64.26% and 3.08 L/min, with 0.969 desirability. To approve this optimization by the model, three runs of the experiment from the optimization were conducted (Table 6). The validation experiment was 68.32 mg/L/d (biomass productivity) and 1.16 day−1 (maximum growth rate) as described in Table 6. The percentages of error between model and experimental values were found to be 6% and 2.25%, which were less than 5%. The results were close to the FCCCD using RSM and clearly showed that the optimization conditions can be reproduced. This also proved that RSM approach was appropriate for optimizing microalgae biomass production.
The optimization for the present study significantly provided an input to our knowledge and understanding of microalgae cultivation based on the WMW as media and aeration rate to produce more yield of microalgae biomass. Table 7 shows the comparison of biomass productivity and maximum growth rate from other previous studies. In the current work, the usage of wastewater was up to 60% (WMW) compared to previous studies by Chen et al. [42] and Karpagam et al. [18], with the optimum value of 40% (piggery wastewater) and 31.25% (sugar industry effluent) recorded. Moreover, the result of this study shows that the aeration rate was similar as compared to other studies, where the optimum range in the current work was 3.08 L/min and able to produce biomass at 72.70 mg/L/d and at the growth rate of 1.19 day−1. Therefore, it was suggested that the optimization by RSM has a great potential for biomass production due to the low cost of using WMW as medium.

3.4. GC-MS Analysis of Scenedesmus sp.

The GCMS of Scenedesmus sp. cultivated from WMW revealed 13 fatty acid compounds with their chemical formula, compound nature molecular weight, retention time area, and biological activity, which are illustrated in Table 8. The peak at the retention time of 38.833, which can be seen in Figure 9, is named hexadecane; it was the major hydrocarbon compound which can be employed for biodiesel production. The second, less prominent peak at 16.17% indicated the presence of glaucine. Glaucine also known as an antitussive agent in orally ingestion to increase airway conductance in humans [44]. Meanwhile, the third less significant peak at 48.108 retention time with a peak area of 8.33% showed the characteristic of phytol; a synthetic form of vitamin E and vitamin K1 and has been suggested to have metabolic properties as well as anti-inflammatory effects [45]. These bioactive metabolites of Scenedesmus sp. has beneficial interest in the development of new products for chemical, cosmetic, medical and these chemical compositions may be potentially significant as chemical value added in biotechnology applications.

4. Conclusions

The most obvious finding to emerge from this study is that the application of WMW for Scenedesmus sp. was successful. It was shown that the photobioreactor used in this study effectively produced valuable biomass in massive quantities in outdoor conditions with the optimum aeration rate and WMW concentration. The examination and assessment of the potential of microalgae cultivation using photobioreactor in outdoor conditions was tremendously successful by using response surface methodology. This statistical analysis proved that a second order polynomial function fitted well with the experimental results. Both WMW concentration and aeration rate significantly (p < 0.05) affected the biomass productivity. Significantly, Scenedesmus sp. biomass showed strong potential for several applications such as bio-based material industry or any related industries. It can be concluded that the chemical compound was in line in terms of value from other commercial algae species eg; Spirulina sp., Chlorella sp. This study, together with new inventions, will likely contribute efficiently to a sustainable product that can be developed by using microalgae associated with wastewater treatment.

Author Contributions

Conceptualization, N.M.A. and A.A.-G.; methodology, N.M.A. and P.G.; software, N.M.A. and A.A.-G.; validation, N.M.A., A.A.-G. and F.A.R.; formal analysis, N.M.A.; investigation, N.M.A.; resources, R.M.S.R.M. and N.M.S.; data curation, N.M.A. and P.G.; writing—original draft preparation, N.M.A.; writing—review and editing, N.M.A. and A.A.-G.; visualization, N.M.A.; supervision, R.M.S.R.M. and N.M.S.; project administration, M.S.M.; funding acquisition, M.S.M. and R.M.S.R.M. All authors have read and agreed to the published version of the manuscript.

Funding

This research was funded by Ministry of Higher Education (MOHE), Malaysia, for the financial support from Fundamental Research Grant Scheme grant (K219) (FRGS/1/2019/TK10/UTHM/03/3) and ‘Konsortium Kecemerlangan Penyelidikan’ fund with pro-ject title ‘Research Consortium for Wastewater Resource Recovery (RCWRR)’.

Acknowledgments

The authors thank the parties involved in this project, especially to the Min-istry of Higher Education (MOHE), Malaysia, for the financial support from Fundamental Re-search Grant Scheme grant (K219) (FRGS/1/2019/TK10/UTHM/03/3) and ‘Konsortium Kecemer-langan Penyelidikan’ fund with project title ‘Research Consortium for Wastewater Resource Re-covery (RCWRR)’.

Conflicts of Interest

The authors declare no conflict of interest.

References

  1. Rawat, I.; Kumar, R.R.; Mutanda, T.; Bux, F. Dual role of microalgae: Phycoremediation of domestic wastewater and biomass production for sustainable biofuels production. Appl. Energy 2011, 88, 3411–3424. [Google Scholar] [CrossRef]
  2. Abdel-Raouf, N.; Al-Homaidan, A.A.; Ibraheem, I.B.M. Microalgae and wastewater treatment. Saudi J. Biol. Sci. 2012, 19, 257–275. [Google Scholar] [CrossRef] [Green Version]
  3. Hena, S.; Fatimah, S.; Tabassum, S. Cultivation of algae consortium in a dairy farm wastewater for biodiesel production. Water Resour. Ind. 2015, 10, 1–14. [Google Scholar] [CrossRef] [Green Version]
  4. Jena, J.; Pradhan, N.; Nayak, R.R.; Dash, B.P.; Sukla, L.B.; Panda, P.K.; Mishra, B.K. Microalga Scenedesmus sp.: A Potential Low-Cost Green Machine for Silver Nanoparticle Synthesis. J. Microbiol. Biotechnol. 2014, 24, 522–533. [Google Scholar] [CrossRef]
  5. Badwy, T.M.; Ibrahim, E.M.; Zeinhom, M.M. Partial replacement of fish meal with dried microalga (Chlorella spp. and Scenedesmus spp.) in nile tilapia (Oreochromis Niloticus) Diets. In Proceedings of the 8th International Symposium on Tilapia in Aquaculture, Cairo, Egypt, 12–14 October 2008; pp. 801–811. [Google Scholar]
  6. Garcia-Moscoso, J.L.; Obeid, W.; Kumar, S.; Hatcher, P.G. Flash hydrolysis of microalgae (Scenedesmus sp.) for protein extraction and production of biofuels intermediates. J. Supercrit. Fluids 2013, 82, 183–190. [Google Scholar] [CrossRef]
  7. Ren, H.-Y.; Liu, B.-F.; Ma, C.; Zhao, L.; Ren, N. A new lipid-rich microalga Scenedesmus sp. strain R-16 isolated using Nile red staining: Effects of carbon and nitrogen sources and initial pH on the biomass and lipid production. Biotechnol. Biofuels 2013, 6, 143. [Google Scholar] [CrossRef] [Green Version]
  8. Pahazri, N.F.; Mohamed, R.; Al-Gheethi, A.; Kassim, A.H.M. Production and harvesting of microalgae biomass from wastewater: A critical review. Environ. Technol. Rev. 2016, 5, 39–56. [Google Scholar] [CrossRef]
  9. Chiu, S.-Y.; Kao, C.-Y.; Chen, T.-Y.; Chang, Y.-B.; Kuo, C.-M.; Lin, C.-S. Cultivation of microalgal Chlorella for biomass and lipid production using wastewater as nutrient resource. Bioresour. Technol. 2015, 184, 179–189. [Google Scholar] [CrossRef] [PubMed]
  10. Al-Gheethi, A.; Mohamed, R.; Jais, N.M.; Efaq, A.N.; Halid, A.A.; Wurochekke, A.A.; Amir-Hashim, M.K. Influence of pathogenic bacterial activity on growth of Scenedesmus sp. and removal of nutrients from public market wastewater. J. Water Health 2017, 15, 741–756. [Google Scholar] [CrossRef] [Green Version]
  11. Singh, S.P.; Singh, P. Effect of temperature and light on the growth of algae species: A review. Renew. Sustain. Energy Rev. 2015, 50, 431–444. [Google Scholar] [CrossRef]
  12. Latiffi, A.; Atikah, N.; Mohamed, R.; Saphira, R.M.; Apandi, N.M.; Tajuddin, R.M. Experimental assessment on effects of growth rates microalgae Scenedesmus sp. in different conditions of ph, temperature, light intensity and photoperiod. Key Eng. Mater. 2017, 744, 546–551. [Google Scholar] [CrossRef] [Green Version]
  13. Markou, G.; Iconomou, D.; Muylaert, K. Applying raw poultry litter leachate for the cultivation of Arthrospira platensis and Chlorella vulgaris. Algal Res. 2016, 13, 79–84. [Google Scholar] [CrossRef]
  14. Kuo, C.M.; Chen, T.Y.; Lin, T.H.; Kao, C.Y.; Lai, J.T.; Chang, J.S.; Lin, C.S. Cultivation of Chlorella sp. GD using pig-gery wastewater for biomass and lipid production. Bioresour. Technol. 2015, 194, 326–333. [Google Scholar] [CrossRef]
  15. Lu, Q.; Zhou, W.; Min, M.; Ma, X.; Chandra, C.; Doan, Y.T.; Ma, Y.; Zheng, H.; Cheng, S.; Griffith, R.; et al. Growing Chlorella sp. on meat processing wastewater for nutrient removal and biomass production. Bioresour. Technol. 2015, 198, 189–197. [Google Scholar] [CrossRef] [PubMed]
  16. Apandi, N.M.; Mohamed, R.M.S.R.; Al-Gheethi, A.A.S.; Kassim, A.H.M. Wastewater Phycoremediation by Microalgae for Sustainable Bioproduct Production. In Handbook of Algal Technologies and Phytochemicals; CRC Press: Boca Raton, FL, USA, 2019; pp. 3–12. [Google Scholar]
  17. Zhu, L.; Wang, Z.; Shu, Q.; Takala, J.; Hiltunen, E.; Feng, P.; Yuan, Z. Nutrient removal and biodiesel production by integration of freshwater algae cultivation with piggery wastewater treatment. Water Res. 2013, 47, 4294–4302. [Google Scholar] [CrossRef] [PubMed]
  18. Karpagam, R.; Raj, K.J.; AshokKumar, B.; Varalakshmi, P. Characterization and fatty acid profiling in two fresh water microalgae for biodiesel production: Lipid enhancement methods and media optimization using response surface methodology. Bioresour. Technol. 2015, 188, 177–184. [Google Scholar] [CrossRef]
  19. Skorupskaite, V.; Makareviciene, V.; Levisauskas, D. Optimization of mixotrophic cultivation of microalgae Chlorella sp. for biofuel production using response surface methodology. Algal Res. 2015, 7, 45–50. [Google Scholar] [CrossRef]
  20. American Public Health Association; American Water Works Association; Water Environment Federation. Standard Methods for the Examination of Water and Wastewater; American Public Health Association: Washington, DC, USA, 2012. [Google Scholar]
  21. BLAST. Basic Local Alignment Search Tool; National Center for Biotechnology Information: Bethesda, MD, USA, 2011. Available online: http://blast.ncbi.nlm.nih.gov/Blast.cgi (accessed on 12 October 2011).
  22. Medlin, L.; Elwood, H.J.; Stickel, S.; Sogin, M.L. The characterization of enzymatically amplified eukaryotic 16S-like rRNA-coding regions. Gene 1988, 71, 491–499. [Google Scholar] [CrossRef] [Green Version]
  23. Cullings, K.W. Design and testing of a plant-specific PCR primer for ecological and evolutionary studies. Mol. Ecol. 1992, 1, 233–240. [Google Scholar] [CrossRef]
  24. Main Page: Base Asia. Available online: https://base-asia.com/ (accessed on 13 February 2017).
  25. Bischoff, H.C. Some Soil Algae from Enchanted Rock and Related Algal Species; Phycological Studies IV; University of Texas Publ.: Austin, TX, USA, 1963; Volume 6318, pp. 1–95. [Google Scholar]
  26. Apandi, N.; Mohamed, R.; Al-Gheethi, A.; Gani, P.; Ibrahim, A.; Kassim, A.H.M. Scenedesmus Biomass Productivity and Nutrient Removal from Wet Market Wastewater, A Bio-kinetic Study. Waste Biomass Valorization 2018, 10, 2783–2800. [Google Scholar] [CrossRef]
  27. Yen, H.-W.; Hu, I.-C.; Chen, C.-Y.; Chang, J.-S. Design of Photobioreactors for Algal Cultivation. Biofuels Algae 2014, 23–45. [Google Scholar] [CrossRef]
  28. Gani, P.; Sunar, N.M.; Matias-Peralta, H.; Jamaian, S.S.; Latiff, A.A.A. Effects of different culture conditions on the phycoremediation efficiency of domestic wastewater. J. Environ. Chem. Eng. 2016, 4, 4744–4753. [Google Scholar] [CrossRef]
  29. Gani, P.; Sunar, N.M.; Matias-Peralta, H.; Mohamed, R.M.S.R.; Latiff, A.A.A.; Parjo, U.K. Extraction of hydrocarbons from freshwater green microalgae (Botryococcus sp.) biomass after phycoremediation of domestic wastewater. Int. J. Phytoremediat. 2017, 19, 679–685. [Google Scholar] [CrossRef] [PubMed]
  30. Anjos, M.; Fernandes, B.D.; Vicente, A.A.; Teixeira, J.A.; Dragone, G. Optimization of CO2 bio-mitigation by Chlorella vulgaris. Bioresour. Technol. 2013, 139, 149–154. [Google Scholar] [CrossRef] [PubMed] [Green Version]
  31. Mustafa, M. The Environmental Quality Act 1974: A significant legal instrument for implementing environmental policy directives of Malaysia. IIUM Law J. 2012, 19. [Google Scholar] [CrossRef]
  32. Department of Environment Malaysia. DOE Environmental Requirements: A Guide for Investor, Appendix K1 & K2: Acceptable Condition of Sewage Discharge of Standard A and B. 2010; Department of Environment Malaysia: Putrajaya, Malaysia, 2008. [Google Scholar]
  33. Danial, O.; Salim, M.R.S.; Salmiati, S. Nutrient removal of grey water from wet market using sequencing batch reactor. Malays. J. Anal. Sci. 2016, 20, 142–148. [Google Scholar] [CrossRef]
  34. Rosmawanie, M.; Mohamed, R.; Al-Gheethi, A.; Pahazri, F.; Amir-Hashim, M.K.; Nur-Shaylinda, M.Z. Sequestering of pollutants from public market wastewater using Moringa oleifera and Cicer arietinum flocculants. J. Environ. Chem. Eng. 2018, 6, 2417–2428. [Google Scholar] [CrossRef]
  35. Jais, N.M.; Mohamed, R.; Al-Gheethi, A.; Hashim, M.K.A. The dual roles of phycoremediation of wet market wastewater for nutrients and heavy metals removal and microalgae biomass production. Clean Technol. Environ. Policy 2017, 19, 37–52. [Google Scholar] [CrossRef]
  36. Difusa, A.; Talukdar, J.; Kalita, M.C.; Mohanty, K.; Goud, V.V. Effect of light intensity and pH condition on the growth, biomass and lipid content of microalgae Scenedesmus species. Biofuels 2015, 6, 37–44. [Google Scholar] [CrossRef]
  37. França, S.; Vinagre, C.; Caçador, I.; Cabral, H.N. Heavy metal concentrations in sediment, benthic invertebrates and fish in three salt marsh areas subjected to different pollution loads in the Tagus Estuary (Portugal). Mar. Pollut. Bull. 2005, 50, 998–1003. [Google Scholar] [CrossRef]
  38. Alam, M.M.; Mumtaz, A.S.; Hallenbeck, P.C.; Shah, S.A.; Abidin, S.Z.U.; Inam, F. Morphological characterization, growth appraisal, and probing biofuels potential of newly isolated Scenedesmus sp. from desert Cholistan. Microsc. Res. Tech. 2019, 82, 2079–2088. [Google Scholar] [CrossRef]
  39. Gour, R.S.; Chawla, A.; Singh, H.; Chauhan, R.S.; Kant, A. Characterization and Screening of Native Scenedesmus sp. Isolates Suitable for Biofuel Feedstock. PLoS ONE 2016, 11, e0155321. [Google Scholar] [CrossRef] [PubMed]
  40. Behera, S.K.; Meena, H.; Chakraborty, S.; Meikap, B.C. Application of response surface methodology (RSM) for optimiza-tion of leaching parameters for ash reduction from low-grade coal. Int. J. Mining Sci. Technol. 2018, 28, 621–629. [Google Scholar] [CrossRef]
  41. Alipourzadeh, A.; Mehrnia, M.; Sani, A.H.; Babaei, A. Application of response surface methodology for investigation of membrane fouling behaviours in microalgal membrane bioreactor: The effect of aeration rate and biomass concentration. RSC Adv. 2016, 6, 111182–111189. [Google Scholar] [CrossRef]
  42. Chen, J.; Lee, Y.; Lai, W.; Chen, S.; Chiang, T. Optimization of simultaneous biomass production and nutrient removal by mixotrophic Chodatella sp. using Box-Behnken experimental design. Int. Proc. Chem. Biol. Environ. Eng. 2015, 84, 83–87. [Google Scholar] [CrossRef]
  43. Imamoglu, E.; Demirel, Z.; Dalay, M.C. A response surface methodology study for the protein production of Chlorella sp. Int’l. J. Adv. Chem. Engg. Biol. Sci. 2014, 1, 76–79. [Google Scholar]
  44. Chang, L.; Hagel, J.M.; Facchini, P.J. Isolation and Characterization of O-methyltransferases Involved in the Biosynthesis of Glaucine in Glaucium flavum1. Plant. Physiol. 2015, 169, 1127–1140. [Google Scholar] [CrossRef] [PubMed] [Green Version]
  45. De Moraes, J.; de Oliveira, R.N.; Costa, J.P.; Junior, A.L.G.; de Sousa, D.P.; Freitas, R.M.; Allegretti, S.M.; Pinto, P.L.S. Phytol, a Diterpene Alcohol from Chlorophyll, as a Drug against Neglected Tropical Disease Schistosomiasis Mansoni. PLoS Negl. Trop. Dis. 2014, 8, e2617. [Google Scholar] [CrossRef] [PubMed] [Green Version]
Figure 1. Cultivation of microalgae Scenedesmus sp. for biomass production: (a) Closed tubular photobioreactor diagram, (b) and (c) Scenedesmus sp. cultivation in photobioreactor using wet market wastewater and aeration.
Sustainability 13 02216 g001aSustainability 13 02216 g001b
Figure 2. Morphology of Scenedesmus sp. (a) and (b) observed under a light compound (×40), (c) Scheme 18. s rRNA.
Sustainability 13 02216 g002aSustainability 13 02216 g002b
Figure 3. Identification of microalgae Scenedesmus sp. and green algae molecular neighbour-joining analysis.
Sustainability 13 02216 g003
Figure 4. Design expert plot, (a) normal probability plot, (b) predicted vs. actual for biomass productivity.
Sustainability 13 02216 g004
Figure 5. Design expert plot; (a) contour plot, (b) 3D response surface for biomass productivity.
Sustainability 13 02216 g005
Figure 6. Design expert plot; (a) normal probability plot, (b) predicted vs. actual for maximum growth rate.
Sustainability 13 02216 g006
Figure 7. Design expert plot; (a) contour plot, (b) 3D response surface for maximum growth rate.
Sustainability 13 02216 g007
Figure 8. Ramps of microalgae biomass production using WMW concentration and aeration.
Sustainability 13 02216 g008
Figure 9. GC-MS analyses of Scenedesmus sp. biomass grown on wet market wastewater.
Sustainability 13 02216 g009
Table 1. Experimental factors and their set up level.
VariablesSymbolLevel
−1 (Min)0 (Medium)1 (Max)
Wet Market Wastewater (WMW) Concentration (%)A104575
Aeration rate (L/min)B0.022.014.00
Table 2. Actual factor and response values of Scenedesmus sp. cultivation.
RunActual Factor ValuesResponse Values
Biomass Productivity (mg/L/d)Maximum Growth Rate (µmax/d)
Wet Market Wastewater Concentration (%)Aeration Rate (L/min)Actual (Experiment)Predicted (RSM Model)Actual (Experiment)Predicted (RSM Model)
110221.3321.70.350.3
210221.4521.70.250.3
310223.5621.70.330.3
475271.2369.350.720.7
575262.3669.350.680.7
675271.2669.350.740.7
7104.511.3215.060.320.34
8104.511.2615.060.480.34
9104.532.5615.060.350.34
10754.522.5222.830.960.94
11754.523.4522.830.920.94
12754.522.3122.830.980.94
13103.2535.6341.250.640.69
14753.2572.2368.961.131.19
1542.5258.3256.330.630.69
1642.54.525.4129.750.780.83
1742.53.2563.2565.911.231.13
1842.53.2574.3365.911.111.13
1942.53.2563.7565.911.021.13
2042.53.2568.4565.911.211.13
2142.53.2562.1265.91.221.13
Table 3. Characteristic of wet market wastewater.
ParameterConcentration (mg/L)Effluent Standard, mg/L EQA, (1974)
AB
Physiochemical
Chemical Oxygen Demand, COD3506 ± 25980200
Biological Oxygen Demand, BOD1784 ± 85.872050
Total Phosphorus, TP169.75 ± 4.03510
Total Nitrogen, TN961.38 ± 1.5nana
Total Organic Carbon, TOC1539 ± 47.4nana
Dissolve oxygen, DO3.72 ± 1.1nana
Turbidity (NTU)125 ± 9.6nana
pH7.18 ± 0.266.0–9.05.5–9.0
Oil and Grease1169 ± 105.912020
Total Suspended Solids225 ± 13.1450100
Heavy metals
Ferum, Fe5.05 ± 0.115
Cadmium Cd0.0172 ± 0.430.010.02
Chromium, Cr0.194 ± 1.520.21
Zinc, Zn4.85 ± 1.7311
Arsenic, As0.015 ± 2.310.050.1
Copper, Cu0.598 ± 5.470.21
Lead, Pb0.0764 ± 6.060.10.5
Table 4. ANOVA (analysis of variance) for the response surface quadratic model of biomass productivity of Scenedesmus sp. in wet market wastewater.
SourceSum of SquaresdfMean SquareF Valuep-Value
Model10,657.1452131.43106.8<0.0001
A—WMW2688.2912688.29134.7<0.0001
B—Aeration rate2473.5312473.53123.94<0.0001
AB1192.4111192.4159.75<0.0001
A2366.831366.8318.380.0563
B21643.6311643.6382.360.4584
Residual299.361519.96
Lack of Fit76.5325.5
Pure Error222.861218.571.370.2981
Cor Total10,956.520
R2 = 0.9727, Adj. R2 = 0.9636, Pred. R2 = 0.9464, Adeq precision = 22.739.
Table 5. ANOVA for the response surface quadratic model of maximum growth rate of Scenedesmus sp. in WMW.
SourceSum of SquaresdfMean SquareF Valuep-Value
Model2.1750.43105.53<0.0001
A-WMW0.8810.88213.64<0.0001
B-Aeration rate0.0710.0717<0.0009
AB0.0310.037.28<0.0165
A20.1210.1227.94<0.0001
B20.4310.43105.22<0.0001
Residual0.062150.004
Lack of Fit0.01830.006
Pure Error0.044120.0041.590.2434
Cor Total2.2420
R2 = 0.9724, Adj. R2 = 0.9631, Pred. R2 = 0.9497, Adeq precision = 26.045 growth rate.
Table 6. Comparison of FCCCD result with validation experiment.
Face Centred Central Composite Design (FCCCD) ResultValidation Experiments
WMW
(%)
Aeration rate
(L/min)
Predicted Biomass Productivity
(mg/L/d)
Predicted Maximum Growth Rate
(day−1)
Biomass Productivity
(mg/L/d)
Error, %Maximum Growth Rate
(day−1)
Error, %
64.263.0872.691.1968.3261.162.25
Table 7. Comparison of the present study findings with previous studies.
MicroalgaeMedium SourceMedium ConcentrationAeration RateBiomass ProductivityMaximum Growth RateReferences
Chodatella sp.Piggery wastewater40%40 L/h.Lna0.31 day−1Chen et al., [42]
Chlorella sp.Wastewater sludge11.4%na2300 mg/L/dnaSkorupskaite, Makareviciene & Levisauskas, [19]
Coelastrella sp.Sugar industry effluent31.25%na61.5 mg/L/dnaKarpagam et al., [18]
Chlorella sp.F/2 mediumna2.35L/minna0.21 day−1Imamoglu, Demirel & Dalay, [43]
Chlorella vulgarisBG 11na3.1 L/min0.65 g/LNaAlipourzadeh et al., [41]
Scenedesmus sp.Wet market wastewater64.26%3.08 L/min72.70 mg/L/d1.19 day−1This study
Table 8. GC-MS chemical composition and biological activity.
Peak No.Retention Time, RT (min)CompoundChemical FormulaCompound NatureMolecular Weight (g/mol)Area (%)Biological Activity
132.2365GlaucineC21H25NO4Alkaloid355.43416.1627Anti-inflammator,
Antitussive
233.0176UndecaneC11H24Alkane156.314.2863Anti-inflammator,
Antimicrobial
338.8833HexadecaneC16H34Alkane226.4424.8907Antimicrobial
Antifungal
439.8269Furan, 3-methyl-C5H6OAromatic organic82.1025.2256Antioxidant,
Antibacterial,
540.4035Spiro[4.5]decan-1-oneC15H24O2 2369.5345Anti-inflammatory
644.0729Cyclohexasiloxane, dodecamethyl-C12H36O6Si6Aromatic444.9248.8785Antioxidant,
Antimicrobial
Antifungal
748.104PhytolC20H40ODiterpene2968.3319Anti-inflammator,
Anticancer,
Antioxidant
Diuretic
Fragrance
848.6124Heptasiloxane, 1,1,3,3,5,5,7,7,9,9,11,11,13,13-tetradecamethyl-C14H44O6Si7 5045.2457Antimicrobial,
Anti-inflammatory
Antiseptic
956.39151,1,1,5,7,7,7-Heptamethyl-3,3-bis(trimethylsiloxy)tetrasiloxaneC13H40O5Si6Oxygenated diterpene444.972.6927Antimicrobial,
Anti-inflammatory
1059.8722Hexa-t-butyl-3,5-dioxa-1,2,4-trisilolane---3.325-
1162.34122-Methyl-6-(5-methyl-2-thiazolin-2-ylamino)pyridineC10H13N3S-207.32.4042Antioxidant
1263.117Hexasiloxane, tetradecamethyl-C14H42O5Si6Organic silicon4586.5538Antimicrobial
Anti-inflammatory
1364.3384Methyl (5-hydroxy-1H-benzimidazol-2-yl)carbamateC9H9N3O3Benomyl207.22.4685Anticancer
Antiviral infections,
Antifungal
Publisher’s Note: MDPI stays neutral with regard to jurisdictional claims in published maps and institutional affiliations.

