Abstract
Rapid and uncontrolled changes in land use patterns due to urbanization negatively affect urban rainfall-runoff processes and flood hazard. In this study, a method that included different sustainable drainage solutions, such as green infrastructure (GI) usage for flood hazard mitigation with various scenarios on a geographic information system (GIS) platform within a 1653 ha catchment of the Kağıthane Stream in İstanbul, Turkey is presented. Developed scenarios are as follows: scenario one (SN1) is the current situation; scenario two (SN2) used green roof application for buildings and a permeable surface for roads; scenario three (SN3) used only green roof application for buildings; scenario four (SN4) used a rainwater barrel for collecting roof water, a swale canal for collecting road water, and added additional structures to open areas to observe urbanization; scenario five (SN5) considered multiple GI implementations; and scenario six (SN6) considered full urbanization. The results indicate that greener infrastructure implementation provides benefits in reducing both the runoff coefficient and the peak flowrate, and the flood inundation area and number of structures affected by flood risk were decreased. The integrated evaluation system, which consisted of the geographic information system and the assessment of the 1D HEC-RAS hydrologic model, was applied to evaluate the GI usage and flood mitigation.
1. Introduction
Global urbanization is proceeding rapidly and has increased in recent years [1]. According to the United Nations, half of the world’s current population live in urban areas, and this rate is expected to increase to 68% by 2050. The projections show that the population will shift from rural areas to urban areas, and this will increase the population in urban areas by 2.5 billion people by 2050 [2]. According to World Bank data, Turkey’s urban growth rate was 31.5% in 1960 and rose to 75.1% in 2018. This rate is well above the world average of 55.2% [3]. The rapid increase in the urban population brings unplanned urbanization, climate change, environmental degradation, and natural disasters such as floods. Among all types of natural hazards threatening the world, floods are probably the most devastating, widespread, and frequent [4]. Several studies describe how rapid urbanization affects flooding. Flooding can be exacerbated by increased amounts of impervious surfaces produced by urbanization or by natural hazards that reduce the supply of vegetation that can absorb rainfall [5].
Alam et al. 2014 identified impervious surfaces, which are increasing with urbanization, as the reason for increasing peak rainfall [6]. Elhamid et al. 2020 stated that the runoff coefficient increased because of urban growth, which increased peak discharges [7]. Lee and Samuel 2018 observed property loss from floods recorded each year from 2003 to 2012 across Seoul’s 25 administrative districts. They found that pavement causing high imperviousness such as residential, commercial, industrial (factories), and transportation (roads and railways) pavement have adverse impacts on losses due to flood [8]. Shi et al. 2005 stated that flood events have increased in the last five years because of the rapid increase in urbanization [9]. Sanne et al. 2015 studied climate change and urbanization. In this context, they made a probability analysis using global data such as flood risk and adaptation strategies. In the study, an integration of global data and probability data was provided. While flood hazard and land use were used as global data, climate change data that changes together with urbanization were used as probability data. This helps countries that are developing limited data, such as Indonesia, evaluate global scale flood risk. The main reason for increasing flood risk was due to the rate of increase in urbanization for 2030 [10]. Sunhak et al. 2019 stated that flood risk does not always increase with the urbanization increment and that flood risk can be controlled by planned urbanization [11]. For example, they presented the work done by Fox D. et al. 2012 in France [12] and the work done by F. Luino. et al. 2012 in Italy. Accordingly, they stated that, in France, although flood risk decreased because of river maintenance, despite the increase in construction/urbanization, in Italy, the flood risk increased because of the increase in the irregular land use plan [13].
Because of unplanned urbanization, more floods have started to occur in recent years [14]. For this reason, there is an important relation between planned/unplanned urbanization and flooding. Planned or sustainable urbanization, with the use of sustainable drainage solutions, provides optimal flooding results. For example, Adelye and Rustum (2011) analyzed the cause of encountered flooding problems to recommend sustainable management solutions [15]. Data on climate, drainage infrastructures, and physical planning regulations were collected and extensively analyzed. These were combined with evidence from field inspection and discussion with stakeholders, including relevant government departments, university researchers, and selected residents. The investigation revealed that, contrary to popular wisdom, climate change or unusually high rainfall is not the primary cause of the flooding problem in Lagos. Rather, the increased urbanization and lax planning laws in relation to the city were to blame. They argued that a lasting solution to flooding problems will require the incorporation of a sustainable drainage system within the existing flood management strategy for the city.
Sustainable drainage systems include green infrastructure (GI) solutions by managing surface water runoff from the urban environment under sustainable urbanization. Green infrastructure intends to preserve and/or treat stormwater runoff at its sources, with decentralized micro-scale control measures in order to reduce the impact to the soil, vegetation, and aquatic systems and includes systems such as rain gardens, bio-retention, green roofs, swales, rainwater barrels, water-holding tanks, and pervious paving [16]. In addition, GI provides a more sustainable solution and it is strongly recommended for hydraulic control of discharges. [17]. The European Commission defines green infrastructure as a strategically planned network of natural and semi-natural areas with other environmental features designed and managed to deliver a wide range of ecosystem services. It incorporates green, or blue (if aquatic ecosystems are concerned), spaces and other physical features in terrestrial (including coastal) and marine areas. On land, GI is present in rural and urban settings [18].
In recent years, green infrastructure has been widely used for sustainable drainage solutions in many cities and there are members of the World Green Infrastructure Network (WGIN). Germany, Canada, Australia, Spain, and France have been members since 2009. In addition, the United Kingdom, Scandinavia, Portugal, New Zealand, Mexico, Colombia, Brazil, Chile, Iran, Israel, Greece, Italy, China, Japan, Taiwan, South Korea, Vietnam, India, Hong Kong, Singapore, and Norway have been members sine 2019 [19]. This membership shows that green infrastructure’s importance is increasing daily.
In 2013, Seattle’s City Council Resolution 31,459 established green stormwater infrastructure (GSI) as a critical aspect of a sustainable drainage system and challenged the city to rely on GSI to manage stormwater runoff whenever possible [20]. GSI’s purpose is to use a slow and filtered drainage system instead of a piping system, so they completed several GSI projects that consisted of Street Edge Alternatives, the 110th Cascade Project, the Broadview Green Grid, the High Point Natural Drainage System, the Pinehurst Green Grid, and the Ballard Natural Drainage System (phase 1). These projects used bio-swales, bio-detention basins, street planters, rain gardens, porous pavements, etc. and they reduced negative impacts to the stream by 74 to 99 percent [21]. Augustenborg is a city in southern Sweden where flooding occurred in the past. A sustainable urban drainage system, such as a green infrastructure solution, was used for collecting the stormwater. The results indicated that flooding had been mitigated [22]. Liu, Chen, and Peng 2014 evaluated the storm runoff for infiltration, retention, and storage capacity via a simple model. The green infrastructure system benefits to flooding mitigation were limited under large storms so they suggested that an integrated GI system should be used to provide effective flooding reduction. They proposed that planning urban landscapes with appropriate GI is important for sustainable development [23]. Schubert et al. 2017 studied GI’s usage, such as rainwater tanks and infiltration trenches, using a hydraulic model for different scenarios. They found that full implementation of GI reduced the flood area compared with the partial implementation area and the existing situation [24].
Liu et al. 2016 used the long-term hydrologic impact assessment-low impact development 2.1 (L-THIA-LID 2.1) model to examine land use and climate change on hydrology and water quality. The L-THIA-LID 2.1 model gave information about runoff volume, allowed impervious area, pollutant loads of land use, and how many buildings converted to green solutions [25]. Ma Y. et al. 2004 used the 2001 land use map and predicted that the 2050 land use would cause the runoff’s volume to increase with this change. They determined the green infrastructure’s implementation on land use with the L-THIA-LID 2.1 model. The results showed that the runoff volume and the pollutant loads were the same for 2001 and 2050 [26].
Mobilia et al. analyzed the green roof impact in pilot-scale studies. They selected some areas as green roofs and used 15 cm depth vegetation. According to the rational method, a runoff coefficient of about 0.05–0.35 for lawn areas (the most pervious) was selected. They selected a runoff coefficient of 0.1 for the green roof. Their results indicated that the reduction in the runoff coefficient was about 20% and that the runoff coefficient increase of the permeable surfaces increases according to the sustainable stormwater management principles [27].
These research studies indicate that green infrastructure plays an important role in sustainable urbanization and drainage for preventing flood risk. There is even policy and regulation in some regions, such as the European Union, Germany, Singapore, the United Kingdom, the United States of America, and South Australia. For example, the UK’s law includes sustainable drainage solutions for flood risk management in new developments [28].
In this study, sustainable drainage solutions were researched for sustainable urbanization and flood mitigation under an environmental aspect. Because urbanization produces impervious surfaces, stormwater does not infiltrate to the groundwater and more surface flow collects in the traditional pipe solution, and, thus, the frequency of flood events and water pollution increases. This environmental problem should be evaluated with sustainable drainage solutions (SDS) such as green infrastructure systems, which prevent flooding. The case study was studied and researched. This study included different scenarios for every SDS. Accordingly, scenario-based flood inundation maps were generated with a geographical information system (GIS)-based one-dimensional (1D) HECRAS hydraulic model. The flood risk maps are available on the flood information portal for many countries. These maps are in a format downloadable by the citizens in order to examine the flood areas and to take the necessary measures, but the map models are not intervened/edited at the detailed project construction stages. In addition, although flood maps prepared in developed countries contain a more detailed dataset, flood maps prepared for developing countries are generally prepared by considering only the elevation data. When flood maps are evaluated in Turkey, it has been learned that factors such as the runoff coefficient and flow direction are not taken into account in flood mapping, but are only formed according to the area set below elevation [29]. For this reason, the necessity of preparing a flood map that is changed with input values has arisen for evaluating how to reduce the flood risk that will occur with increasing urbanization with sustainable drainage solutions. The impact of sustainable drainage solutions created with different scenarios on flood areas was evaluated on the GIS platform. GIS is a new technology that provides efficient and fast results to create accurate flood maps and has been preferred primarily in the preparation of flood maps in recent years [30].
Waghwala et al. have determined that the risk of flooding increases with the transition from low urbanization to high urbanization. In this context, they obtained faster and more reliable results by preparing the land use and land cover (LULC) data required for flood mapping with GIS assistance [31]. Suriya et al. have investigated the land use changes associated with urbanization using GIS. The results indicated that urbanization increased the flooded area and the water depth. They also stated that GIS adds great versatility to hydrological analysis because of its spatial data processing and management capabilities [32].
2. Materials and Methods
2.1. Description of the Study Area
The study area was the Kağıthane Stream watershed located in the European side of Istanbul, Turkey. The Kağithane Stream is one of the problematic flood risk streams of the Istanbul metropolis and is connected to the Haliç (Golden Horn) at the southwest part of the Istanbul Bosphorus by passing through Eyüp, Şişli and Kağıthane districts. In addition, none of the region’s flood prevention works have yet solved the problem. In the downstream part, it remains within the highly dense and highly populated residential areas, and many industrial structures, which are important for the national economy, are along the stream route. In the upstream part, it remains in non-residential areas. If this area is opened for development and urbanization, flood risk increases will be expected.
The Kağıthane Stream’s length is approximately 35 + 458 km and the watershed is 17,317.57 hectares. The last 7 km with a 1653 hectares watershed area was assessed. The location of the Kağıthane Stream watershed is shown in Figure 1. The rainiest seasons are autumn and winter, and summer is hot and sunny. Precipitation amounts to about 814 mm per year; the wettest months are December, January, and February [33]. The topography of this area is flat with a slightly inclined terrain and slopes varying between 0–2%, 6–12%, and 20–45% within the basin boundaries, as shown in Figure 2.
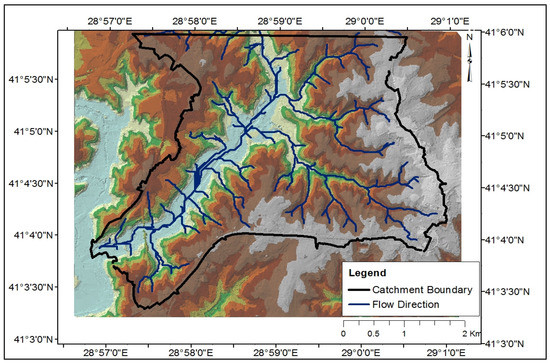
Figure 1.
Study area.
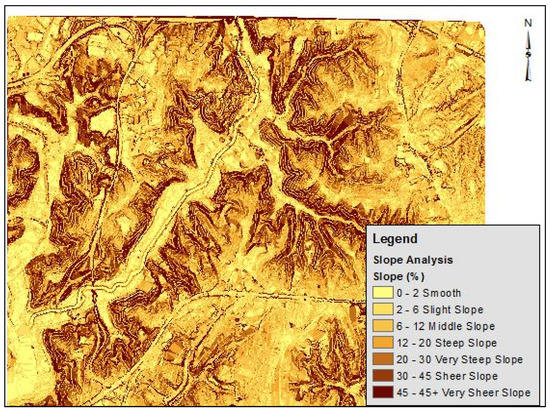
Figure 2.
Slope map of the study area.
2.2. Data Collection-Processing-Analysis
For the evaluation of the land use, two different maps were evaluated. Base maps with a scale of 1:1000 that included 60 sheets for the year 2013 were obtained from the Istanbul Metropolitan Municipality and a DEM (digital elevation model) for the year 2013 was gathered from the Geographical Information System Department of İstanbul Water and Sewerage Administration (İSKİ). Data related to the existing stormwater network, stream centerline, and the Kağıthane Stream hydraulic report were obtained from İSKİ. All data were stored using a geodatabase. Geodatabase software logic provides the common application logic used throughout ArcGIS for accessing and working with all geographic data in a variety of files and formats. This supports working with the geodatabase, and it includes working with shapefiles, computer-aided drafting (CAD) files, triangulated irregular networks (TINs), grids, CAD data, imagery, geography markup language (GML) files, and numerous other GIS data sources [34].
The second necessary component for a GIS is the data arrangement, such as format-projection transformations. All data were rearranged on the GIS platform. The main data requirements included the DEM and the base maps. Digital elevation models are geospatial datasets that contain elevation values sampled according to a regularly spaced rectangular grid. They can be used in terrain analysis, 3D visualizations, and hydrological modelling [35]. The accurate hydrological model depends on the quality of the DEM, so the removal of the sink was needed from the DEM surface. Sink, an inherent artefact, is a spurious pixel that has an elevation value lower than its surrounding pixels (i.e., no outlet facilitating the movement of water downslope) [36]. The hydrology toolset of the ArcGIS spatial analyst extension helped remove the sink. The other analyses explained, in their hydrological modelling sections, the DEM.
The other input is the base maps. They are added in CAD format and converted to shapefiles. These base maps are classified to the layers. The layers have been determined by the hydrological requirement based on the literature. For example, Apollonio et al. 2020 stated that the reliability of flood risk assessment depends on key inputs such as the return period and the spatial distribution of elements. Accordingly, they distributed element structures, infrastructure as input, buildings, other structures, roads, and specialized/unspecialized land use as output [37]. In this study, a similar assumption was accepted. The building areas, road areas, and open areas are important for calculating the stormwater flow capacity, so the related areas were classified. The building areas classified sub-areas such as sports facilities, residential, schools, religious facilities, factories government buildings, and commercial buildings. The building areas, road areas, and open areas were in line format in the base maps so whole areas were redrawn in polygon format to calculate the areas on the GIS platform. The GIS allowed this flexibility to create and modify the geometry data in a layer. The road area = 3.53 km2, the building roof area = 6.36 km2, and the open area = 6.62 km2 within the basin boundaries of the Kağıthane Stream.
The building and road area were impermeable and covered 60% of the whole watershed. With increasing urbanization, this percentage of impermeable area will increase flood risk when it reaches 80–90%. In order to prevent future flooding problems, the percentage of impermeable area should be reduced, the permeability rate should be increased, and the flood risks should be reduced. To find solutions to these problems, different scenarios were created within the scope of this study on the GIS platform. The GIS platform provides convenience and gives better results at data collection, storage, query, data management, and accessibility so all data is processed with ArcGIS 10.4 and converted to a shapefile. The 3D analysis, the spatial analysis and, the HEC-GeoRAS were used actively in this study.
Scenarios were set up to increase the permeability and to reduce the flood risk by implementing the green infrastructure methods of the ground/covering type. This was achieved by harvesting, infiltrating, slowing, storing, conveying, and treating runoff onsite. In addition, the current case scenario was assessed in comparison with the scenarios that may create the best and worst flood risk.
The rational method was used to quantify the runoff coefficient, C, reduction identified with green infrastructure system implementations. The runoff coefficient represents the integrated effects of infiltration, evaporation, retention, and interception, all of which affect the runoff volume. The determination of C requires judgment based on experience and understanding on the part of the engineer [38].
2.3. Hydrological Modelling
The rational method was used for calculating the flowrate capacity for each scenario. It is based on the rational formula:
where:
Qp = CIA,
- Qp is the peak discharge/flowrate.
- C is a dimensionless runoff coefficient.
It was determined separately for each scenario. For each scenario, the runoff coefficient varied based on the surface permeability.
Scenario 1 (SN1). This is the current situation. The building and road areas’ pavement type was impermeable and had a runoff coefficient of 0.95–0.90, whereas the open area was permeable and had a runoff coefficient is 0.30.
Scenario 2 (SN2): The building area’s covering type was assumed to be green roof. The green roof runoff coefficient can be modified by the vegetation type, the depth of green materials, the moisture and infiltration of the soil, and the roof slope. According to a different study, the runoff coefficient value can be taken in different ranges for determination of the flooding mitigation. The international standard BS EN 16941–1:2018 suggests that the runoff coefficient 0.30 for intensive green roof and 0.60 for extensive green roof. In this study, the runoff coefficient was assumed to be 0.40 for green roof [39].
Road areas’ ground type was accepted as pervious/permeable pavement to minimizing flooding. Zhu et al. 2018 made a simulation of the permeable pavement for decreasing the urban surface runoff coefficient and the flood peak flow, so the range of the runoff coefficient of different permeable pavement structures was recommended according to the simulation results: drainage surface = 0.70–0.85, semi-permeable pavements ≤ 0.45, and fully permeable pavement [40]. In this study, the runoff coefficient was assumed to be 0.70 for the pervious pavement. The open area’s runoff coefficient value was the same as in Scenario 1.
Scenario 3 (SN3). Building area’s covering type was accepted as green roof. The open and road areas’ runoff coefficient values were the same as in Scenario 1.
Scenario 4 (SN4). The building area’s covering type was accepted as impermeable and a rainwater barrel system was used to reuse and reduce flooding. Accordingly, 40% stormwater was used for this system and 60% stormwater was discharged to the existing system. The road areas were collected by swale drainage canals. The swale canals provide runoff reduction and pollutant removal depending on the soil type, the slope of the road, the climate factors, the vegetation type, etc. Whereas Barrett 2005 determined that the runoff volume was reduced by approximately 47% of the runoff in the swales, Rushtan 2001 indicated that the swales reduced the average runoff amount by 30% [41,42]. In this study, we assumed that the road area’s runoff coefficient value was 0.60. The open area runoff coefficient is normally 0.30, but we used the 0.60 runoff coefficient value for the open area in this scenario. This was chosen because it was assumed that half of the open area will be constructed as new buildings in the future (impervious area).
Scenario 5 (SN5). The building area’s covering type was accepted as green roof (deeper vegetation), while the road areas’ ground type was accepted as pervious pavement and a swale drainage canal was used for collection. The open areas were accepted as permeable and there was a storage pond. This is the best scenario in terms of the green infrastructure. The runoff coefficient was taken to be 0.25 for buildings, road, and open areas.
Scenario 6 (SN6). All area was assumed to be impermeable to compare with the other scenarios. This was the worst scenario in terms of flooding and urbanization. The runoff coefficient was 0.95 for buildings, roads, and open areas.
I is the average rainfall intensity during the time of concentration.
Rainfall intensity calculation, (iaverage).
Rainfall intensity (iaverage). It was calculated with three different formulas depending on the duration of precipitation (td) [43].
- if 0 ≤ td ≤ 120 min:
- if 120 < td <180 min:
- if td ≥ 180 min:
If td > 120 min, the precipitation intensity (iaverage), and the a, b, and c coefficients to be used in the formulas were taken from the Table 1.

Table 1.
IDF parameters for several return periods.
The Q500 flow rate was calculated depending on the flow rates of Q100 and Q10. The following equation was used in the calculation of the Q500 value [44].
Here,
- Q100: Project flow rate for one hundred years of recurrence (l/s)
- Q10: Project flow rate for ten years of recurrence (l/s)
The time of concentration TC is defined by:
where te is the time of entry/initial time and
Tc = te + tf,
- Tf/tt is the time of flow through the pipe system to the point under consideration.
- Tc is the computed time of concentration (minutes) [45].
Initial flow time, te/ti, can be calculated using:
where:
- ti = initial flow time (minutes).
- Cyear = runoff coefficient for yearly frequency.
- Li = length of overland flow (m).
- So = average slope along the overland flow path (m/m).
Tf flow time may be calculated using:
where:
- tt = channelized flow time (travel time, min).
- Lt = waterway length (m).
- So = waterway slope (m/m).
- Vt = travel time velocity (m/s) = K√So.
- K = NRCS conveyance factor (see Table 2).
Table 2. Conveyance factors for land surface K.
The time of concentration, tc, is the sum of the flow time, ti/te, and the channelized flow time, tt/tf, as per Equation (6) [46].
A is the contributing catchment/watershed area.
The hydrologic tools in the ArcGIS spatial analyst extension toolbox were used for describing the watershed area. The hydrologic tools allow users to determine sinks and flow direction, to calculate cumulative flow, and to create watershed areas and stream networks.
After defining watershed area boundaries, the watershed of stream was divided into 26 sub-watersheds, where each watershed area was determined by the flow direction and existing stormwater network, which connected to the stream (as shown in Figure 3). As a result, the detailed watershed was determined. Similarly, Pellicani et al. 2018 carried out their study by dividing the basin areas into sub-basins to obtain a better definition and knowledge of the distribution of the risk level in the urban flood study [47].
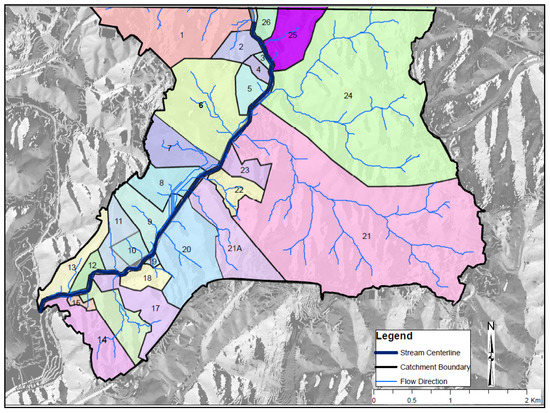
Figure 3.
Sub-watershed.
2.4. Hydraulic Modelling
The determined runoff coefficient, rainfall intensity, and areas, as shown in Figure 3, were used to calculate the flow rate capacity. Sub-basins were numbered for detail flow calculations. In the evaluation of flood risk, directive 2007/60/EC on the management of flood risk in the European Union was taken into account. This directive suggests that flood hazard maps shall cover the geographical areas that could be flooded according to the following scenarios:
- Floods with a low probability, or extreme event scenarios;
- Floods with a medium probability (likely return period ≥ 100 years);
- Floods with a high probability, where appropriate.
Accordingly, three different return periods (10, 100, and 500 years) were used for calculating the flow capacity.
When making flood risk assessment in streams, instead of taking into account only the flow rate of the study area, the flood risk assessment should be made by considering the flow from the upstream section named as an additional flow. Table 3 includes the study area, which is the sum of the sub-bases, and the calculations of the entire basin flow rate.
Table 3.
Flow rate capacity for different scenarios and return periods.
HEC-RAS software was utilized to create the flood map. This software provides one-dimensional steady flow hydraulic models, one and two-dimensional unsteady flow calculations, sediment transport streambed computations, and water temperature/water quality modeling [48]. The HEC-RAS software was preferred because of its ability to make the quality hydraulic analysis using a mathematical algorithm, its quick calculation time, its low data requirements, its integration with ArcGIS, and because it is a free software.
The results of the model can be applied in the GIS platform. Gradually varied flow is characterized by minor changes in water depth and velocity from cross-section to cross-section. The primary procedure used by HEC-RAS to compute water surface profiles assumes a steady, gradually varied flow scenario, and is called the direct step method. The basic computational procedure is based on an iterative solution of the energy equation:
which states that the total energy (H) at any given location along the stream is the sum of potential energy (Z + Y) and kinetic energy (αV2/2 g) [49].
H = Z + Y + αV2/2 g,
In order to build an HEC-RAS model, the floodplain information such as stream centerline, stream banks, stream flow direction, stream cross sections, land use plans, terrain model, and flow rate information is needed. The floodplain information was derived from HEC-GeoRAS software, which is used as a graphical user interface in ArcGIS. The interface allows the preparation of geometric data for import into HEC-RAS and processes simulation results exported from HEC-RAS. To create the import file, the user must have an existing digital terrain model (DTM) of the stream system in the ArcInfo TIN format [50]. The floodplain information was imported in the HEC-RAS model as geometric data and then flow rate value was entered for the cross-sections where the existing stormwater network discharged to the stream to calculate steady flow calculation.
In order to obtain the correct water depth and flood map, additional cross sections were added by interpolation, so the cross-sections interval was decreased from 50 m to 10 m along the 7 km stream. Moreover, cross-section data were re-arranged again in order to determine the best cross-section data for the analysis.
The thalweg level defined the bed slope through the stream reach and downstream of the stream reach. Bed slope through the stream reach and downstream of the stream reach was estimated as 0.001 m/m. The downstream bed slope was used as the boundary condition in HEC-RAS for the 10-, 100-, and 500-year profiles.
The roughness coefficient that was taken from Kağıthane Stream report was used for the all cross sections. Roughness coefficients were identified for the left overbank, the stream, and the right overbank of each cross section. For the Kağıthane Stream, the roughness coefficients for the left overbank and the right overbank were uniformly 0.035 and the stream was uniformly 0.016.
After the geometric data and flow data were entered and made into a related arrangement, the HEC-RAS model was run. The model was generated to the water surface profiles for different flow conditions, and the floodplain was done by the HEC-RAS 5.0.3 software itself and shown in RAS Mapper. Shapefiles including water depths, flow maps, and inundation boundaries were produced for 10-, 100- and 500-year profiles. Then, these shapefiles were imported into the GIS platform and the flood area was calculated. This flooding boundary was combined with the base map. The number of buildings that will be affected by the flooding at each scenario was determined by using analysis and the query tool for ArcGIS. GIS is a powerful tool for making these analyses and queries. It has a great ability to integrate data and management. It could be used for different approaches such as analyzing the different scenarios for determining flood maps. This flood map was created as a result of GIS queries, so GIS is needed to make such a study.
The workflow diagram to explain the GIS platform and the HEC-RAS software relation is shown below Figure 4.
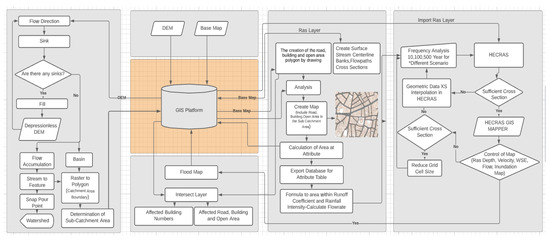
Figure 4.
Workflow of the GIS platform. * Different scenario: this frequency analysis was repeated for all scenarios.
3. Results
The aim of this study was to show how flooding, which will occur with increasing urbanization, can be reduced by applying green infrastructure instead of gray infrastructure using the GIS platform. After the evaluation of all parameters on the GIS platform, the hydraulic model was analyzed in the HEC-RAS model and the flood maps were evaluated on the GIS platform to understand the effects of the sustainable solutions on the flood area.
3.1. Scenario-Based Results
GI implementation and urbanization changes on flood mitigation were compared using scenarios. Scenarios were studied to not only improve current scenario (SN1) flood hazard but also to observe the effect of GI applications on flood mitigation using the GIS platform. In SN2, the GI solution was applied to buildings and roads and the current flood risk area was reduced by 18.93%. In SN3, the GI solution was applied only to buildings and it was determined that the flood risk decreased by 15.45% compared to the current situation. Even though GI was applied to both roads and buildings in SN2, the reduction in flood risk in SN3 was approximately the same as in SN2. The reason for this is that 22% of the road area, 38% of the building area, and 40% of the open area were within the working area. The multiple GI solutions were applied in SN5 to improve SN1, and the flood mitigation rate was 36.94%. In SN4, the application of GI solutions to roads and buildings the increase of urbanization in open spaces, and the effect of urbanization on flood risk were investigated. In this case, even in half of the open areas, which constituted 40% of the study area, urbanization without GI implementation caused the flood risk to increase by 28.03% and the number of buildings under flood risk increased by 40% compared to the current situation. Therefore, during urbanization, GI solutions should be considered as a part of planning, and possible flood risks should be solved with a sustainable perspective for reducing environmental problems.
According to our results, in cases of urbanization, even in some of the non-residential areas in the upstream part of the basin, the GI application will be applied not only in new settlements but also in existing areas, thus preventing possible flood risks. The difference in SN6 from SN1 is that urbanization is performed entirely in open areas without applying GI solutions. In this case, flood risk increased by 86.89%. Although the number of flooded buildings is 249 in SN1, this figure reached 527 in SN6.
There are huge areal and volumetric differences between scenarios’ flooding areas, especially SN5 and SN6. In SN6, the whole area consisted of concrete from new urbanization or green area was neglected. Accordingly, the flood risk increased compared to other scenarios. In SN5, the flood risk was much smaller because there was no urbanization; in other words, it was accepted that the best green infrastructure application was implemented in the field. In this study, the meaning of the best green infrastructure is deep green vegetation for green roof application sand pavement and soil types, which are more permeable for road. The permeable road type had a better effect on reducing the runoff coefficient and the flood peak flow. As it can be seen from the SN6 results, SN6 is the worst case, whereas SN5 reduces the risk of flood as expected.
In terms of urbanization, it was observed that the flooding risk increases from SN1 to SN6. As a result, SN6’s urbanization was higher than SN1’s. In terms of best green infrastructure implementation, the other meaning effective permeable structure, it was observed that flooding mitigation increased from SN1 to SN5. As a result, SN5’s permeability was higher than SN1’s.
3.2. General Results
The results of the hydraulic model were examined for all scenarios and return periods. The flooding areas for the six scenarios and 10-year, 100-year, and 500-year return periods are shown in Table 4 and Figure 5.
Table 4.
Flow inundation areas for different scenarios and return periods.
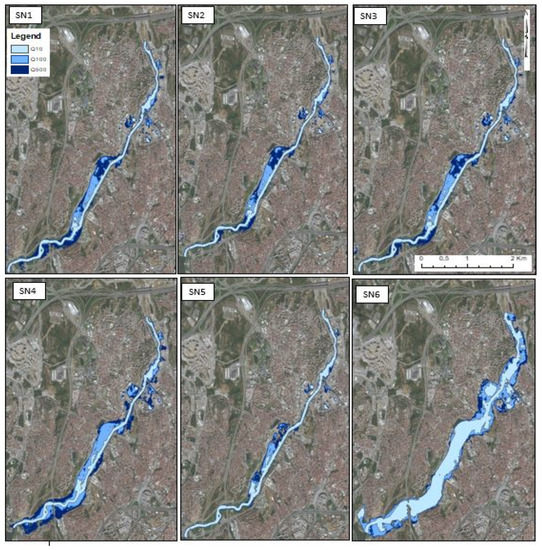
Figure 5.
Flood area changing with the 10-, 100-, and 500-year return periods.
It can be seen from these maps that the flooded areas increase with increasing return periods and urbanization. Large flood areas consisted in 100-year and 500-year return periods for the current scenario and flooding can occur even in low return periods (10-year) because of increasing unplanned urbanization without green infrastructure implementation. All these results indicated that green infrastructure solutions provide benefits in reducing both the runoff coefficient and the peak flowrate, and the flood inundation area and the number of structures affected by flood risk were decreased.
This study revealed the importance of sustainable studies that include the flood risk that will occur with increasing urbanization, as well as the need to integrate details such as building areas, road areas, and open areas on the GIS platform. With the integration of these details into the system, the runoff coefficient, which is one of the main parameters affecting the flood flow rate, will be easily intervened upon and a rapid decision-support system will be formed. Accordingly, in the areas that are planned to be opened to urbanization, the selection of the most suitable and sustainable solution will take place using the GIS platform in the fastest and most accurate steps and existing flood areas will be protected. Moreover, the integrated evaluation system, which consisted in the geographic information system and the assessment of the 1D HEC-RAS hydrologic model were applied for evaluating the GI usage and flood mitigation. Accordingly, flood area and structures that stayed flooded has been shown on Table 5, flooding area changing has been shown on Table 6 and also flood maps have been shown on Figure 6.
Table 5.
Flood area and structures that stayed flooded during the 500-year return period.
Table 6.
Percent change in flood area; 500-year return period.
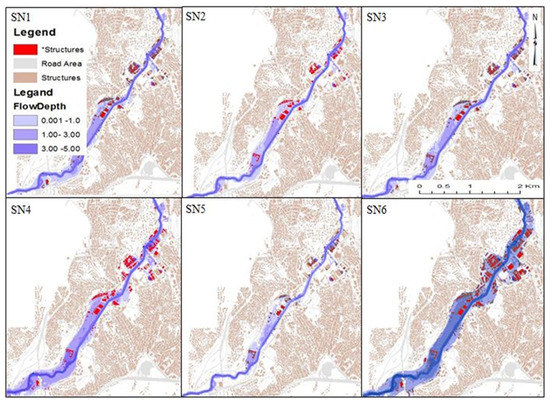
Figure 6.
Flood map for SN1, SN2, SN3, SN4, SN5, and SN6; 500-year return period.
4. Discussion
The method conducted in this study indicates that, despite increasing urbanization, flood risk can be reduced with a GI application. Different GI solutions were applied in SN2 and SN3 to improve the current situation and methods to reduce the flood risk were evaluated. Whereas the GI solution for buildings and roads was evaluated in SN2, only a GI application to buildings was evaluated in SN3. For both scenarios, the GI solution was not proposed for open areas that make up 40% of the basin area. According to the SN2 and SN3 results, flood mitigation was approximately the same. The reason for this is that the same runoff coefficient value was applied in both cases for open spaces and buildings with a total spatial distribution of 78% within the basin area. In addition, the runoff coefficient of 0.70 was used on the road of the GI solution in SN2. This finding emphasizes the importance of prioritizing the spatial distribution percentage ratio of the elements within the watershed and the importance of the permeability rate being applied (i.e., the GI solution) by the relevant administrations and planners to protect the flood areas from increasing urbanization.
According to the SN5 results prepared to examine the effects of the current situation on the flood area when the best GI solution is applied, the flood risk has not completely decreased. The reason for this is that the runoff coefficient was decreased from 0.30 to 0.25. This difference will not greatly affect the flood flow rate, which is applied to open areas with a large spatial distribution. This result reveals that the GI study does not mean that the flood risk can be reduced completely, even if it is done everywhere within the boundaries of the watershed. However, it does make improvements.
Evaluating different scenarios, such as SN2, SN3, and SN5, shows how to achieve flood reduction using GI solutions with increasing urbanization. In SN4, the effect of partial GI solutions on flood reduction was evaluated, and the flood risk to be met by not applying GI was evaluated in SN6. The results emphasize that even partial urbanization in open areas in SN4 increased the risk of flooding, so it is important for planners and administrations to include GI solutions in planning for new settlements to protect flood areas.
This research also reveals that flood area increased with the urbanization and increasing return periods. Flooding can occur in low return periods with increasing urbanization without GI. This finding shows once again the importance of GI in flood reduction. Similar results have been obtained in other studies. For example, Mei et al. have evaluated the framework based on the stormwater management model and lifecycle cost analysis to assess green infrastructure development for flood mitigation. They confirmed that the GI solution is effective on flood mitigation [51]. From our results, it is clear that GI implementation for flood mitigation should be made but, first, GI effectiveness should be determined by the spatial distribution of elements. In addition, it can help to address issues such as flood management, climate change, and environmental solutions.
The main purpose of this study was to discuss how the flood risk that will occur with increasing urbanization can be reduced with GI solutions and, in this context, instead of evaluating the hydraulics, hydrology, and sustainability issues separately, the purpose was to evaluate them as integrative in the GIS platform. Although the study was conducted in Istanbul, the data used are in an accessible form for relative administrations, so this study can be applied anywhere in the world. In this study, the runoff coefficient value, which is one of the main parameters affecting the GI application, was matched with the real areas of the spatial distribution elements. In other studies, land use does not generally go into detail as in this study. For instance, to understand the GI effect on flood reduction, Guo et al., instead of evaluating the land use separately and giving different runoff coefficients within the whole basin, assumed that the runoff coefficient for the whole basin would reduce at the same rate [52].
In addition to the results mentioned above, our study reveals the importance of a holistic consideration of factors such as flood management, water management, and urbanization for city planners, municipalities, and related institutions. Hence, the flood risk in strategic planning will be minimized and economic and social losses will be prevented simultaneously. However, green infrastructure implementation is not sufficient for flood mitigation. Climate change, existing infrastructure network structure, land use, subgrade permeability, etc. should be considered as well as the effects of structures on flooding areas for future studies for health and sustainability.
5. Conclusions
This study investigated the effects of green infrastructure implementation for flood mitigation under urbanization in different scenarios. For this purpose, the integrated evaluation system, which consisted of the geographic information system and the assessment of the 1D HEC-RAS hydrologic model, were applied to 1653 ha of the Kağıthane Stream watershed in Istanbul, Turkey.
The following points can be concluded from the results of this study.
- ▪
- The common application of the GIS platform and the HEC-RAS model provided easy understanding, analysis, and assessment of different scenarios. In addition, the GIS platform played an active role with a large storage capacity, spatial inquiry flexibility, and an efficient decision-making process.
- ▪
- The results showed that green infrastructure implementation not only increases the infiltration and attenuation of stormwater but also reduces the flowrate capacity and runoff-coefficient, which results in lower flooding area. Moreover, the database was set up for analysis on the GIS platform, so it was easy to understand how GI implementation influences the runoff-coefficient factor and flood mitigation. Thus, the extent to which the flood areas changed when GI was applied and the structures to be flooded were quickly determined.
- ▪
- If unplanned urbanization is made without GI implementation within the watershed, it is possible that the flood risk will increase.
Author Contributions
Conceptualization, S.E. and R.N.Ç.; methodology, S.E.; software, S.E.; validation, S.E. and R.N.Ç.; formal analysis, S.E.; investigation, S.E.; resources, S.E.; data curation, S.E.; writing—original draft preparation, S.E.; writing—review and editing, S.E. and R.N.Ç.; visualization, S.E. All authors have read and agreed to the published version of the manuscript.
Funding
This research received no external funding.
Conflicts of Interest
The authors declare no conflict of interest.
References
- Our World in Data. Urbanization. Available online: https://ourworldindata.org/urbanization (accessed on 19 February 2021).
- United Nations. 68% of the World Population Projected to Live in Urban Areas by 2050, Says UN. Available online: https://un.org/development/desa/en/news/population/2018-revision-of-world-urbanization-prospects.html (accessed on 19 February 2021).
- The World Bank. Available online: https://data.worldbank.org/indicator/SP.URB.TOTL.IN.ZS?end=2018&locations=TR&most_recent_year_desc=true&start=1960&view=chart&year=1960 (accessed on 19 February 2021).
- Sanyal, J.; Lu, X. Application of remote sensing in flood management with special reference to monsoon asia: A review. Nat. Hazard 2004, 15, 283–301. [Google Scholar] [CrossRef]
- Welch, H.E.; Symons, P.E.K.; Narver, D.W. Some Effects of Potato Farming and Forest Clearcutting on Small New Brunswick Streams, Fisheries and Marine Service; Biological Station: Nanaimo, BC, Canada, January 1977. [Google Scholar]
- Alam, S.; Willems, P.; Alam, M. Comparative Assessment of Urban Flood Risks due to Urbanization and Climate Change in the Turnhout Valley of Belgium. ABC J. Adv. Res. 2014, 3, 14–23. [Google Scholar] [CrossRef]
- Elhamid, H.A.; Zeleňáková, M.; Vranayová, Z.; Fath, I. Evaluating the Impact of Urban Growth on the Design of Storm Water Drainage Systems. Water 2020, 12, 1572. [Google Scholar] [CrossRef]
- Lee, Y.; Brody, S.D. Examining the impact of land use on flood losses in Seoul, Korea. Land Use Policy 2018, 70, 500–509. [Google Scholar] [CrossRef]
- Shi, P.; Ge, Y.; Yuan, Y.; Guo, W. Integrated Risk Management of Flood Disasters in Metropolitan Areas of China. Water Resour. Dev. 2005, 21, 613–627. [Google Scholar] [CrossRef]
- Sanne, M.; Burak, G.; Brenden, J.; Jeroen, A.; Philip, W. Flood Risk and Adaptation Strategies under Climate Change and Urban Expansion: A Probabilistic Analysis Using Global Data, Institute for Environmental Studies (IVM); VU University Amsterdam, Department of Geography: Amsterdam, The Netherlands; Texas A&M University: College Station, TX, USA, 2015. [Google Scholar]
- Bae, S.; Chang, H. Urbanization and floods in the Seoul Metropolitan area of South Korea: What old maps tell us. Int. J. Disaster Risk Reduct. 2019, 37, 101186. [Google Scholar] [CrossRef]
- Fox, D.M.; Witz, E.; Blanc, V.; Soulié, C.; Penalver-Navarro, M.; Dervieux, A. A case study of land cover change (1950–2003) and runoff in a Mediterranean catchment. Appl. Geogr. 2012, 32, 810–821. [Google Scholar] [CrossRef]
- Luino, F.; Turconi, L.; Petrea, C.; Nigrelli, G. Uncorrected land-use planning high-lighted by flooding: The Alba case study (Piedmont, Italy). Nat. Hazards Earth Syst. Sci. 2012, 12, 2329–2346. [Google Scholar] [CrossRef]
- Turkish State Meteorological Service. Taskinlar. Available online: http://mgm.gov.tr/arastirma/dogal-afetler.aspx?s=taskinlar (accessed on 19 February 2021).
- Adelye, A.; Rustum, R. Lagos (Nigeria) flooding and influence of urban planning. J. Urban Des. Plan. ICE 2011, 164, 175–187. [Google Scholar] [CrossRef]
- Meng, T.; Hsu, D. Stated preferences for smart green infrastructure in stormwater management. Landsc. Urban Plan. 2019, 187, 1–10. [Google Scholar] [CrossRef]
- Lucas, W.C.; Sample, D.J. Reducing combined sewer overflows by using outlet controls for Green Stormwater Infrastructure: Case study in Richmond, Virginia. J. Hydrol. 2015, 520, 473–488. [Google Scholar] [CrossRef]
- The Biodiversity Information System for Europe. Green Infrastructure. Available online: https://biodiversity.europa.eu/topics/green-infrastructure (accessed on 19 February 2021).
- World Green Infrastructure Network (WGIN). Available online: https://worldgreeninfrastructurenetwork.org/page.php?id=458&parent=8 (accessed on 19 February 2021).
- City of Seattle. Green Stormwater Infrastructure in Seattle Implementation Strategy 2015–2020. Available online: https://seattle.gov/Documents/Departments/OSE/GSI_Strategy_Nov_2015.pdf (accessed on 19 February 2021).
- City of Seattle. Available online: www.ci.seattle.wa.us (accessed on 19 February 2021).
- The European Climate Adaptation Platform Climate-ADAPT. Urban Storm Water Management in Augustenborg, Malmö. Available online: https://climate-adapt.eea.europa.eu/metadata/case-studies/urban-storm-water-management-in-augustenborg-malmo (accessed on 19 February 2021).
- Liu, W.; Chen, W.; Chi, P. Assessing the effectiveness of green infrastructures on urban flooding reduction: A community scale study. Ecol. Model. 2014, 291, 6–14. [Google Scholar] [CrossRef]
- Schubert, J.E.; Burns, M.J.; Fletcher, T.D.; Sanders, B.F. A framework for the case-specific assessment of Green Infrastructure in mitigating urban flood hazards. Adv. Water Resour. 2017, 108, 55–68. [Google Scholar] [CrossRef]
- Liu, Y.; Theller, L.O.; Pijanowski, B.C.; Engel, B.A. Optimal selection and placement of green infrastructure to reduce impacts of land use change and climate change on hydrology and water quality: An application to the Trail Creek Watershed, Indiana. Sci. Total Environ. 2016, 553, 149–163. [Google Scholar] [CrossRef] [PubMed]
- Ma, Y.; Thia, L. A Useful Hydrologic Impact Assessment Model. Nat. Sci. 2004, 2, 68–73. [Google Scholar]
- Mobilia, M.; Longobardi, A. Impact of Green Roofs on Stormwater Runoff Coefficients in a Mediterranean Urban Environment. Available online: http://www.wseas.us/e-library/conferences/2014/Florence/USCUDAR/USCUDAR-13.pdf (accessed on 19 February 2021).
- Anees, S.S.; Jolanta, W.K.; Zuzano, G.S. The Role of Green Infrastructure Solutions in Urban Flood Risk Management (English); World Bank Group: Washington, DC, USA, 2016; Available online: http://documents.worldbank.org/curated/en/841391474028584058/The-role-of-green-infrastructure-solutions-in-urban-flood-risk-management (accessed on 19 February 2021).
- FloodMap. Available online: https://www.floodmap.net/?ct=TR (accessed on 19 February 2021).
- Shamsi, S.U. GIS Applications in Floodplain Management. Available online: https://proceedings.esri.com/library/userconf/proc02/pap0490/p0490.htm (accessed on 19 February 2021).
- Rupal, K.; Waghwala, R.K.; Agnihotri, P.G. Flood risk assessment and resilience strategies for flood risk management: A case study of Surat City. Int. J. Disaster Risk Reduct. 2019, 40, 101155. [Google Scholar]
- Suriya, S.; Mudgal, B.V. Impact of urbanization on flooding: The Thirusoolam sub watershed—A case study. J. Hydrol. 2012, 412–413, 210–219. [Google Scholar] [CrossRef]
- Climate-Data.org. Kağıthane. Available online: https://tr.climate-data.org/asya/tuerkiye/istanbul/kag%C4%B1thane-7428/ (accessed on 19 February 2021).
- ArcGIS Desktop. What Is a Geodatabase? Available online: https://desktop.arcgis.com/en/arcmap/10.3/manage-data/geodatabases/what-is-a-geodatabase.htm (accessed on 19 February 2021).
- University of Toronto Libraries. Working with Digital Elevation Models in ArcGIS. Available online: https://mdl.library.utoronto.ca/technology/tutorials/working-digital-elevation-models-arcgis (accessed on 19 February 2021).
- Sharma, A.; Tiwari, K.N. Sink Removal from Digital Elevation Model–A Necessary Evil for Hydrological Analysis. Curr. Sci. 2019, 117, 9. [Google Scholar] [CrossRef]
- Apollonio, C.; Bruno, M.F.; Lemmolo, G.; Molfetta, G.M.; Pellicani, R. Flood Risk Evaluation in Ungauged Coastal Areas: The Case Study of Ippocampo (Southern Italy). Water 2020, 12, 1466. [Google Scholar] [CrossRef]
- Available online: https://udfcd.org/wpcontent/uploads/2018/10/06_Runoff-August-2018.pdf (accessed on 12 December 2020).
- BS EN 16941-1. Rainwater Harvesting System, European Standard. 2018. Available online: https://www.stormsaver.com/domestic-domestic-rwh-standards-legislation/rainwater-harvesting-systems-bs-en-16941-1-2018 (accessed on 19 February 2021).
- Zhu, H.; Yu, M.; Zhu, J.; Lu, H.; Cao, R.; Zhang, L. Simulation study on effect of permeable pavement on reducing flood risk of urban runoff. Int. J. Transp. Sci. Technol. 2019, 8, 373–382. [Google Scholar] [CrossRef]
- Barrett, M.E. Performance comparison of structural stormwater best management practices. Water Environ. Res. 2015, 77, 78–86. [Google Scholar] [CrossRef] [PubMed]
- Rushton, B.T. Low-impact parking lot design reduces runoff and pollutant loads. J. Water Resour. Plan. Manag. 2001, 127, 172–179. [Google Scholar] [CrossRef]
- İstanbul Water and Sewerage Administration (İSKİ). Stormwater Project Technical Specifications. Available online: https://www.iski.istanbul/web/en-US/kurumsal (accessed on 19 February 2021).
- Özdemir, H. Uygulamalı Taşkın Hidrolojisi; DSİ Yayınları: Ankara, Turkey, 1978. [Google Scholar]
- Design and Analysis of Urban Storm Drainage: The Wallingford Procedure Volume 4 The Modified Rational Method. National Water Council, Standing Technical Committee Reports No. 30 1981. Available from HR Wallingford. Available online: https://trid.trb.org/view/175607 (accessed on 19 February 2021).
- Urban Drainage and Flood Control District August 2018 Urban Storm Drainage Criteria Manual Volume 1, August 2018. Available online: https://udfcd.org/volume-one (accessed on 19 February 2021).
- Pellicani, R.; Parisi, A.; Lemmolo, G.; Apollonio, C. Economic Risk Evaluation in Urban Flooding and Instability-Prone Areas: The Case Study of San Giovanni Rotondo (Southern Italy). Geosciences 2018, 8, 112. [Google Scholar] [CrossRef]
- Hydrologic Engineering Center. HEC-RAS. Available online: https://hec.usace.army.mil/software/hec-ras/ (accessed on 10 September 2020).
- Tate, E. Introduction to HEC-RAS. Available online: https://www.caee.utexas.edu/prof/maidment/grad/tate/research/RASExercise/webfiles/hecras.html#hydraulics (accessed on 19 February 2021).
- Hydrologic Engineering Center. HEC-GeoRAS. Available online: https://hec.usace.army.mil/software/hec-georas/isk (accessed on 10 September 2020).
- Mei, C.; Liu, J.; Wang, H.; Yang, Z.; Ding, X.; Shao, W. Integrated assessments of green infrastructure for flood mitigation to support robust decision-making for sponge city construction in an urbanized watershed. Sci. Total Environ. 2018, 639, 1394–1407. [Google Scholar] [CrossRef]
- Guo, Q.; Correa, C.A. The Impacts of Green Infrastructure on Flood Level Reduction for the Raritan River: Modeling Assessment. In Proceedings of the World Environmental and Water Resources Congress 2013, Cincinnati, OH, USA, 19–23 May 2013; Available online: https://ascelibrary.org/doi/abs/10.1061/9780784412947.035 (accessed on 19 February 2021).


Publisher’s Note: MDPI stays neutral with regard to jurisdictional claims in published maps and institutional affiliations. |
© 2021 by the authors. Licensee MDPI, Basel, Switzerland. This article is an open access article distributed under the terms and conditions of the Creative Commons Attribution (CC BY) license (http://creativecommons.org/licenses/by/4.0/).