Article

Life Cycle Assessment and Economic Energy Efficiency of a Solar Thermal Installation in a Family House

by
Jaroslav Košičan
1,*,
Miguel Ángel Pardo Picazo
2,
Silvia Vilčeková
3 and
Danica Košičanová
1
1
Institute of Architectural Engineering, Faculty of Civil Engineering, Technical University of Košice, Vysokoškolská 4, 04200 Košice, Slovakia
2
Department of Civil Engineering, University of Alicante, Spain Carretera de san Vicent del Raspeig s/n, 03690 Alicante, Spain
3
Institute of Environmental Engineering, Faculty of Civil Engineering, Technical University of Košice, Vysokoškolská 4, 04200 Košice, Slovakia
*
Author to whom correspondence should be addressed.
Sustainability 2021, 13(4), 2305; https://doi.org/10.3390/su13042305
Submission received: 22 January 2021 / Revised: 10 February 2021 / Accepted: 14 February 2021 / Published: 20 February 2021
(This article belongs to the Special Issue Complex System Modeling Methods Applied to Sustainable Development)

Abstract

:
Designing solar strategies is a powerful step forward to set up an adequate residential house in terms of energy. Many types of research have simulated the energy needs for residential buildings. Designing an improper installation can contribute to a growth in the overall energy expenditure in ensuring thermal comfort. The use of solar thermal processes in Slovakia is on a rise as compared to recent years. This study models twelve solar water heating systems created on the roof of the household. Solar energy techniques are carried out to comply with the demands of heating and domestic hot water. The analysis deals with the most efficient alternative for the arranged solar systems of the building. Considering these installations and the corresponding overall prices of machinery, the best workable alternative is selected. The potential energy performance of auxiliary heating and the energy output of the solar thermal installation are examined. The required amounts of the different energy contributions are modelled and simulated in specific software for a family house in Kosice, Slovakia. We determine the limits of the design for an apartment and analyse which procedure is used to provide the typical average water expenditure and heating need, covering a multi-criteria analysis considering costs, energy, and life cycle analysis of every installation. This approach can support professionals to decide the best scheme considering these criteria, and this method can be satisfactorily applied. In these conditions, converting a conventional gas boiler into a solar thermal system involves monthly economic savings of around EUR 140–250, with payback periods of 2.5–7 years. The energy requirements are fully covered by the solar thermal schemes and the life cycle assessment resulted in reasonable impacts on the environment.

Graphical Abstract

1. Introduction

The latest data stated that world energy production has continued to grow (+1.5%) in recent years and is close to reaching 15,000 Mtoe, but remains below its real trend (2%/year) [1]. The energy demand is projected to rise by 1.3% each year until 2040 [2], and the population forecast highlights that the population will be 70% higher in the year 2050 [3]. The overall energy expenditure in 2035 will amount to around 32,922 TWh, twice that in 2008 [4] (with 75% of the overall energy used being produced by fossil fuels). The European Commission points out as one of its primary purposes curtailing emissions by 2050; such contraction can be achieved with monetary, industrial, and civil transformation measures [5]. In 2018, the European Union (EU) fulfilled 55% of its energy demand using gas and oil sources, and encourages diminishing this value by up to 20% by the year 2050.
The construction sector uses 40% of the overall energy consumption within the European Union. Energy management to reduce carbon emissions was revealed as a hot topic, as 12% of the literature produced is focused on this [6], and the concept of a post-carbon city [7] appeared as a result of meeting the European targets regarding emissions. This industry handles a significant part of the overall greenhouse gas emissions. The European Union is trying to improve the environment in households by means of new ideas. One project is run by the Slovak Innovation Energetic Agency (SIEA), in which the state can support households (up to half of the cost) to perform any installations using renewable sources. The massive consumption of fossil fuels could likewise lead to important environmental concerns, such as air pollution and global warming [8]. To promote energy self-sufficiency, the European Parliament has encouraged policies supporting energy efficiency in the construction industry. Regulations include energy certification of houses and economic motivations for reducing energy usage in residential buildings. Houses and the construction industry consume 33% of the overall final energy use and produce 40% of the total CO2 emissions [2]. These figures justify the attempts to diminish energy use through envelopes [9,10], warming and cooling (60% of the overall consumption [11]), demand response, etc. In accordance with Directive 2010/31/EU, all EU Member States are obligated to perform energy analysis to diminish energy needs. The concept of net-zero energy buildings [12] comes out as a solution for houses with an excellent energy performance and diminished energy need [13], where renewable sources feed energy demands. In this regulation, the cost-optimal method was proposed—this means dealing with the global costs applied to the building lifespan [14]. Researchers and practitioners have investigated many techniques to exploit solar power for cooling and heating [15,16], photovoltaic energy for electricity [17], and hybrid solar collector thermal and photovoltaic systems [18]. Many approaches have dealt with energy storage [19,20], with wind energy production [21,22], and with modelling energy demand in buildings [23,24].
The energy retrofitting of existing buildings is also a challenge for diminishing energy consumption [25,26]. Many studies have highlighted solar thermal (ST) installations as a promising and ecological technique [27,28], as they contributes to hot water management [29] in several regions with changing solar irradiance [30]. Despite systematic campaigns, the full-scale adoption of solar panels has not materialised yet, because of a lack of confidence in power savings [31,32]. Solar energy usage is needed to face urgent dilemmas posed to our civilization, such as fossil fuel depletion, excessive CO2 emissions, and the increasing electricity demand [33]. The life cycle analysis of solar technologies has been investigated [34], dealing with renovation materials in family houses [35,36], buildings [37,38], and commercial building [39]. The studies found the most sensitive parameter is daily hot water consumption [34,40] when designing a solar thermal system [41].
Solar thermal energy generation can be used over a small scale [42] or in the industrial sector [43]. The researchers analysed the successful installation of solar concentrator systems [44,45] because of the exorbitant amount of energy savings (40% [46]). Some approaches optimized solar thermal installations [47], considering the key components—the solar collector, the pump, and the storage tank. The auxiliary energy requirements were estimated [48] and the tank for hot water storage was dimensioned to reduce its size [49].
Solar power conversion systems need greater expenditures than conventional energy conversion apparatuses. However, they still provide future monetary savings (users will not pay for warming their houses and for obtaining domestic hot water (DHW)). The future costs or revenues (annual charges and/or future savings) incorporate a discount rate [50] that accounts for inflation to obtain their present value.
This work deals with assessing the overall cost throughout the system. First, for the best hypothesis of a lifetime period, it is compulsory to obtain the input data of energy needs for all installations. To follow these conditions, we simulate using the program “T*SOL” (Valentin Software) [51]. The T*SOL software reports auxiliary heating energy requirements, the solar contribution to heating and for DWH for every alternative. Twelve ST schemes were analysed, and their net present value throughout their lifespan was calculated [52]. These cases were selected as they are the most common schemes (I-IV) and incorporate different auxiliary heat sources. The energy savings were calculated by comparing each alternative with a zero-case (no renewable energies), covering a tank and a gas boiler for heating and DHW. We rank alternatives for the best alternative solar energy system in buildings after the machinery lifespan. In brief, higher revenues achieved after the installation lifespan indicate a better choice. In these cases, the climate conditions for Košice (Slovakia) were used. Without any doubt, choosing the appropriate solar thermal system in a cold climate condition represents a challenge due to the large amounts of energy needed and the irradiance limitation because of the latitude [41]. A life cycle analysis (LCA) covering the whole installation (buffer tanks, ST panels, etc.) was performed for every alternative analysed. This research was carried out using software “OneClickLCA”, attaining the impact on the environment in several categories. Bionova Ltd. developed OneClickLCA software compliant with EN 15978 standard [53,54]. Afterwards, a multi-criteria analysis (using MCA7 software) was performed based on proportion share for each of these categories. This analysis provides us with results for our decision.
We set up the work as follows. Section 2.1 selects the input data required for the method, Section 2.2 shows the program, and we present the obtained output data in Section 2.3. Section 2.4 illustrates how to estimate the net present value, Section 2.5 shows the life cycle analysis of this installation, and Section 2.6 presents the multi-criteria analysis. Section 2.7 depicts the process. Section 3 shows a true case study. The results and the discussion are shown in Section 4 and Section 5, while Section 6 features key conclusions.

2. Materials and Methods

2.1. Input Data for the Simulation

The input data required for the procedure can be classified into building location, thermal installation, and economic data. Building location data cover longitude, latitude, diffuse radiation percentage, total annual global irradiation (kWh/m2), average outside temperature (°C), and the lowest outside temperature.
The thermal installation data are gross collector area (m2), active solar surface (m2), active collector area (m2), inclination (degrees), orientation, and azimuth angles (degrees).
The economic data are the equipment to buy, the costs of the energy, and the discount rate.

2.2. T*SOL Software Characteristic

T*SOL is a software for modelling ST installations in buildings. This program can reproduce solar thermal schemes for various households, comprising installation presentation of competent solar thermal systems and yield and assumption of profit. There are 80% of common solar installation variations in the database for such buildings in the USA and Europe. By implementing an alternative relation, the software detects the effect of solo pieces on the behaviour of a system. The variant study also presents the effects of global radiation, DHW, space heating, collector performance, auxiliary for heating, and total simulation outcomes.
Software results show the scheme of behaviour in other outdoor conditions (the installation’s location area, the value of heat loss of a building, etc.). Concerning the results achieved, a specific correlation between the variations and their costs was determined.

2.3. Output Data for the Annual Simulation

T*SOL ® program calculates the following results for every case:
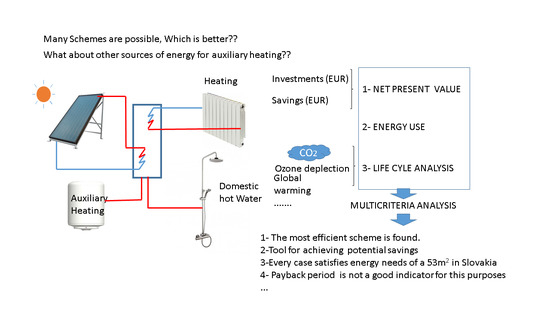
  • Energy delivered by collectors (kWh). The software shows the energy produced by the solar thermal installation. It also divides this energy into solar energy increase to DHW (kWh) and heating (kWh).
  • Auxiliary heating energy (kWh). This value showed that our installation cannot offer the total energy demanded by our building. This energy can be achieved by different sources such as gas boilers, heat pumps, wood pellet boilers, and many others. In this work, the method is described, and practitioners can incorporate any other energy sources.
The software highlights the wood pellet economic savings obtained by wood fire boilers (kg), natural gas savings by gas fire boilers (m3), and the CO2 emissions avoided by heat pumps (kg).

2.4. Life Cycle Cost of ST Installation

Maintenance may increase the lifespan of solar thermal systems (30 years). The ST modules need to be regularly cleaned. However, maintenance considers components such as thermostatic valves, pumps, solar circuit pumps, and storages for solar accumulation.
This procedure intends to bring knowledge to professionals when they analyse which alternative technique is better. The upcoming incomes and savings in present-day money are considered here. Because the cost of capital is time-dependent, future costs and revenues must consider inflation to compare with today’s money [55,56]. The “Net present value” shows current investments and future earnings using the equivalent discount rate. This indicator must be maximised from the present time to the lifespan (Equation (1)). We express this as the net present value (NPV) from the current year (0) to the installation lifespan (T*):
N P V = I i e r t + 0 T * S i e r t d t
Ii is the investment performed, and Si is the monetary savings for the ith year. The maintenance costs should be incorporated into this analysis as a cumulative investment per year.

2.5. Life Cycle Assessment

Utilizing the LCA assessment process, the environmental performance of a family house based on “cradle to the gate with options” is calculated. LCA is a methodical technique for determining the possible environmental effects associated with the lifespan of a product [57,58]. The LCA method comprises all steps, which start from natural materials to industrial productions, and incorporates material extraction, energy expenditure, production, transport, usage, recycling, and ultimate removal or end-of-life. It is an overall process that specifies the influence a device can have on climate change, non-renewable resources, and the environment as an entity. As already mentioned, this LCA was performed using OneClickLCA software, which generates impact complying with standards of ISO 14040, ISO 14044, EN 15804+A1+A2, and ISO 21930 and ISO 14025. It complies with the CML-IA method. This software is a standardised program to run LCA with a good opportunity to cut down costs, incorporating environmental effects. The software OneClickLCA uses elements in management and construction stage through the use-step until end-of-life, i.e., the “grave” stage.

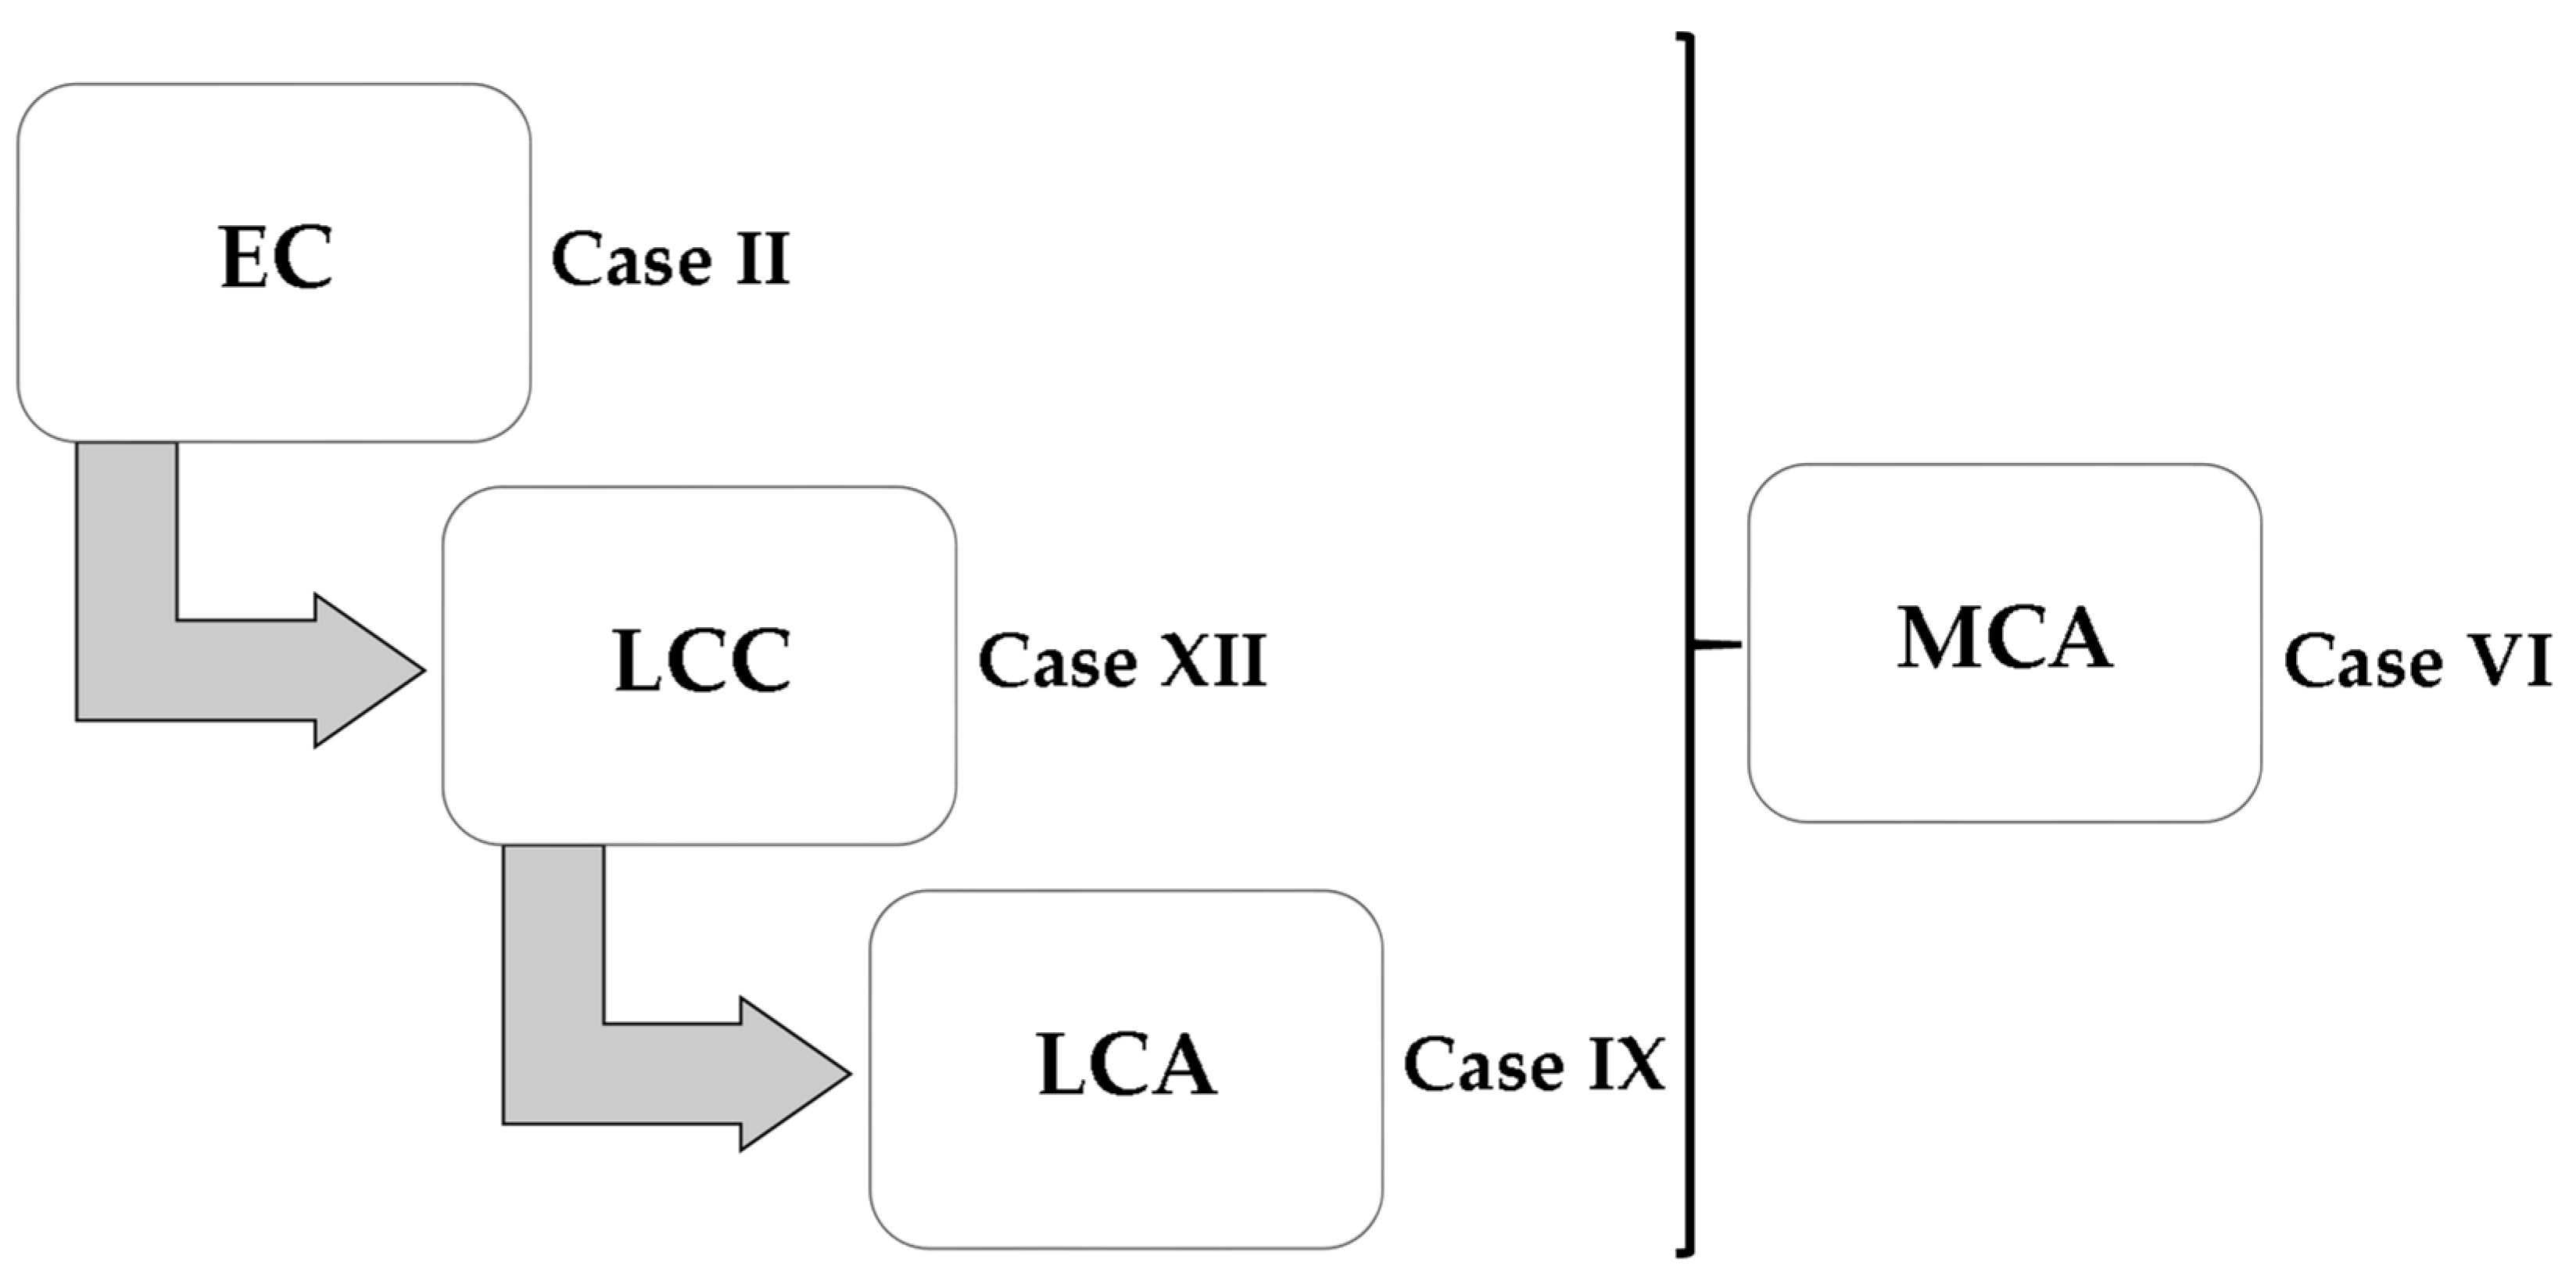
2.6. Multicriteria Analysis

To determine which alternative is the best, according to environmental, economic, and energy aspects, we used the multi-criteria analysis (MCA). MCA is a family of well-known methods implemented by decision support systems to compare different alternatives based on multiple factors, and to find the best performing solution [59]. Due to various objectives considered in the analysis, the hierarchy approach [60] was applied. For the calculation, the MCA7 software was used, which performs calculations using several specific methods with the so-called “Cardinal information on the criteria”. This means that to use these methods, it is necessary to know (i) the criteria according to which the decision will be made (number of criteria, names of criteria, weights of criteria, and distinction between maximization and minimization criteria); and (ii) variants, or alternatives, between which decisions are made and which are arranged from best to worst using some multicriteria methods (number of variants, names of variants, values of all criteria for a given variant).
For the multi-criteria analysis, MCA7 software was chosen, and the Concordance Discordance Analysis (CDA) method was used. CDA includes a comparison of alternatives for pair choice. It measures the degree by which the alternatives of choice and the weights of factors prove or disprove the ratio between the alternatives. The discrepancies in the weights of factors and the evaluations of criteria are analysed through the procedures of concordance and discordance [61], which the software calculates by itself from input data.

2.7. Calculation Process

Figure 1 reflects the computation process in 10 stages. The irradiance inputs are gathered in step 1. The cases for solar thermal installation are depicted in step 2. The cases include supplementary heating provided by a gas boiler, a heat pump, and a wood pellet boiler. Calculations are performed using the software in Step 3 to obtain the energy results described before (Section 2.3). We consider the economic input data (step 4) and calculate the investment and savings for every case (Step 5). The economic analysis for every installation lifespan is calculated in step 6 to obtain the best alternative for this economic standpoint. The LCA is performed in step 7 using the parameters calculated in steps 2 and 3, obtaining the results shown in stage 8. Finally, results from stages 3, 6, and 8 are included in the MCA software to achieve a priority ranking in step 10.

3. Case Study

3.1. Input Data for the Simulation

Table 1 shows the input climate and solar thermal installation data. Twelve opportunities to size solar thermal panels and other machinery were analysed (Table 2). The following step calculates the investment cost for every installation and every device of the installation. Another step of this analysis is to obtain midterm energy results from the software and compare them with measured values on a real house. For comparison, energy needs for an auxiliary source for heating were used, such as a gas boiler, heat pump, or wood boiler. After comparing the heating energy, it is also necessary to compare the domestic hot water (DHW) heating energy supply. CO2 emissions per year were also compared among alternatives. The last step calculates total lifespan for every situation. The designed one-floored apartment (usable area 53 m2) is located in Košice (Slovakia). The heat load was 5 kW, the indoor temperature was 20 °C, the specific head load was 94.34 W/m3, and the specific annual energy supply was equal to 163.585 W/m3.

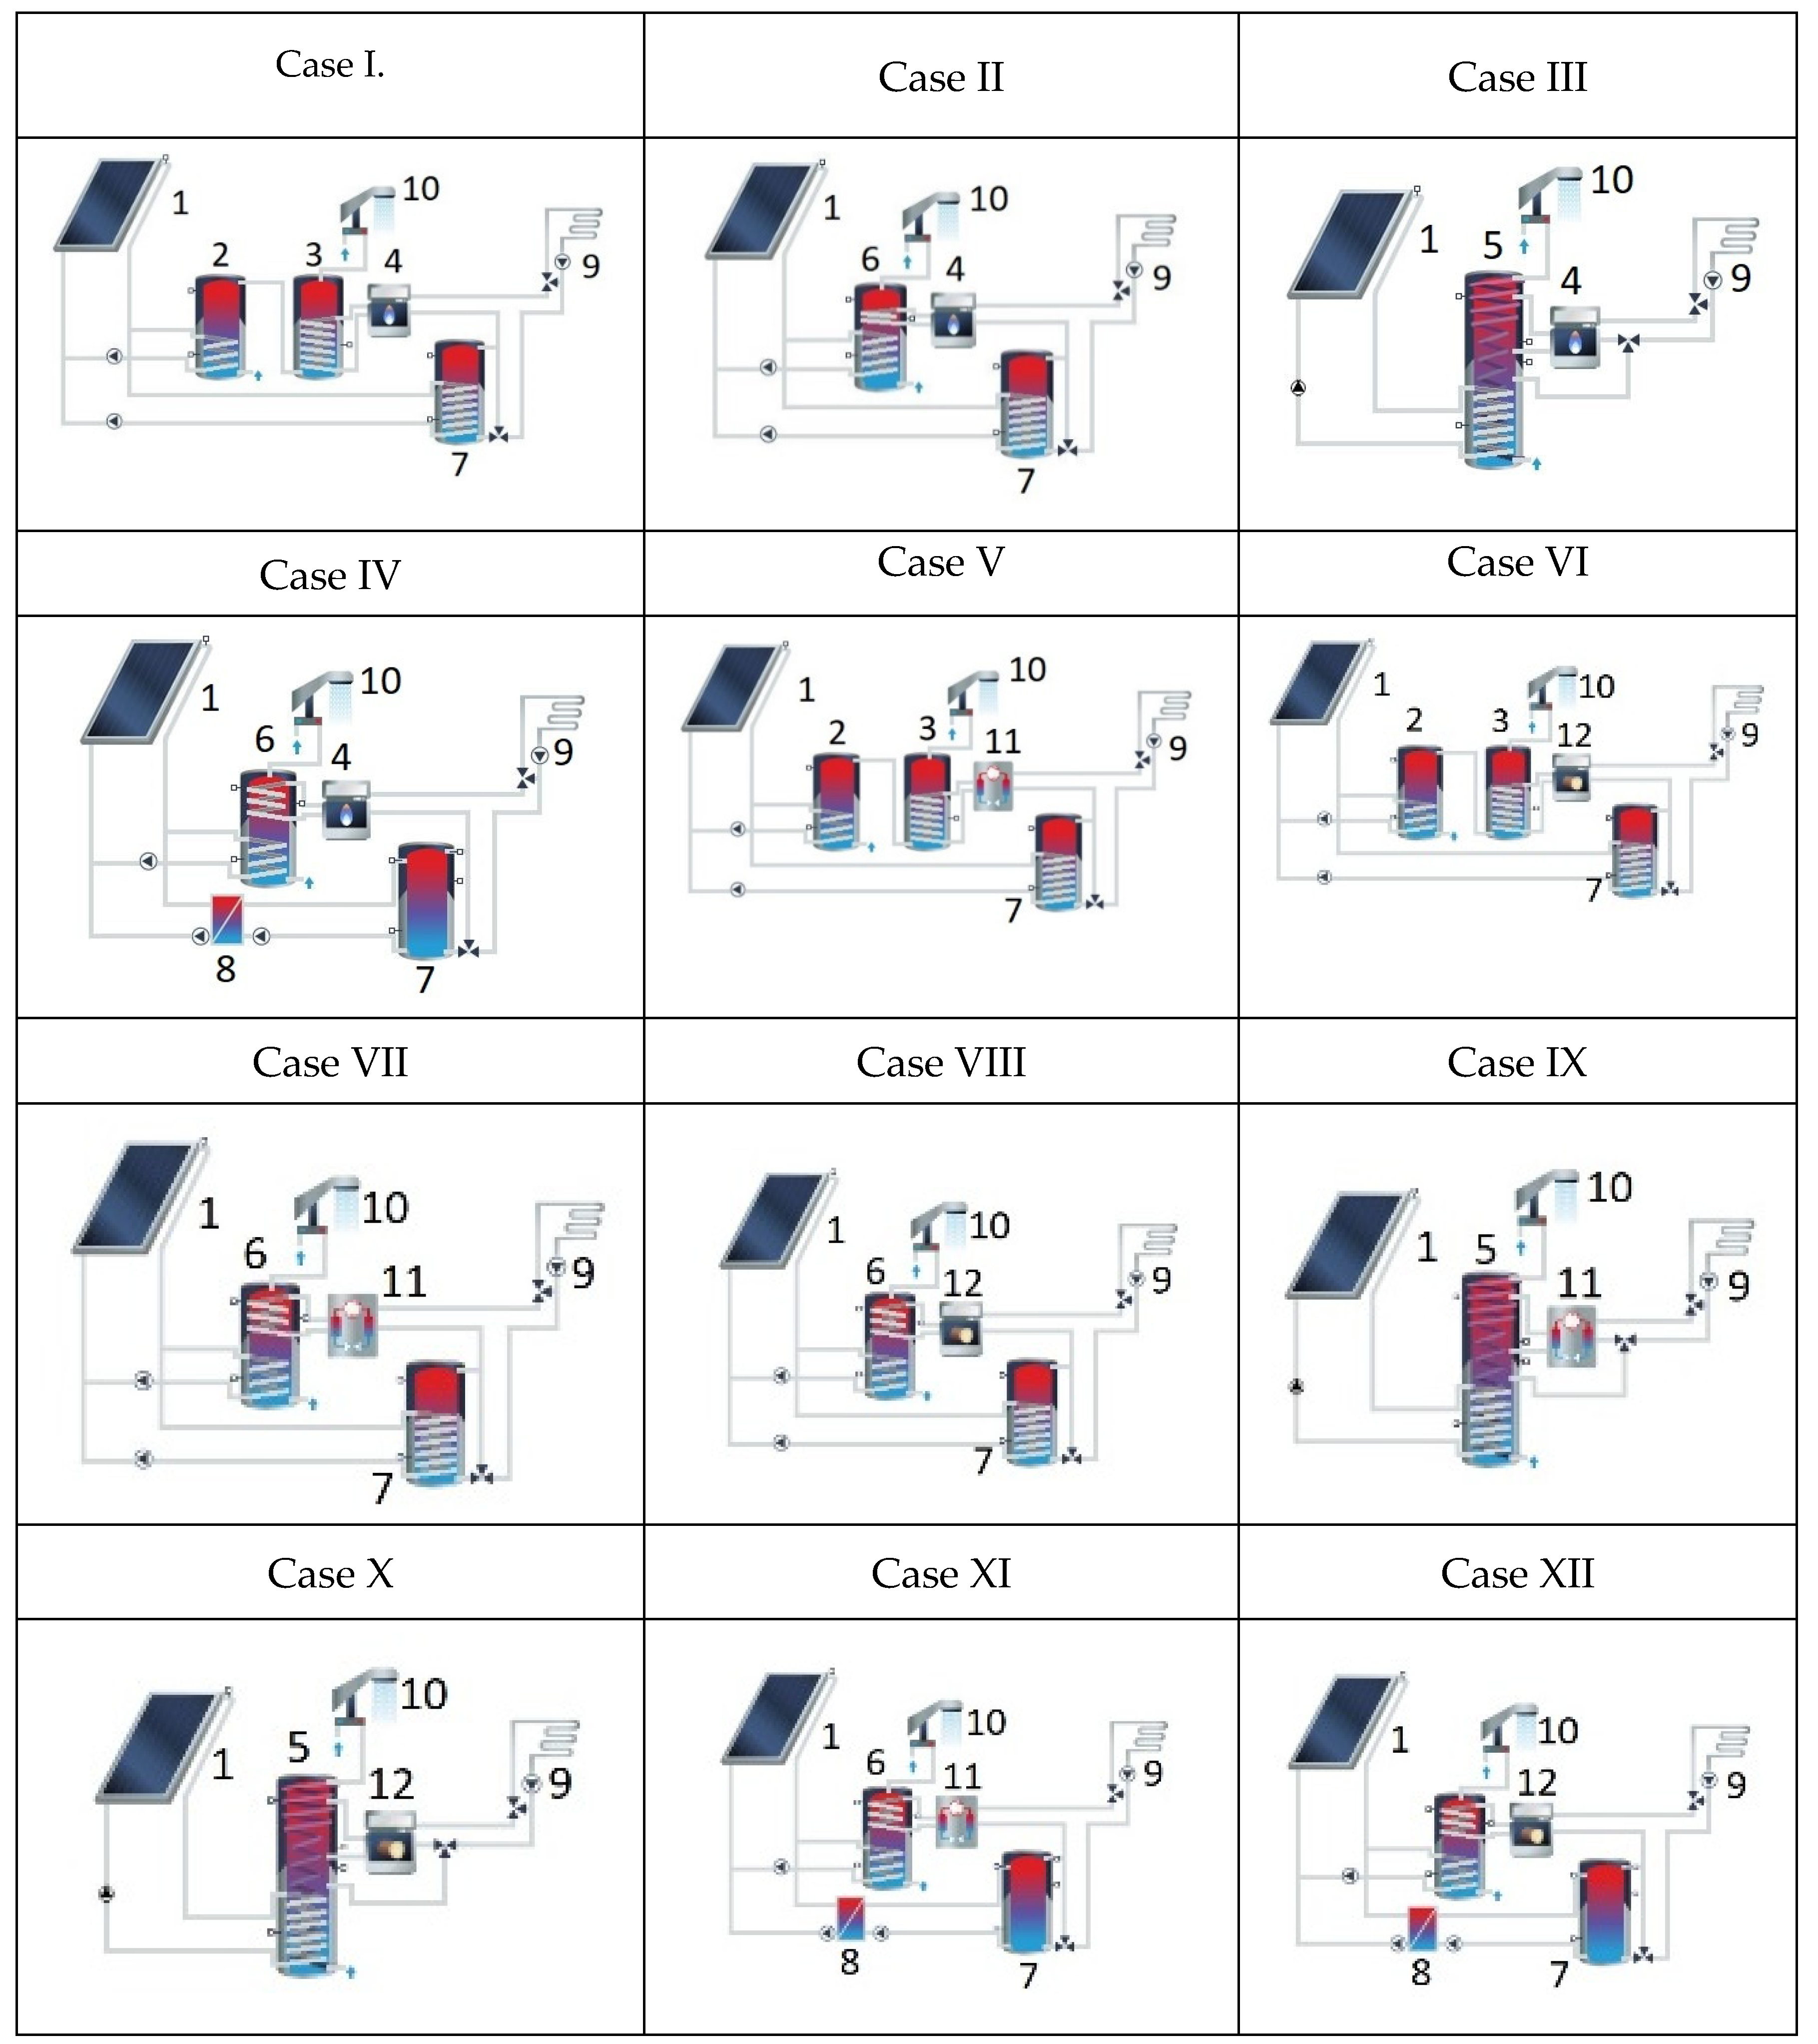
3.2. Cases Simulation

We describe the cases analysed here in Figure 2.
Case 0 does not have any solar thermal collector. It includes only a 15 kW gas-fired boiler. Every case has five Thermosolar Žiar TS 300 solar collectors (with efficiency ηcol = 57%), and the components are described here.
Case I has a 200 L preheating tank, a space-heating buffer tank of 500 L, one tank for DHW with 120 L, and a gas-fired boiler with 15 kW performance and floor heating.
Case II has a gas-fired boiler (15 kW), a 500 L tank for floor heating, and a dual coil indirect water tank of 300 L.
Case III has a 1000 L tank for DHW and floor heating and a gas-fired boiler with 15 kW performance.
Case IV contains a gas-fired boiler with 15 kW performance and a 500 L tank for floor heating and a heat exchanger.
The following cases repeat the features in Cases I-IV but consider a heat pump (Cases V, VII, IX, and XI) or wood-fired boiler (Cases VI, VIII, X, and XII). To clarify this, the auxiliary source in Case I is a heat pump with 14 kW performance and floor heating (Case V), and this is compared to a wood-fired boiler with 14 kW performance and floor heating (Case VI).

3.3. Economic Data

The financial character of input data collected from the T*SOL simulation software is summed up in the following paragraph:
  • Five solar collectors = 2128.8 € (this cost applies to all cases), type Thermosolar Žiar TS 300 flat plate collector, gross surface 2.03 m2, active solar surface 1.78 m2, gross collector area 10.15 m2, active collector area 8.9 m2, orientation 180°, inclination 45°, and azimuth angles 0°;
  • Gas boiler = 1169 € (cases I, II, III, and IV), nominal output 15 kW;
  • Solar preheating tank 200 L = 401.41 € (cases I, V, and VI), volume 200 L, height 1.8 m, insulation thickness 100 mm, effective thermal conductivity 0.065 W/(mK), and losses 2.31 kWh/day;
  • Buffer tank 500 L = 906 € (cases I, II, V, VI, VII, and VIII), volume 500 L, height 2.93 m, insulation thickness 45 mm, effective thermal conductivity 0.03 W/(mK), and losses 3.46 kWh/day;
  • DHW standby tank 120 L = 376 € (cases I, V, and VI), volume 120 L, height 1.8 m, insulation thickness 100 mm, effective thermal conductivity 0.065 W/(mK), and losses 1.95 kWh/day;
  • Dual coil indirect water tank 300 L = 1944.76 € (cases II, IV, VII, VIII, XI, and XII), volume 300 L, height 1.8 m, insulation thickness 100 mm, effective thermal conductivity 0.065 W/(mK), and losses 3.23 kWh/day;
  • Collector loop heat exchanger = 100 € (cases IV, XI, and XII), maximum heat transfer rate 4.45 kW;
  • Combination tank = 3956.09 € (cases III, IX, and X), volume 1000 L, height 2 m, insulation thickness 100 mm, effective thermal conductivity 0.065 W/(mK), and losses 4.75 kWh/day;
  • Heat pump = 14,744.0 € (cases V, VII, IX, and XI), nominal output 14 kW;
  • Woodfire boiler = 852.0 € (cases VI, VIII, X, and XII), nominal output 14 kW.
Table 2 shows all economic costs and their lifespans [62]. Replacement costs are considered as investments in future time (they appear when the lifespan of every component ends). As replacement costs represent future expenses, their value is discounted by the equivalent continuous rate. Residual values of the replaced elements are considered as zero.
As it can be observed in Table 2, the best investment cost was case VI (4664.2 EUR), and the most expensive was case IX (20,828.89 EUR). The values for midterm energy calculations were determined from auxiliary heating, a gas boiler with 15 kW performance, heat pump 14 kW, and wood fire boiler with 14 kW. Gas boiler cases ranged from 7253 to 4981.2 EUR (cases III and I), heat pump cases ranged from 20,828.89 to 18,556.2 EUR (cases IX and V). Wood pellets boiler oscillated among 6936.89 and 4664.2 EUR (cases X and VI).
Energy cost of natural gas (assuming 228 g per kWh [63]) for all alternatives was 1.32 EUR/kg. Other energy sources were wood pellet alternatives (0.18 EUR/kWh) and heat pump (0.08 EUR/kWh).

4. Results

4.1. The Energy Required for Every Alternative

The energy required from this source according to the simulations in every case was 8900 kWh a year (Table 3). For this house, five solar panels (TS 300, Thermosolar Žiar) were installed to provide 120 L of DHW per day.

4.2. The Energy Required for Heating

Measured values from real-time were from the house in Košice with the same installation and were recalculated on the object area. Here, the highest potential value of simulation from the case was used. For instance, cases V, VII, IX, and XI included a heat pump as an auxiliary heat source. In the next case, VII had the highest value from these four cases (8970.8 kWh). The energy required for auxiliary heating-heat pump in real-time was 21.34 kWh/(m2 a year). We calculated this value by the object area (53 m2), and the result was 3467.79 kWh a year. Results are depicted in Table 4, highlighting differences between software and real-time values.

4.3. Domestic Hot Water

Table 4 presents the DHW demand. The energy production from an auxiliary source in each case was due to the equal energy from the solar thermal panel and their amount in every installation. The values from the simulation software of energy for DHW were the same for each case (2040.65 kWh). The energy demand for DHW with a heat pump as another heat source was 14.5 kWh/ (m2 a year) in real-time. We counted this value by the object area (53 m2), and the result was 768.5 kWh a year. As it can be observed, the values from real-time were in the interval of 725–792 kWh. The lowest value for DHW energy supply was for the solar thermal installation with a gas boiler, and the best was from a wood-fired boiler installation.

4.4. Emissions and Impact on the Environment

We obtained results from simulation software for CO2 emissions avoided and electricity savings for each of four alternatives, where a heat pump was an auxiliary heat source. In the wood-fired and the gas boiler cases, wood pellets and gas savings were calculated (Table 5).

4.5. Economic Savings of the Alternatives

The economic energy savings with the data shown in Table 6 are calculated. The cost of the gas was calculated in the zero case. Every option produced an economic reduction. The costs of the pellets, gas, and more energy were considered for every choice.

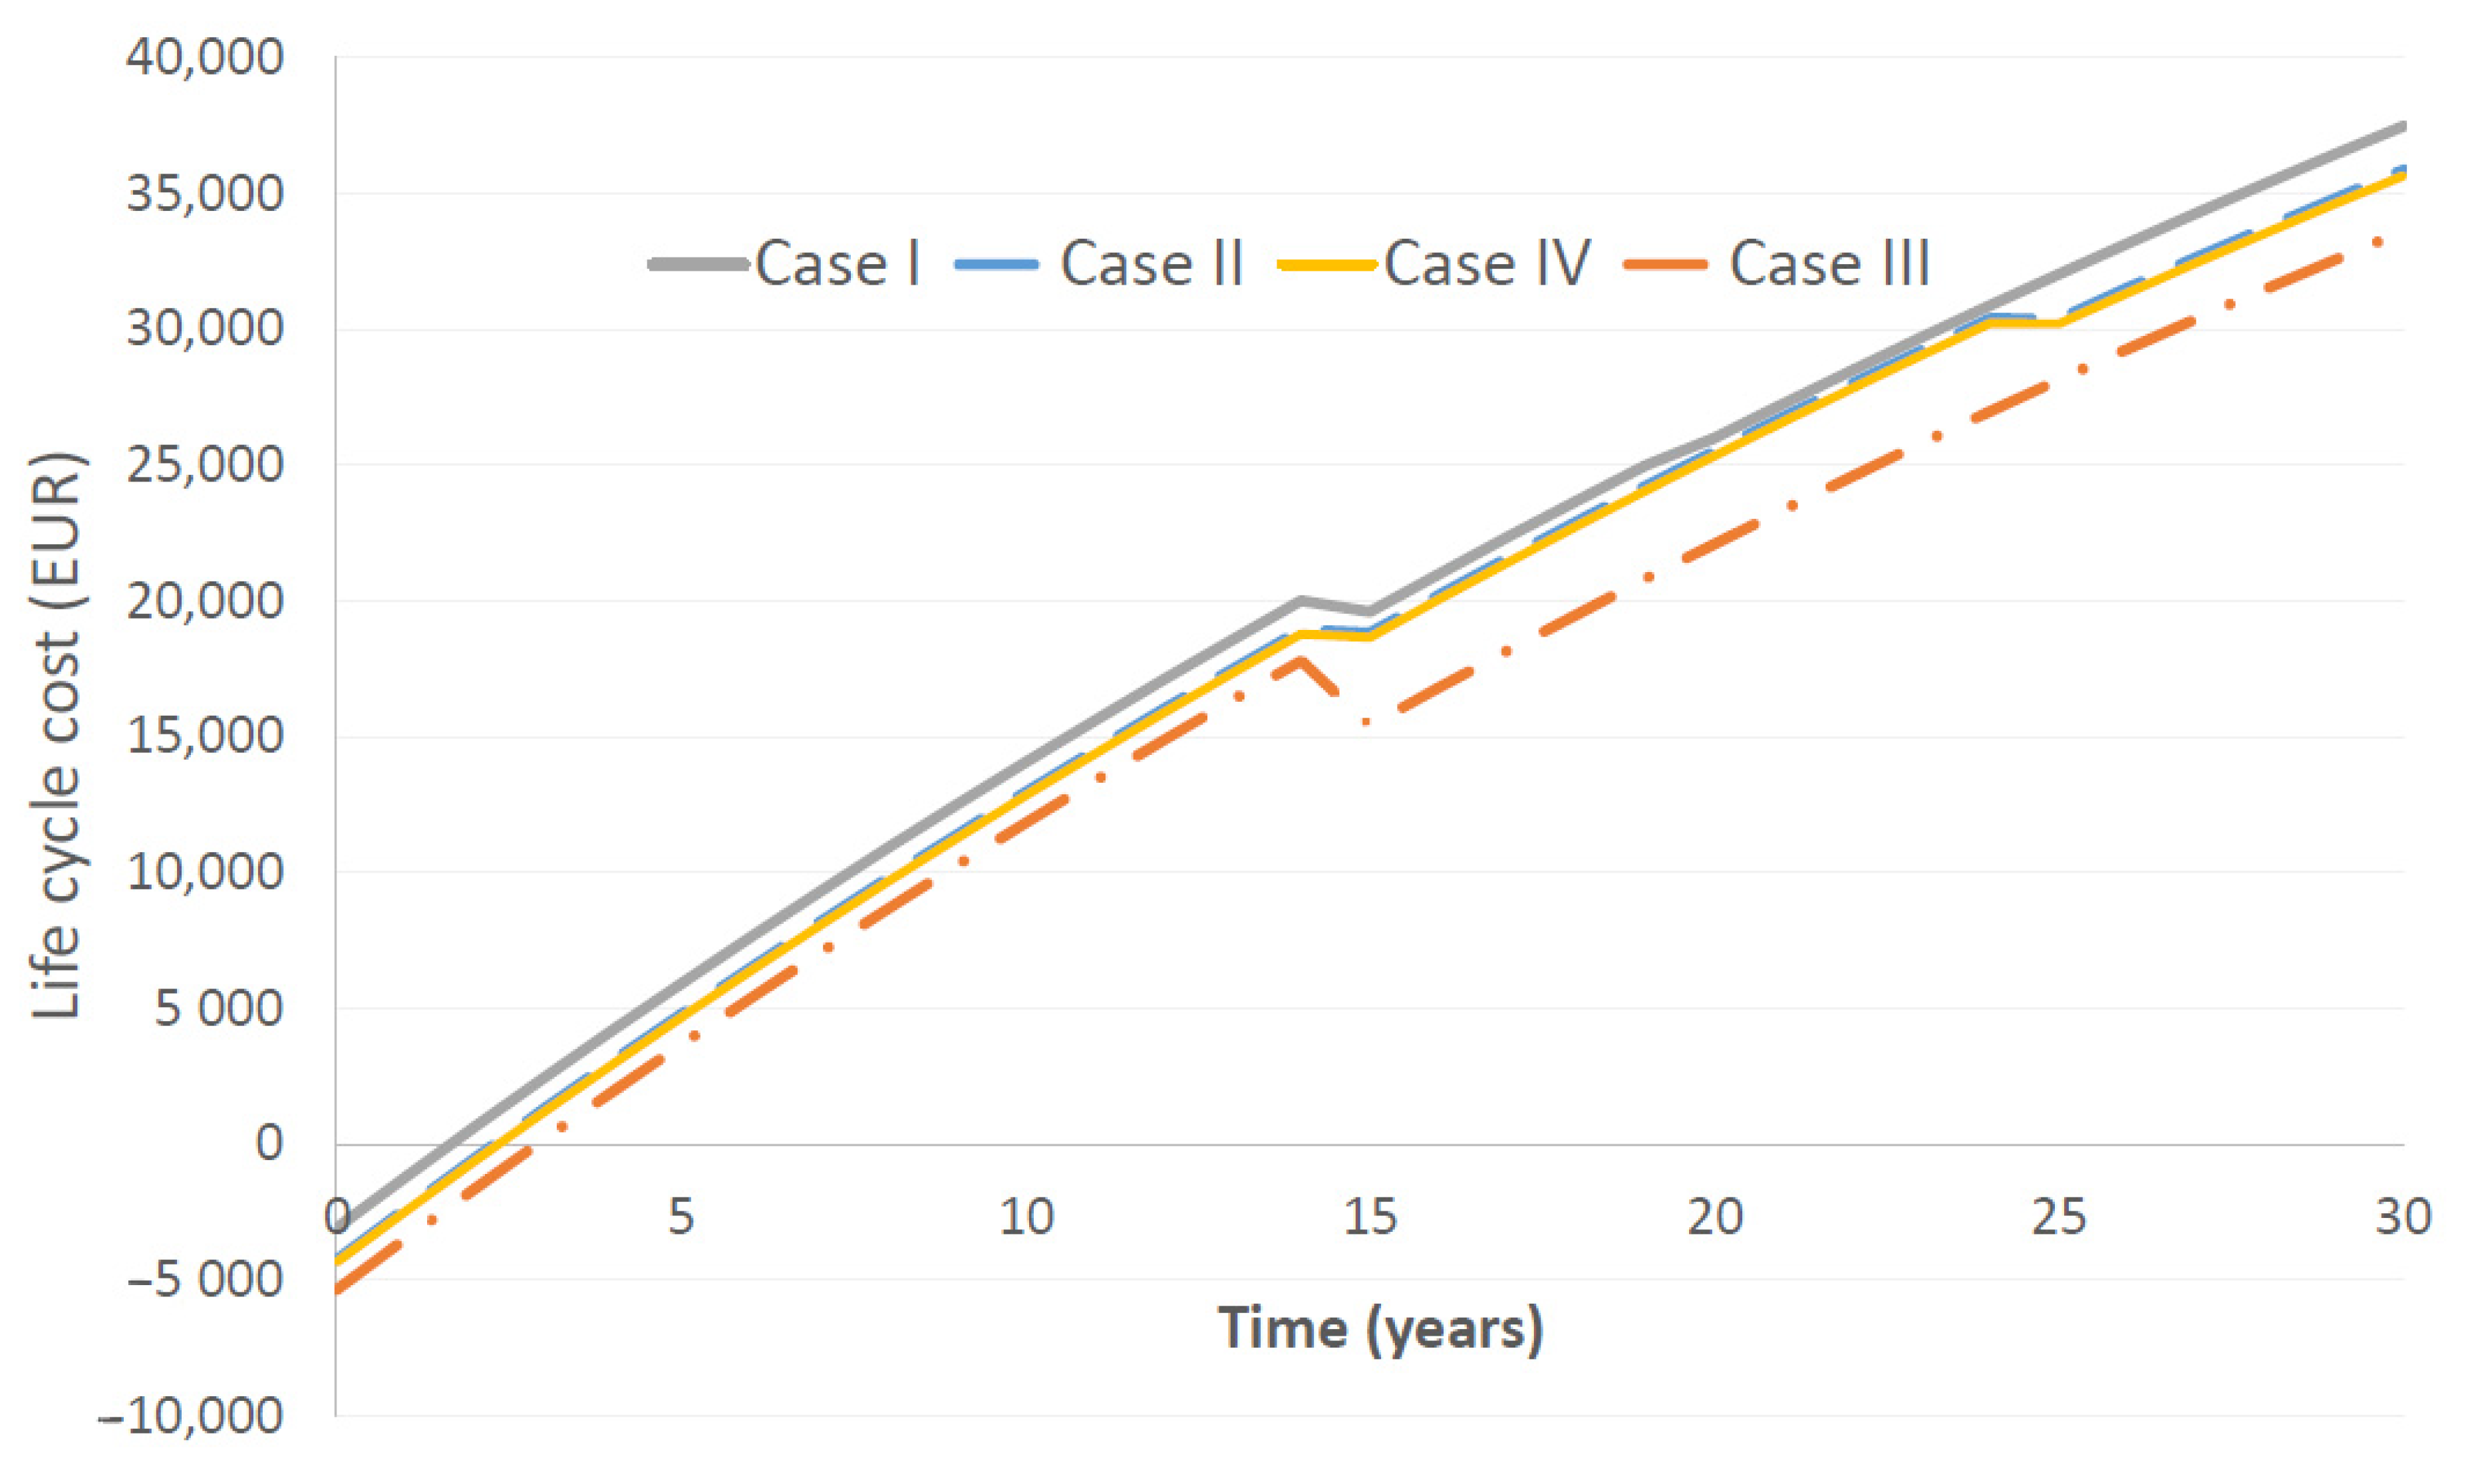
4.6. Life Cycle Cost of the Solar Thermal Installations

With the investments and lifespan shown in Table 2 and the savings depicted in Table 6, the net present value was calculated for every case. To clarify the analysis, we showed the case I numbers.
Case I contains five Thermosolar Žiar TS 300 solar collectors (2128.8 EUR, 30 years), a 200 L preheating tank (401.4 EUR, 20 years), one tank for DHW with 120 L (376 EUR, 15 years), a space-heating buffer tank of 500 L (906 EUR, 15 years), and a gas-fired boiler (1169.0 EUR, 15 years). Thus, this installation required buying some equipment (those whose lifespan is lower than 30 years) twice. The investment was calculated as follows:
I 0 = 4981.2 + ( 376.0 + 1169 + 376 ) e 15 r + ( 401.4 ) e 20 r
The economic savings were 159.4 EUR/month (Table 6), and the yearly savings resulted as 1909.71 EUR/year. With these numbers, we calculated the net present value:
N P V = I 0 e r t + 0 T * S i e r t d t = 4981.2 ( 376.0 + 1169 + 376 ) e 15 * 0.02 ( 401.4 ) e 20 * 0.02 + 0 30 1909.71 e 0.02 t d t = 37,496.36   EUR
The evolution in the cost of the gas boiler cases is shown in Figure 3. Table 7 shows the net present value for every solar thermal installation, and values were obtained by performing analogous calculations for every alternative. The effect of future replacement costs can be observed as decreases in the NPVs in Figure 3 (years 15 and 25).

4.7. Influence of the Discount Rate

We consider the discount rate as a sensitive criterion. The present value of each cash inflow/outflow considers a discount rate with this parameter. The equivalent continuous discount rate is not modifiable by users as it depends on the national country banks (−1.3% in the UK, 2.2% in the USA). This influence is illustrated in Figure 4, where high values of the equivalent discount rate reduce the economic differences for the installation scheme.

4.8. Life Cycle Assessment Calculation

Table 8 presents output data from “OneClickLCA” software for all alternatives. This analysis provides quantitative amounts of the environmental impact groups such as global warming potential (GWP), ozone depletion potential (ODP), acidification potential (AP), eutrophication potential (EP), photochemical ozone creation potential (POCP), and non-hazard waste (NHW). They are expressed as kilograms of CO2eq, SO2eq, (PO4)3-eq, CFC11eq, C2H4eq and NHW.
According to the results, case IX had the biggest impact on GWP, AP, and ODP categories, while the highest values in EP, POCP, and NHW were found for cases XI, X, and XII. Case I had the lowest impact on GWP, AP, EP, ODP, and POCP. The lowest value in the NHW category was for case II. Percent representations of life cycle phases on environmental impact categories are depicted in Figure 5. Modules A1–A3 represent the product phase (A1—raw material, A2—transport, A3—manufacturing), and module A4 represents transport to site. Modules B4–B5 represent the use phase (B4—repair, B5—refurbishment), and B6 represents operational energy use. Modules C1–C4 represent the end-of-life phase (C1—deconstruction, C2—transport, C3—waste processing, C4—disposal). Module D is benefits and loads beyond the system boundaries.
We can see that the best environmental impacts were in the use phase, modules B4—repair, B5—refurbishment, and B6—operational energy. Modules B4–B5 represent percentage of 20.8–47.9% for GWP; 13.8–44.7% for AP; 30.5–58.4 for EP; 19.2–53.6% for ODP; 25.4–54.0% for POCP; and 37.3–65.0% for NHW. Module B6 represents share of 21.8–48.1% for GWP; 28.1–60.5% for AP; 18.5–44.0% for EP; 28.6–71.1% for ODP; 18.4–39.3% for POCP; and 2.6–16.2%.for NHW. Module D, representing benefits (which have negative value), had a significant impact on the decrease in the total values of environmental impact categories, ranging 14.3–26.2% for GWP; 12.3–23.8% for AP; 3.6–15.4% for EP; 0.0–2.8% for ODP; 9.6–26.8% for POCP; and 10.8–35.1% for NHW. It also has to be mentioned that the product phase had impacts in the range of 4.3–11.9% for GWP; 2.6–10.8% for AP; 5.7–16.8% for EP; 3.7–11.3% for ODP; 6.1–17.1% for POCP; and 8.3–20.2% for NHW. Within “cradle to gate” (from resource extraction to the factory gate) effects (A1–A3), the most contributing components were solar thermal collector (30.5–74.% for alternatives 1–12); solar heat exchanger system (38.4–48.2% for cases IV, XI, and XII), heat pump (21.5–38.2 % for cases V, VII, IX, and XI), and wood fired boiler (31.1–50.4% for cases VI, VIII, X, and XII).

4.9. Multi-Criteria Decision Analysis

To choose the best alternative in calls of environmental, economic, and energy conditions, a multi-criteria analysis was performed. Based on the CDA, the summary weight of all criteria needs to have a value of 1. We assigned 0.34 for environmental (0.102 for GWP and ODP; 0.034 for AP, EP, POCP, and NHW), 0.33 for economic, and 0.33 for energy criteria. Table 9 shows the results of the multi-criteria analysis; case VI was the best and case II was the worst.

5. Discussion

The energy obtained by solar thermal modules was similar for every choice and, likewise, so was the supplementary energy needed by any other source (8900 kWh per year, Table 3). The results highlight that every solar thermal system is workable. In these conditions, we identified gas boiler alternatives (despite being economically viable) are far from heat pump cases. The wood-pellet boiler alternatives are the best economic options, as they do not represent a great expenditure and offer significant savings. The wood pellet boiler cases resulted in the least CO2 emissions, as depicted in Figure 4. Among them, case XII appears to be the best economic choice (a wood fire boiler).
Case XII is the best choice from the economic standpoint, but results are affected by the equivalent continuous discount rate. Small values of the equivalent discount rate mean greater revenues. To summarise, profits must be re-established to achieve a new apparatus as the upcoming savings will be discounted, and we obtain the pay off in a smaller stage.
Practitioners consider the payback period (the time at which the full expenditure reaches the full energy cost savings on the buy) for a ST system. However, this approach may lead to avoiding economic savings for the system lifespan. The payback period analysis formulation can be calculated [55,64]:
T i = 1 r . ln ( 1 r . I o S i )
We can get the values displayed in Table 10.
These results show that the strongest economical alternative would be case VI, not case XII. The payback period is not the proper index if only economic aspects are considered. The lowest payback period (case VI) gives lower benefits than case XII (Table 6 and Figure 4) for the life cycle cost analysis. So, we must select case XII from this economic standpoint.
Based on the results of LCA analysis considering only environmental criteria, case IX using a heat pump is the best. Most contributing components for GWP of this alternative are a solar collector (61.7%) and heat pump (38.2%). In contrast, the worst is case I, which also has a solar preheating tank, domestic hot water standby tank, space-heating buffer tank, and gas boiler. Most contributing components for GWP of this alternative are a solar collector (67.4%), gas boiler (23.5%), and hot water tank (9.1 %). The total values of the environmental impact categories are presented in Table 8. According to LCA analysis considering environmental, economic, and energy criteria, the best one is alternative 6. It also comprises a solar preheating tank, domestic hot water standby tank, space-heating buffer tank, and wood-fired boiler. Most contributing components for GWP of this alternative 6 are wood boiler (47.3%), solar collector (46.4%), and hot water tank (6.3%). Based on this study, considering all three aspects of sustainability, we can conclude the best is case VI. The study [65] dealing with the LCA of solar thermal systems also compares flat plate and vacuum tube systems. This emphasizes that both collectors can encompass more than half of the yearly hot water requirements for a family house with four inhabitants. The solar fraction values for the vacuum tube and the flat plate collector are 62.7% and 55.3%. According to this approach [37], the domestic solar water heating system market advances to expand, but the success rate depends on many circumstances that are not controlled by users (the costs of solar collectors versus ordinary heating processes, government subsidies, and the energy prices). Besides, another study [66] shows that the lowest increase in the technical building material on the overall LCA results was in a passive house because of the absence of “traditional” technical building machinery for heating.
Figure 6 shows the best-evaluated case of solar thermal installations for different evaluation methods. It can be said that the evaluation of just one aspect may not indicate the best alternative. A comprehensive assessment of several aspects, especially energy, economic, and environmental, helps us find the optimal solution.

6. Conclusions

The energy demanded by a residential building can be calculated using software, and the result shows higher demands than raw data from real-time. This need influences the solar thermal installation proposal for every case. Converting conventional gas boiler installations into ST systems may contribute to significant savings. However, this research also emphasizes that not dealing with the opportunities (wood pellets, boilers, or heat pumps) can offer considerable savings that are not handled. Wood-fired cases (XII, VIII, VI, X) resulted as the most interesting options only considering the economic aspects with a positive NPV oscillating among 54,261.96 and 61,262.56 EUR. All cases proved to be a good opportunity from an economic standpoint. This means it is feasible to convert gas boilers into ST systems. The cost analysis is proposed for assessing various options dealing with all the present expenditures and future earnings expressed in financial units at present (adopting the discount rate, r). This cost analysis reports the strongest opportunity, as with the highest savings for the installation lifespan.
We propose a method to determine which alternative is more workable, bearing in mind auxiliary heating sources. The different energy contribution is considered in specific software. By dealing with future expenses and savings for the lifespan of the machinery, the best alternative among the options in a real family house is calculated.
We associate the greatest annual operating costs by preparing heat for heating and DHW. This study [46] points out interesting information resulting from a comparison of heating systems and heat sources over 15 years, which correlates with the results of our study. It states that, regarding the total cost of the heating system during the 15-year evaluation period, wood heating is the most helpful, followed by natural gas, pellets, and a heat pump. If user comfort is included in the evaluation, then heating by natural gas is the most suitable choice in terms of price [46]. The disadvantage is that solar energy was not applied to the heat source, which would bring the results of the analysis closer to our results. Regarding the energy requirements of every case, we can assure that every scheme compared achieves the demands, and raw data from real-time present lower values than those simulated (Table 4). Finally, the life cycle analysis highlights the environmental concerns for the entire cradle-to-grave process.
In Slovakia, practitioners consider investment costs in the planning step of a building and technical systems. However, the costs of maintenance, system installation, and operation also describe a certain item in costs. Assessment of the life cycle costs can offer an optimal design and cost-effective heating and DHW system. Current global requirements to carry out a low-carbon environment force us to deal with environmental needs to a greater extent.

Author Contributions

J.K. performed modelling and analysis in software. M.Á.P.P. designed the research, concept, and methodology. S.V. performed LCA analysis, S.V. and D.K. cooperated in the research task, supervision, and data curation. All authors have read and agreed to the published version of the manuscript.

Funding

This study was financially supported by the Grant Agency of Slovak Republic to support project No 1/0512/20.

Institutional Review Board Statement

Not applicable.

Informed Consent Statement

Not applicable.

Data Availability Statement

Not applicable.

Acknowledgments

This study was financially supported by Grant Agency of Slovak Republic to support project No. 1/0512/20. This paper is also the result of the Project implementation: University Science Park TECHNICOM for Innovation Applications Supported by Knowledge Technology, ITMS: 26220220182, supported by the Research & Development Operational Programme funded by the ERDFI.

Conflicts of Interest

The authors declare no conflict of interest.

Nomenclature

APacidification potential
CDAConcordance Discordance Analysis
DHWDomestic hot water
ECEnergy Criteria Analysis
EPeutrophication potential
EUEuropean Union
GWPglobal warming potential
LCALife cycle assessment
LCCLife Cycle Cost
MCAMulti-criteria analysis
MCA7Software for performing MCA
NHWnon-hazard waste
NPVNet present value
PBPPay Back Period
POCPphotochemical ozone creation potential
OneClickLCASoftware for performing LCA
ODPozone depletion potential
STSolar thermal
T*SOLSoftware for ST calculations

References

  1. Yearbook, G.E.S. Total Energy Consumption 2019; Enerdata Intelligence + Consulting: Grenoble, France, 2020. [Google Scholar]
  2. IEA. World Energy Outlook 2019; IEA: París, France, 2019. [Google Scholar]
  3. Alexandratos, N.; Bruinsma, J. World Agriculture towards 2030/2050: The 2012 Revision; Global Perspective Studies Unit Food and Agriculture Organization of the United Nations: Rome, Italy, 2012.
  4. Jamali, S.; Nemati, A.; Mohammadkhani, F.; Yari, M. Thermal and economic assessment of a solar chimney cooled semi-transparent photovoltaic (STPV) power plant in different climates. Sol. Energy 2019, 185, 480–493. [Google Scholar] [CrossRef]
  5. EC. Communication from the Commission to the European Parliament, The European Council, The European Economic and Social Committee, The Committee of the Regions and the European Investment Bank. A Clean Planet for All a European Strategic Long-Term Vision for; EC: Brussels, Belgium, 2018. [Google Scholar]
  6. Bottero, M.; Dell’Anna, F.; Morgese, V. Evaluating the Transition towards Post-Carbon Cities: A Literature Review. Sustainability 2021, 13, 567. [Google Scholar] [CrossRef]
  7. Bottero, M.; Caprioli, C.; Cotella, G.; Santangelo, M. Sustainable Cities: A Reflection on Potentialities and Limits based on Existing Eco-Districts in Europe. Sustainability 2019, 11, 5794. [Google Scholar] [CrossRef] [Green Version]
  8. Peng, J.; Lu, L.; Yang, H. Review on life cycle assessment of energy payback and greenhouse gas emission of solar photovoltaic systems. Renew. Sustain. Energy Rev. 2013, 19, 255–274. [Google Scholar] [CrossRef]
  9. Perino, M.; Serra, V. Switching from static to adaptable and dynamic building envelopes: A paradigm shift for the energy efficiency in buildings. J. Facade Des. Eng. 2015, 3, 143–163. [Google Scholar] [CrossRef] [Green Version]
  10. Sozer, H. Improving energy efficiency through the design of the building envelope. Build. Environ. 2010, 45, 2581–2593. [Google Scholar] [CrossRef]
  11. Omrany, H.; Ghaffarianhoseini, A.; Ghaffarianhoseini, A.; Raahemifar, K.; Tookey, J. Application of passive wall systems for improving the energy efficiency in buildings: A comprehensive review. Renew. Sustain. Energy Rev. 2016, 62, 1252–1269. [Google Scholar] [CrossRef]
  12. Burman, E.; Mumovic, D.; Kimpian, J. Towards measurement and verification of energy performance under the framework of the European directive for energy performance of buildings. Energy 2014, 77, 153–163. [Google Scholar] [CrossRef] [Green Version]
  13. Fabrizio, E.; Seguro, F.; Filippi, M. Integrated HVAC and DHW production systems for Zero Energy Buildings. Renew. Sustain. Energy Rev. 2014, 40, 515–541. [Google Scholar] [CrossRef]
  14. European Commission Directive 2010/31/UE. Energy Performance of Building Directive Recast; European Commission: Brussels, Belgium, 2010. [Google Scholar]
  15. Henning, H.-M.; Döll, J. Solar systems for heating and cooling of buildings. Energy Procedia 2012, 30, 633–653. [Google Scholar] [CrossRef]
  16. Bouhal, T.; Fertahi, S.; Agrouaz, Y.; El Rhafiki, T.; Kousksou, T.; Zeraouli, Y.; Jamil, A. Technical assessment, economic viability and investment risk analysis of solar heating/cooling systems in residential buildings in Morocco. Sol. Energy 2018, 170, 1043–1062. [Google Scholar] [CrossRef]
  17. Cucchiella, F.; D’Adamo, I.; Gastaldi, M.; Stornelli, V. Solar photovoltaic panels combined with energy storage in a residential building: An economic analysis. Sustainability 2018, 10, 3117. [Google Scholar] [CrossRef] [Green Version]
  18. Tyagi, V.V.; Kaushik, S.C.; Tyagi, S.K. Advancement in solar photovoltaic/thermal (PV/T) hybrid collector technology. Renew. Sustain. Energy Rev. 2012. [Google Scholar] [CrossRef]
  19. Sarbu, I.; Sebarchievici, C. A comprehensive review of thermal energy storage. Sustainability 2018, 10, 191. [Google Scholar] [CrossRef] [Green Version]
  20. Ma, Y.; Kelman, A.; Daly, A.; Borrelli, F. Predictive control for energy efficient buildings with thermal storage: Modeling, stimulation, and experiments. IEEE Control Syst. 2012, 32, 44–64. [Google Scholar] [CrossRef]
  21. Khatib, T.; Mohamed, A.; Sopian, K. Optimization of a PV/wind micro-grid for rural housing electrification using a hybrid iterative/genetic algorithm: Case study of Kuala Terengganu, Malaysia. Energy Build. 2012. [Google Scholar] [CrossRef]
  22. Ishugah, T.F.; Li, Y.; Wang, R.Z.; Kiplagat, J.K. Advances in wind energy resource exploitation in urban environment: A review. Renew. Sustain. Energy Rev. 2014, 37, 613–626. [Google Scholar] [CrossRef]
  23. De Rosa, M.; Bianco, V.; Scarpa, F.; Tagliafico, L.A. Heating and cooling building energy demand evaluation; a simplified model and a modified degree days approach. Appl. Energy 2014, 128, 217–229. [Google Scholar] [CrossRef]
  24. Zhao, H.; Magoulès, F. A review on the prediction of building energy consumption. Renew. Sustain. Energy Rev. 2012, 16, 3586–3592. [Google Scholar] [CrossRef]
  25. Asdrubali, F.; Buratti, C.; Cotana, F.; Baldinelli, G.; Goretti, M.; Moretti, E.; Baldassarri, C.; Belloni, E.; Bianchi, F.; Rotili, A.; et al. Evaluation of green buildings’ overall performance through in situ monitoring and simulations. Energies 2013, 6, 6525–6547. [Google Scholar] [CrossRef] [Green Version]
  26. Bernardo, L.R.; Davidsson, H.; Andersson, E. Retrofitted solar domestic hot water systems for Swedish single-family houses—Evaluation of a prototype and life-cycle cost analysis. Energies 2016, 9, 953. [Google Scholar] [CrossRef] [Green Version]
  27. Buker, M.S.; Riffat, S.B. Building integrated solar thermal collectors—A review. Renew. Sustain. Energy Rev. 2015, 51, 327–346. [Google Scholar] [CrossRef]
  28. Pranesh, V.; Velraj, R.; Christopher, S.; Kumaresan, V. A 50 year review of basic and applied research in compound parabolic concentrating solar thermal collector for domestic and industrial applications. Sol. Energy 2019, 187, 293–340. [Google Scholar] [CrossRef]
  29. Qiu, Y.; He, Y.-L.; Li, P.; Du, B.-C. A comprehensive model for analysis of real-time optical performance of a solar power tower with a multi-tube cavity receiver. Appl. Energy 2017, 185, 589–603. [Google Scholar] [CrossRef] [Green Version]
  30. Košičan, J.; Pardo, M.Á.; Vilčeková, S. A Multicriteria Methodology to Select the Best Installation of Solar Thermal Power in a Family House. Energies 2020, 13, 1047. [Google Scholar] [CrossRef] [Green Version]
  31. Imteaz, M.A.; Ahsan, A. Solar panels: Real efficiencies, potential productions and payback periods for major Australian cities. Sustain. Energy Technol. Assess. 2018, 25, 119–125. [Google Scholar] [CrossRef]
  32. Attia, S.; Eleftheriou, P.; Xeni, F.; Morlot, R.; Ménézo, C.; Kostopoulos, V.; Betsi, M.; Kalaitzoglou, I.; Pagliano, L.; Cellura, M.; et al. Overview and future challenges of nearly zero energy buildings (nZEB) design in Southern Europe. Energy Build. 2017, 155, 439–458. [Google Scholar] [CrossRef]
  33. Bellos, E.; Tzivanidis, C. Energy and financial analysis of a solar driven thermoelectric generator. J. Clean. Prod. 2020, 2020, 121534. [Google Scholar] [CrossRef]
  34. Lamnatou, C.; Chemisana, D.; Mateus, R.; Almeida, M.G.; Silva, S.M. Review and perspectives on Life Cycle Analysis of solar technologies with emphasis on building-integrated solar thermal systems. Renew. Energy 2015, 75. [Google Scholar] [CrossRef]
  35. Ramírez-Villegas, R.; Eriksson, O.; Olofsson, T. Life cycle assessment of building renovation measures–trade-off between building materials and energy. Energies 2019, 12, 344. [Google Scholar] [CrossRef] [Green Version]
  36. Rønning, A.; Brekke, A. Life cycle assessment (LCA) of the building sector: Strengths and weaknesses. In Eco-Efficient Construction and Building Materials: Life Cycle Assessment (LCA), Eco-Labelling and Case Studies; Woodhead Publishing: Ostfold, Norway, 2013. [Google Scholar]
  37. Dekkiche, H.; Taileb, A. The Importance of Integrating LCA into the LEED Rating System. Procedia Eng. 2016, 145, 844–851. [Google Scholar] [CrossRef] [Green Version]
  38. Gagliano, A.; Aneli, S.; Nocera, F. Analysis of the performance of a building solar thermal facade (BSTF) for domestic hot water production. Renew. Energy 2019, 142, 511–526. [Google Scholar] [CrossRef]
  39. Arnaoutakis, N.; Souliotis, M.; Papaefthimiou, S. Comparative experimental Life Cycle Assessment of two commercial solar thermal devices for domestic applications. Renew. Energy 2017, 111, 187–200. [Google Scholar] [CrossRef]
  40. Hang, Y.; Qu, M.; Zhao, F. Economic and environmental life cycle analysis of solar hot water systems in the United States. Energy Build. 2012, 45. [Google Scholar] [CrossRef]
  41. Arabzadeh, V.; Jokisalo, J.; Kosonen, R. A cost-optimal solar thermal system for apartment buildings with district heating in a cold climate. Int. J. Sustain. Energy 2019, 38. [Google Scholar] [CrossRef]
  42. Comodi, G.; Bevilacqua, M.; Caresana, F.; Paciarotti, C.; Pelagalli, L.; Venella, P. Life cycle assessment and energy-CO2-economic payback analyses of renewable domestic hot water systems with unglazed and glazed solar thermal panels. Appl. Energy 2016, 164, 944–955. [Google Scholar] [CrossRef]
  43. Kumar, L.; Hasanuzzaman, M.; Rahim, N.A. Global advancement of solar thermal energy technologies for industrial process heat and its future prospects: A review. Energy Convers. Manag. 2019, 195, 885–908. [Google Scholar] [CrossRef]
  44. Morciano, M.; Fasano, M.; Secreto, M.; Jamolov, U.; Chiavazzo, E.; Asinari, P. Installation of a Concentrated Solar Power System for the Thermal Needs of Buildings or Industrial Processes. Energy Procedia 2016, 101, 956–963. [Google Scholar] [CrossRef] [Green Version]
  45. Chambers, T.; Raush, J.; Russo, B. Installation and Operation of Parabolic Trough Organic Rankine Cycle Solar Thermal Power Plant in South Louisiana. Energy Procedia 2014, 49, 1107–1116. [Google Scholar] [CrossRef] [Green Version]
  46. Lozano-Medina, A.; Manzano, L.; Marcos, J.D.; Blanco-Marigorta, A.M. Design of a concentrating solar thermal collector installation for a hotel complex in Gran Canaria. Energy 2019, 183, 803–811. [Google Scholar] [CrossRef]
  47. Ferreira, A.C.; Silva, A.; Teixeira, J.C.; Teixeira, S. Multi-Objective Optimization of Solar Thermal Systems Applied to Portuguese Dwellings. Energies 2020, 13, 6739. [Google Scholar] [CrossRef]
  48. Araújo, A.; Silva, R.; Pereira, V. Solar thermal modeling for rapid estimation of auxiliary energy requirements in domestic hot water production: On-off versus proportional flow rate control. Sol. Energy 2019, 177, 68–79. [Google Scholar] [CrossRef]
  49. Xu, B.; Li, P.; Chan, C.; Tumilowicz, E. General volume sizing strategy for thermal storage system using phase change material for concentrated solar thermal power plant. Appl. Energy 2015, 140, 256–268. [Google Scholar] [CrossRef] [Green Version]
  50. Shamir, U.; Howard, C.D.D. An analytic approach to scheduling pipe replacement. J.-Am. Water Work. Assoc. 1979, 71, 248–258. [Google Scholar] [CrossRef]
  51. Valentin Software, I. T*SOL ® Basic Version 5.0. Design and Simulation of Thermal Solar Systems; User Manual; Valentin Software, Inc.: Temecula, CA, USA, 2012; Volume 104. [Google Scholar]
  52. Pardo, M.Á.; Fernández, H.; Jodar-Abellan, A. Converting a Water Pressurized Network in a Small Town into a Solar Power Water System. Energies 2020, 13, 4013. [Google Scholar] [CrossRef]
  53. Bruce-Hyrkäs, T.; Pasanen, P.; Castro, R. Overview of Whole Building Life-Cycle Assessment for Green Building Certification and Ecodesign through Industry Surveys and Interviews. Procedia CIRP 2018, 69, 178–183. [Google Scholar] [CrossRef]
  54. Petrovic, B.; Myhren, J.A.; Zhang, X.; Wallhagen, M.; Eriksson, O. Life cycle assessment of a wooden single-family house in Sweden. Appl. Energy 2019, 251, 113253. [Google Scholar] [CrossRef]
  55. Pardo, M.A.; Manzano, J.; Valdés-Abellán, J.; Cobacho, R. Standalone direct pumping photovoltaic system or energy storage in batteries for supplying irrigation networks. Cost analysis. Sci. Total Environ. 2019. [Google Scholar] [CrossRef] [Green Version]
  56. Kleiner, Y.; Adams, B.J.; Rogers, J.S. Water distribution network renewal planning. J. Comput. Civ. Eng. 2001, 15, 15–26. [Google Scholar] [CrossRef] [Green Version]
  57. Ardente, F.; Beccali, G.; Cellura, M.; Brano, V. Lo Life cycle assessment of a solar thermal collector. Renew. Energy 2005, 30, 1031–1054. [Google Scholar] [CrossRef]
  58. Rubio, L.M.; Brito Filho, J.P.; Henriquez, J.R. Performance of a PV/T Solar Collector in a Tropical Monsoon Climate City in Brazil. IEEE Lat. Am. Trans. 2018, 16. [Google Scholar] [CrossRef]
  59. Geneletti, D. Multi-Criteria Analysis. LIAISE Toolbox. Available online: http://www.liaise-kit.eu/ia-method/multi-criteria-analysis (accessed on 19 February 2021).
  60. Keeney, R.L.; Raiffa, H.; Meyer, R.F. Decisions with Multiple Objectives: Preferences and Value Trade-Offs; Cambridge University Press: Cambridge, UK, 1993. [Google Scholar]
  61. Hu, Y.C.; Chen, C.J. A PROMETHEE-based classification method using concordance and discordance relations and its application to bankruptcy prediction. Inf. Sci. 2011, 181, 4959–4968. [Google Scholar] [CrossRef]
  62. Magrassi, F.; Rocco, E.; Barberis, S.; Gallo, M.; Del Borghi, A. Hybrid solar power system versus photovoltaic plant: A comparative analysis through a life cycle approach. Renew. Energy 2019, 130, 290–304. [Google Scholar] [CrossRef]
  63. Murugesan, R. Energy Use Efficiency in Dryland Agriculture; Kalpaz Publications: Delhi, Indica, 2010; ISBN 8178357992. [Google Scholar]
  64. Pardo, M.Á.; Cobacho, R.; Bañón, L. Standalone Photovoltaic Direct Pumping in Urban Water Pressurized Networks with Energy Storage in Tanks or Batteries. Sustainability 2020, 12, 738. [Google Scholar] [CrossRef] [Green Version]
  65. Milousi, M.; Souliotis, M.; Arampatzis, G.; Papaefthimiou, S. Evaluating the Environmental Performance of Solar Energy Systems Through a Combined Life Cycle Assessment and Cost Analysis. Sustainability 2019, 11, 2539. [Google Scholar] [CrossRef] [Green Version]
  66. Passer, A.; Kreiner, H.; Maydl, P. Assessment of the environmental performance of buildings: A critical evaluation of the influence of technical building equipment on residential buildings. Int. J. Life Cycle Assess. 2012, 17, 1116–1130. [Google Scholar] [CrossRef]
Figure 1. Workflow for the process to calculate the lifespan of the alternatives.
Sustainability 13 02305 g001
Figure 2. Numbers represent the following: 1—solar collector Thermosolar Žiar TS 300; 2—solar preheating tank, 200 L; 3—DHW (domestic hot water) standby tank, 120 L; 4—gas boiler, 15 kW; 5—combination tank, 1000 L; 6—dual coil indirect water tank, 300 L; 7—space-heating buffer tank, 500 L; 8—heat exchanger; 9—floor heating; 10—DHW consumption; 11—heat pump, 14 kW; 12—wood fired-boiler 14 kW.
Sustainability 13 02305 g002
Figure 3. Net present value evolution for cases I–IV.
Sustainability 13 02305 g003
Figure 4. Net present value in year 30 for the cases studied.
Sustainability 13 02305 g004
Figure 5. Percent representation of life cycle phases in environmental impact categories.
Sustainability 13 02305 g005aSustainability 13 02305 g005b
Figure 6. A diagram showing the best alternative in each evaluation method.
Sustainability 13 02305 g006
Table 1. Input climate data for a house and solar thermal installation.
Building LocationThermal Installation
LocationKošice, Slovakia
Latitude48.7°Active solar surface1.78 m2
Longitude−21.3°Gross collector area2.03 m2
Overall global irradiation (tilt angle 45°)1144.4 kWh/m2Orientation180 °C
Diffuse radiation53.90%Lowest outside temperature−13 °C
Average outside temperature9.8 °CAzimuth angles
Table 2. Investment cost of equipment for cases I–IV.
EquipmentCase ICase IICase IIICase IVLifespan
Solar collector TS 300 5x2128.82128.82128.82128.830
Solar Preheating tank 200 L401.4---20
DHW standby tank 120 L376.0-- 15
Gas Boiler 15 kW1169.01169.01169.01169.015
Combination tank--3956.1-15
Dual coil indirect water tank 300 L-1944.8-1944.825
Space-heating buffer tank 500 L906.0906.0-906.015
Collector loop heat exchanger- -100.030
Total Investment4981.26148.67253.96248.6
EquipmentCase VCase VICase VIICase VIIILifespan
Solar collector TS 300 5x2128.82128.82128.82128.830
Solar Preheating tank 200 L401.4401.4--20
DHW standby tank 120 L376.0376.0--15
Heat pump- 14 kW14,744.0-14,744.0-15
Wood fire boiler-14 kW-852.0-852.015
Combination tank----25
Dual coil indirect water tank 120 L--1944.81944.815
Space-heating buffer tank 500 L906.0906.0-906.030
Collector loop heat exchanger----30
Total Investment18,556.24664.218,817.65831.6
EquipmentCase IXCase XCase XICase XIILifespan
Solar collector TS 300 5x2128.82128.82128.82128.830
DHW standby tank 120 L----20
Heat pump- 14 kW14,744.0-14,744.0-15
Wood fire boiler-14 kW-852.0-852.015
Combination tank3956.093956.09--15
Dual coil indirect water tank 120 L--1944.81944.825
Space-heating buffer tank 500 L--906.0906.015
Collector loop heat exchanger--100.0100.030
Total Investment20,828.896936.8919,823.65931.630
Table 3. The energy required (kWh/day) from auxiliary heating.
Gas BoilerHeat PumpWood Pellet Boiler
Case I8970.7Case V8969.9Case VI8970.8
Case II8911.9Case VII8970.8Case VIII8910.2
Case III8934.1Case IX8931.5Case X8930.2
Case IV8947.5Case XI8942.2Case XII8943.7
Table 4. Energy demanded by heating and DHW regarding simulation software and measured actual values (kWh/year).
HeatingDomestic Hot Water
CasesSoftwareReal-TimeSoftwareReal-Time
ST heat pump8969.901131.022040.65768.50
ST wood-fired boiler8943.704547.402040.65725.57
ST gas boiler8970.703467.792040.65792.35
Table 5. CO2 emissions avoided for every alternative.
Heat PumpCO2
[kg]
El.
(kWh)
Wood-FiredPellets [kg]CO2
[kg]
Gas BoilerCO2
[kg]
N.Gas
[kg]
Case V254.06381.5Case VI579.7179.7Case I711.29336.4
Case VII247.24371.24Case VIII563.6174.7Case II684.79323.8
Case IX324.78487.7Case X734.3227.6Case III853.08403.4
Case XI246.29369.8Case XII560.8173.8Case IV681.55322.3
Table 6. Economic monthly savings for every alternative.
Case ICase IICase IIICase IV
159.14159.81159.56159.41
Case VCase VICase VIICase VIII
247.47230.73247.56230.94
Case IXCase XCase XICase XII
247.53230.87230.87247.51
Table 7. The net present value for every alternative for the solar thermal (ST) lifespan (30 years).
Case ICase IICase IIICase IV
37,496.3635,884.6933,628.5435,671.05
Case VCase VICase VIICase VIII
49,519.6858,207.7249,063.3656,205.22
Case IXCase XCase XICase XII
45,551.7654,261.9647,371.2161,262.56
Table 8. Output data from LCA software.
Case GWP
kg CO2eq
AP
kg SO2eq
EP
kg (PO4)3−eq
ODP
kg CFC11eq
POCP
kg C2H4eq
NHW
kg
I10,549.7748.3917.830.002533.681876.17
II14,339.0863.3419.270.00333.801247.27
III24,869.33109.3229.090.00525.291284.77
IV21,190.6692.9234.970.00374.675282.93
V17,592.6389.2722.20.003985.331833.69
VI14,611.9874.3921.110.00299.116178.25
VII21,180.22103.0723.470.004685.391197.44
VIII18,401.3089.3422.550.00369.235549.34
IX34,000.20162.1135.260.006987.511318.23
X28,931.55135.3232.370.005610.725586.85
XI28,003.48132.4939.140.005086.265232.08
XII25,252.87118.9238.250.004110.109585.00
Table 9. Results of the CDA method from MCA7 software.
RankingPriorityScoreRankingPriorityScore
1Case VI4.48147Case XI10.3488
2Case IX5.35688Case I11.2578
3Case XII5.54429Case IV12.1477
4Case V7.530210Case X12.4270
5Case VIII7.530211Case III13.9121
6Case VII9.826212Case II16.9924
Table 10. Payback period (years) for every alternative.
Case ICase IICase IIICase IV
2.683.313.943.38
Case VCase VICase VIICase VIII
6.681.716.772.15
Case IXCase XCase XICase XII
7.562.577.162.04
Publisher’s Note: MDPI stays neutral with regard to jurisdictional claims in published maps and institutional affiliations.

