Does Forest Industries in China Become Cleaner? A Prospective of Embodied Carbon Emission
Abstract
1. Introduction
1.1. Embodied Carbon Theory
1.2. Literature Review
2. Methods
2.1. Method to Calculate the Embodied Carbon
2.2. Method to Analyze the Factors Affecting Embodied Carbon Emissions
3. Measurement of Embodied Carbon
3.1. Data and Industries
3.2. Model and Computations
4. Results and Analysis
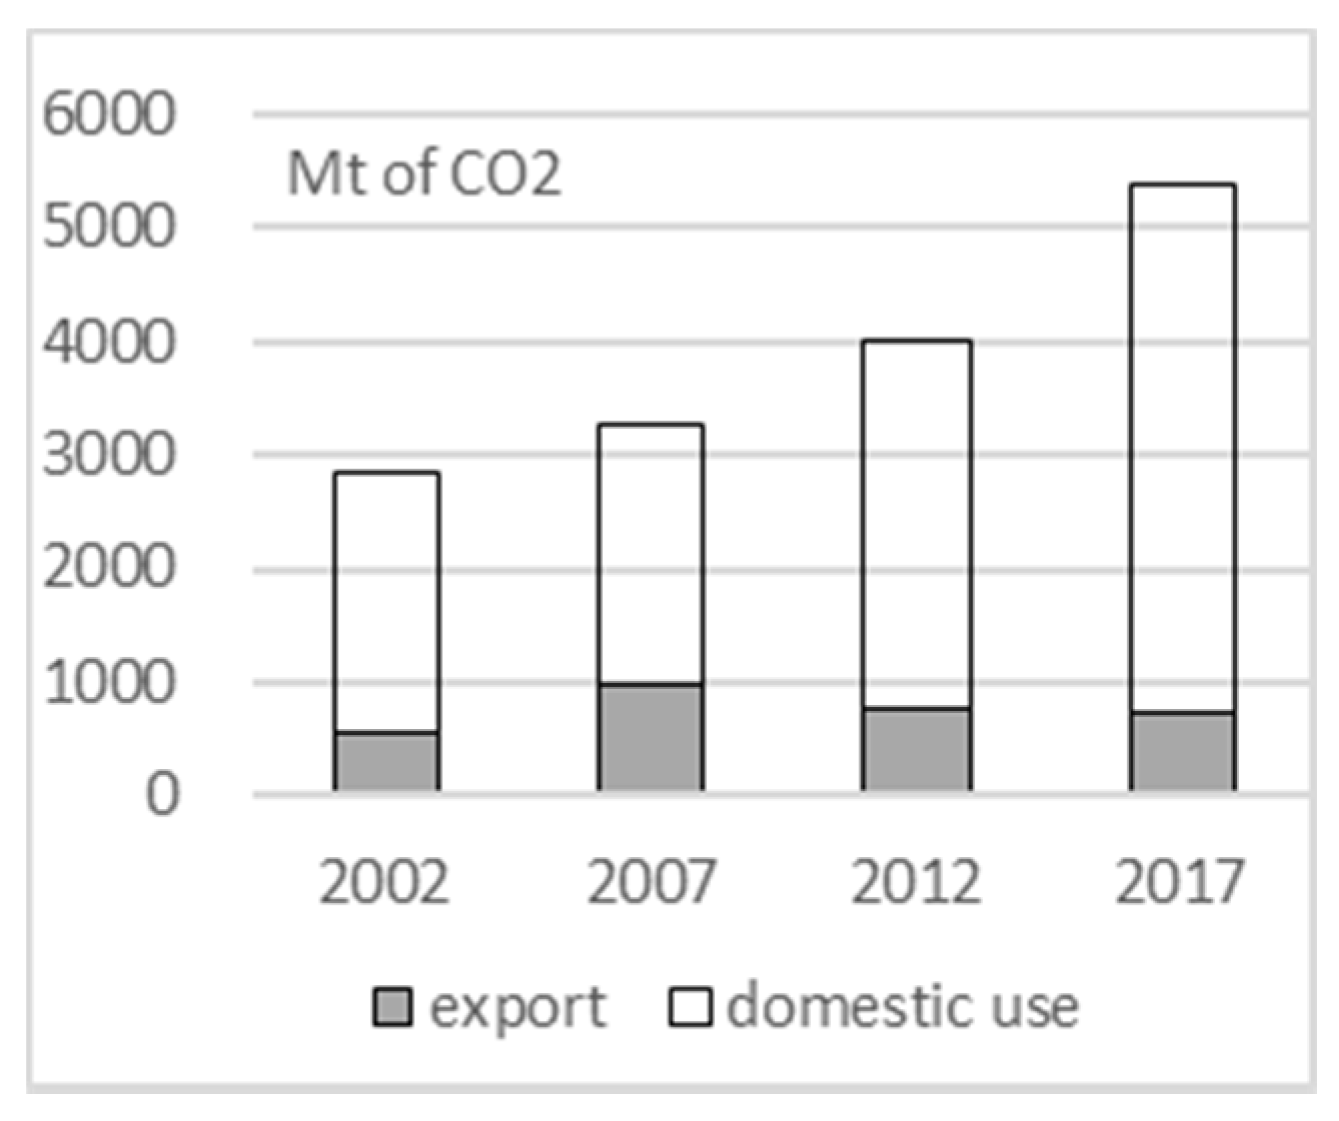
4.1. Embodied Carbon Emission
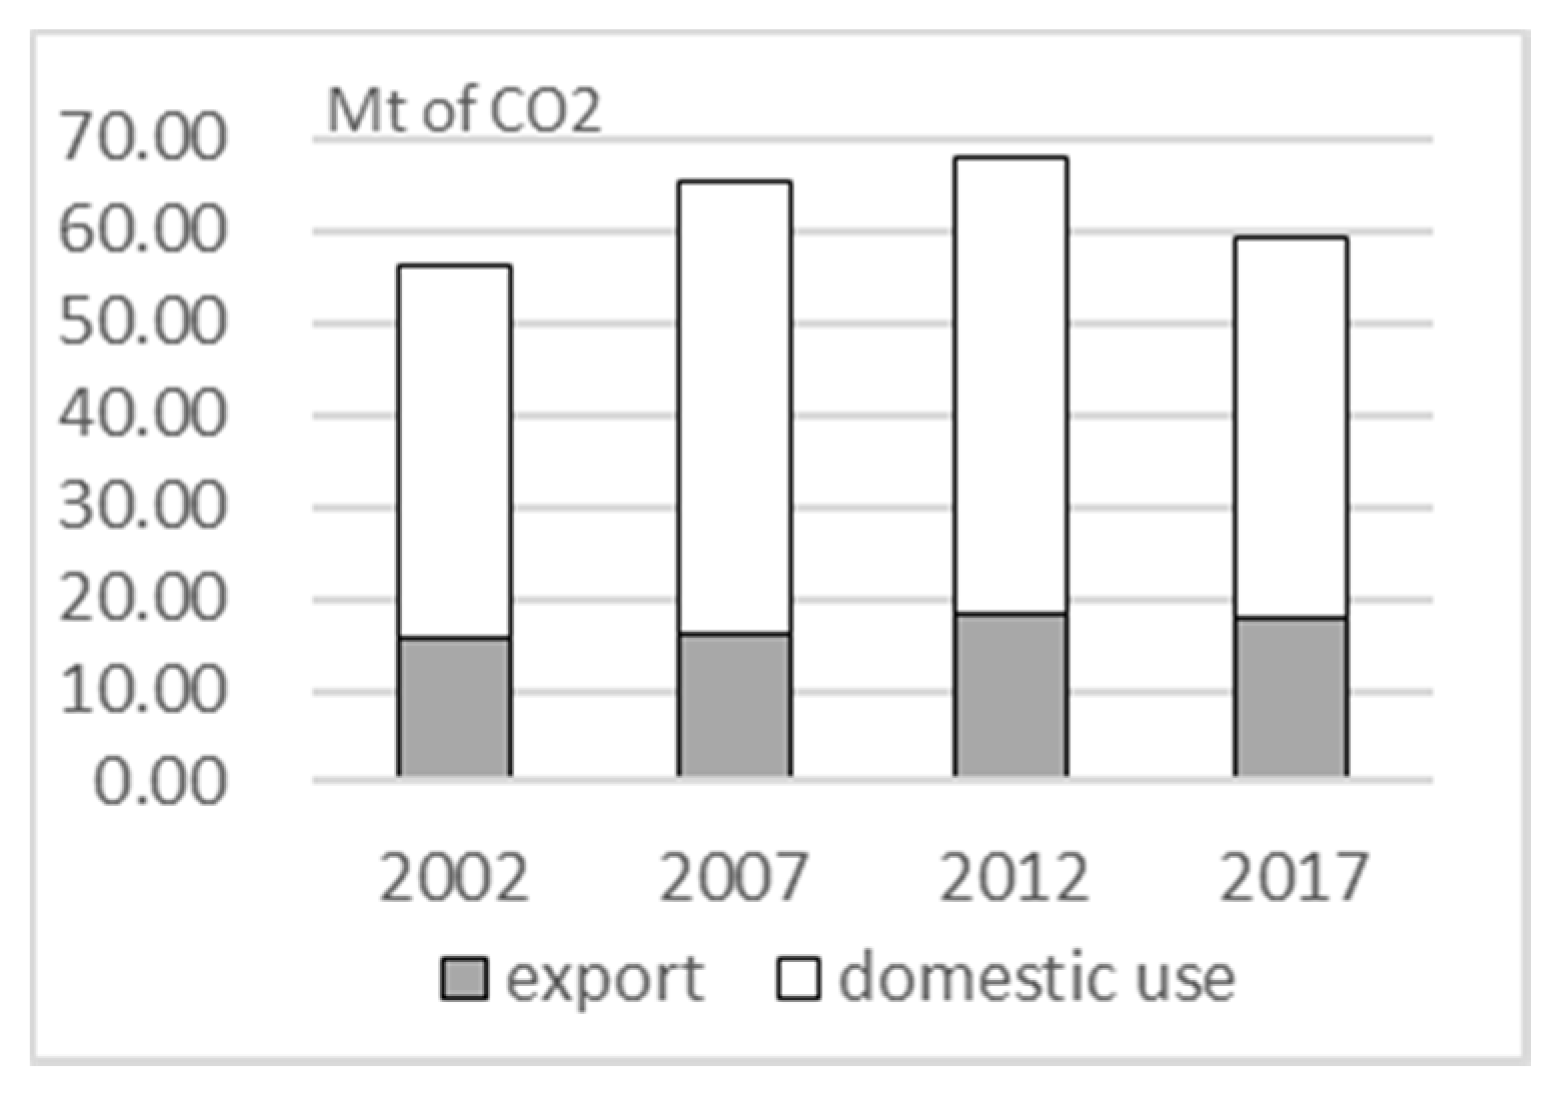
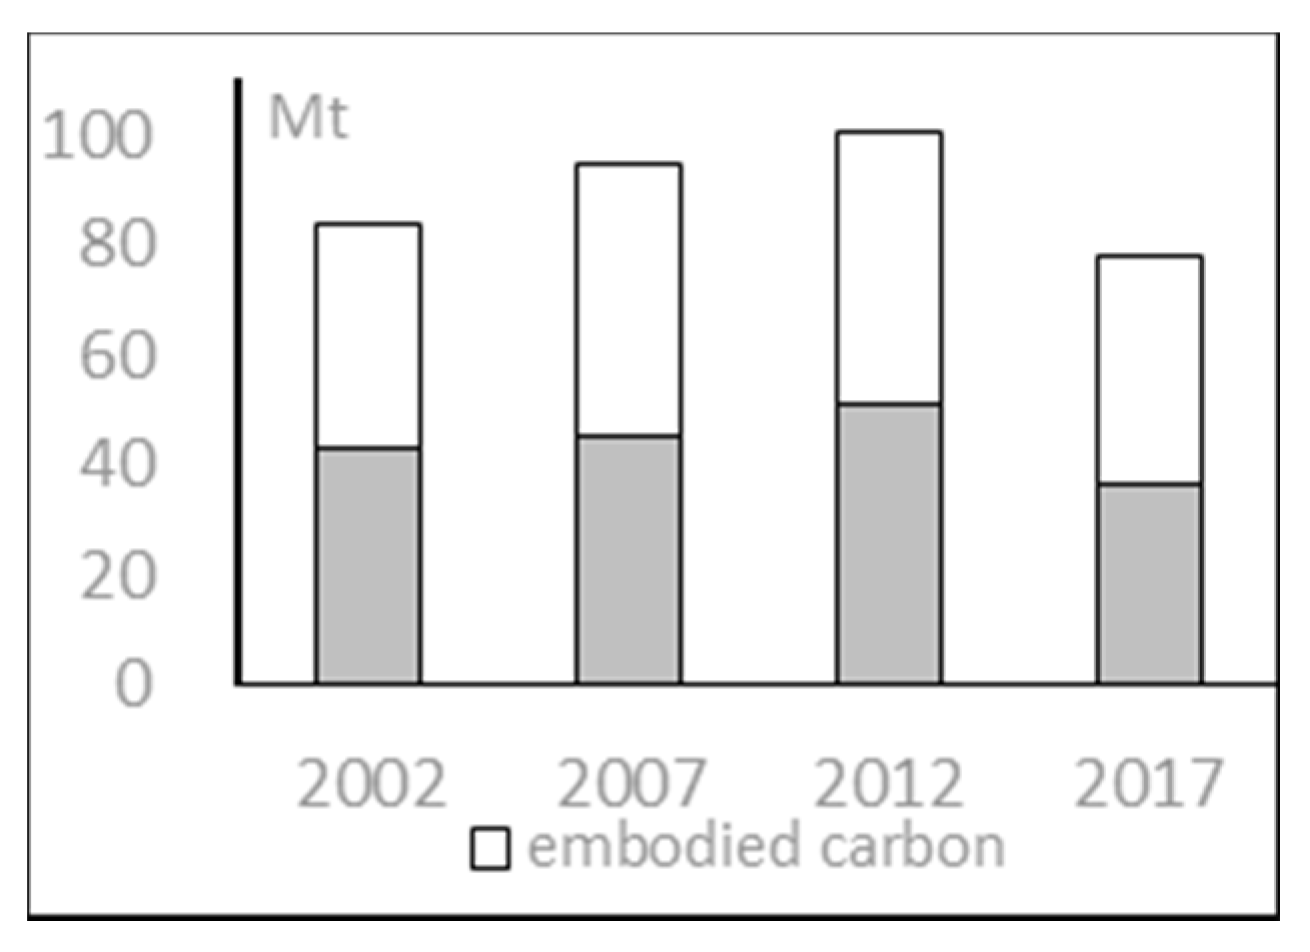
4.2. Embodied Carbon of Forest Product Industries
4.3. Analysis of the Factors Affecting Embodied Carbon
5. Conclusions and Discussion
Author Contributions
Funding
Institutional Review Board Statement
Informed Consent Statement
Data Availability Statement
Acknowledgments
Conflicts of Interest
References
- Odum, H.T. Environmental Accounting: Energy and Environmental Decision Making; John & Wiley: New York, NY, USA, 1996; pp. 135–167. [Google Scholar]
- Allan, J.A. Vitual Water: A Long Term Solution for Water Short Middle Eastern Economics; Leeds University of Leeds Press: Leeds, UK, 1997; pp. 24–29. [Google Scholar]
- Tian, J.; Liao, H.; Wang, C. Spatial–temporal variations of embodied carbon emission in global trade flows: 41 economies and 35 sectors. Nat. Hazards 2015, 78, 1125–1144. [Google Scholar] [CrossRef]
- Liu, Y.; Meng, B.; Hubacek, K.; Xue, J.; Feng, K.; Gao, Y. ‘Made in China’: A reevaluation of embodied CO2 emissions in Chinese exports using firm heterogeneity information. Appl. Energy 2016, 184, 1106–1113. [Google Scholar] [CrossRef]
- Wu, R.; Geng, Y.; Dong, H.; Fujita, T.; Tian, X. Changes of CO2 emissions embodied in China–Japan trade: Drivers and implications. J. Clean. Prod. 2016, 112, 4151–4158. [Google Scholar] [CrossRef]
- Li, Z.; Sun, L.; Geng, Y.; Dong, H.; Ren, J.; Liu, Z.; Tian, X.; Yabar, H.; Higano, Y. Examining industrial structure changes and corresponding carbon emission reduction effect by combining input-output analysis and social network analysis: A comparison study of China and Japan. J. Clean. Prod. 2017, 162, 61–70. [Google Scholar] [CrossRef]
- Zhao, Y.; Wang, S.; Zhang, Z.; Liu, Y.; Ahmad, A. Driving factors of carbon emissions embodied in China–US trade: A structural decomposition analysis. J. Clean. Prod. 2016, 131, 678–689. [Google Scholar] [CrossRef]
- Ye, Q.; Li, H.; Xu, M. The estimation of the embodied carbon in China international trade. China Popul. Resour. Environ. 2008, 18, 8–13. [Google Scholar]
- Yin, X.; Cheng, M. The policy on the embodied carbon in Sino-US trade. China Ind. Econ. 2010, 8, 45–55. [Google Scholar]
- Song, Y. The Quantitative Analysis on the Embodied Carbon in China Export and Its Affecting Factors; Shandong Institute of Technology: Jinan, China, 2012; pp. 31–45. [Google Scholar]
- Zhao, Y.; Liu, Y. The embodied carbon calculation based on input-output table. China Popul. Resour. Environ. 2011, 21, 8–14. [Google Scholar]
- Jiang, Y.; Cai, W.; Wan, L.; Wang, C. An index decomposition analysis of China’s interregional embodied carbon flows. J. Clean. Prod. 2015, 88, 289–296. [Google Scholar] [CrossRef]
- Zhao, Q.; Ding, S.; Wen, Z.; Toppinen, A. Energy Flows and Carbon Footprint in the Forestry-Pulp and Paper Industry. Forests 2019, 10, 725. [Google Scholar] [CrossRef]
- Bai, W. Study on the Carbon Emission Features of Wood Furniture and Carbon Reduction Strategy; Beijing Forestry University: Beijing, China, 2013; pp. 15–32. [Google Scholar]
- Sun, M.; Wang, Y.; Shi, L.; Klemeš, J.J. Uncovering energy use, carbon emissions and environmental burdens of pulp and paper industry: A systematic review and meta-analysis. Renew. Sustain. Energy Rev. 2017, 92, 823–833. [Google Scholar] [CrossRef]
- Elias, H.; Tanja, M.; Jyri, S.; Tero, H.; Antti, K.; Timo, P.; Tuomas, M.; Lauri, H.; Antti, A.; Heli, P. Impact of structural changes in wood-using industries on net carbon emissions in Finland. J. Ind. Ecol. 2020, 24, 1–14. [Google Scholar]
- Wyckoff, A.; Jospeh, W.; Roop, M. The embodiment of carbon in imports of manufactured products: Implications for international agreements on greenhouse gas emissions. Energy Policy 1994, 22, 187–194. [Google Scholar] [CrossRef]
- Schaeffer, R.; De Sá, A. The embodiment of carbon associated with Brazilian imports and exports. Energy Convers. Manag. 1996, 37, 955–960. [Google Scholar] [CrossRef]
- Machado, G.; Schaeffer, R.; Worrell, E. Energy and carbon embodied in the international trade of Brazil: An input–output approach. Ecol. Econ. 2001, 39, 409–424. [Google Scholar] [CrossRef]
- Munksgaard, J.; Pedersen, K.A. CO2 accounts for open economies: Producer or consumer responsibility? Energy Policy 2001, 29, 327–334. [Google Scholar] [CrossRef]
- Muradian, R.; O’Connor, M.; Martinez-Alier, J. Embodied pollution in trade: Estimating the ‘environmental load displacement’ of industrialized countries. Ecol. Econ. 2002, 41, 51–67. [Google Scholar] [CrossRef]
- Hubacek, K.; Giljum, S. Applying physical input–output analysis to estimate land appropriation (ecological footprints) of international trade activities. Ecol. Econ. 2003, 44, 137–151. [Google Scholar] [CrossRef]
- Bin, S.; Harriss Robert, C. The role of CO2 embodiment in US-China trade. Energy Policy 2012, 34, 4063–4068. [Google Scholar]
- International Organisation for Standardisation (ISO). ISO 14040: Environmental Management–Life Cycle Assessment-Principles and Framework; ISO: Geneva, Switzerland, 2006. [Google Scholar]
- Hoekstra, R.; Bergh, J.J.C. Comparing structural and index decomposition analysis. Energy Econ. 2003, 25, 39–64. [Google Scholar] [CrossRef]
- Ang, B.; Choi, W.; Hong, K. Decomposition of Aggregate Energy and Gas Emission Intensities for Industry: A Refined Divisia Index Method. Energy J. 1997, 18, 59–73. [Google Scholar] [CrossRef]
- Buongiorno, J.; Johnston, C.; Zhu, S. An assessment of gains and losses from international trade in the forest sector. For. Policy Econ. 2017, 80, 209–217. [Google Scholar] [CrossRef]
- China Input-Output Association, China Input-Output Tables. Available online: http://www.stats.gov.cn/ztjc/tjzdgg/trccxh/ (accessed on 1 August 2019).
- National Accounting Department. National Bureau of Statistics: China Input & Output Table 2002; China Statistics Press: Beijing, China, 2004; pp. 23–46.
- National Accounting Department. National Bureau of Statistics: China Input & Output Table 2007; China Statistics Press: Beijing, China, 2009; pp. 21–42.
- National Accounting Department. National Bureau of Statistics: China Input & Output Table 2014; China Statistics Press: Beijing, China, 2012; pp. 25–43.
- National Accounting Department. National Bureau of Statistics: China Input & Output Table 2017; China Statistics Press: Beijing, China, 2019; pp. 22–40.
- National Accounting Department. National Bureau of Statistics: Energy Statistics Yearbook; China Statistics Press: Beijing, China, 2018; pp. 20–22.
- Leontief, W.W. Quantitative Input and Output Relations in the Economic Systems of the United States. Rev. Econ. Stat. 1936, 18, 105. [Google Scholar] [CrossRef]
- Li, H.; Qin, Q. Challenges for China’s carbon emissions peaking in 2030: A decomposition and decoupling analysis. J. Clean. Prod. 2019, 207, 857–865. [Google Scholar] [CrossRef]
- The State Council Information Office of the People’s Republic of China. Energy in China’s New Era; The State Council Information Office of the People’s Republic of China: Beijing, China, 2020; pp. 6–7.
- Streets, D. Black carbon emissions in China. Fuel Energy Abstr. 2002, 43, 287. [Google Scholar] [CrossRef]


| Industry Code No. | Industry |
|---|---|
| 01 | Agriculture, forestry, livestock, fishing |
| 02 | Coal mining |
| 03 | Petroleum and natural gas exploitation industry |
| 04 | Metal mining industry |
| 05 | Non-metal mining industry |
| 06 | Food and tobacco processing industry |
| 07 | Textile industry |
| 08 | Textile product industry |
| 09 | Wood furniture manufacturing industry |
| 10 | Paper, stationery manufacturing industry |
| 11 | Fuel processing |
| 12 | Chemical industry |
| 13 | Non-metal product industry |
| 14 | Metal processing industry |
| 15 | Metal product industry |
| 16 | General and special equipment manufacturing |
| 17 | Transportation equipment manufacturing industry |
| 18 | Electrical equipment manufacturing industry |
| 19 | Electronic equipment manufacturing industry |
| 20 | Office machinery manufacturing |
| 21 | Other manufacturing |
| 22 | Electric power supply industry |
| 23 | Production and supply of gas industry |
| 24 | Production and supply of water industry |
| 25 | Construction industry |
| 26 | Transportation, storage and communications |
| 27 | Trade, accommodation and catering industry |
| 28 | Other industries |
| Code | Energy Source | CO2 Emission by 1 kg Standard Charcoal Equivalent (Unit: kg) | Calorific Value (Unit: kcal/kg) | CO2 Emission Coefficient (Constant) |
|---|---|---|---|---|
| 01 | Raw coal | 94,600 | 6800 | 2.69 |
| 02 | Washed clean coal | 94,600 | 6800 | 2.69 |
| 03 | Other washed coal | 94,600 | 6400 | 2.53 |
| 04 | Molded coal | 97,500 | 3800 | 1.55 |
| 05 | Coke | 107,000 | 7000 | 3.14 |
| 06 | Coke oven gas | 44,400 | 5000 | 2.07 |
| 07 | Other oven gas | 44,400 | 4200 | 0.89 |
| 08 | Other coking products | 107,000 | 7000 | 3.69 |
| 09 | Crude oil | 73,300 | 9000 | 3.41 |
| 10 | Petrol | 70,000 | 7500 | 3.05 |
| 11 | Kerosene | 71,900 | 8500 | 3.20 |
| 12 | Diesel oil | 74,100 | 8800 | 3.17 |
| 13 | Fuel oil | 77,400 | 9200 | 3.76 |
| 14 | Liquefied petroleum gas | 63,100 | 6635 | 3.02 |
| 15 | Refinery dry gas | 57,600 | 9000 | 2.41 |
| 16 | Other petroleum products | 73,300 | 9000 | 3.07 |
| 17 | Natural gas | 56,100 | 8900 | 2.09 |
| Period | Energy Structure | Energy Intensity | Economic Output | Population Size | Carbon Emission |
|---|---|---|---|---|---|
| 2002–2007 | −6.56 | −18.23 | 32.69 | 1.11 | 9.02 |
| 2007–2012 | −5.48 | −24.93 | 31.85 | 1.31 | 2.75 |
| 2012–2017 | −3.42 | 21.32 | −27.26 | 0.65 | −8.7 |
| Accumulative | −15.46 | −21.84 | 37.28 | 3.07 | 3.07 |
Publisher’s Note: MDPI stays neutral with regard to jurisdictional claims in published maps and institutional affiliations. |
© 2021 by the authors. Licensee MDPI, Basel, Switzerland. This article is an open access article distributed under the terms and conditions of the Creative Commons Attribution (CC BY) license (http://creativecommons.org/licenses/by/4.0/).
Share and Cite
Wang, L.; Cui, Z.; Kuuluvainen, J.; Sun, Y. Does Forest Industries in China Become Cleaner? A Prospective of Embodied Carbon Emission. Sustainability 2021, 13, 2306. https://doi.org/10.3390/su13042306
Wang L, Cui Z, Kuuluvainen J, Sun Y. Does Forest Industries in China Become Cleaner? A Prospective of Embodied Carbon Emission. Sustainability. 2021; 13(4):2306. https://doi.org/10.3390/su13042306
Chicago/Turabian StyleWang, Lanhui, Zichan Cui, Jari Kuuluvainen, and Yongyu Sun. 2021. "Does Forest Industries in China Become Cleaner? A Prospective of Embodied Carbon Emission" Sustainability 13, no. 4: 2306. https://doi.org/10.3390/su13042306
APA StyleWang, L., Cui, Z., Kuuluvainen, J., & Sun, Y. (2021). Does Forest Industries in China Become Cleaner? A Prospective of Embodied Carbon Emission. Sustainability, 13(4), 2306. https://doi.org/10.3390/su13042306


