1. Introduction
Globally, the water development and supply sector’s economic sustainability are threatened by scarcity of freshwater around the world, and with ever rising demands straining the industry. The role of water service providers has become crucial in ensuring that water is distributed efficiently, equably, and sustainably. Unfortunately, they face several challenges, particularly, high losses of water within the distribution networks. These losses are reflected through non-revenue water (NRW) and are commonly defined as “the difference between the volume of water put into a water distribution system and the volume that is billed to customers” [
1]. High NRW rates indicate that large volumes of water are mostly lost through leaks or breakage (real losses), water consumption that is not billed to customers (apparent losses), and unbilled authorized consumption [
2,
3,
4]. One of the causes of high NRW rates in developing countries is the lack of incentives to promote more efficient and sustainable water management [
5]. Approximately 32 billion cubic meters of treated water is lost worldwide each year due to physical breaks and leaks in water pipes. More than half of these losses tend to occur in developing countries, which exacerbates existing issues caused by disruption of supplies and poor water quality [
6].
Given that water loss is a worldwide phenomenon [
7], it is important to consider the context of water loss to the specific attributes of the local conditions. As reported by the Asian Development Bank in 2006, around 30% of produced water in South East Asian countries such as Indonesia, Malaysia, Thailand, Philippines, and Vietnam contribute to NRW [
6]. Malaysia has been noted to have unusually high NRW values.
NRW in Malaysia
In recent years, water authorities in Malaysia have expressed concern over the issue of sustainable water management [
8], due to high records of NRW rates. Pipe materials, joining methods of the distribution system components, the initial installation of system components, water conditions, and external environmental conditions contribute to the water loss problem [
9]. The common types of pipes used in Malaysia’s water distribution system include asbestos-cement (AC), mild steel (MS), ductile iron (DI), polyethylene (PE), galvanized iron (GI), acrylonitrile butadiene (ABS), cast iron (CI), and un-plasticized polyvinylchloride (uPVC) [
10].
Given the severity of the NRW issue, the Malaysian government in its Eighth Malaysia Plan 2001–2005 introduced numerous strategies and initiatives to curtail the water loss, including funding for replacing old water meters and enhancing the general public infrastructure [
8,
11]. Other incentives taken to tackle leakage problems and improve piping networks include replacing current asbestos–cement pipes with pipe materials with better durability such as ductile iron, mild steel, and polyethylene [
12]. Although the government has implemented various incentive programs to curtail the NRW losses, the loss rate is still alarming.
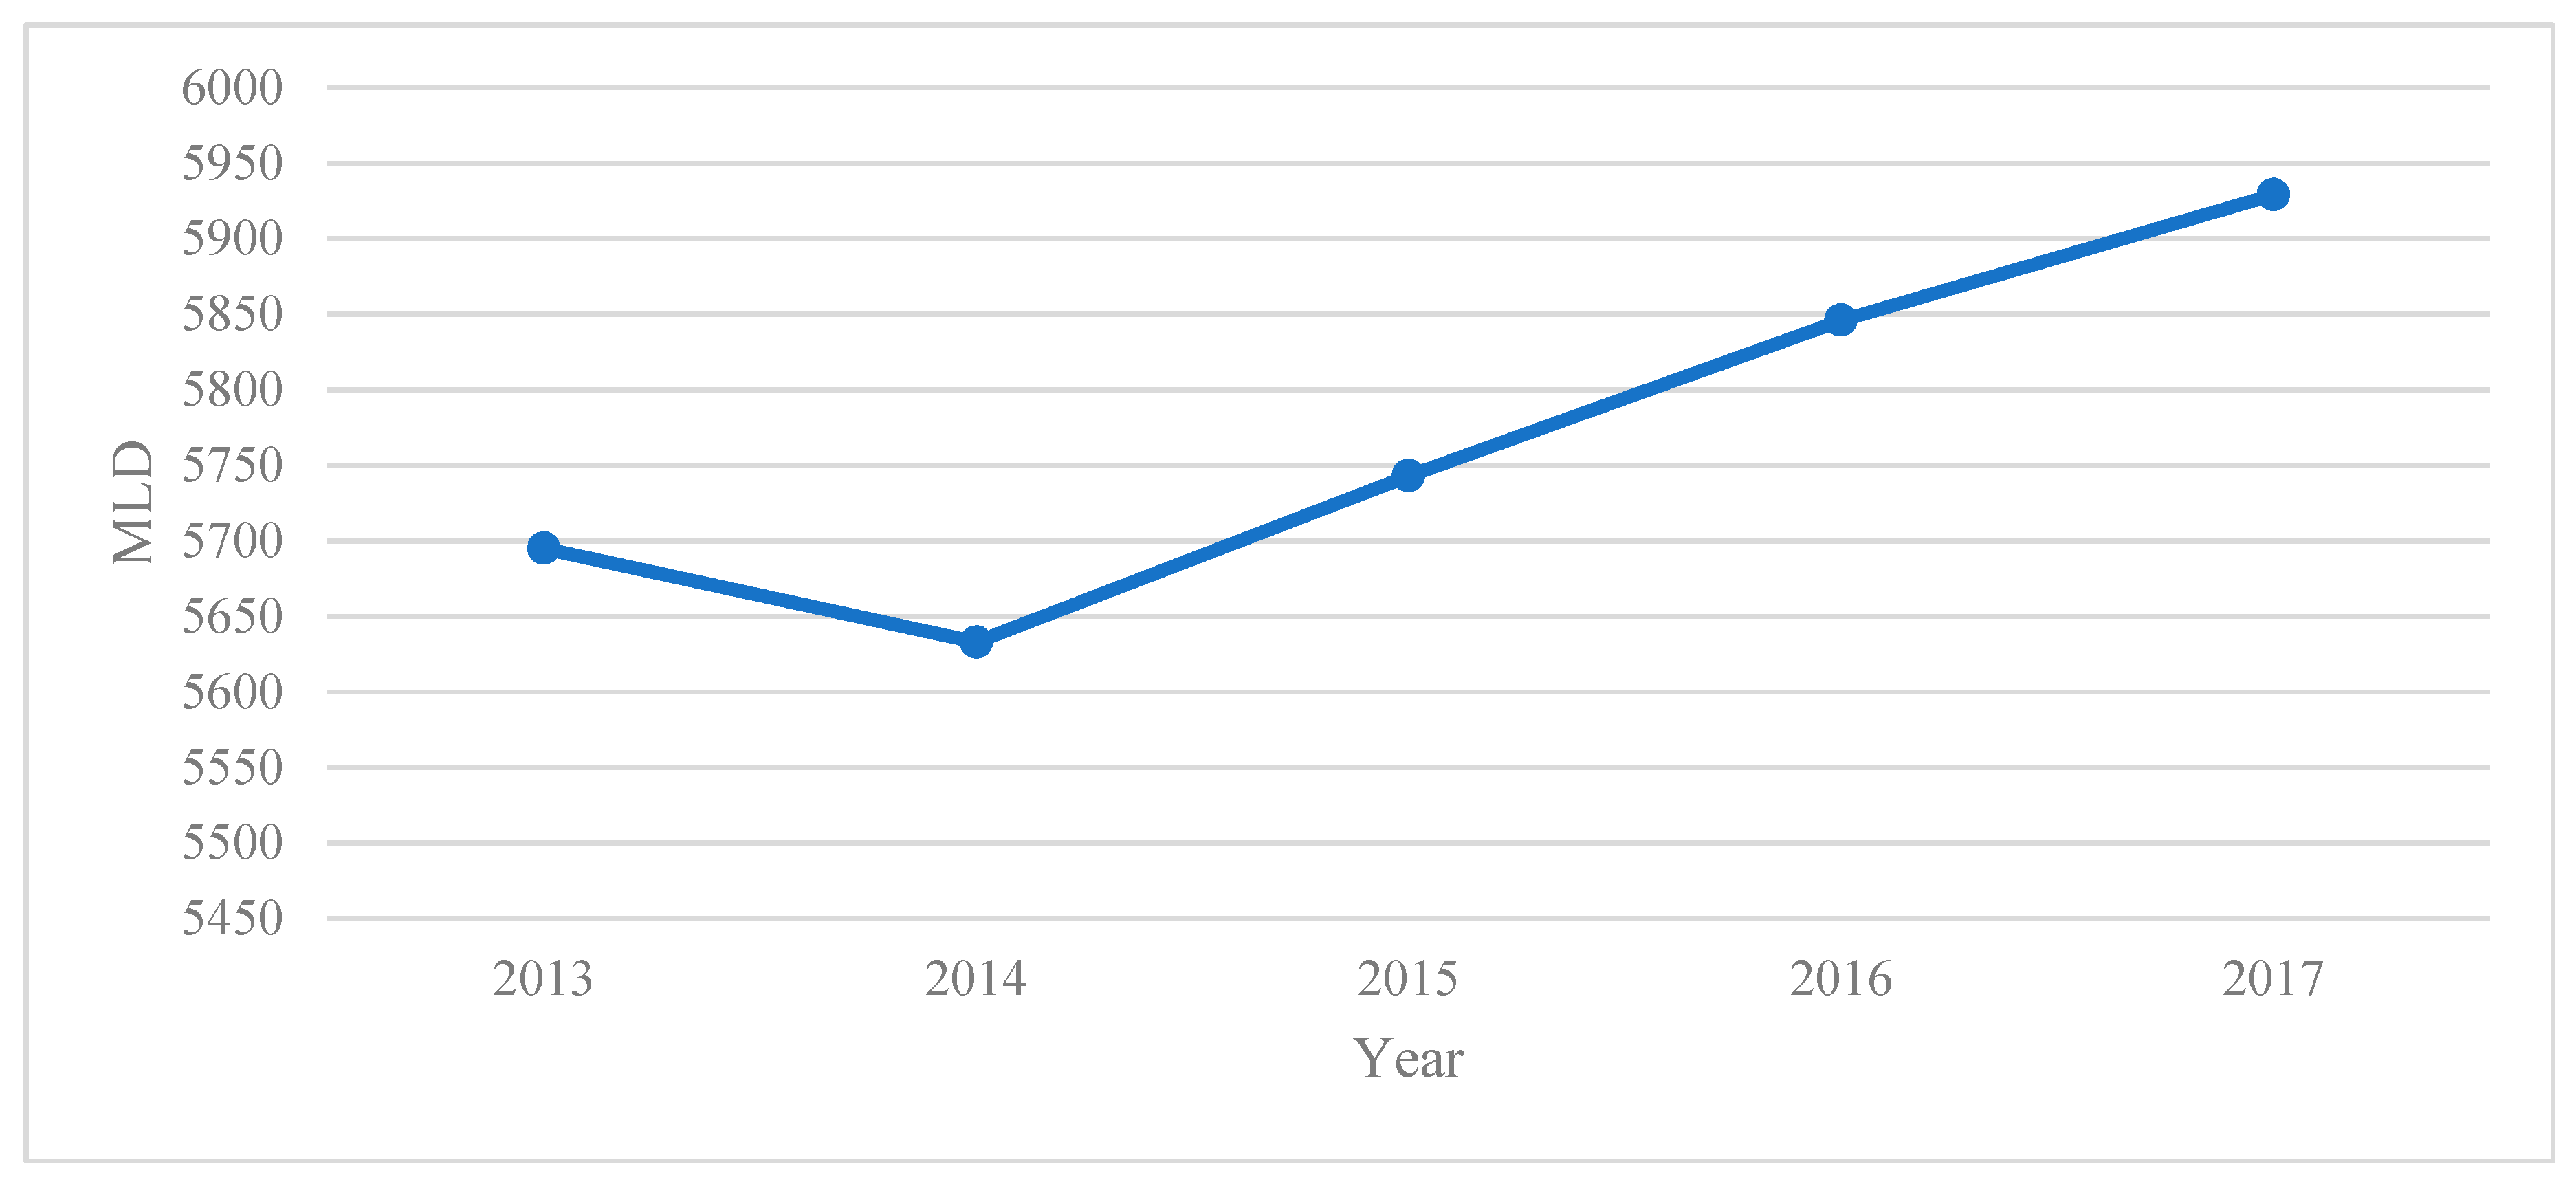
Figure 1 illustrates the trend of NRW rates in Malaysia over five years. It is evident that the NRW has gradually increased since 2014 [
9,
13,
14,
15]. In 2017, the NRW was recorded to be approximately 5929 million liters per day (MLD).
Given that physical losses stand as an undeniable source of water loss aside from commercial and unbilled authorized consumption, it is imperative to understand how different water pipe types contribute to the NRW losses. Yet, studies relating to water pipes and water loss phenomena are relatively limited. The NRW loss is mainly viewed as a water utility performance indicator [
1]. Hence, many studies emphasize the design and implementation of aspects of NRW reduction through the improvisation of water utility performance [
1,
16,
17]. Therefore, to gain a better insight into other contributing attributes of NRW, this study examines the association between the various types of water pipes and its significance on NRW loss. The types of water pipe studied in this paper are ductile iron, mild steel, and polyethylene. The remaining sections of the paper are structured as follows:
Section 2 provides a comprehensive literature review of the various types of pipes utilized in the water networks and factors contributing to NRW in Malaysia.
Section 3 outlines the research methodology used to analyze the factors that contribute to the cause of NRW. In
Section 4, the results are presented, followed by a discussion on the implication of the results. In the final section, conclusions are drawn and limitations of the current study as opportunities for future research are included.
3. Research Methodologies
Data collected on the volume of NRW losses per year and pipe lengths for this research were obtained from the Malaysian Water Industry Guide (MWIG) books published by the Malaysian Water Association, which specifically contain and provide a wide range of water industry data and statistics in Malaysia. The sample period covers the fiscal years from 2013 to 2017 (inclusive) and 70 state-year observations. This study employed multiple linear regressions using pooled ordinary least square regressions analysis. The sample period’s yearly variation is accounted for by introducing the year as a fixed effect. Given the nature of the data (a state-year case of panel), it was noted that the regressors were often highly correlated. Due to this, the error is correlated over time for a given state, resulting in heteroskedasticity in the residuals when it is estimated. White’s heteroskedastic robust estimator test was employed to account for heteroskedasticity in this study [
67]. For this study, the following regression model was adopted:
where NRW is non-revenue water loss. LMS stands for the length of mile steel pipes, LDI refers to the length of ductile iron pipes, LPE is the length of polyethylene (HDPE variant) pipes, and LOP is the length of other pipes. Therefore, the length of water pipes refers to the level of usage of the pipes in the water network. In this study, mild steel pipes were widely used for large diameter pipes due to their ability to handle high strength and pressure, implying that they carry higher volumes of water than the other types. In this model, subscript β represents the beta coefficient,
i represents the state, and
t denotes time measured in years. A set of control variables was included in this model, and
ɛ represents the random-error term. The definition and measurement of dependent, experimental, and control variables are explained in
Appendix A.
For further analysis, the data on the number of news hits and water disruption notices that are available in the public domain were considered. The data was retrieved from Selangor (located in West Malaysia) and Sarawak (located in East Malaysia) due to the significant record of reports that included information about the type of pipes which failed. In Selangor, information on water disruptions and related types of pipe failures were gathered from several prominent online newspapers such as The Star, Malay Mail, and New Straits Times. Meanwhile in Sarawak, the types of pipe affected for each case were made available from water disruption notices provided by their state water authority website. Cases of water pipe leakage and bust pipes reported for both states are provided in
Appendix B and
Appendix C.
In this analysis, a case index is calculated by taking the number of cases divided by every 1000 km length of pipes laid in 2017, according to the corresponding pipe material reported. Since data on length of pipes according to pipe material in each state is not available after 2017 in the Malaysian Water Association official website, only cases within this timeframe were considered for consistency and comparison.
4. Results
Table 1 presents the NRW values for each state in Malaysia from 2013 to 2017 [
10,
13,
14,
15]. To obtain the values presented in
Table 1, the NRW percentage is estimated based on the deduction of volumes of billed authorized consumption from the system input volume. Interestingly, 10 out of 14 states in Malaysia show an increase in NRW over the years. The related Malaysian states are denoted as * in
Table 1.
Table 2 shows the total number of water service complaints on pipe burst/breakages/leak [
10,
13,
14,
15]. Based on the representation from
Table 2, it is evident that six out of 14 states in Malaysia have shown an increase in terms of water service complaints on cases of pipe bursts/breakages/leaks. The growth in the number of cases signifies that there is an increased contribution towards real losses of NRW.
The descriptive statistics of each variable are reported in
Table 3. The mean NRW is 412.03 million liters per day with a standard deviation of 368.92. Meanwhile, the mean length of mild steel, ductile iron, and HDPE are 2959.5, 826.03, and 1839.84 km, respectively. The pipes with the longest lengths are mild steel.
Table 4 presents the Pearson correlations between the variables. Non-revenue water (NRW) is found to be significantly and positively correlated with length of ductile iron pipes, length of mild steel pipes, length of polyethylene pipes, and length of other pipes listed in the Malaysian Water Industry Guide. At the same time, NRW is found to be significantly and positively correlated with domestic volume of water consumption (DVC), non-domestic volume of water consumption (NDVC), number of water services interruption scheduled (WSIS), number of water services interruption unscheduled (WSIUS), number of water services complaints of pipe bursts, breakages and leaks (WSC), and population served by state (POPSER). Some of the figures presented in
Table 4 suggest absolute value exceeding 50%, which include those between LMS and NDVC (coeff. = 0.829,
p = 0.00), between LMS and POPSER (coeff. = 0.867,
p = 0.00), between DVC and NDVC (coeff. = 0.867,
p = 0.00), between DVC and POPSER (coeff. = 0.897,
p = 0.00), between NDVC and POPSER (coeff. = 0.874,
p = 0.00), and between WSIS and POPSER (coeff. = 0.867,
p = 0.00), and further, the absolute value between WCS and DVC (coeff. = 0.840,
p = 0.00), between WCS and NDVC (coeff. = 0.818,
p = 0.00), and between WCS and POPSER (coeff. = 0.785,
p = 0.00). The variance inflation factor (VIF) for each independent variable is computed, and the mean VIF is 7.3 (unreported). For brevity, the results are not tabulated. This suggests that multicollinearity is not likely to be an issue in this analysis.
The hypothesis presented in this paper predicts an association between the different types of pipes and NRW loss, ceteris paribus.
Table 5 shows the influence of different types of pipes on NRW loss. The results show that the effects of different type of water pipes on NRW loss are positive and significantly correlated for mild steel pipes (β = 0.0849, t = 3.347,
p = 0.0015) and HDPE pipes (β = 0.0687, t = 4.699,
p < 0.01). The results support Hypothesis H1, thereby suggesting that mild steel and HDPE pipes positively contribute towards NRW loss.
Table 5 also indicates that there are negative but insignificant association between ductile iron pipes (β = −0.0058, t = −0.126,
p = 0.9003) and other pipes (β = −0.0037, t = −0.594,
p = 0.5548) with NRW loss. This suggests that ductile iron and other pipes are not associated with NRW loss. Overall, the statistical results show that the types of water pipes have influence on the NRW loss.
The lengths of water pipes laid according to pipe materials for Selangor and Sarawak are presented in
Figure 3. The distribution of pipe lengths in Selangor is very similar to the distribution seen in the entire country shown in
Figure 1. Mild steel is mostly used, followed by other types of materials that consist of mostly asbestos cement water pipes. In contrast, ductile iron and polyethylene only take up a small portion of the pipes laid in Selangor. Therefore, one can say that Selangor could be a good representation of the distribution of water pipe material in the country in general. On the other hand, Sarawak took an unconventional approach compared to many other states in the country by using a lot of polyethylene, followed by ductile iron and very little mild steel. The data from Sarawak serves as a good contrast to the typical distribution in Selangor.
Figure 4 shows the case index for Selangor and Sarawak between 2011 and 2017 (inclusive). The case index for Selangor has consistent ranking with the length of pipes laid in this state. Although the usage of ductile iron pipes was almost six times more than mild steel pipes in Sarawak, the case index is still the highest. Cases due to damaged pipe caused by construction projects were not included in this study.
Mild steel remains at the top for both states, followed by HDPE. The results from these case indexes measured supports the correlation study.
5. Discussion
NRW loss remains a crucial issue yet an endemic challenge in developing countries. The need to manage NRW better and protect precious water resources has become increasingly important. In this study, the association between different types of water pipes used and NRW loss was explored. Types of water pipes mainly affect NRW in the form of physical losses through pipe failures. The findings suggest that there is an association between different types of water pipes and NRW loss. Based on results presented, mild steel pipes had a significant effect on NRW loss. Despite the fact that mild steel pipes can carry large volumes of water for a relative length, they can contribute to NRW losses. Thereby, longer length usage of mild steel pipes suggests an increase on the plausibility of higher NRW loss. Similarly, results show that HDPE pipes are also associated with NRW loss. Thus, the longer length usage of HDPE pipes contributes towards NRW loss. On the contrary, ductile iron pipes were found to have an insignificant association with NRW loss. Overall, this study suggests that different kinds of water pipe have influence over NRW loss. Given the environment, inappropriate selection of water pipe can result in high failure rates, which increases NRW loss. Therefore, it is important to account for an appropriate selection of water pipes in the water distribution system.
Although applications of steel and iron pipelines are seen in the water distribution system, mild steel pipes appear to have a significant association to NRW loss in comparison to ductile iron pipes based on the correlation analysis and case index presented in this paper. Mild steel installation methods rely heavily on skilled workers to weld and seal off any exposed mild steel on both the inner and outer layer. The dominating factor for corrosion in steel water pipelines is coating wear and tear. These failures often occur due to negligence and improper application of coating [
68]. In contrast, ductile iron pipes have an advantage of clean tapping process using specialized tools, which reduces the welding and installation skills dependencies [
46,
47]. These are important features for reticulation pipes, as they often have many tap-out points during new phases of development and for future expansion works. Hence, there are less tendencies for corrosion to propagate from joint failures in ductile iron pipes compared to mild steel pipes [
69]. The life expectancy and performance could reach more than 100 years if they are designed and installed properly [
70]. One study even showed that the flow test presented a “smooth” surface after 97 years of service [
71].
For HDPE pipes, despite the advantage of eliminating the possibility of corroding, these pipes are easily damaged due to any unstable soil condition or weak soil support. Plastic pipes are also permeable when exposed to hydrocarbons and contaminated soil [
72]. This could suggest that failure rates of polyethylene pipes are highly dependent on the environment. Therefore, the usage of polyethylene pipe in inappropriate or vulnerable environments could contribute a significant amount to NRW loss, after mild steel.
One possible confounding factor is large diameter pipe applications, where mild steel is a common choice. Nevertheless, this application may not represent the only major contribution to NRW loss. The pipes’ large size and high pressure also make leaks or breakage highly visible and thus quickly reported and repaired. The majority of NRW loss could have resulted from low volume leaks at numerous pipes of limited visibility.


