Article

How Mobile Grocery Sales Wagons Can Help Disadvantaged Shoppers in Residential Areas around Central Tokyo: Characteristics of Spatial Distribution of Usage Places and Purchased Items

1
Institute of Science and Engineering, Kanazawa University, Kakuma-Machi, Kanazawa, Ishikawa 920-1192, Japan
2
Department of Urban Engineering, Graduate School of Engineering, The University of Tokyo, 7-3-1 Hongo, Bunkyo, Tokyo 113-8656, Japan
*
Author to whom correspondence should be addressed.
Sustainability 2021, 13(5), 2634; https://doi.org/10.3390/su13052634
Submission received: 15 January 2021 / Revised: 15 February 2021 / Accepted: 26 February 2021 / Published: 1 March 2021
(This article belongs to the Section Sustainable Urban and Rural Development)

Abstract

:
In Japan, the number of shoppers who have difficulty accessing stores is increasing. Their health is often at risk because they cannot use stores at an appropriate frequency or buy a sufficient amount and variety of groceries. Grocery access that maintains disadvantaged shoppers’ health is essential; thus, we investigated the effectiveness of mobile grocery sales (MGS) wagons as a possible solution. Using a detailed database, two analyses were conducted. The first analysis focused on the distribution of barriers en route to stores from the locations where people use the wagons. The second analysis focused on the amount and types of groceries customers purchased. Findings revealed that it was not only distance but also barriers on the roads, such as slopes, wide roads, and poorly installed sidewalks, that created the wagon demand. However, when limited to the occurrence of heavily used places, the impact of distance was greater as compared to the other barriers. Customers at such heavily used places bought most of their necessities, including discretionary items, from the wagons. By contrast, customers at less frequently used places regarded wagons as a complement to ordinary stores. Wagons contributed to customers’ wellbeing with diverse roles.

1. Introduction

1.1. Disadvantaged Shoppers

Access to nutritious groceries that maintain people’s health is essential to sustain life. However, recently in Japan, the number of disadvantaged shoppers has increased because of the aging population and store closures. Based on the 2015 national census, the Japanese population aging ratio reached 26.7%, and the number of disadvantaged grocery shoppers was estimated at 8.25 million [1]. The term “disadvantaged shoppers” refers to people who have difficulty accessing stores and obtaining daily necessities. When people cannot buy sufficient amounts and varieties of groceries, they are at risk for unbalanced nutritional intake and malnutrition [2].
This issue has also attracted attention abroad, mainly in Europe [3,4] and the U.S. [5]. In those regions, socially vulnerable people (e.g., people who are less educated, have low income, or are ethnic minorities) tend to become disadvantaged shoppers. These people often have difficulty accessing stores located far away and buying sufficient nutritious groceries [6,7,8,9,10,11,12,13].
Contrastingly in Japan, disadvantaged grocery shoppers are mainly older adults. Recently, the number of disadvantaged shoppers has also increased in not only the rural provincial cities and villages but also the residential areas in metropolitan cities, though these cities are densely populated and have more stores in their residential areas. However, the number of places near residential areas where older adults can purchase groceries is decreasing [14,15]. Additionally, in the Tokyo metropolitan areas, the number of older adults is increasing at a faster rate [16]. However, many older adults live alone and have weak social ties [17]. Therefore, they must buy groceries independently.
In urban areas, most people go shopping for groceries on foot. Therefore, the range of stores they can visit rapidly decreases with old age. If they have few stores within walking distance, they become disadvantaged shoppers. Furthermore, especially for older adults who have to walk to the store, other road-related barriers cause difficulty [18,19]. This hinders the ability of people to visit stores at an appropriate frequency [20,21] and buy sufficient a sufficient amount and/or a variety of groceries; thus, their nutrition and their health are hindered (e.g., by increased risk of an unbalanced nutritional intake or malnutrition) [21].

1.2. MGS Wagons in Japan

In light of these problems, various countermeasures are now being implemented (e.g., opening a new store [22,23] or delivery services [20,24]), and their effectiveness has been examined. In this study, we focus on mobile grocery sales (MGS) wagon deployment. Many companies or nonprofit organizations operate out of MGS wagons, and local governments support their operation [25].
Usually, an MGS wagon contains a variety of groceries, and it travels around a residential area, stopping at several places, so customers can buy the groceries near their residence. This service is more beneficial for aging Japanese people than other options such as Internet-based grocery delivery services. Older adults prefer buying groceries after seeing the actual items [26]. Moreover, going out to actual stores and communicating with other customers or salespersons contributes to healthy aging [27,28,29,30]. MGS wagons can provide similar merits to customers such as face-to-face communication with operators, or the chance to select groceries from the abundant lineup and to check their quality.
Usually, most MGS wagons linger at each stopping place for several dozen minutes. They mainly stop in public places such as parks or community centers in residential areas, and unspecified customers can use the wagons. In this paper, we label this style the “common stops style”. However, the number of MGS wagons that adopt another style has increased recently. Wagons stop very close to customers’ homes for less than 10 min. Although anyone located around the stopping points can use the wagons, the main customers at each stopping place are usually known in advance. In this paper, we call this the “individual visiting style”. Although the differences between these two styles of MGS wagons are often disregarded, we distinguish them by considering the differences in their business models. Moreover, food trucks (FTs) and mobile food vendors (MFVs) also provide food services. Although their contribution has been examined abroad [31,32,33], their role is slightly different. FTs and MFVs mainly provide cooked foods near large office areas, or at large commercial facilities. By contrast, MGS wagons sell various fresh groceries in residential areas. Since this study focused on the disadvantaged shoppers’ problems, we focused on the MGS wagons, considering their characteristics.
In Japan, there are several studies on MGS wagons that assess the characteristics of people who use the wagons. Their results show that the wagons could help single older adults [34,35,36]. However, individual attributes are no more than one aspect that influences whether an individual customer regards distance or other urban elements as barriers. It is also important to assess distance to the store and which urban elements act as barriers, thereby increasing wagon demand. Furthermore, to assess the usefulness more precisely, the contribution of MGS wagons to customers’ food availability should be assessed.
Several studies examine the relationship between the distance from the wagons and frequency of use [37,38], or between MGS wagons’ use and the customers’ nutrition intake [37,39]. However, the studies cited above examined the common stops style and focused only on distance. No study has assessed the usage conditions of the individual visiting style as a strategy to improve regional food availability.

1.3. Study Aim

Based on these backgrounds, we proposed two research questions (RQs). The first was, “Can the MGS wagons help the people who have difficulty in accessing stores?” The other was, “Are the amount and variety of groceries bought from the MGS wagons sufficient to help disadvantaged shoppers?”
This study aims to answer these RQs and to assess the effectiveness of the individual visiting style of MGS wagons by using a detailed database of usage condition. To answer the first RQ, we analyzed the characteristics of the barriers located en route to the closest stores from the MGS wagons’ places of use. To answer the other RQ, we analyzed the relationship between the accessibility of the nearest stores and the amount and types of items purchased from the wagons.
One reason that few studies have focused on the actual usage of the individual visiting style is the difficulty in acquiring data. Analyses with a detailed database revealed new findings to grasp the potential demands of wagons, or to help introduce new wagons.
Moreover, our study provides a useful example of approaches to healthy aging in an urban society. Tokyo, compared to metropolitan cities in other developed nations, has a similar urban structure, and healthy aging is commonly recognized as important in developed countries with aging populations. Furthermore, several developed countries are expected to reach the same proportion of overall older adult population as Japan’s current rate [40]. Therefore, sharing Japanese experience will promote older adults’ healthy aging in other developed countries.

2. Materials and Methods

2.1. Study Areas

The study areas were the Takashimadaira and Nakaitabashi areas in the Itabashi ward and the Otsuka area in the Toshima ward—all located on the outskirts of central Tokyo, Japan. Figure 1 shows the business areas of MGS wagons, according to census tract units in each area. Generally, in the outskirts of Tokyo, the population aging rate is higher, and the distribution of grocery stores is more scattered. Therefore, there are more disadvantaged shoppers.
Based on the 2015 population census, the proportion of the population aged >65 years in these areas in 2015 exceeded the average of the ward to which they belong (Itabashi ward, 22.8%; Toshima ward, 19.7%; Takashimadaira area, 31.4%; Nakaitabashi area, 23.7%; and Otsuka area, 21.0%). Moreover, all three areas have comparatively high population-density districts (i.e., over 100 people/ha). In particular, the Takashimadaira area has a characteristic regional structure (Figure 2).
There are two “danchi”, which are housing complexes that absorbed the flow of people toward suburban metropolitan areas during the late 1960s and the 1970s (i.e., a high-economic growth period). Housing complexes named Takashimadaira-danchi are located in much of the southern part of the area. Housing complexes on an artificial ground—Nishidai-danchi—are located in the north east, and citizens in this danchi are obliged to use stairs or slopes to descend to the ground level. Detached housing districts (i.e., residential districts that comprise detached homes) are located in the southwest part of the area.
All of them were developed during the 1960s and the 1970s, in a planned manner, and supplied for younger generation families from provincial cities. However, the generational change of residents was not well advanced, owing to people’s return to urban centers. This resulted in an older population and store closures. This characteristic regional structure is similar to other Japanese “new towns” (i.e., large residential districts located at suburban metropolitan areas—most of them were developed during high-economic growth periods).
In these three areas, MGS wagons named “Tokushimaru” are operated by the same grocery store chain. Tokushimaru is one of the most famous operators of individual visiting style MGS wagons in Japan. Tokushimaru has a characteristic business style. First, a grocery store chain contracts the headquarters of the company (Tokushimaru Inc., Tokushima, Japan). Thereafter, the store becomes a franchise store that operate the Tokushimaru. The store can obtain permission to use the brand name of Tokushimaru on the MGS wagon and can benefit from management expertise pertaining to the operation of the wagon.
Daily, drivers of these MGS wagons load groceries and other dairy goods from their base store and travel to their own service area on the wagons. Customers are charged 10 yen (Approximately 10¢) for each item in addition to its regular price. Since the wagons sometimes go back to their base store to replenish the items during the day, they also load the items ordered from regular customers in advance. On average, approximately 400 categories of groceries are loaded [41]. Operators select items by considering older adults’ daily demands. Therefore, customers are typically satisfied with the items, and there are rarely shortages. Moreover, there are few worries about unsold stock because they can be sold at their base store when the wagon returns.
Each wagon usually travels its designated courses. The wagons stop very near the houses of individual customers for several minutes, where customers buy items. In the case of housing complexes, the wagons stop at a common space for several dozen minutes. Therefore, customers can buy the groceries near their residence without worrying about carrying heavy loads.
According to the wagon driver in the Takashimadaira area, the number of current users in each area was at most a few dozen people, and customers were mainly older adults who indicated their intention to use the wagons in advance. Each area has one wagon, and the business days differs between the areas. They travel several routes in the same week (i.e., Takashimadaira area: twice a week, one course; Nakaitabashi area and Otsuka area: five times a week, three courses).

2.2. Database of Usage Conditions for the MGS Wagons

We made a database that clarified the actual wagon use, even under the restrictions to access each shopper’s personal information. At this time, we are not allowed to obtain each customer’s information, and it is difficult to access the customers. Therefore, this database provides useful clues about actual wagon use.
The data collection period was from July to August in 2017, except for their non-operating days. We focused on this period because in the Tokyo metropolitan area, summer heat is considered one of the biggest obstacles to shopping on foot, and we thought it would be best to examine wagon use when the demand was highest. For the Takashimadaira area, we collected data on every operating day (twice a week). As for the Nakaitabashi and Otsuka areas, each wagon had three courses, and we collected data once a week for each route.
By attaching a handy global positioning system (GPS) (eTrex10J, Garmin Ltd, Lenexa, KS, USA.) to each wagon operating in the three areas, their locations, at every minute, were recorded. Based on this movement history, each wagon’s stopping points were estimated. First, considering GPS measurement error, when more than three recorded points were continuously near each other (i.e., the distance between one location and the next location was less than 10 m), we regarded the center of these locations as the stopping point. However, these stopping points include points other than point-of-sale locations, such as when a wagon was stopped at a traffic light. Therefore, the data were combined with the purchase history to extract the stopping points where customers actually used the wagon. The receipt data were provided by the store operating the wagons in a form that makes it impossible to identify each customer and their attributes. The purchase history contained information about each payment (e.g., item name, price, number of items sold, and the time). Since both the movement history and the purchase history recorded the time as data, the usage points can be plotted at the locations where the mobile grocery wagon stopped and when customers bought more than one item (Figure 3).
Also, wagons regularly visited the same main customers each operating day, and occasionally several customers used the wagon several times a day. The stop location of each visit for the same customer is not perfectly consistent due to GPS measurement errors. Therefore, we had to estimate which points could be regarded as the same customer. For this purpose, as shown in Figure 4, circles with a radius of 10 m were generated from each usage point and connected to each other. Points within that area were regarded as belonging to the same “usage place”. Based on these usage places, we conducted analyses.

2.3. Analyses

For a series of spatial analyses, ArcMap 10.5 (Environmental Systems Research Institute, Inc., Redlands, CA, USA) was used. Two analyses were conducted. The first analysis focused on the distribution of barriers en route to the store from each usage place. This analysis was based on the hypothesis that individuals’ wagon demand would be heightened by barriers along the store route according to the nearest usage place. We posited that these people would be likely to choose the wagons.
Four types of barriers were considered (see Table 1): (1) distance to the nearest store, (2) a steep slope, (3) a wide road, and (4) poorly installed sidewalks. These barriers were selected based on a previous survey of older adults in Japan [18]. According to the wagon driver, these barriers created difficulties for many customers.
We surveyed the distribution of each barrier on the shortest route from each usage place to the nearest store in each area. The results were aggregated for each area and visualized with the overlapping conditions (i.e., whether one route had multiple barriers or not). Based on these results, we discuss the characteristics of those locations.
The road distance was measured, using the Network Analysis tool in ArcMap, as the length of the shortest route between each usage place and the nearest grocery store. The location of the grocery stores was collected from i-TownPage (an Internet telephone directory published by NTT TownPage Corp.,(Tokyo, Japan) https://itp.ne.jp/, accessed on 30 September 2020) and geocoded by their address. For road network data, the Advanced Digital Road Map Database (Sumitomo Electric System Solutions Co., Ltd, Tokyo, Japan.) was used. The threshold value of 500 m was set as half of the distance for an older adult to walk on a round trip without difficulty [42].
The angle of a slope was calculated as the percentage of the difference in elevation between the two ends of a road link to the length of the link. The elevation was acquired from a 5 m resolution digital elevation model (The Geospatial Information Authority of Japan). Although the housing complexes are on an artificial ground in Nishidai-danchi, the residents must use slopes whose inclination is over 5% to get down to the ground level. However, there is no recorded difference of elevation because of limited data. Therefore, additionally, routes from the Nishidai-danchi were also regarded as having a steep slope.
The road network data contains detailed spatial and attributive information for each road, such as road width. Over 13 m is the widest data category. As data for some very wide roads were created on a per-lane basis, the sum of the width of each lane was measured on the World Street Map (provided by Environmental Systems Research Institute, Inc.) and the total width was confirmed.
To calculate the installation ratio of the sidewalk, first, the distribution of sidewalks on each road was surveyed. A sidewalk was defined as the pedestrian walking space on the road, separated from the roadway by a curb. If the installation condition differed between the two sides of the road, the value of the longer sidewalk-equipped side was used. Then the ratio of the total length of the sidewalk on each route was calculated. The “poor installation condition” meant the installation ratio of one route was below the average of all routes in each area.
The second analysis focused on groceries bought at each usage place (amount and types of items) in the Takashimadaira area. The relationship between accessibility based on the first analysis and the amount and types of items purchased was examined. There are three reasons that we selected only one area as a case study. First, the number of days with tracking data differed between the Takashimadaira area and the other two areas. If all areas were adopted for analysis, when we set the relative threshold (e.g., more than half of business days) of the frequency use, or of purchased items over the entire period, the threshold values would differ between areas. We wished to avoid the effect of such differences on the results of the analysis. Secondly, the Takashimadaira area has only one route and more data were collected from each usage place on the same route than from the other two areas during the same data collection period, thus yielding more valid results. Finally, the case study of Takashimadaira can inform suggestions for improving other regions’ shopping environments and making them more sustainable. The characteristic regional structure of the Takashimadaira area is similar to other new Japanese towns. In such new towns, population aging and grocery store closures are progressing, increasing the rate of disadvantaged shoppers (and prompting the application to these decrepit towns of the term “old-new town”). The findings from the detailed analysis of the Takashimadaira area can thus apply to similar old-new towns in Japan and abroad when considering the introduction of MGS wagons to these areas.
First, we counted the total number of items bought at each usage place. Then, the characteristics of the spatial distribution of the usage places were analyzed, especially when many items were bought. In the analysis, we focused on the differences in the role of wagons based on their use frequency and average amounts of purchased items per one use. Then, we focused on the composition ratio (shares of different types) of purchased groceries at each usage place. We first analyzed the types of groceries bought from the wagon. Then, the composition ratios were compared among different wagon roles.
For the second analysis, groceries were classified into the following five types: (1) vegetables/fruits, (2) meats, (3) fish/seafood, (4) prepared foods, and (5) others. Vegetables, fruits, meats, and fish/seafood were considered groceries that contain nutrients that people are required to consume more than once per day [43]. Although the purchased items were first classified into more detailed categories, based on the National Health and Nutrition Survey [44], they were reclassified by the authors for easier understanding. Prepared groceries that combined more than one of the three categories mentioned above as their main ingredient were categorized as “prepared foods”. This category of groceries is also helpful for older adults who have difficulty cooking [45,46]. The remaining groceries (e.g., snacks, seasonings, beverages) were classified as “others”.

3. Results and Discussion

The numbers of usage places extracted were as follows: 27 in the Takashimadaira area, 38 in the Nakaitabashi area, and 43 in the Otsuka area. Figure 5 shows the distribution of usage places and grocery stores within the three study areas.

3.1. Analysis 1: Barriers en Route to the Nearest Store

Figure 6 shows the barriers that were found en route to the nearest store from each usage place in each area.
Figure 6 suggests several findings. First, in the Takashimadaira area, 81.5% of usage places were located more than 500 m away from the nearest store, and customers on these routes also needed to cross wide roads to reach the store. In Takashimadaira, the distribution of both usage places and grocery stores was more uneven than in the other two areas (see Figure 5). In this area, many usage places were in detached housing districts that had no store. Residents had to cross the wide roads to go to their nearest supermarket, near the Takashimadaira station. Furthermore, in the Takashimadaira area, the ratio of usage places that have all barrier types along their route was 18.5%, which was the highest among of the three areas. All these usage places were found around the southern part of the detached housing districts (i.e., points within the red frame in Figure 5). For these customers, their nearest store was not the one close to the Takashimadaira station but the one located in the south. Walkers faced upslopes to this store.
Moreover, in the Takashimadaira area, even though there were more sidewalks installed than in the other two areas (ratio of the routes that had poor sidewalk installation as a barrier: Takashimadaira area, 55.6%; Nakaitabashi area, 57.8%; and Otsuka area, 62.3%), most roads without sidewalks were located in the detached housing districts with many narrower roads. Therefore, the residents in these districts faced multiple barriers.
Compared to the Takashimadaira area, in the Nakaitabashi and Otsuka areas, the proportions of usage places that were far from the grocery store were lower (Nakaitabashi area, 50.0%; Otsuka area, 30.2%). In contrast, most of the other routes in these two areas had other and multiple barriers. This suggested that in these two areas, many customers used the wagon, even though their nearest stores were close. It also suggested that barriers other than distance created wagon demand. In support of this suggestion, the proportion of the routes that had no barriers was very low in all three areas (Takashimadaira area, 0.0%; Nakaitabashi area, 7.9%; Otsuka area, 9.3%). Most of these usage places had more than one type of route barrier. Moreover, several routes had only one barrier: wide roads (Takashimadaira area, 7.4%; Nakaitabashi area, 10.5%; Otsuka area, 7.0%) and few installed sidewalks (Takashimadaira area, 11.1%; Nakaitabashi area, 8.9%; Otsuka area, 14.0%). These results indicated that each barrier posed its own difficulty to shoppers.
In sum, not only distance but other barriers also promoted older adults’ wagon use. Distance to stores is a widely used index to evaluate the people’s accessibility difficulties, and some studies have suggested that it causes the increased demand for MGS wagons [37,38]. However, the influence of other factors had not been considered sufficiently. Our results indicated that, even if people live close to stores, the other barriers referred to above often make it difficult for them to access the stores, thus heightening wagon demand.
In Japan, slopes are seen in many residential areas. Additionally, especially in metropolitan cities, wide arterial roads run near or in the residential areas. Therefore, people who walk to stores must cross these wide roads more often than those in depopulated rural areas. Concurrently, there are some narrow streets in residential areas, on which sidewalks are insufficiently installed in high dense residential areas. These environments contain more barriers beyond distance. In contrast, in metropolitan cities, because of the greater business potential, there are usually many stores. With a greater choice, individuals can often select stores that enable them to avoid barriers. Therefore, in metropolitan or large provincial cities, the ratio of disadvantaged shoppers tends to be smaller than in depopulated rural areas. Their distribution is probably more discrete than in rural areas. However, in the outskirts of metropolitan cities, store distribution is more scattered, compared with central areas. In such areas, more disadvantaged shoppers will emerge. These shoppers, even if there are several stores in their area, will still have difficulty accessing even their nearest stores.
Which business style of MGS wagons is more suitable to help disadvantaged shoppers in the outskirts of metropolitan cities? Wagons using the common stops style often have difficulty attracting enough customers to sustain their business [47]. The style is not cost effective, as the wagons usually must wait for customers who may or may not visit at each stop. Therefore, individual visiting style wagons seem to be more suitable. Individual visiting style wagons actively visit each customer, and they can effectively provide shopping opportunities. This style also makes them more suitable for business operators to efficiently provide services to geographically scattered customers. Our results supported the usefulness of individual visiting style wagons in metropolitan outskirts areas. Moreover, this wagon type is needed by people who have difficulty accessing even their nearest store owing to road-related barriers. These findings will also help the wagon operators create more demand, by understanding those who currently need and use MGS wagons. If potential customers can be catered to, while new customers are attracted, individual visiting style wagons will become a more useful—and more sustainable—thereby helping disadvantaged shoppers.

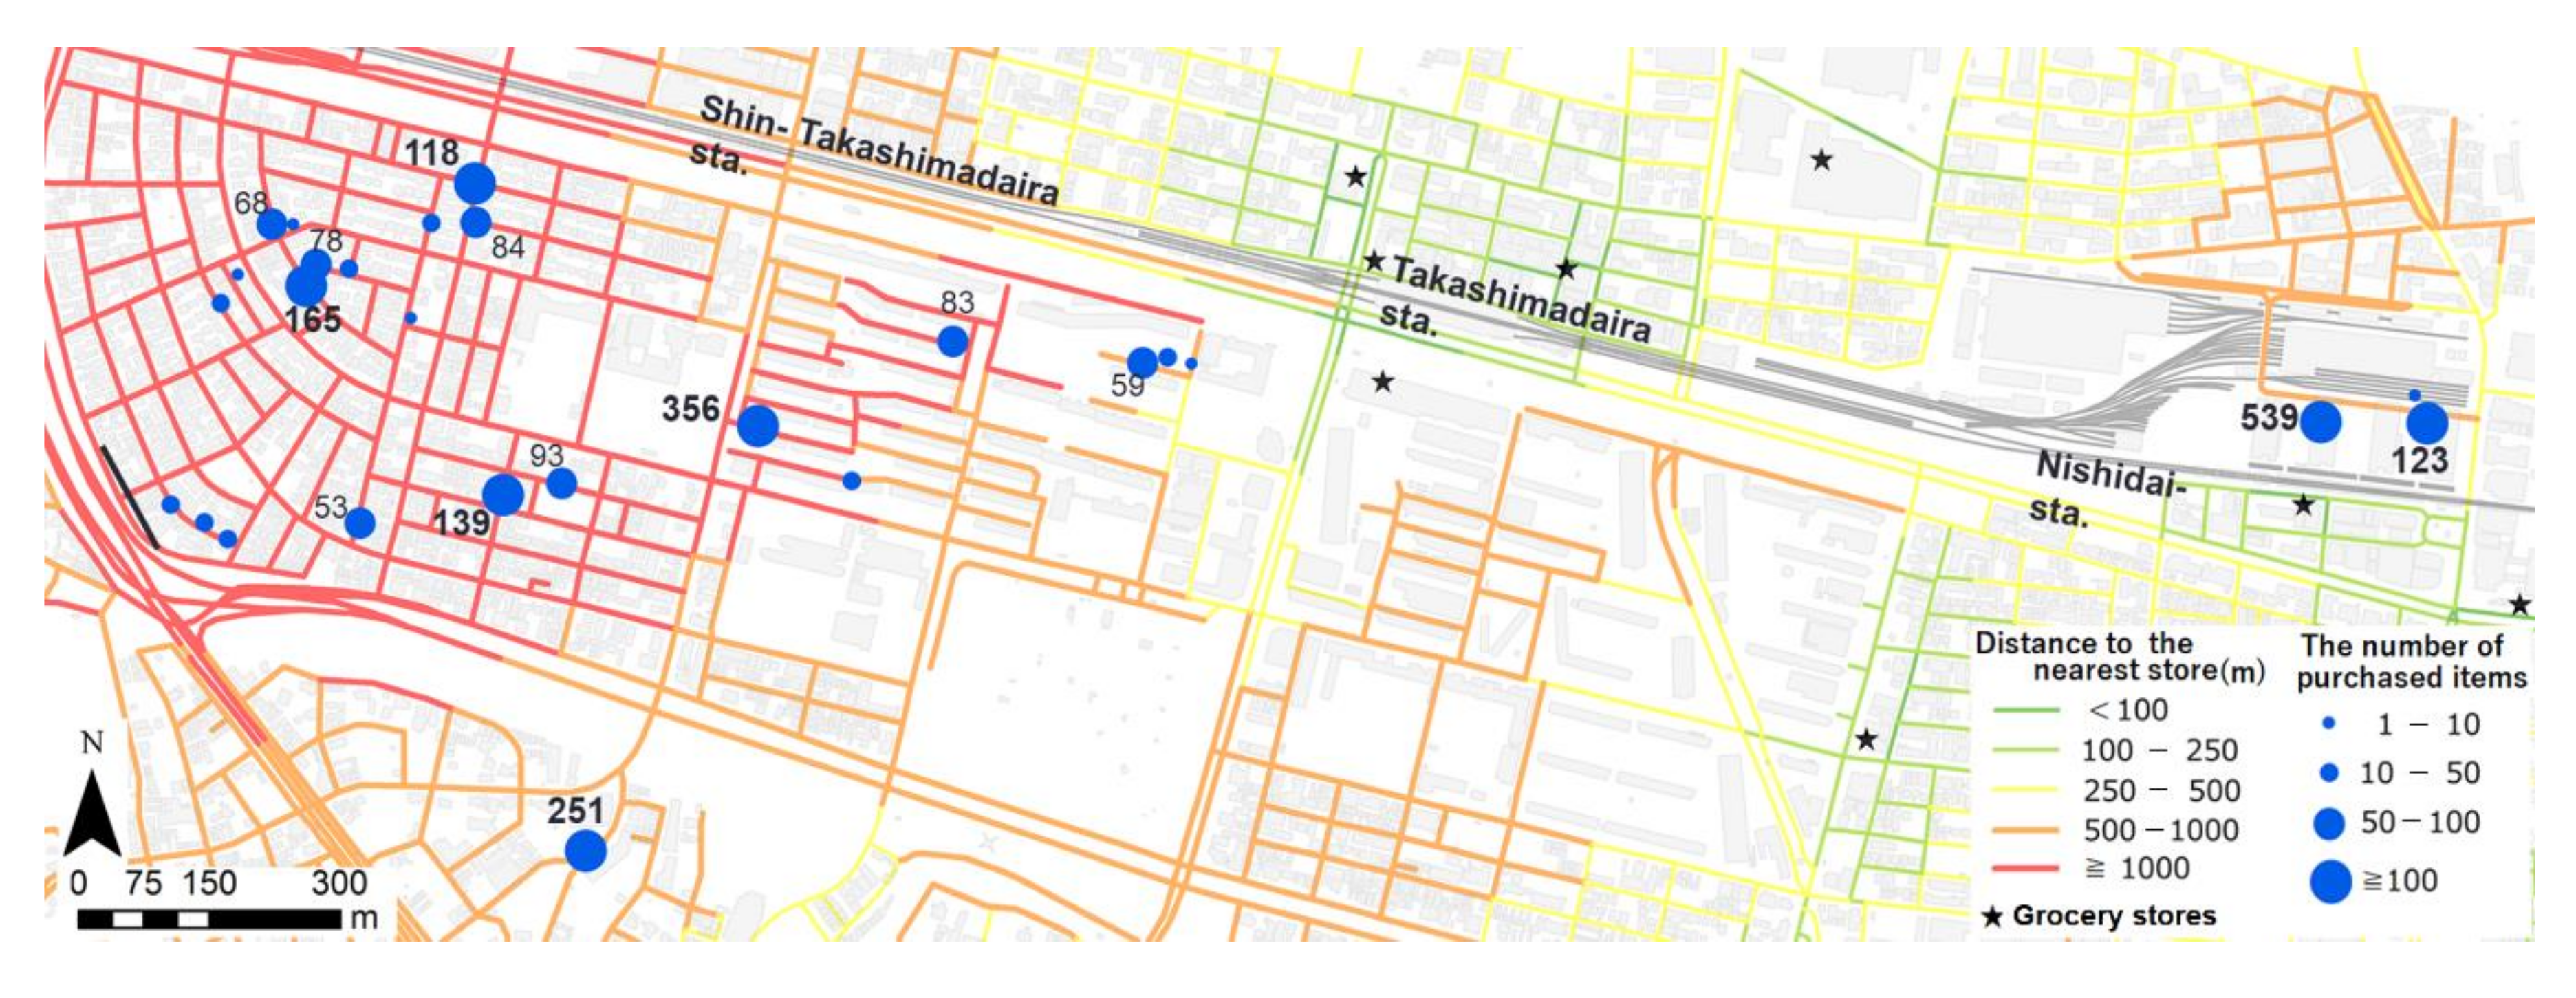
3.2. Analysis 2: Purchased Items at Usage Places in the Takashimadaira Area

3.2.1. Number of Items Purchased at Each Usage Place

First, by using the method referred to in Section 2.2 we estimated the locations in which 96.7% of the items in the Takashimadaira area were purchased; a total of 2179 items were bought in 27 usage places. Figure 7 shows the number of purchased items counted at each usage place during the survey period. The number near each usage place is the amount of purchased items (only shown for usage places where more than 50 items were bought).
Usage places were distributed around two housing complexes and detached housing districts. Although at both housing complex areas, the number of usage places was smaller than in detached residential districts (six places in Takashimadaira-danchi, three places in Nishidai-danchi, and 17 places in detached housing districts), the number of items bought at each place was comparatively large. This is because, according to the wagon driver, several people used the same usage places in both housing complexes. In housing complex areas, several customers are in the same building. The wagon stopped in the common spaces for customers of each building, and such customers bought items at their nearest usage place. In contrast, in the detached housing districts, usage places were widely scattered. At several places, many items were purchased; but few items were bought at other places nearby. This suggested that the total number of purchased items had little to do with the location.
However, when counting the total number of purchased items there were some points to consider: (1) multiple people used the same wagon station and (2) the frequency of wagon use at each location was not considered. To gauge the wagons’ usage conditions more accurately, it is necessary to focus on both the amounts of purchased items per one wagon use and the frequency of wagon usage at each place. If customers frequently use the wagon, and buy many items each time, the wagon plays an important role in enhancing food availability. We focused on the distribution and the characteristics of usage places where the customers purchased more than 50 items over the study period and used them on more than five separate days. (In total there were nine operating days’ data for analysis in Takashimadaira from July to August. Five days represent more than half of those operating days. The threshold value of bought items was set based on the average amount that people usually bought at ordinary grocery stores at each time [48].) Such “heavy-usage places” were found at two places in Nishidai-danchi, one in Takashimadaira-danchi, and eight in detached residential districts. (Although another heavy-usage place was found at a nursing home in the south of the area, we excluded this from the following analysis since nursing home residents are often restricted in their usage frequency and the amount they can purchase (according to a wagon driver).)
As for the relationship between barriers and these heavy-usage places, there were several differences between the places in Nishidai-danchi and others. At Nishidai-danchi, customers must use slopes to descend to the ground level, but their nearest store is located within 500 m of Nishidai-danchi. In contrast, even though the heavy-usage places in Takashimadaira-danchi and the western detached housing districts had other barriers concurrently (i.e., all of them had to cross the wide road, and most also faced at least a steep slope or poor provision of sidewalks), they also had to travel a long way (i.e., more than 1 km) to the nearest store.
To examine differences in shopping behavior between heavy usage places, we calculated the average numbers of items bought per one wagon use to create the following groups: (1) heavy-usage places in Takashimadaira-danchi and detached housing districts, (2) heavy-usage places in Nishidai-danchi, and (3) other places where fewer than 50 items were bought. The distributions of the values of these groups are shown in Figure 8.
The median value of the three groups was significantly different (p < 0.05 by Kruskal–Wallis test). The figure shows that customers in heavy-usage places in group 1 (Takashimadaira-danchi and detached housing districts) bought more items per wagon use. Their median value was also the highest and 8.7 items were purchased on average, per use. This exceeded the number of items bought in ordinary small supermarkets in Japan (i.e., 8.3 items bought at stores whose sales area is below 800 m2 [48]). In contrast, the median value of purchased items per one use in the other two groups was lower than in group 1 (group 2, 5.4 items; group 3, 5.6 items).
This result indicated that the wagons play a characteristic role for the users in heavy-usage places in group 1. The customers of heavy-usage places in group 1 bought enough items from the wagons frequently; so much, in fact, that the wagons could serve as an alternative to supermarkets. Therefore, there are instances of several specific heavy-usage places where a long distance is greater than multiple barriers combined. Previous studies [20,21] support this hypothesis—that a long distance to the stores reduced the shopping frequency of older adults. These people would use the wagons frequently, and buy many items, to compensate for their limited shopping opportunities. Additionally, in the other two target areas (Nakaitabashi and Otsuka), there were no places where the wagons were used on more than half of the business days when distance was not a factor, even if there were several other barriers. Our findings therefore confirmed that distance was a critical factor in these specific heavy-usage points. However, all places that met the distance condition did not become these “distant, heavy-usage places.” In fact, individual attributes of users at each location were also important. Considering their individual attributes together, such as aging and limited accessibility, these distant and heavy-usage places are likely to occur.

3.2.2. Composition of Grocery Types Purchased at Each Usage Place

Figure 9 shows the grocery types bought at each usage place during the study period, showing only the places where more than 10 items were bought. Circles with red borders indicate places where more than 50 items were bought.
The figure shows that groceries that are important to consume every day (i.e., sum of vegetables/fruits, meats, and fish/seafood), and that processed foods were purchased predominantly at most usage places. Notably, the ratio of basic groceries (vegetables/fruits, meats, and fish/seafood) was the same as that of ordinary people buying at general grocery stores in Japan (i.e., approximately 40–50% for all items) [49]. It also shows that a similar ratio of those groceries was bought from the wagon at most usage places. At 21 of the 27 locations, the sum of the shares of these four categories accounted for more than 50% of purchases. Vegetables/fruits were the most purchased category at 19 of all 27 locations except for the category of “others”. This may be explained by the heavier weight of fruits and vegetables. In a previous survey [50], heavy groceries were ranked as the items that many people wanted to buy from MGS wagons rather than stores. Another study also suggested that carrying heavy groceries from stores was more likely to cause difficulty for older adults and decrease their shopping frequency [21]. These findings suggested that the wagon contributed to improved food availability in many locations, by providing opportunities to buy these essential groceries and reducing shoppers’ burden.
However, when focusing on the relationship between the location and the types of groceries bought at each usage place, there were few notable characteristics. The relationship depended more on how individual customers regarded the wagon as a shopping venue, and used it. Therefore, in the following analysis, we focused on the differences in the wagon’s role. Table 2 shows the difference in the composition ratio of total purchased items between distant, heavy-usage places (group 1 in Figure 8) and locations where fewer than 50 items were bought (group 3 in Figure 8).
First, based on a recent survey [51], the composition ratio of purchased items in each category in ordinary supermarkets (sales area <800 m2) was calculated: meats, 14.0%; fish/seafoods, 12.5%; vegetables/fruits, 18.2%; prepared side dishes, 11.2%; and others, 44.1%. Considering Japanese older adults tend to prefer to buy fish and seafoods rather than meats [52], the general trend of the composition ratio of purchased items from the wagon was similar. However, the ratio of vegetables/fruits purchased from wagon was larger. This adjusts the result and discussion because those items were bought to reduce the burden of carrying them, and the wagon would contribute to the intake of groceries that are important for maintaining health.
For the results of chi-squared statistical analysis, the difference for the whole composition ratio between the two groups was not significant (p = 0.115). However, for the residual analysis, a significant difference in several categories was found. For the group of distant, heavy-usage places, the ratio of “vegetables/fruits” and “fish/seafood” was lower than that of “others”. This meant that a variety of items were bought by those in the heavy-usage group. The characteristics of groceries purchased from the wagon seemed similar to the shopping style of customers in ordinary stores, who bought essential groceries and other discretionary items, such as seasonings, confectioneries, and beverages.
These results suggested that the composition of purchased items at each usage place also depended more on how the wagon was regarded by each customer. Customers where fewer items were bought seemed to use the wagon as a complement to ordinary grocery stores. They used it to buy only what they needed each time. However, many shoppers purchased mainly vegetables and fruits, perhaps to make it easier for them by buying heavier groceries closer to their home rather than from the store. In contrast, it was assumed that customers of the distant, heavy-usage places purchased most of their necessities from the wagons, instead of going supermarkets, owing to the difficulty caused by long distances. Our results indicated that wagons make it easier for shoppers to buy not only essential groceries conducive to health maintenance, but also the discretionary items that enrich their daily cooking and eating.

4. Conclusions

4.1. Study Summary

In this study, we attempted to answer two RQs: “Can the MGS wagons help people who have difficulty in accessing stores?” and, “Are the amount and variety of groceries bought from the MGS wagons sufficient to help disadvantaged shoppers?” we analyzed the actual use of individual visiting style wagons in three residential areas in outskirt areas of central Tokyo. Through a series of analyses, this study provides new findings, based on objective evidence, despite restrictions to accessing each shopper’s personal information.
For the first RQ, focusing on the spatial distribution of usage places, the characteristics of the barriers along the route to the nearest ordinary stores were analyzed. Importantly, the results showed that not only distance, but also other barriers on the roads (i.e., steep slopes, wide roads, and limited sidewalks) often lead to MGS wagon demand. Shoppers who regard each element as a barrier had difficulty accessing even their nearest stores, and they become disadvantaged shoppers. For these people, the MGS wagons allowed for access to nutritious food. Diverse barriers are not always obvious to other researchers or policymakers. In addition, considering the characteristics of the urban structure of metropolitan outskirts, individual visiting style wagons were more useful than common stops style wagons. Our findings will help wagon operators address additional demands by understanding the characteristics of those who currently use MGS wagons.
For the second RQ, focusing on the case of the Takashimadaira area, the number and types of items purchased at each location were analyzed. The results showed that the MGS wagons helped customers by providing opportunities to purchase the groceries that were necessary for their daily lives. Groceries that are important to consume every day (i.e., the sum of vegetables/fruits, meats, and fish/seafood) and processed foods were purchased predominantly at most usage places. Moreover, more vegetables and fruits were purchased than other important groceries at most usage places, and they are bought more from the wagon than ordinary grocery stores. The wagons lessen the need to carry heavy groceries from stores—a difficulty for disadvantaged shoppers that can reduce their shopping frequency. These features of the wagons would improve disadvantaged shoppers’ food availability by providing them with opportunities to buy groceries in sufficient amounts and variety, to maintain good health. Additionally, there was a difference in the role of the MGS wagons for customers in the “distant heavy-usage places” and those in “other places where fewer items were bought.” Customers at distant heavy-usage points were more likely to rely on the MGS wagon to buy most of their groceries. These customers seemed to use a wagon as an alternative shopping venue to ordinary grocery stores. In addition, the wagon also made discretionary items available that enriched their daily cooking and eating. For these shoppers, long distances seemed to be the important reason for using wagons frequently and purchasing large amounts of and various items. In contrast, users at “other places where fewer items were bought” seemed to use the MGS wagon as complementary to their use of ordinary grocery stores, buying only what they need.
In conclusion, the MGS wagons can help disadvantaged shoppers acquire nutritious groceries by removing a variety of barriers. However, in the target areas, it is important to determine the potential demand for the wagons to help the more disadvantaged shoppers in certain regions and make the wagon operators’ business more sustainable. The results of this study serve as a useful guide to investigate potential demand. Moreover, we expect that our study will improve not only existing wagons’ operation but also help introduce this style of MGS wagon in other developed countries where the population is rapidly aging. Our study’s contribution is sharing an advanced example of a Japanese countermeasure to support older adults’ healthy aging.

4.2. Limitations and Future Research Directions

The study had some limitations that could be overcome by further research. To understand the usefulness of the MGS wagons more fully, analyses should consider customers’ attributes (e.g., their accessible range, health condition, and family composition) and shopping behavior (e.g., use of other grocery stores, mode of transportation to the store, and the average amount of groceries purchased per trip). In addition, customers should be surveyed concerning why they use MGS wagons. Moreover, the differences in price and the customers’ reactions should also be assessed. The price of items in the MGS wagons was a bit higher than that of items sold in ordinary stores. Comparing these differences and examining the influence on wagon demand may provide helpful information.
Additionally, the contribution of MGS wagons to customers’ food availability could be assessed more accurately if data about their use conditions of ordinary stores and their dietary intake were also available. Combining the current data with customer interviews or questionnaires would provide more robust explanations concerning MGS wagons’ effectiveness.
Furthermore, expansion of this analysis should be conducted from both spatial and temporal viewpoints. If such an analysis considered more individual visiting style MGS wagons, it would enable us to distinguish findings common to all regions from those that vary between the regions. More data would also enable another statistical and multivariate analyses, and would improve the generalizability of our results as well as their validity regarding the existence of different wagon roles and customer characteristics at “distant heavy-usage places”. If longer-term usage data were available for analysis, it would enable us to check the other highly time-varying factors. Furthermore, we gathered information only in one season; however, people purchase different items in different seasons. Understanding the influence of the weather and temperatures will further elucidate wagons’ usefulness. In short, future studies should focus on understanding the larger context of both people’s shopping behavior and MGS wagon operation.

Author Contributions

Conceptualization, T.S. and K.H.; methodology, T.S. and K.H.; validation, T.S.; formal analysis, T.S.; investigation, T.S.; resources, T.S. and K.H.; data curation, T.S.; writing—original draft preparation, T.S.; writing—review and editing, T.S. and K.H.; visualization, T.S.; supervision, K.H.; project administration, T.S. and K.H.; funding acquisition, T.S. and K.H. All authors have read and agreed to the published version of the manuscript.

Funding

This research was funded and supported by JSPS KAKENHI, grant numbers JP17K14785, JP18H01602, and JP20K14901.

Institutional Review Board Statement

Not applicable.

Informed Consent Statement

Informed consent was obtained from all subjects involved in the study.

Data Availability Statement

The data are not publicly available due to restrictions apply to the availability of these data. They were used under an agreement for the current study, and so are not publicly available.

Acknowledgments

This research was the result of joint research with CSIS, the University of Tokyo (Nos. 422 and 600).

Conflicts of Interest

The authors declare no conflict of interest.

References

  1. PRIMAFF. Estimates of the population with food access difficulties. Available online: https://www.maff.go.jp/primaff/seika/fsc/faccess/table01.html (accessed on 29 August 2020).
  2. Iwama, N. What is the food deserts problem? In Food Deserts: The Product of Indifferent Societies, 1st ed.; Iwama, N., Ed.; Association of Agriculture and Forestry Statistics: Tokyo, Japan, 2011; pp. 1–20. (In Japanese) [Google Scholar]
  3. Thompson, S.M.; Kent, J.L. Human health and a built environment. In Encyclopedia of Sustainable Technologies, 1st ed.; Abraham, M.A., Ed.; Elsevier: Amsterdam, The Netherlands, 2017; pp. 71–80. [Google Scholar]
  4. Donkin, A.J.; Dowler, E.A.; Stevenson, S.J.; Turner, S.A. Mapping access to food at a local level. Br. Food J. 1999, 101, 554–564. [Google Scholar] [CrossRef]
  5. Zenk, S.N.; Schulz, A.J.; Hollis-Neely, T.; Campbell, R.T.; Holmes, N.; Watkins, G.; Nwankwo, R.; Odoms-Young, A. Fruit and vegetable intake in African Americans income and store characteristics. Am. J. Prev. Med. 2005, 29, 1–9. [Google Scholar] [CrossRef]
  6. Guy, C.M. Corporate strategies in food retailing and their local impacts: A case study of Cardiff. Environ. Plan. A Econ. Space 1996, 28, 1575–1602. [Google Scholar] [CrossRef]
  7. Bitler, M.; Haider, S.J. An economic view of food deserts in the united states. J. Policy Anal. Manag. 2010, 30, 153–176. [Google Scholar] [CrossRef]
  8. Block, D.; Kouba, J. A comparison of the availability and affordability of a market basket in two communities in the Chicago area. Public Heal. Nutr. 2006, 9, 837–845. [Google Scholar] [CrossRef]
  9. Laraia, B.A.; Siega-Riz, A.M.; Kaufman, J.S.; Jones, S.J. Proximity of supermarkets is positively associated with diet quality index for pregnancy. Prev. Med. 2004, 39, 869–875. [Google Scholar] [CrossRef]
  10. Zenk, S.N.; Schulz, A.J.; Israel, B.A.; James, S.A.; Bao, S.; Wilson, M.L. Neighborhood racial composition, neighborhood poverty, and the spatial accessibility of supermarkets in Metropolitan Detroit. Am. J. Public Health 2005, 95, 660–667. [Google Scholar] [CrossRef] [PubMed]
  11. Moore, L.V.; Roux, A.V.D.; Nettleton, J.A.; Jacobs, D.R.; Franco, M. Fast-food consumption, diet quality, and neighborhood exposure to fast food: The multi-ethnic study of atherosclerosis. Am. J. Epidemiol. 2009, 170, 29–36. [Google Scholar] [CrossRef] [PubMed] [Green Version]
  12. Borges, C.A.; Cabral-Miranda, W.; Jaime, P.C. Urban food sources and the challenges of food availability according to the brazilian dietary guidelines recommendations. Sustainability 2018, 10, 4643. [Google Scholar] [CrossRef] [Green Version]
  13. Oliveira, R.L.M.; Garcia, C.S.H.F.; Pinto, P.H.G. Accessibility to food retailers: The case of Belo Horizonte, Brazil. Sustainability 2020, 12, 2654. [Google Scholar] [CrossRef] [Green Version]
  14. Bureau of Industrial and Labor Affairs of Tokyo Metropolitan Government. Fact-Finding Report on “Shotengai” in Tokyo 2019. Available online: https://www.sangyo-rodo.metro.tokyo.lg.jp/toukei/chushou/R1syoutengai-zittaityousa.pdf (accessed on 30 September 2020). (In Japanese).
  15. Nakamura, E.; Asami, Y. Mechanism of shopping difficulties for low-income households caused by the increase in high-income households in central Tokyo. J. Arch. Plan. 2020, 85, 1057–1066. [Google Scholar] [CrossRef]
  16. Mlit. White Paper of Metropolitan Area in 2016. Available online: https://www.mlit.go.jp/hakusyo/syutoken_hakusyo/h29/h29syutoken_.files/2902.pdf (accessed on 30 September 2020). (In Japanese).
  17. Mlit. White Paper on Land, Infrastructure, Transport and Tourism in Japan. 2017. Available online: https://www.mlit.go.jp/hakusyo/mlit/h29/index.html (accessed on 2 December 2020). (In Japanese).
  18. Takeshima, Y. Research on the walk environment maintenance for the aged: The order of the barrier and how to cope those barriers in the daily going out. J. Archit. Plan. Env. Eng. 2007, 72, 1–6. [Google Scholar] [CrossRef] [Green Version]
  19. Wakui, S.; Miyake, R.; Sonoda, M. The daily shopping activities of aged and their evaluation to the shops and the shopping area (part 1). Summaries Tech. Papers Annu. Metg. Archi. Inst. J 1999, E-I, 451–452. [Google Scholar]
  20. Hino, K. Connection between inconvenience for shopping and eating habits of old people: Analysis of shopping habit of old people in Itabashi area. J. Archit. Plan. Env. Eng. 2002, 67, 235–239. [Google Scholar] [CrossRef] [Green Version]
  21. Nakamura, E.; Asami, Y.; Yokohari, M. The effect of physical shopping distance on shopping activities for the elderly people—Focusing on the differences in nutritional status in central Tokyo. J. City Plan. Inst. J. 2019, 54, 1365–1371. [Google Scholar]
  22. Ghosh-Dastidar, M.; Hunter, G.; Collins, R.L.; Zenk, S.N.; Cummins, S.; Beckman, R.; Nugroho, A.K.; Sloan, J.C.; Wagner, L.; Dubowitz, T. Does opening a supermarket in a food desert change the food environment? Heal. Place 2017, 46, 249–256. [Google Scholar] [CrossRef] [PubMed]
  23. Wrigley, N.; Warm, D.; Margetts, B.; Whelan, A. Assessing the impact of improved retail access on diet in a ’food desert’: A preliminary report. Urban Stud. 2002, 39, 2061–2082. [Google Scholar] [CrossRef]
  24. Yoshiba, K.; Takemi, Y.; Ishikawa, M.; Yokoyama, T.; Nakaya, T.; Murayama, N. Relationship between dietary diversity and food access among elderly living alone in Saitama Prefecture. Jpn. J. Pub. Health 2015, 62, 707–718. [Google Scholar]
  25. Meti. The List of Countermeasures and Their Budgetary Scale for Disadvantaged Shoppers Conducted by Local Governments in 2017. Available online: https://www.meti.go.jp/policy/economy/distribution/fyjichitai.pdf (accessed on 30 September 2020). (In Japanese).
  26. MIC. White Paper Information and Communications in Japan 2015. Available online: https://www.soumu.go.jp/johotsusintokei/whitepaper/ja/h27/html/nc122400.html (accessed on 29 August 2020). (In Japanese).
  27. Takamatsu, M.; Wada, A.; Kashimura, O. Field survey on dietary habit of elderly women living in Tokyo multistory apartment complex. J. J. Diet. Assoc. 2009, 52, 27–36. [Google Scholar]
  28. MHLW. Health Japan 21 (the Second Term). Available online: https://www.mhlw.go.jp/stf/seisakunitsuite/bunya/kenkou_iryou/kenkou/kenkounippon21.html (accessed on 26 November 2020). (In Japanese).
  29. Nenrin. Report of the Survey of the Services for Preventing Elderly Care in Developed Countries. Available online: https://nenrin.or.jp/center/pdf/29_study_01.pdf (accessed on 26 November 2020). (In Japanese).
  30. Lowsky, D.J.; Olshansky, S.J.; Bhattacharya, J.; Goldman, D.P. Heterogeneity in Healthy Aging. J. Gerontol. 2014, 69, 640–649. [Google Scholar] [CrossRef] [Green Version]
  31. Lucan, S.C.; Maroko, A.R.; Bumol, J.; Varona, M.; Torrens, L.; Schechter, C.B. Mobile food vendors in urban neighbor-hoods—implications for diet and diet-related health by weather and season. Health Place 2014, 27, 171–175. [Google Scholar] [CrossRef] [PubMed] [Green Version]
  32. Tester, J.M.; Yen, I.H.; Laraia, B. Mobile food vending and the after-school food environment. Am. J. Prev. Med. 2010, 38, 70–73. [Google Scholar] [CrossRef] [PubMed] [Green Version]
  33. Tester, J.M.; Yen, I.H.; Laraia, B. Using mobile fruit vendors to increase access to fresh fruit and vegetables for schoolchildren. Prev. Chronic Dis. 2012, 9, E102. [Google Scholar] [CrossRef] [Green Version]
  34. Tsuchiya, S.; Sano, K. A study on additional social service needs for community round-trip type agent in intermediate and mountainous area -Through a questionnaire survey for local people in Yamakoshi village, Nagaoka. J. Rural Plan. Assoc. 2011, 30, 273–278. [Google Scholar] [CrossRef] [Green Version]
  35. Tanimoto, K.; Kuramochi, H.; Tsuchiya, S. Empirical analysis on customer of food delivery services in rural areas. J. City Plan. Inst. J. 2015, 50, 324–330. [Google Scholar]
  36. Asai, H.; Kumagai, M. Efforts to measure the nonmobile consumer in mountain area –The case of Kofu town in Tottori Pre-fecture. AIJ J. Tech. Design 2014, 20, 269–272. [Google Scholar] [CrossRef] [Green Version]
  37. Iwama, N.; Tanaka, K.; Komaki, N.; Ikeda, M.; Asakawa, T. Mapping residential areas of elderly people at high risk of undernutrition: Analysis of mobile sales wagons from the viewpoint of food desert issues. J. Geogr. 2016, 125, 583–606. [Google Scholar] [CrossRef] [Green Version]
  38. Ishii, A.; Sano, K.; Matsuda, K.; Tsuchiya, S. The Usage Condition of Mobile Shop in Underpopulated Areas. Available online: http://library.jsce.or.jp/jsce/open/00039/201105_no43/pdf/126.pdf (accessed on 26 November 2020). (In Japanese).
  39. Yoshimura, Y.; Ito, H.; Yoshimura, H.; Kamada, C.; Okumura, R.; Shinno, Y.; Suzuki, T.; Horie, K.; Takaya, K.; Omi, H. The nutritional and dietary intake among community-dwelling elderly female users of mobile vendor vehicles. Jpn. J. Geriatr. 2018, 55, 51–64. [Google Scholar] [CrossRef] [Green Version]
  40. Cabinet Office. White Paper on Aging Society in 2019. Available online: https://www8.cao.go.jp/kourei/whitepaper/w-2019/zenbun/01pdf_index.html (accessed on 9 February 2021). (In Japanese).
  41. Tokushimaru. Mobile Grocery Sales Wagon, “Tokushimaru”. Available online: https://www.tokushimaru.jp/ (accessed on 26 November 2020). (In Japanese).
  42. Yakushiji, T. Current situation and its future of difficulties in accessing food. In Difficulties in Accessing Food in the Super-Age Society, 1st ed.; Yakushiji, T., Ed.; Harvest-sha: Tokyo, Japan, 2011; pp. 25–39. (In Japanese) [Google Scholar]
  43. Hirai, H.; Takeda, G.; Minami, M. Examination of relationship between shopping environment and food intake in Morioka City. J. Jpn. Soc. Civ. Eng. Ser. D3 2014, 70, I_295–I_303. [Google Scholar] [CrossRef] [Green Version]
  44. MHLW. National Health and Nutrition Survey in Japan 2016. Available online: https://www.mhlw.go.jp/bunya/kenkou/eiyou/dl/h28-houkoku.pdf (accessed on 29 August 2020). (In Japanese).
  45. Takeyama, K.; Suzuki, M. Various factors influence the eating habits of old-old elderly individuals living alone. Jpn. J. Nutr. Diet. 2013, 71, 112–119. [Google Scholar] [CrossRef] [Green Version]
  46. Tanaka, I.; Kitamura, A.; Seino, S.; Ishi, M.; Tomine, Y.; Taniguchi, Y.; Yokoyama, Y.; Narita, M.; Shinkai, S. Relationship between eating alone and dietary variety among urban older Japanese adults. Jpn. J. Pub. Health 2018, 65, 744–754. [Google Scholar]
  47. Tokyo Municipal Autonomy Investigation Committee. Research on Mobility of “Persons” and “Things” in the Aging Society. Available online: https://www.tama-100.or.jp/cmsfiles/contents/0000000/590/hitomono2016-all.pdf (accessed on 29 August 2020). (In Japanese).
  48. Japan Supermarkets Association; All Japan Supermarket Association; New Supermarket Association of Japan. Annual Statistical Survey Report of Supermarkets. Available online: http://www.super.or.jp/wp-content/uploads/2017/10/H29nenji-tokei.pdf (accessed on 29 August 2020). (In Japanese).
  49. Consumers’ Purchasing Condition of Fresh Groceries. Available online: http://www.j-sosm.jp/customer/2017_03.html (accessed on 9 February 2021). (In Japanese).
  50. Report of a Questionnaire Survey of Shopping Environment in Saku City. Available online: https://www.city.saku.nagano.jp/kenko/ikiiki/kaigokeikaku/jittaikekka.files/kaimono4.pdf (accessed on 29 August 2020). (In Japanese).
  51. Actual Condition of Supermarkets by the Number. Available online: http://www.j-sosm.jp/numeral/2017_29_44.html (accessed on 9 February 2021). (In Japanese).
  52. Section of NILS-LSA. Available online: https://www.ncgg.go.jp/cgss/department/ep/topics/topics_edit06.html (accessed on 9 February 2021). (In Japanese).
Figure 1. Locations of the three study areas in Tokyo.
Sustainability 13 02634 g001
Figure 2. Regional structure of the Takashimadaira area.
Sustainability 13 02634 g002
Figure 3. Locations of usage points estimated using tracking and receipt data.
Sustainability 13 02634 g003
Figure 4. An example of usage points and a usage place.
Sustainability 13 02634 g004
Figure 5. Distribution of usage places and grocery stores.
Sustainability 13 02634 g005
Figure 6. Number of routes that have each type of barrier.
Sustainability 13 02634 g006
Figure 7. Number of purchased items at each usage place in the Takashimadaira area.
Sustainability 13 02634 g007
Figure 8. Average numbers of purchased items per one use at three different place types.
Sustainability 13 02634 g008
Figure 9. The composition ratio of purchased groceries at each usage place.
Sustainability 13 02634 g009
Table 1. Definition and explanation of each barrier.
NameExplanation
Far distance The distance (by road) from each usage place to the nearest grocery store is over 500 m
Wide roadIt is necessary to cross at least one wide road whose width is over 13 mon the way to the nearest store
Steep slopeIt is necessary to use at least one steep slope (inclination ≥5%) on the way to the nearest store
Poor installation of sidewalks The ratio of the road alongside which sidewalks are installed on each route is low (below the average value for all routes in each area)
Table 2. Difference of composition ratio (%) by the MGS wagon’s role.
Total
Number of
Purchased Items
MeatsFish/
Seafoods
Vegetables/FruitsPrepared
Side Dishes
Others
Distant, heavy usage places (n = 9)10407.6
(0.52)
11.8
(0.04)
27.1
(−2.52 **)
13.5
(−0.06)
40.0
(2.08 **)
Places where fewer than 50 items were bought (n = 12)2136.6
(−0.52)
11.7
(−0.04)
35.7
(2.52 **)
13.6
(0.06)
32.4
(−2.08 **)
The values in brackets are adjusted residuals for residual analysis. ** p <0.05.
Publisher’s Note: MDPI stays neutral with regard to jurisdictional claims in published maps and institutional affiliations.

