Abstract
The market performance of a company is greatly influenced by the functional experience of the chief executive. In the case of a small startup, the functional experience of the chief executive is even greater. Based on career data of chief executives, this study first classifies startups in the information and communication technology (ICT) industry into four different groups. In addition, this study analyzes the effect of the CEO’s experience on the market performance of ICT startups by deriving the efficiency of each company using the financial data of ICT startups provided in the database. This study estimates the technical efficiency of each group using stochastic frontier analysis and then uses meta-frontier analysis to compare the efficiency of different groups. As a result, the CEO group with a career in strategy and planning showed the highest meta-frontier efficiency, whereas the CEO group with a career in R&D showed the lowest.
JEL:
D24; M12; M13
1. Introduction
In order for a startup to be successful, a wide variety of factors, such as industry characteristics, corporate strategy, and external networks, must be considered. Ref. [1] analyzed 62 studies related to the market performance of startups and summarized the determinants of the startups’ market performance, such as industry characteristics, business strategy, and tangible and intangible assets. However, in addition to the above factors, an important success factor of startups is the characteristic factor of the founder or the chief executive officer. Existing research has shown that the nature and behavior of CEOs [2,3,4], their management experiences [5,6,7], their ages [8,9], and their startup founding experiences [10,11] have a significant impact on the success of startups.
In particular, the career of a CEO is very much related to the market performance and the economic sustainability of the startup because it has a great deal of influence on the part of the company’s strategy that focuses on the various requirements for success in the market, such as R&D capability, financial support, market research, and so on. In this regard, Ref. [12] found that a CEO’s experience primarily affects his or her expertise and dominant logic, and secondarily, his or her decisions and actions, and they described the mechanisms that influence and eventually affect the market performance of startups. Ref. [13] also found that the career of the top manager of a startup influences the sales and survival of subsequent startups, while the career of a general company employee has a positive effect on expanding the sales of startups.
There are various arguments about which careers have a more positive effect on the market performance of startups. Ref. [1] explained that CEOs of startups need a variety of skills and capabilities in communication, financial, interpersonal, managerial, manufacturing, organizational, personnel, and technical areas. In reality, however, it is impossible for a CEO, who is only an individual, to have a career that is so diverse that he or she can acquire all of these skills. If the CEO of a startup has had one or two careers, the capabilities of the CEO will depend on those particular careers. In addition, the market performance of startups can also change. In a review of previous studies, Ref. [11] emphasized that the experience of various departments at the CEO’s past work places had a significant impact on the market performance of startups. Refs. [6,7] emphasized the importance of a career in management, among other experiences. Ref. [14] stressed that a sales career was important in addition to a career in management. In addition, Refs. [15,16] argued that the company the CEO had run previously had an impact on firm performance.
However, studies analyzing the impact of the CEO’s career on the market performance and the economic sustainability of startups are still scarce, and there are few studies using empirical data. The reason for this is that it is difficult to obtain continuous and reliable data related to startups. In particular, few startup data provide the career of the chief executive officer. This study uses data provided by the ICT (Information and Communication Technology) Venture Panel Database collected from 2016–2018 by the Korea Information Society Development Institute (KISDI), a government policy research institute. The database contains 1118 ICT startups from 2015 to 2017, providing top-level career data. Based on the data, this study classifies ICT startups into four groups according to the CEO’s previous experience: (1) a group of companies run by a CEO with a background in R&D, (2) a group of companies run by a CEO with a background in sales and marketing, (3) a group of companies run by a CEO with a background in strategy and planning, and (4) a group of companies run by a CEO with a background in organization and human resource management. Now we can address the research questions as follows.
- RQ1.
- Is there any efficiency difference according to the CEO’s professional experience?
- RQ2.
- Which CEO’s professional experience shows the best market performance?
To answer these questions, this study aims to analyze the effect of the CEO’s career on the market performance and the economic sustainability of ICT startups by deriving the efficiency of each firm using the financial data of ICT startups provided by this database. In the case of sales or productivity, the size of the firm is greatly affected, whereas for efficiency, the production function is estimated and the efficiency is measured by the relative distance from the estimated production function. This method has an advantage in that market performance can be compared while controlling for the impact of the size of the firm. However, the existing efficiency analysis research methodologies, such as stochastic frontier analysis and data envelopment analysis, have a disadvantage in that they cannot compare the efficiency among companies using different production functions. Therefore, in this study, after estimating the technical efficiency of each group by stochastic frontier analysis, we compare the efficiency of the four groups with meta-frontier analysis, which can compare efficiency between different groups. Meta-frontier analysis is used to compare efficiency among firms in many studies, including [17,18,19]. In addition, Tobit regression is used to control the variables that can affect the efficiency of the four groups and then to verify whether the difference in efficiency between the groups is statistically significant.
The structure of this study is as follows: Section 2 examines the existing literature; Section 3 describes stochastic frontier analysis, meta-frontier analysis, and the Tobit regression model; Section 4 presents the results of the analysis; and Section 5 concludes by presenting the implications of the study.
2. Literature Review
2.1. Importance and Capability of the CEO
A great deal of research has demonstrated that the competence of a chief executive plays an important role in the market performance of a general enterprise. The ability to navigate the market environment and select the appropriate strategy, managerial ability to acquire and manage the resources necessary for management, and professional and functional skills have been emphasized as essential capabilities of the CEO [20,21,22,23]. In addition, many studies have demonstrated that the CEO’s competence not only affects the market performance of ordinary firms, but also the market performance of startups. According to [7], the competitive advantage process of startups is greatly influenced by the chief executive, the key actor. In addition, even in the literature emphasizing the need to utilize internal and external resources to build the competitiveness of startups, entrepreneurial elements are emphasized (e.g., [24,25,26]). In startups, decision-makers are concentrated in the ownership, so their roles and actions are fundamentally one of the key determinants of startups’ competitiveness.
2.2. Chief Executive Officer Jobs and Market Performance
Top executives who have to play a variety of roles within an enterprise can be presumed to have an integrated and generalist’s view across functional areas, but they are functionally specialized according to their careers. In the end, the chief executive’s main function is to reflect the knowledge and skills created by his or her work experience in management activities [27]. The knowledge and skills gained in such specialized job areas help CEOs to effectively formulate and implement appropriate strategies. Many studies have emphasized the importance of the top management’s functional experience in formulating and implementing competitive strategies, and empirical analysis shows that most of them have a positive effect on the market performance of the company [28,29,30,31,32,33]. According to [27], the CEO’s relevant professional work experience in relation to the CEO’s experience has an impact on capital intensity and positively impacts R&D investment when the CEO has a degree in science and engineering [34].
2.3. The Classification of the CEO’s Career and Its Effect on Market Performance
Although the existing literature has emphasized the importance of the CEO’s functional experience, few studies have analyzed the professional experience by segmenting it according to careers such as R&D, production, accounting, and so on. Ref. [35] broke down the professional experiences of CEOs and categorized managers’ career experiences into two dimensions: output-related and throughput-related functions. The output-related functional areas included marketing, sales, and R&D functions, and were focused on exploring growth-oriented new products and market opportunities. On the other hand, the throughput-related functional areas included production, finance, and accounting functions, and emphasized operational efficiency. [23] divided the CEO’s competency into three main categories: entrepreneurial, managerial, and technical/functional. In addition, the entrepreneurial competency was specifically divided into opportunity-recognition ability and enthusiasm for venture business success, and the managerial competency was further divided into human competence, conceptual competence and political competence.
Ref. [29] divided the CEO’s functional experience into R&D, manufacturing, marketing and sales, finance, and accounting. He argued that a differentiation strategy with R&D experience is positive for corporate market performance, and that a low-cost leading strategy with manufacturing experience positively influences corporate market performance.
In [28], the CEO’s functional experience was divided into R&D, marketing, engineering, sales, and accounting. The authors found that greater R&D expertise may be required to successfully implement an innovation-differentiation strategy, and that greater engineering expertise is required for the successful execution of a quality-differentiation strategy and service-differentiation strategy. A study by [23] found that chief executives’ entrepreneurial competence results in high revenue growth for firms, and that managerial competence is an important factor in corporate profitability. In particular, they argued that such managerial competence stems from training and management experience in the enterprise, and profitable startups also have a high level of technical and functional education for CEOs and technical skills and expertise in the field.
As mentioned earlier, the competence of a CEO depends on the job experience of the CEO, and the market performance of the company is affected by the competency. However, disagreements have arisen as to which of the various work experiences, and therefore the various competencies, are most important to the market performance of the company. In particular, little is known about the effect of the experience of top managers and their capabilities on the market performance of startups.
Practically, the national survey of Korean venture firms, which has been supported by the Ministry of SMEs and Startups since 1999 and has been authorized as national statistics [36], investigates the CEO’s experience with various categorizations. Here, research and development, sales and marketing, strategy and planning, organization and human resource management, financial accounting, and manufacturing are the primary former experience of CEOs. In order to reflect practical cases in Korea, we apply these categorizations to the ICT startups survey used in this study, and CEOs self-selected their previous experience.
3. Methodology
3.1. Stochastic Frontier Analysis
Stochastic frontier analysis (SFA) estimates the frontier production function representing the maximum output versus input using input and output data and calculates the technical efficiency using the estimated frontier production function. In this case, the technical efficiency (TE) of a company refers to the position of the technology level of the company relative to the technology level represented in the form of a frontier production function. In this case, the further the technology level of the firm is from the frontier production function, the lower the efficiency of the firm. The frontier production function can be estimated using nonparametric and parametric methods. In this study, the parametric method was used to estimate the frontier production function using stochastic frontier analysis. In addition, this study used Frontier Version 4.1 provided by Coelli to estimate the frontier production function.
According to [37], the stochastic production frontier model is assumed to reflect the change in efficiency over time, as shown in Equation (1):
where Yit is the output of firm i at time t, xit is the input vector of firm i at time t, f is the production function, and β is the vector of parameters of the production function. Vit is a random error with a distribution of and is independent of Uit. Uit is a non-negative random variable that represents the technical efficiency of firm i at time t. Vit can be thought of as a general random error in a regression equation, and Uit represents the inefficiency of a company. In order to always show inefficiency, Uit itself is non-negative, and this paper assumed that Uit follows a half-normal distribution.
From Equation (1), the technical efficiency TEit at time t of firm i is given by Equation (2):
In stochastic frontier analysis, the ratio of the actual output of the firm to the maximum output that can be produced through any input combination is defined as technical efficiency. Figure 1 below shows the production function and technical efficiency.
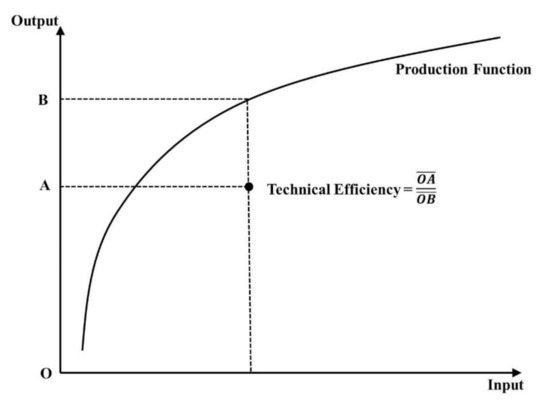
Figure 1.
Production function and technical efficiency. Note: Revenue was used as output vector, and total assets, selling and administrative expenses, and salary were used as the input vector.
Generally, the Cobb–Douglas function and the translog function are the most widely used as SFA production functions, but in the case of Cobb–Douglas, the output variables tend to be oversimplified because they are viewed as a linear combination of inputs only. In particular, using a random effects time-varying production model, assuming a translog-type production function, Equation (1) can be expressed as the following Equation (3):
where x1it represents the size of capital (K) at time t of the i-th company, x2it represents the size of cost (M) at time t of the i-th company, and x3it is the worker at time t of the i-th company (L). This study used total assets for K, selling and administrative (SG&A) expenses for M, and total labor costs for L. We also used revenue for output Y.
3.2. Meta-Frontier Analysis
Since the technical efficiency of a particular company is not comparable with that of a company operating with other technologies, comparisons of technical efficiency between groups cannot be performed using traditional SFA. Therefore, Ref. [38] proposed a new method for comparing the efficiency levels of different groups operating under different technical conditions through the concept of a production function called meta-frontier, which wraps all group production functions. Meta-frontier analysis (MFA) was initially used to analyze the agricultural industry (e.g., [39,40,41]), but recently it has been used in various studies like [42,43,44,45] to compare efficiency among ICT companies.
Ref. [46] defined the meta-frontier production function model as follows:
where is a vector consisting of parameters of the production function of the j-th group, and j means each group. In this study, it meant a group of companies run by a CEO with an R&D career (j = 1), a group of companies run by a CEO with a sales and marketing career (j = 2), a group of companies run by a CEO with a strategy and planning career (j = 3), and a group of companies run by a CEO with an organization and human resource management career (j = 4). is the unknown variable vector of the meta-frontier function satisfying Equation (4). From Equation (4) above, the graph of the meta-frontier production function is placed above the graph of the production frontier function of each group for all periods. In other words, the meta-frontier production function is an envelope of the frontier functions of each group based on the same technology. For simplicity, assuming that the function f of Equation (1) is , Equation (1) can be divided as follows:
Dividing both sides of Equation (5) by gives the following Equation (6):
In Equation (2), we defined as the technology efficiency at time t of firm i. Thus, in the above Equation (6), the first part of the right side is the technical efficiency of group j. The second part is expressed as the ratio of the j-group frontier production function to the meta-frontier production function, which is called the technology gap ratio (TGR) or meta-technology ratio (MTR). In this study, we used TGR. In other words, TGR indicates how high the relative frontier production function is located when compared to the meta-frontier production function. Finally, comparing the left side of Equation (6) with Equation (2), it can be seen that is substituted for β in Equation (2). That is, Equation (2) is the technical efficiency calculated from the ratio of the group frontier production function to the production point, and Equation (6) is the meta-frontier technical efficiency calculated by the ratio of the meta-frontier production function to the production point. In other words, the left side of Equation (6) represents meta-frontier technology efficiency, which is named TE*. Therefore, Equation (6) means that TE* is a product of TE and TGR and can be expressed as follows:
Figure 2 describes the meta-frontier production function.
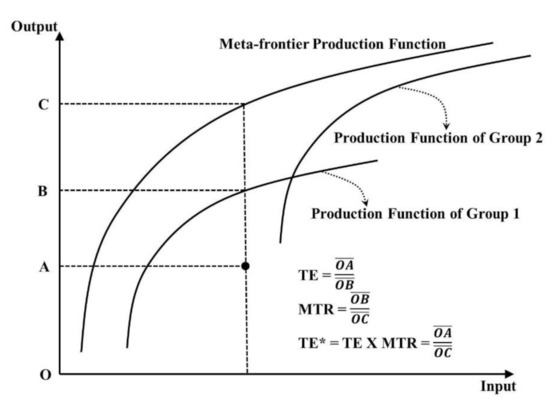
Figure 2.
Meta-frontier production function, MTR and TE*. Note: Revenue was used as the output vector, and total assets, selling and administrative expenses, and salary were used as the input vector.
There are two ways to measure the parameters of meta-frontier functions: linear programming (LP) and quadratic programming (QP). LP is the method of minimizing the sum of the absolute values of the deviations, and QP is the method of minimizing the sum of the squares of the deviations. According to [46], LP and QP are defined as follows:
In this study, we used Matlab 7.1 to measure the parameters of the meta-frontier function using LP and QP above.
3.3. Tobit Regression
The MFA method compares the efficiency of each group using different techniques but does not indicate whether the difference in efficiency between groups is statistically significant. Therefore, in this study, other factors affecting efficiency were controlled to confirm the statistical significance of efficiency differences between groups. TGR was used as a dependent variable to identify the difference in efficiency among groups. Since TGR has a limited range of values between 0 and 1, a censored regression model, the Tobit regression model, was used for the analysis. The model used for the analysis is shown in the following Equation (10):
In Equation (10), dummy variables are used to show the difference in efficiency of each group, and the R&D group is used as a reference. Therefore, dummy1, dummy2, and dummy3 represent the differences between the sales group and R&D group, the strategy group and R&D group, and the HR group and R&D group, respectively. is an error term and assumes the normal distribution . The variables k, l, and m denote total assets, SG&A expenses, and salary, respectively.
3.4. Data
A total of 1118 ICT startup companies were surveyed in this study. The average age of the ICT startups used in this study was 3.1386, the standard deviation was 1.2792, and the oldest company was 7 years old. We used the revenue as output and total assets, SG&A expenses, and total salary as input. Of the six years of data from 2012 to 2017, we used only three years of financial data from 2015 to 2017, when the CEO’s experience was investigated. Out of a total of 1118 ICT startups (2540 samples), 1092 ICT startups were used in the study, excluding 26 that had missing data in all three years. The average and standard deviation of the financial data of 1092 ICT startups are shown in Table 1 below.

Table 1.
Average and standard deviation of financial data for all samples (unit = 1000 KRW).
Among the 1092 ICT startups, 885 firms (2127 samples) had one CEO, while 207 firms (413 data) were jointly run by two or more CEOs. In these cases, it was impossible to classify the types of careers of the CEO of the company into one. Therefore, this study analyzed only 885 companies run by one CEO. In addition, 19 out of a total of 2127 samples run by a single CEO were those in which the CEO had two or more existing experiences, and these data were deleted because they were not suitable for the purpose of the study. Finally, the number of samples used in this study was 2108. Among them, 1106 cases had the CEO’s previous experience in an R&D career, 245 in a sales and marketing career, 137 in a strategy and planning career, 54 in an organization and HR management career, 22 in a financial accounting career (9 firms), and 15 in a manufacturing career (6 firms). Among the groups, financial accounting and manufacturing were excluded from the analysis because the number of samples was insufficient for estimation. As a result, the remaining four groups (R&D group, sales and marketing group, strategy and planning group, and organization and HR management group) were analyzed.
4. Empirical Results
4.1. Group Difference
Table 2 shows the statistics of the samples used in this study. The average values show that there was no significant difference in revenue and total assets between the R&D and sales and marketing groups, but for sales management expenses and total salary, the R&D group was larger than the sales and marketing group. In particular, the organization and HR group was larger than the other groups in terms of the output variables and all the input variables. This means that there was a difference between the input and output scales of the four groups, and one-way ANOVA was performed to confirm the statistical significance of the size differences. One-way ANOVA analysis resulted in the rejection of the null hypothesis that Y (p = 0.0593) and M (p = 0.0142) would have the same mean values for the four groups at 90% and 95% significance levels, respectively; L (p = 0.1767) and K (p = 0.5131) were not rejected. However, as can be seen in Table 2 above, even in the case of L and K, the organization and HR management group showed a large difference from other groups. In fact, the t-test comparing the group with other groups showed that the differences between the groups were all significant. Because the purpose of this study was to analyze the effect of the CEO’s career on the efficiency of ICT startup firms, this study derived the results of the MFA, then controlled the size of the group, and then verified the statistical significance of the technical efficiency between the groups.
Table 2.
Average and standard deviation of financial data by group (unit = 1000 KRW).
4.2. Estimation Results
Table 3 shows the coefficients of the group frontier production function estimated using Frontier 4.1 and the meta-frontier production function calculated using Matlab 7.1. According to the stochastic frontier analysis, total assets, SG&A expenses, and salary were significant to the revenue of ICT startups, except the group with a CEO with a background in strategy and planning. Total assets were positively related with all groups, and SG&A expenses and salary showed a different relationship direction for each group.
Table 3.
Results of the group production function and meta-frontier production function.
TE, TGR, and TE* were calculated using the estimated group production function and the meta-frontier production function. Table 4 shows the results.
Table 4.
Estimates of TE, TGR, and TE*.
As a result of the TE analysis, the R&D group was the highest at 0.5896, and the sales and marketing group was 0.5847, showing almost no difference from the R&D group. In contrast, the organization and HR management group (0.4928) and the strategy and planning group (0.2462) were relatively low. However, as mentioned in the Introduction, TE can only be compared within a group using the same frontier production function, and therefore, comparing the TE values of different groups is meaningless. Instead, the efficiency between groups can be compared through MTR, which is calculated as the distance between the meta-frontier production function and the group production function. Looking at the TGR in Table 4, the result of the TGR was the opposite of that of the TE. First, the strategy and planning group’s TGR_LP was 0.8956, indicating that the production function of the group was located closest to the meta-frontier production function. This was followed by the organization and HR management group (0.4472) and the sales and marketing group (0.3587), with the lowest TGR of 0.2844 in the R&D group. This result was the same in the TGR_QP (strategy and planning group (0.8986) > organization and HR management group (0.4433) > sales and marketing group (0.3524) > R&D group (0.2912)).
However, the results of the meta-frontier analysis only revealed the results of each group’s TGR. It is not known whether the difference in the TGR of each group was statistically significant. Therefore, in order to confirm the statistical significance of the difference in efficiency among the four groups, this study performed an additional estimation. The difference in efficiency was examined through TGR_LP. Since TGR_LP had a value between 0 and 1, the Tobit regression model was adopted. Table 5 below shows the results of the Tobit regression. The R&D group was used as a reference group. Thus, dummy1, dummy2, and dummy3 represent the differences between the sales group and R&D group, strategy group and R&D group, and HR group and R&D group, respectively. According to the estimation, all dummy variables were significant and positive. This implies the R&D group showed the lowest efficiency in terms of TGR, even when input factors were controlled. Specifically, the differences in TGR_LP between the groups were 0.0570, 0.6410, and 0.1542 for dummy1, dummy2, and dummy3, respectively. Similar to the results of the MFA, the order of efficiency was strategy and planning group > organization and HR management group > sales and marketing group > R&D group; and the difference between the groups was significant at a 99% significance level.
Table 5.
Results of Tobit regression.
5. Discussion
The analysis showed that the groups’ TE was in the following order: R&D group > sales and marketing group > organization and HR management group > strategy and planning group. In terms of the MTR, however, the results were in the opposite order from that of TE: strategy and planning group > organization and HR management group > sales and marketing group > R&D group. The highest TE value, for ICT startups being operated by the CEOs with R&D experience, indicated that most companies were producing near the group frontier production function. The lowest MTR, however, meant that although the firms were producing near the group frontier production function, the production function itself was located further from the meta-frontier production function than the other groups. In other words, the R&D group could not create innovations that could move the group frontier production function up. Refs. [47,48,49] and others have indicated that technological innovation through R&D has a positive effect on the market performance of a company, but the effect may vary depending on the size of the firm or the characteristics of the industry to which it belongs. In addition to technology, for large firms with most of the capabilities needed to do business, technological innovation clearly leads to corporate market performance, but for SMEs, the relationship is unclear, and startups may have negative consequences. In addition, it can be seen that the technological advantage was not directly related to the competitive advantage in the market in the case of JVC’s VHS and Sony’s Betamax videotape competition and Korea’s and Japan’s competition over DRAM semiconductors. After all, in order for technology development to lead to sales, various factors must be added, such as the analysis of consumer demand through market analysis, appropriate product marketing strategy, distribution channels, and nontechnical competitive advantages, such as cost reduction in the manufacturing process.
In terms of strategic entrepreneurship, the results of this study can provide some insights as well. The concept of strategic entrepreneurship is a series of management activity for the organizational sustainability, including opportunity-seeking and advantage-seeking behaviors [50,51,52]. This focuses on strategic renewal, sustained regeneration, domain redefinition, organizational rejuvenation, and business-model reconstruction, and renewal implies an innovation and reformation of strategy, organizational structure, and process [53]. Especially, entrepreneurs’ experience is one of major factors in strategic entrepreneurship [54]. Because it is a primary element affecting entrepreneurial decision-making, continuous investments in skills and networks—the experience capability—should be emphasized in a CEO’s career [55]. In spite of the fact that various standards of market performance exist, this study showed that a CEO’s experience surely affects revenue. Therefore, from an economic sustainability perspective, not only the CEO’s career accumulated through former experience but also constant learning, and even different expertise, is important and critical to market performance. This raises a new research question regarding the efficiency of a CEO’s mixed experiences.
6. Conclusions and Limitations
In this study, an efficiency analysis was conducted to analyze how a CEO’s professional competence; that is, the past career of the CEO, affects the market performance of ICT startups. In particular, in this study, ICT startups run by a single CEO were divided according to their careers in order to analyze the effect of the CEO’s career on the efficiency of the company. ICT startups were divided into an R&D group, sales and marketing group, strategy and planning group, and organization and HR management group to compare the effectiveness of the four groups.
The study contributes to the literature in two ways. First, the study takes into empirical consideration the functional specialty that an entrepreneur has at the time of starting a new business, a topic which has been neglected in the entrepreneurship literature. While the management literature dealing with relatively large firms has viewed a CEO’s career as an important factor that determines a firm’s strategic actions, including internationalization, R&D activities, and succession planning, the entrepreneurship literature has mainly focused on a few demographic characteristics of entrepreneurs, such as age, gender, and education. Given the enormous impact that entrepreneurs have on their startup’s performance, this study attempts to fill the gap by shedding new light on the role of entrepreneurs’ career specialties. Second, by examining entrepreneur career experience, our paper raises management issues, both theoretical and practical, as to technology-oriented entrepreneurial businesses. As it is inevitable that a young high-tech firm consists of only a small number of people, most of whom are the founders, there is widespread consensus that R&D people—those who produce the technology that the firm possesses and best understand the technological environment of the industry to which the firm belongs—should be in the position of top decision-making. The result of this study, contrary to the well-known but unverified idea, provides an empirical implication that technology-based executives are less capable of enhancing efficiency frontiers. Business generalists, whose skills are specialized in strategic planning and organization management, are able to do better jobs in entrepreneurial firms as well as large public firms.
The study also provides a policy implication that entrepreneurship policy should be designed depending on the purpose of the policy. With the unemployment rate rising and economic growth stagnating, many countries have adopted policy tools encouraging entrepreneurship as one of major economic and innovation policies. In the wave of new entrepreneurial policies are the supports for technology-based entrepreneurs. For example, the Korean government now funds university venture capitals that are meant to give risk capital to high-tech startups established by university professors or graduates, while the Italian government has legislated equity-based crowdfunding only for young high-tech startups that have employed either experienced scientists or significantly invested in R&D activities. The result of this study provides an implication that the policy measures that motivate scientists and engineers to start a new business serve the purpose of achieving a high level of R&D performance and the commercialization of scientific outputs, but not for the purpose of building an entrepreneurial ecosystem that creates more jobs and more marketable innovations, eventually moving up the efficiency frontiers of production curves of the economy.
From the strategic point of view, entrepreneurs should be more cautious in running their technology-oriented startups. Technological accomplishments do not necessarily guarantee innovation performances or commercial successes. As a top executive, founders need state-of-the-art skills not only in the R&D unit, but also in the area of management and strategy. This implication then leads to a reasonable question of whether the founding team made up of a technology specialist and a management generalist performs better than any of the single founders, which leaves an issue for future study.
Acquisition of data is not easy for startups, especially long-term acquisition of panel data, and their analysis is hard to find. This study has great significance in that it is a panel data analysis of 1118 ICT startups surveyed by KISDI since 2015. However, financial data of startups has fundamental limitations for efficiency analysis. First, changes in sales of startups are not necessarily determined by inputs. In particular, it is not unusual for a company to have no sales when it is one to two years old. Second, startups’ input changes are regarded as big changes in terms of the change rate. For example, a very small firm would have only one labor input increase if its input worker count increased from two to three, but the efficiency change would be large because it would be considered a 50% increase in the efficiency analysis. In addition, although this study used variables most commonly used to estimate production functions as input variables and output variables, this study is limited in that there are many variables that are not controlled. That is, ceteris paribus, the condition is not fully met. For example, specific industries and technology types in the ICT sector, such as hardware and software, can cause industry bias, and the primary business area of each ICT startup can cause regional bias. Finally, although the sample size of CEOs having two or more career experiences is small and thus was excluded from this analysis, this can be critical to the result.
We recommend that the following studies be conducted in the future. First, technical efficiency was used to measure the market performance of startups in this study, but it is not the only indicator to determine better startups, and the valuation of startups and the internal rate of return are often used as the measure of success of startups. As a further study, analyzing the impact of CEO’s career on the market performance of startups through indicators other than technical efficiency could provide new implications. Second, this study derived results only from Korean data. If startups from different countries were to be compared in the future, it is expected that more interesting results would be produced. Third, for many startups, professional CEOs and not founders run the company, and it is well known that founders and professional CEOs have different management incentives. Therefore, it is expected that research that compares the market performance of founders and professional CEOs separately can provide new implications.
Author Contributions
Data curation, Y.J.; Methodology, D.L.; Supervision, D.L.; Writing—original draft, D.L. and Y.J.; Writing—review & editing, H.K. and D.L. All authors have read and agreed to the published version of the manuscript.
Funding
This research was supported by the Ministry of Education of the Republic of Korea and the NRF (No. 2020S1A5A8045556, 2020R1F1A1048202).
Institutional Review Board Statement
Not applicable.
Informed Consent Statement
Not applicable.
Data Availability Statement
Restrictions apply to the availability of these data. Data was obtained from Korea Information Society Development Institute but is available with the permission of Korea Information Society Development Institute.
Code Availability
Not applicable.
Conflicts of Interest
The authors declare no conflict of interest.
References
- Chrisman, J.J.; Bauerschmidt, A.; Hofer, C.W. The Determinants of New Venture Performance: An Extended Model. Entrep. Theory Pract. 1998, 23, 5–29. [Google Scholar] [CrossRef]
- Ren, Q.; Xu, Y.; Zhou, R.; Liu, J. Can CEO’s humble leadership behavior really improve enterprise performance and sustainability? A Case Study of Chinese Start-Up Companies. Sustainability 2020, 12, 3168. [Google Scholar] [CrossRef]
- Timmons, J. New Venture Creation; Irwin McGraw-Hill: Boston, MA, USA, 1994. [Google Scholar]
- Timmons, J.; Stevenson, H.H. Entrepreneurship: What It Is and How to Teach It; Kao, J., Stevensen, H.H., Eds.; Harvard Business School: Boston, MA, USA, 1985; pp. 115–134. [Google Scholar]
- Blank, T.H.; Carmeli, A. Does founding team composition influence external investment? The role of founding team prior experience and founder CEO. J. Technol. Transf. 2020. [Google Scholar] [CrossRef]
- Stuart, R.W.; Abetti, P.A. Start-up ventures: Towards the prediction of early success. J. Bus. Ventur. 1987, 2, 215–230. [Google Scholar] [CrossRef]
- Stuart, R.W.; Abetti, P.A. Impact of entrepreneurial and management experience on early performance. J. Bus. Ventur. 1990, 5, 151–162. [Google Scholar] [CrossRef]
- Azoulay, P.; Jones, B.F.; Kim, J.D.; Miranda, J. Age and High-Growth Entrepreneurship. Am. Econ. Rev. Insights 2020, 2, 65–82. [Google Scholar] [CrossRef]
- Saffer, D. Does Age Matter? Comparing CEO Age and Social Media Success in Startups. 2017. Available online: https://scholarship.claremont.edu/cmc_theses/1685/ (accessed on 29 January 2021).
- Lee, J.M.; Yoon, D.; Boivie, S. Founder CEO Succession: The Role of CEO Organizational Identification. Acad. Manag. J. 2020, 63, 224–245. [Google Scholar] [CrossRef]
- Vesper, K.H. New Venture Strategies; Prentice-Hall: Englewood Cliffs, NJ, USA, 1980. [Google Scholar]
- Reuber, A.R.; Fischer, E. Understanding the consequences of founders’ experience. J. Small Bus. Manag. 1999, 37, 30. [Google Scholar]
- Delmar, F.; Shane, S. Does experience matter? The effect of founding team experience on the survival and sales of newly founded ventures. Strat. Organ. 2006, 4, 215–247. [Google Scholar] [CrossRef]
- Teach, R.D.; Tarpley, F.A.; Schwartz, R.G. Software venture teams. In Frontiers of Entrepreneurship Research; Ronstadt, R., Hornaday, J., Peterson, R., Vesper, K., Eds.; Babson College: Wellesley, MA, USA, 1986; pp. 546–562. [Google Scholar]
- Georgakakis, D.; Ruigrok, W. CEO Succession Origin and Firm Performance: A Multilevel Study. J. Manag. Stud. 2017, 54, 58–87. [Google Scholar] [CrossRef]
- Schepker, D.J.; Kim, Y.; Patel, P.C.; Thatcher, S.M.; Campion, M.C. CEO succession, strategic change, and post-succession performance: A meta-analysis. Lead. Q. 2017, 28, 701–720. [Google Scholar] [CrossRef]
- Na, H.S.; Hwang, J.; Hong, J.Y.J.; Lee, D. Efficiency comparison of digital content providers with different pricing strategies. Telemat. Inf. 2017, 34, 657–663. [Google Scholar] [CrossRef]
- Shon, M.; Shin, J.; Hwang, J.; Lee, D. Free contents vs. inconvenience costs: Two faces of online video advertising. Telemat. Inf. 2021, 56, 101476. [Google Scholar] [CrossRef]
- Jo, Y.; Chung, W.Y.; Lee, D. The capability-enhancing role of government-driven industrial districts for new technology-based firms in South Korea. Asia Pac. Policy Stud. 2020, 7, 306–321. [Google Scholar] [CrossRef]
- Bandiera, O.; Prat, A.; Hansen, S.; Sadun, R. CEO Behavior and Firm Performance. J. Political Econ. 2020, 128, 1325–1369. [Google Scholar] [CrossRef]
- Baum, J.R.; Locke, E.A.; Smith, K.G. A multidimensional model of venture growth. Acad. Manag. J. 2001, 44, 292–303. [Google Scholar] [CrossRef]
- Chandler, G.N.; Hanks, S.H. An examination of the substitutability of founders human and financial capital in emerging business ventures. J. Bus. Ventur. 1998, 13, 353–369. [Google Scholar] [CrossRef]
- Chandler, G.N.; Jansen, E. The founder’s self-assessed competence and venture performance. J. Bus. Ventur. 1992, 7, 223–236. [Google Scholar] [CrossRef]
- Sandberg, W.R.; Hofer, C.W. The Effects of Strategy and Industry Structure on New Venture Performance. In Frontiers of Entrepreneurship Research; Babson College: Wellesley, MA, USA, 1986; pp. 244–266. [Google Scholar]
- Sandberg, W.R.; Hofer, C.W. Improving new venture performance: The role of strategy, industry structure, and the entrepreneur. J. Bus. Ventur. 1987, 2, 5–28. [Google Scholar] [CrossRef]
- Van De Ven, A.H.; Hudson, R.; Schroeder, D.M. Designing New Business Startups: Entrepreneurial, Organizational, and Ecological Considerations. J. Manag. 1984, 10, 87–108. [Google Scholar] [CrossRef]
- Rajagopalan, N.; Datta, D.K. CEO Characteristics: Does Industry Matter? Acad. Manag. J. 1996, 39, 197–215. [Google Scholar] [CrossRef]
- Beal, R.M.; Yasai-Ardekani, M. Performance Implications of Aligning CEO Functional Experiences with Competitive Strategies. J. Manag. 2000, 26, 733–762. [Google Scholar] [CrossRef]
- Govindarajan, V. Implementing competitive strategies at the business unit level: Implications of matching managers to strategies. Strat. Manag. J. 1989, 10, 251–269. [Google Scholar] [CrossRef]
- Gupta, A.K.; Govindarajan, V. Business unit strategy, managerial characteristics, and business unit effectiveness at strategy implementation. Acad. Manag. J. 1984, 27, 25–41. [Google Scholar]
- Mayer-Haug, K.; Read, S.; Brinckmann, J.; Dew, N.; Grichnik, D. Entrepreneurial talent and venture performance: A meta-analytic investigation of SMEs. Res. Policy 2013, 42, 1251–1273. [Google Scholar] [CrossRef]
- Song, M.; Podoynitsyna, K.; Van Der Bij, H.; Halman, J.I. Success factors in new ventures: A meta-analysis. J. Prod. Innov. Manag. 2008, 25, 7–27. [Google Scholar] [CrossRef]
- Thomas, A.S.; Litschert, R.J.; Ramaswamy, K. The performance impact of strategy—Manager coalignment: An empirical examination. Strat. Manag. J. 1991, 12, 509–522. [Google Scholar] [CrossRef]
- Barker, V.L., III; Mueller, G.C. CEO characteristics and firm R&D spending. Manag. Sci. 2002, 48, 782–801. [Google Scholar]
- Hambrick, D.C.; Mason, P.A. Upper echelons: The organization as a reflection of its top managers. Acad. Manag. Rev. 1984, 9, 193–206. [Google Scholar] [CrossRef]
- Ministry of SMEs and Startups. 2020 Survey of Korea Venture Firms. 2020. Available online: https://venture.or.kr/#/home/bizNotice/h0203/2/3798/1 (accessed on 29 January 2021).
- Battese, G.E.; Coelli, T.J. A model for technical inefficiency effects in a stochastic frontier production function for panel data. Empir. Econ. 1995, 20, 325–332. [Google Scholar] [CrossRef]
- Battesse, G.E.; Rao, D.S.P. Technology gap, efficiency, and a stochastic metafrontier function. Int. J. Bus. Econ. 2002, 1, 87–93. [Google Scholar]
- Moreira, V.H.; Bravo-Ureta, B.E. Technical efficiency and metatechnology ratios for dairy farms in three southern cone countries: A stochastic meta-frontier model. J. Prod. Anal. 2009, 33, 33–45. [Google Scholar] [CrossRef]
- O’Donnell, C.J.; Rao, D.S.P.; Battese, G.E. Metafrontier frameworks for the study of firm-level efficiencies and technology ratios. Empir. Econ. 2008, 34, 231–255. [Google Scholar] [CrossRef]
- Zhuo, C.; Shunfeng, S. Efficiency and technology gap in China’s agriculture: A regional meta-frontier analysis. China Econ. Rev. 2008, 19, 287–296. [Google Scholar]
- Chung, W.Y.; Jo, Y.; Lee, D. Where should ICT startup companies be established? Efficiency comparison between cluster types. Telemat. Inf. 2021, 56, 101482. [Google Scholar] [CrossRef]
- Kim, H.; Lee, D.; Hwang, J. The effect of online platform maturity on the efficiency of offline industry. Telemat. Inf. 2018, 35, 114–121. [Google Scholar] [CrossRef]
- Lee, K.; Park, Y.; Lee, D. Measuring efficiency and ICT ecosystem impact: Hardware vs. software industry. Telecommun. Policy 2018, 42, 107–115. [Google Scholar] [CrossRef]
- Ryu, M.H.; Cho, Y.; Lee, D. Should small-scale online retailers diversify distribution channels into offline channels? Focused on the clothing and fashion industry. J. Retail. Consum. Serv. 2019, 47, 74–77. [Google Scholar] [CrossRef]
- Battese, G.E.; Rao, D.S.P.; O’Donnell, C.J. A Metafrontier Production Function for Estimation of Technical Efficiencies and Technology Gaps for Firms Operating Under Different Technologies. J. Prod. Anal. 2004, 21, 91–103. [Google Scholar] [CrossRef]
- Capon, N.; Farley, J.U.; Lehmann, D.R.; Hulbert, J.M. Profiles of Product Innovators among Large U.S. Manufacturers. Manag. Sci. 1992, 38, 157–169. [Google Scholar] [CrossRef]
- Deshpande, R.; Farley, J.U.; Webster, F.E., Jr. Corporate culture, customer orientation, and innovativeness in Japanese firms: A quadrad analysis. J. Mark. 1993, 57, 23–37. [Google Scholar] [CrossRef]
- Tubbs, M. The Relationship between R&D and Company Performance. Res. Manag. 2007, 50, 23–30. [Google Scholar] [CrossRef]
- Gast, J.; Gundolf, K.; Cesinger, B. Doing business in a green way: A systematic review of the ecological sustainability entrepreneurship literature and future research directions. J. Clean. Prod. 2017, 147, 44–56. [Google Scholar] [CrossRef]
- Hitt, M.A.; Ireland, R.D.; Camp, S.M.; Sexton, D.L. Strategic entrepreneurship: Entrepreneurial strategies for wealth creation. Strat. Manag. J. 2001, 22, 479–491. [Google Scholar] [CrossRef]
- Kuratko, D.F.; Audretsch, D.B. Strategic Entrepreneurship: Exploring Different Perspectives of an Emerging Concept. Entrep. Theory Pract. 2009, 33, 1–17. [Google Scholar] [CrossRef]
- Morris, M.H.; Kuratko, D.F.; Covin, J.G. Corporate Innovation and Entrepreneurship: Entrepreneurial Development within Organizations, 3rd ed.; South-Western Cengage Learning: South Melbourne, Australia, 2011. [Google Scholar]
- Schröder, K.; Tiberius, V.; Bouncken, R.B.; Kraus, S. Strategic entrepreneurship: Mapping a research field. Int. J. Entrep. Behav. Res. 2020. [Google Scholar] [CrossRef]
- Engel, Y.; Van Burg, E.; Kleijn, E.; Khapova, S.N. Past Career in Future Thinking: How Career Management Practices Shape Entrepreneurial Decision Making. Strat. Entrep. J. 2017, 11, 122–144. [Google Scholar] [CrossRef]


Publisher’s Note: MDPI stays neutral with regard to jurisdictional claims in published maps and institutional affiliations. |
© 2021 by the authors. Licensee MDPI, Basel, Switzerland. This article is an open access article distributed under the terms and conditions of the Creative Commons Attribution (CC BY) license (http://creativecommons.org/licenses/by/4.0/).