Article

Sustainability Assessment of Intensified Forestry—Forest Bioenergy versus Forest Biodiversity Targeting Forest Birds

1
KTH Royal Institute of Technology, SE-100 44 Stockholm, Sweden
2
Nature Research Centre, LT-08412 Vilnius, Lithuania
3
Southern Swedish Forest Research Centre, Swedish University of Agricultural Sciences, SE-230 53 Alnarp, Sweden
4
Institute of Forest Management and Wood Science, Faculty of Forest Sciences and Ecology, Agriculture Academy, Vytautas Magnus University, LT-53361 Akademija, Kaunas distr., Lithuania
*
Author to whom correspondence should be addressed.
Sustainability 2021, 13(5), 2789; https://doi.org/10.3390/su13052789
Submission received: 12 February 2021 / Revised: 23 February 2021 / Accepted: 26 February 2021 / Published: 4 March 2021
(This article belongs to the Special Issue Integrated Sustainability Assessment of Forest Bioenergy Options)

Abstract

:
Intensified forestry can be seen as a solution to climate change mitigation and securing energy supply, increasing the production of forest bioenergy feedstock as a substitution for fossil fuels. However, it may come with detrimental impacts on forest biodiversity, especially related to older forests. The aim of this study was to assess the sustainability of intensified forestry from climate-energy and biodiversity perspectives, targeting forest bird species. For this purpose, we applied the Landscape simulation and Ecological Assessment (LEcA) tool to the study area of Lithuania, having high ambitions for renewables and high forest biodiversity. With LEcA, we simulated forest growth and management for 100 years with two forest management strategies: Business As Usual (BAU) and Intensive forestry (INT), the latter with the purpose to fulfil renewable energy goals. With both strategies, the biomass yields increased well above the yields of the reference year, while the biodiversity indicators related to forest bird habitat to different degrees show the opposite, with lower levels than for the reference year. Furthermore, Strategy INT resulted in small-to-no benefits in the long run concerning potential biomass harvesting, while substantially affecting the biodiversity indicators negatively. The model results have the potential to inform policy and forest management planning concerning several sustainability goals simultaneously.

Graphical Abstract

1. Introduction

Forest bioenergy feedstock can substitute fossil fuels, which may lead to policies promoting intensified forest management that target climate change mitigation and securing energy supply, as well as the extraction of other biomass products. However, these forest practices may have major negative impacts on forest biodiversity, especially related to older forests [1,2]. Increasing use of renewable energy sources (RES) is essential to achieving the world’s climate and energy objectives, such as the United Nations (UN) sustainable development goals 13 “Climate Action” and 7 “Affordable and clean energy” [3]. The European Union (EU) aims to be climate-neutral by 2050, which is in line with the commitment to global climate action under the Paris Agreement [4]. The demands for forest products can be expected to rise due to the increased use of RES related to these climate and energy policies, especially in forest-rich countries. Additionally, the policies and strategies concerning an overall bio-based economy, aiming to realize sustainability goals through an increasing provision of goods and services derived from biological resources, will amplify these demands [5,6].
To meet the increasing demands for RES in the form of forest residues, fuelwood and by-products from the forest industry, as well as other bio-based materials, intensified forestry could be applied. Intensified forest management aims at increasing biomass production by maximizing existing technology, for instance using fertilizers, genetically improved material, alien fast growing tree species, and optimized forest management schemes including shorter rotations [7]. However, intensified forest management may affect natural forest structures and processes, resulting in further simplification of managed stands and reducing the amount of older forest in the landscape. This can be expected to lead to habitat loss and related negative impacts on forest biodiversity [1,8,9,10]. Therefore, increasing use of forest biomass resources also means potential conflicts with other sustainability goals, such as the global UN goal targeting biodiversity, 15 “Life on Land” [11]. According to the latter, urgent action is required to reduce the loss of natural habitats and biodiversity, and forest biodiversity needs to be sustained or enhanced over the coming century to halt the biodiversity crisis [12].
In the EU, the overall objective is to reach 20% of energy from renewable sources by 2020, as stated by the EU Renewable Energy Directive [13]. Furthermore, forest biomass, used for electricity, heating and cooling, and transport fuels, is the biggest source of renewable energy in the EU and will contribute significantly to the EU’s RES target [14,15]. Simultaneously, the EU Biodiversity Strategy [16] promotes protection of all primary and old-growth forests, and recognizes the importance of sustainable forest management. This implies maintaining forest biodiversity, and biodiversity-friendly forestry practices are to be further developed [16,17]. Thus, in the EU forest strategy (EC 2013), as well as in the EU strategic vision “A clean planet for all” [4]; RES, bio-based economy and biodiversity are all targeted and need to be balanced in a sustainable forest management.
For balancing these sustainability goals, increasing synergies, but minimizing conflicts, integrated and systemic understanding of the goal interactions need to be developed (e.g., References [18,19]). Yet, existing energy models and research on renewable energy options often have low concerns on land use, landscapes and biodiversity [20]. However, recently, several studies have addressed potential synergies and trade-offs that can occur between forest biodiversity and forest biomass production [21,22,23,24]. A key question is the potential to secure or increase forest biomass production, while concurrently securing habitat requirements of forest-dependent taxa [10,25,26,27]. For such analyses, addressing forest biomass and forest biodiversity together, several modelling tools have been developed, e.g., Kupolis [28], Heureka [29], and others (see e.g., Reference [30]).
However, few studies use spatially explicit models on the landscape scale, which also allow for a landscape pattern induced by forest management strategies to be evaluated. While habitat quality and total habitat amount are of major importance for species’ persistence (e.g., References [31,32]), habitat configuration (spatial arrangement) is also important, in particular on the landscape scale (e.g., References [33,34,35,36]). Habitat configuration such as forest edges and forest interior as well as patch size may imply different habitat conditions [34,37,38,39], not least for forest bird species, which may not have the same requirements as other groups of species (e.g., Reference [40]), and forest management will strongly affect these spatial properties. Fragmentation of older forests led to decline in patch size and interior forest habitat, while increasing the amount of forest edges. The increase in forest edge habitat that is more exposed to human land uses may be negative for species depending on forest interior, but can, under certain conditions for species using several habitat types, be beneficial. Therefore, for assessing forest biodiversity, it is important to not only find and summarize habitat across landscapes, but also to assess its spatial configuration.
In order to link resource assessment for forest bioenergy and other biomass materials with the main sustainability goals such as biodiversity, integrating landscape pattern, the Landscape simulation and Ecological Assessment (LEcA) tool can be applied. The LEcA tool has moderate data requirements and spatial assessment capabilities across whole landscapes, so it can simulate forest growth and management and assess related biomass yields and biodiversity components, including habitat quality, amount and configuration [41]. This enables integrated sustainability assessment of forest management policies and their impacts on multiple sustainability goals, including climate, energy and forest resources, as well as important biodiversity aspects.
The aim of the study was to assess the sustainability of intensified forestry from climate-energy and biodiversity perspectives, targeting forest bird species. For this purpose, we applied the LEcA tools for simulation of forest growth and management, and impact assessment, comparing two different forest management strategies, BAU and INT. Specific targets were to:
  • Assess the forest bioenergy feedstock yields for each strategy;
  • Assess forest biodiversity indicators in the form of total habitat area of forest meeting species-specific age criteria, tailored for forest bird diversity, as well as forest edge and forest interior habitat.
The developed methodology is expected to enable localization, quantification and assessment of potential synergies and conflicts between sustainability goals related to climate change mitigation using forest bioenergy feedstock, and forest biodiversity, taking habitat quality, quantity and configuration into account. The results are expected to inform forest management planning and policy concerning multiple sustainability goals.

2. Materials and Methods
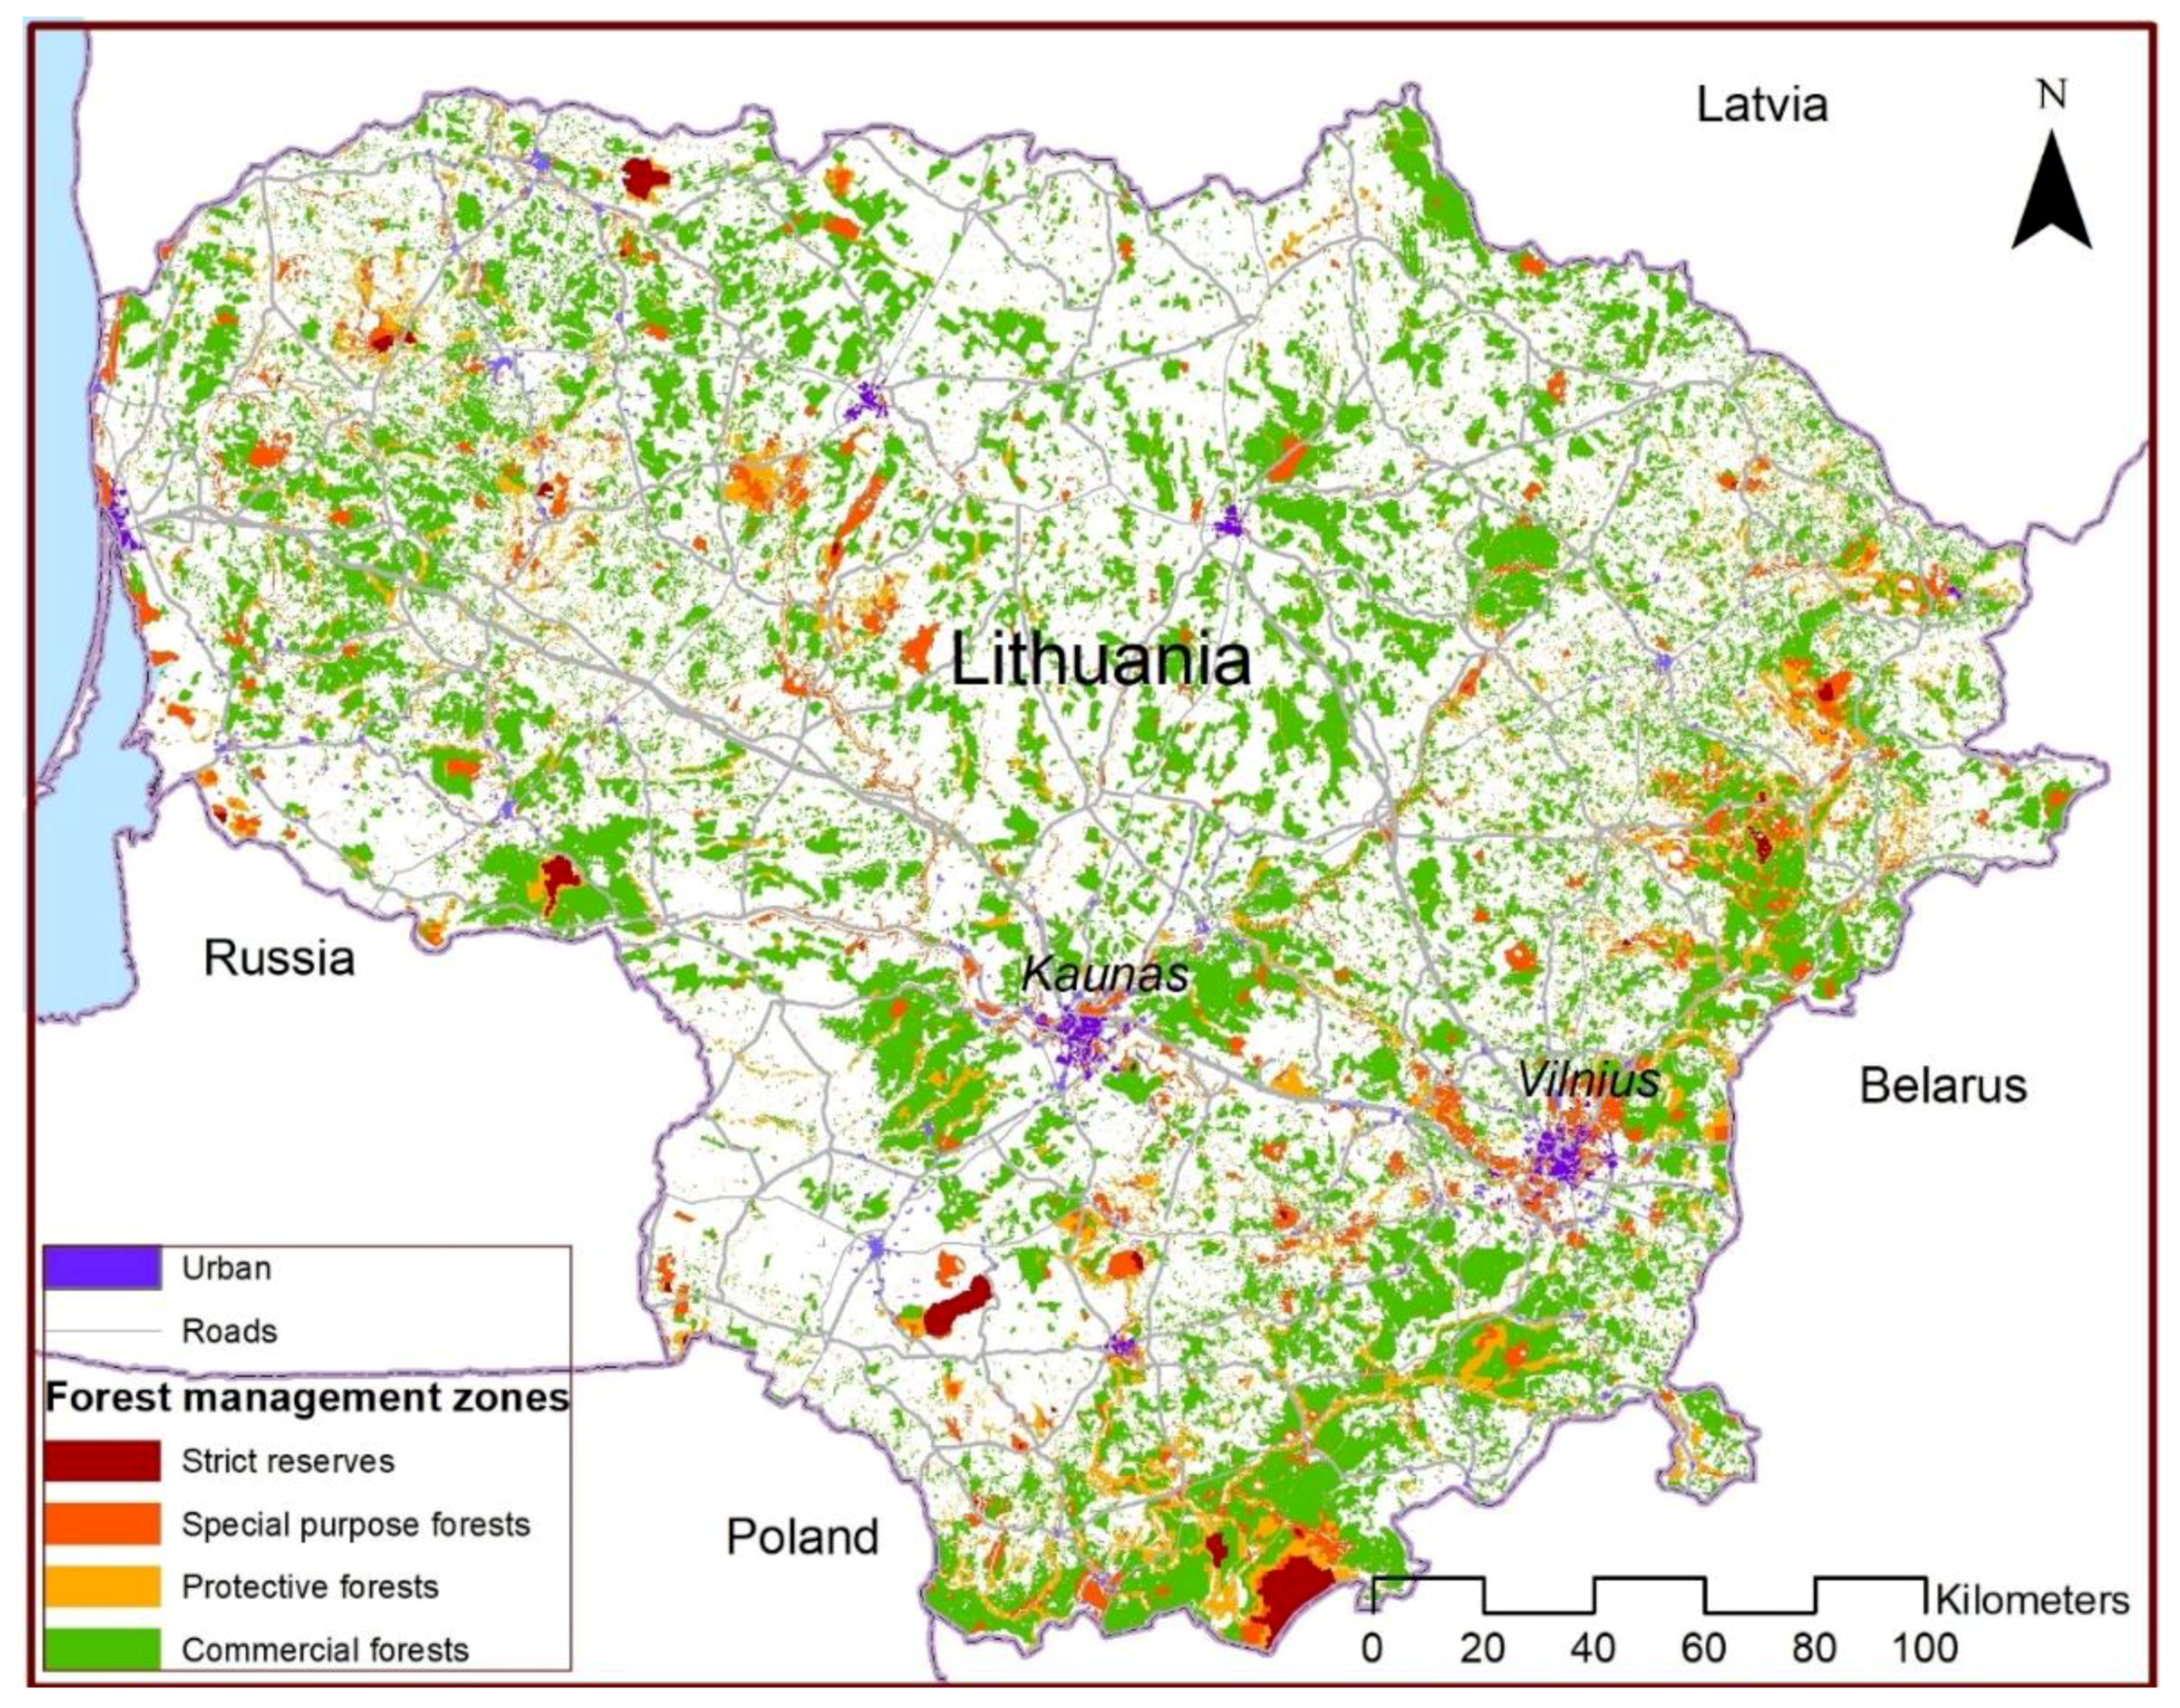
2.1. Study Area

The study comprised the country of Lithuania (Figure 1), situated in Central Europe by the Baltic Sea, with a total land area of 65,200 km2 and a population of approximately 3 million people. Around 33.7% of Lithuania is covered by forest [42], which can be categorized as hemi-boreal mixed forest in the transitional zone between boreal coniferous and nemoral broadleaved forest [43,44,45]. The dominating tree species are Scots pine (Pinus sylvestris, 34.5%), birch (Betula spp., 22.0%), and Norway spruce (Picea abies, 21.0%), where Norway spruce dominates in the west, Scots pine in the southeast, and deciduous tree species in north-central parts of the country [42]. By the year 2017, the average growing stock volume in the forest was 260 m3/ha and the average age was 54 years [42].
Of the forest, 50.3% is owned by the state, 40.6% by private forest owners, and the remaining 9.2% is reserved for restoration/compensation, with low-to-no active forest management [42]. The forest in Lithuania is managed according to a forest policy, implemented via regulations concerning the minimum allowable rotation ages and annual allowable cuts, applied within a land zoning system based on four forest management zones [46,47]. These group zones of strict reserves (1.2% of the forest area), without active forest management; special purpose forests (11.8%), targeting ecosystem protection and recreational use, with strong restrictions on forest management; protective forests (13.1%) aimed at protection of soil and water, with some management restrictions compared to commercial forests; and commercial forests (73.9%) prioritizing timber production [42] (Figure 1).
Forest bioenergy is very important in Lithuania; it accounts for 65.6% of the primary domestic energy resources, while 16.9% of the gross inland consumption [48]. Furthermore, the consumption has been increasing considerably in the energy sector. During 2000–2015, forest bioenergy feedstock extraction increased substantially, from 653.1 ktoe in 2000 to 1191.6 ktoe in 2015 [48]. According to the Lithuanian National Energy Strategy [49], high shares of forest bioenergy feedstock is expected in the energy mix of Lithuania, and forest bioenergy is very likely to continue to be one of the most important domestic renewable energy resources in the future [50].
At the same time, Lithuanian forest landscapes have been known to host high biodiversity conservation values compared to many other European countries [51,52,53,54]. In particular, older forests provide structures that are important for the overall forest biodiversity, such as coarse deadwood, tree species diversity, and the abundance of big trees [27,55,56,57,58]. In Lithuania, the forest has overall high variation in the composition of tree species and in the vegetation structure, due to a relatively low intensity of past forest management compared to, e.g., Nordic countries, and a considerable amount of potentially valuable forest from a biodiversity perspective can be found outside existing protected areas [2].
This is well reflected well when it comes to many specialized bird species, for which the region’s forests are important, with viable populations of many species that are extinct or declining in other parts of Europe [2]. For example, Lithuania’s forests cover <1% of Europe, but host 7% of the world population of black stork (Ciconia nigra), depending on forest interior habitat for nesting, and 10% of the world population of lesser spotted eagle (Clanga pomarina), depending on forest edge habitat for nesting, both tied to older forests [59]. Both these species are protected internationally and listed in the Annex I of the EU Birds Directive (2009/147/EC), and Annexes II of the Berne, Bonn and CITES Conventions.
The Action Plan on Conservation of Landscape and Biodiversity [60] for the period 2015–2020 set a strategic goal for Lithuania to halt biodiversity loss and degradation of ecosystems and their services, and where possible, to restore them. According to the Lithuanian Forestry Law [61], the forest must be managed, seeking to preserve biodiversity and provide conditions for its restoration. Forest management plans must take into account biodiversity features in the area when forest management measures are planned [62].

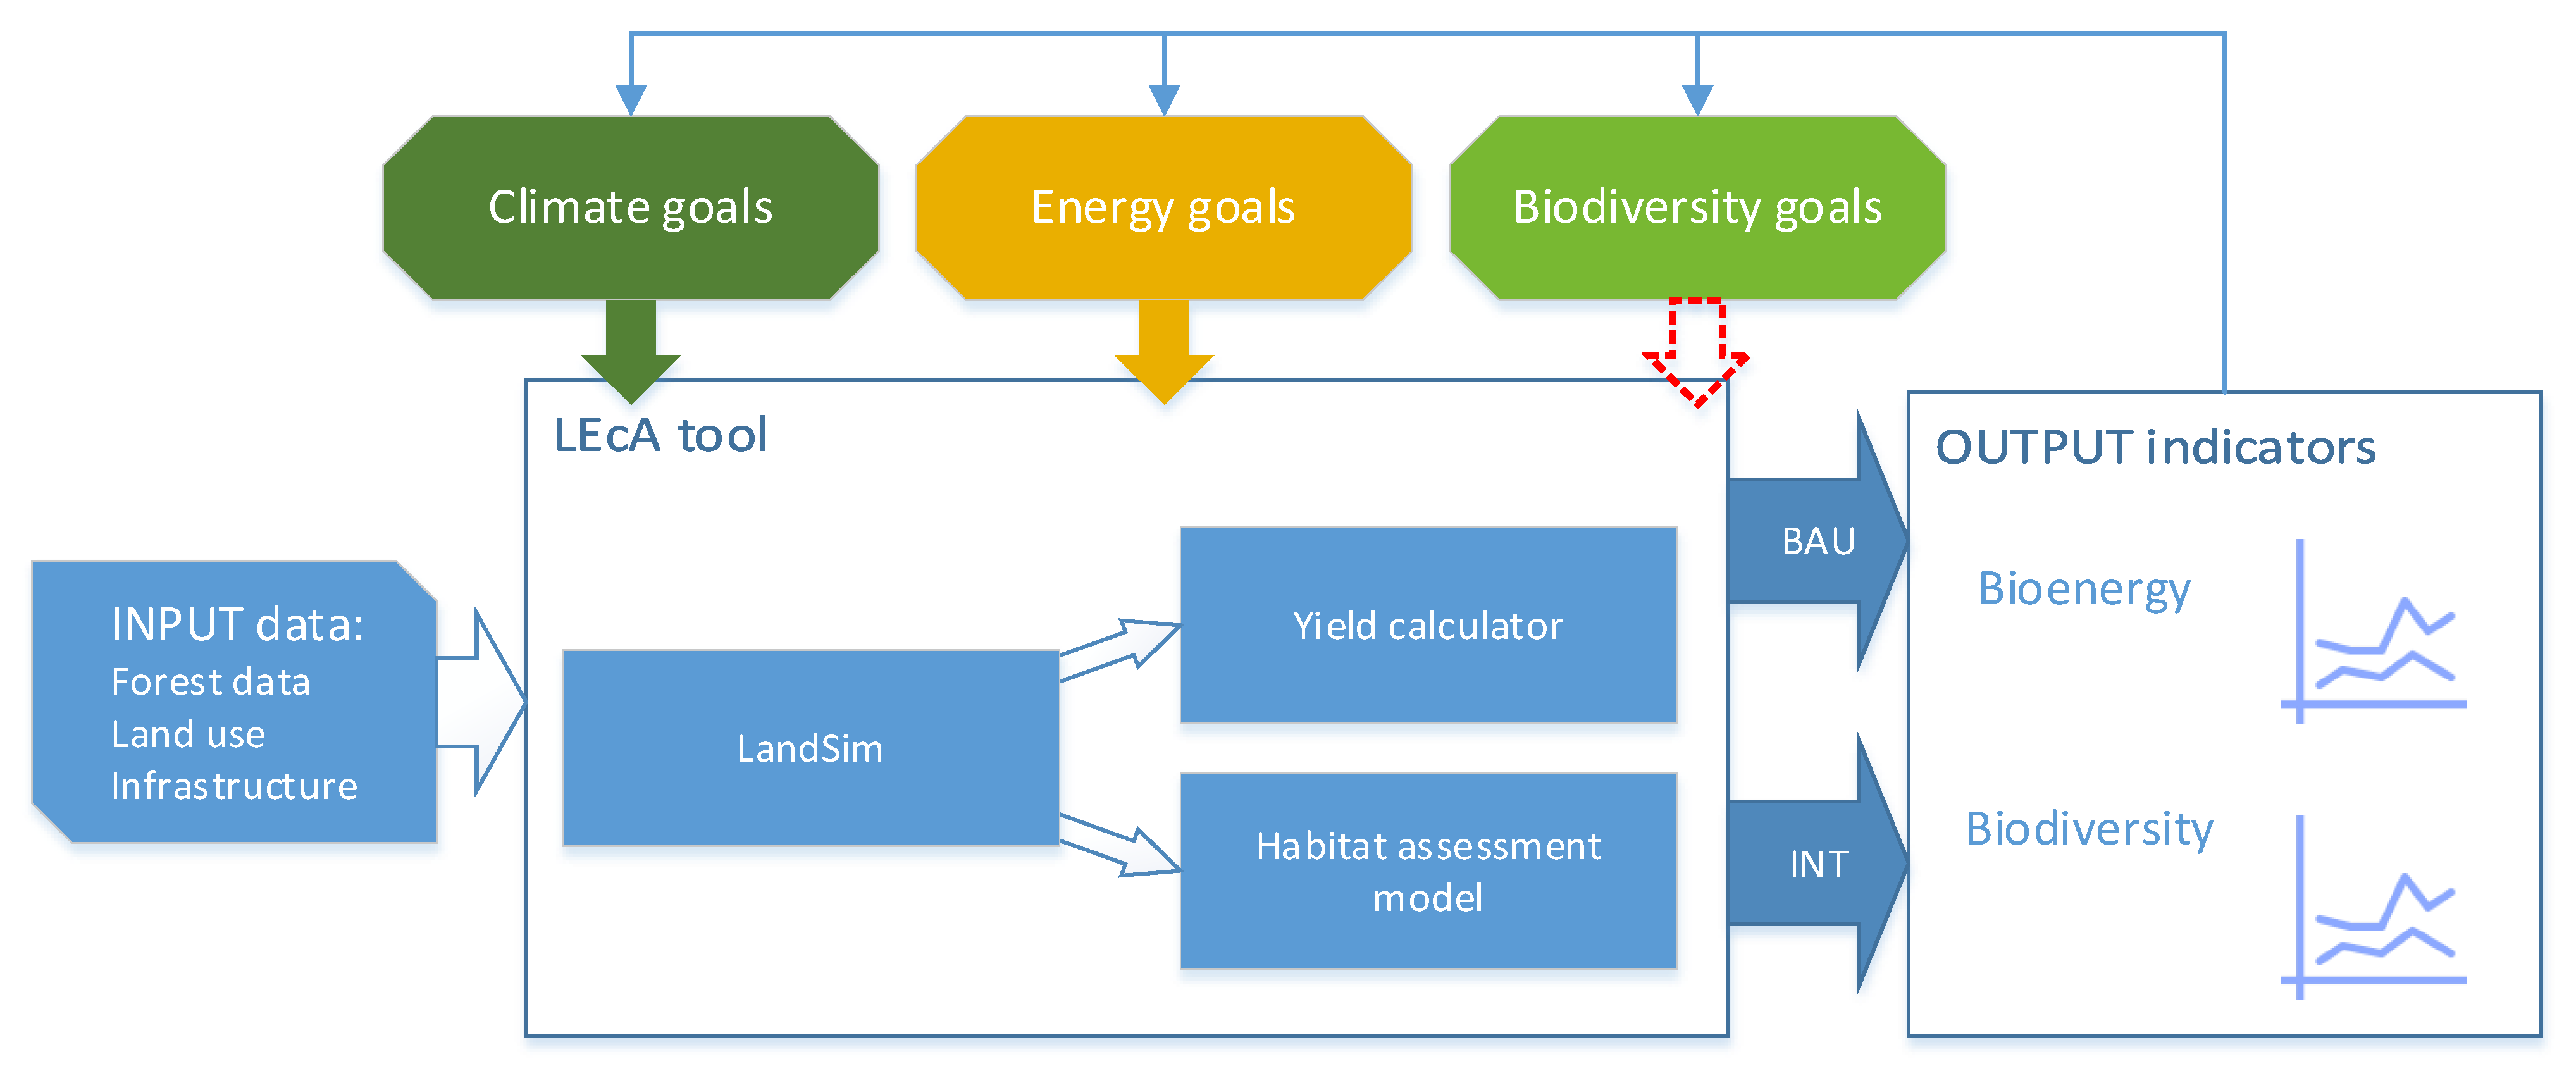
2.2. Overview of Data and Methodology

For the integrated sustainability assessment of forest management strategies, the LEcA tool was used [41], which encompasses linked modules embedded in a GIS framework. For this study, we used the modules: (i) the LandSim model for simulating forest growth and management, (ii) the yield estimator that aggregates the spatially explicit output from LandSim to estimate the yield of the total harvested stem volume and the related forest bioenergy feedstock, and iii) the habitat assessment model, used for deriving biodiversity-related indicators (Figure 2, Table 1). The LandSim model was built in MatLab [63], while the other LEcA modules were constructed in the ArcGIS ModelBuilder and Python [64]. The input data was the Lithuanian State forest cadastre [65] and land use data [66] (Table 1).
The landscape simulator LandSim [67], part of the LEcA tool, was used to simulate forest growth and management. It is a matrix-based Markov chain model, which represent change by transition of area units (here 25 × 25 m pixels) between fixed states of the forest. We specified management strategies and related forestry activities, which differentiated site productivity, tree species, age, and volume. For each pixel with forest cover, the state was described by six variables (see Table 1). The initial forest description of the reference year (2015) was derived from the Lithuanian State forest cadastre [65], from which polygons describing all forest compartments in Lithuania were resampled to 25 × 25 m raster pixels. These were assigned attributes corresponding to dynamic and static variables; the dynamic variables (mean age and standing volume) changed throughout the simulations, while the static variables (all other variables) remained the same over time.
For each pixel, changes in the class associations were simulated in five-year time steps for 100 years across the study area, from the reference year 2015 to 2115. In the simulations, transitions between classes of the dynamic variables for each pixel were projected by using transition probabilities based on data from the Lithuanian National Forest Inventory (NFI) [68] and tools available from Packalen et al. [69]. Two different forest management strategies were simulated using the LEcA tool, a business-as-usual (BAU) strategy and a more intensive (INT) strategy, applying the forestry activities clearcutting, thinning and regeneration in different ways. In Strategy BAU, activity probabilities were estimated from the NFI data for Lithuania for the period 1998–2015, using logistic regression. In contrast, the Strategy INT was explored, driven by climate and energy goals, and therefore mirroring a more intensive utilization of forest products in general and more specifically of forest bioenergy feedstock [50]. This was achieved by increasing the harvest probabilities, which lowered the mean final harvest age for all forest categories, which means shorter rotation times. The output of LandSim were used in the other LEcA tool modules; the yield estimator and the habitat assessment module.

2.2.1. Forest Bioenergy Feedstock

In order to estimate the forest bioenergy feedstock yield, the output of LandSim was used as input to the yield estimator of the LEcA tool (Figure 2). Thus, the harvested stem volume was summarized for each time step and from these records, the forest bioenergy feedstock yield was derived. The latter embraced the categories firewood, industrial waste (sawdust, wood chips and pulp milling by-products), and logging residues (tops, branches and stumps), while recycled wood was not taken into account. In accordance with the forest legislation of Lithuania, environmental restrictions to extracting logging residues were applied to avoid soil damage [70]. The additional volumes of logging residues (branches and tops), as derived from the harvested stem volumes, would be 0–15% for branches and tops, and 0–21% for stumps, see Table A1 (Appendix A).
When estimating the supply of forest bioenergy feedstock from harvested stem volume, assumptions need to be made about the use of the stems, such as the proportion used for firewood, which corresponds to the use of saw-logs that generate industrial waste. Based on statistics from the from the Lithuanian State Forest Service [71,72], we made two assumptions in order to cover the range of possible outcomes. Thus, Assumption A was that the proportion of firewood was 20% while that of industrial waste (solid wood equivalent) was 33% of the harvested stemwood. Assumption B was that the proportion of firewood was 46% while that of industrial waste was 20% of the harvested stemwood [50].

2.2.2. Forest Biodiversity Components—Forest Bird Habitat

In order to integrate biodiversity into the sustainability assessment, indicators in the form of prioritized forest biodiversity components were selected, related to habitat quality, amount and configuration. First, for comparison, a simple age criterion of 70 years age was applied across all tree species in order to be able to follow the forest dynamics during the simulation period. Secondly, more specific forest habitat criteria were applied, targeting older forest, following age criteria per tree species that were considered to be representative of forest biodiversity requirements in Lithuania, in particular related to bird species [73,74,75,76,77], see Table A2 (Appendix A). Since pine forest in general is lumped and located in specific regions of Lithuania, mainly in the south-east, it was not part of this targeted habitat. In the next step, forest edges of 300 m towards agricultural land was found, representing forest edge habitat. Likewise, forests further away than 300 m from agricultural land represented interior forest habitat. Furthermore, a minimum patch size of 2 hectares was applied. These indicators were modelled using the habitat assessment module of the LEcA tool (Figure 2, Table 1) for each forest management strategy and time step.

3. Results

3.1. Forest Bioenergy Feedstock

According to the LEcA simulations of Strategy BAU, the total harvested stem volume would increase from 8.0 M.m3 in 2015, until 2055 when it will reach 13.8 MMm3, and then it decreases slightly, but keeps rather stable above 12 Mm3 (Figure 3). On average, over the whole simulated period of 100 years, the total harvest volume is 12.48 Mm3 per year. With Strategy INT, the total harvested stem volume would quickly reach high levels close to 14 Mm3 per year, and higher than that in BAU until year 2045, but then the production would become lower than in BAU up to 2110 when it would go slightly up again. On average, over the whole simulated period, the total harvested stem volume in INT would be 12.63 Mm3 per year, which is only 1.2% higher than that in BAU.
From the total harvested stem volumes, forest bioenergy feedstock were estimated, including firewood, industrial waste and harvest residues. For both management strategies, the supply of biomass for bioenergy followed the same pattern as those for the total harvest projections (Figure 3). In Strategy BAU with Assumption A, the potential supply of bioenergy feedstock would increase from 6.1 Mm3 in 2015 to 8.8 Mm3 in 2050 and then slowly decrease, ending at about 8.1 Mm3 in 2115. The average volume over the whole simulated period is 8.2 Mm3 per year. With Assumption B, the volume increases from 7.2 Mm3 in 2015 to 11.3 Mm3 in 2050 and then decrease until around 10.0 Mm3 by the end of the period. The average volume over the period is 10.2 Mm3. With both assumptions, the volumes with Strategy BAU would peak in 2050.
In Strategy INT with Assumption A, the potential supply of bioenergy feedstock would increase rapidly from 6.1 Mm3 in 2015 to 9.3 Mm3 in 2020 and then after 2040 steadily decrease down to 7.3 Mm3 in 2100. After that, it increases again up to 8.9 Mm3 by 2115. The average volume over the simulation period is 8.3 Mm3. With Assumption B, the volume increases abruptly from 7.2 Mm3 in 2015 to 11.4 Mm3 in 2020 and after 2040 will decrease until 9.1 Mm3 in 2100. After that, it increases again up to 11.0 Mm3 by 2115. The average volume over the period is 10.3 Mm3. With both assumptions, the volumes with Strategy INT would peak in 2040. The pattern is very similar to that of total harvest volume, in that the differences between BAU and INT average bioenergy feedstock volumes are only around 1.2%, with both assumptions. Additionally, for bioenergy yields, the initial strong surplus with INT drops and is by 2045 exchanged with a long period of lower yields than with BAU, until an estimated increase at the end of the period so it exceeds BAU yields again as late as 2105.

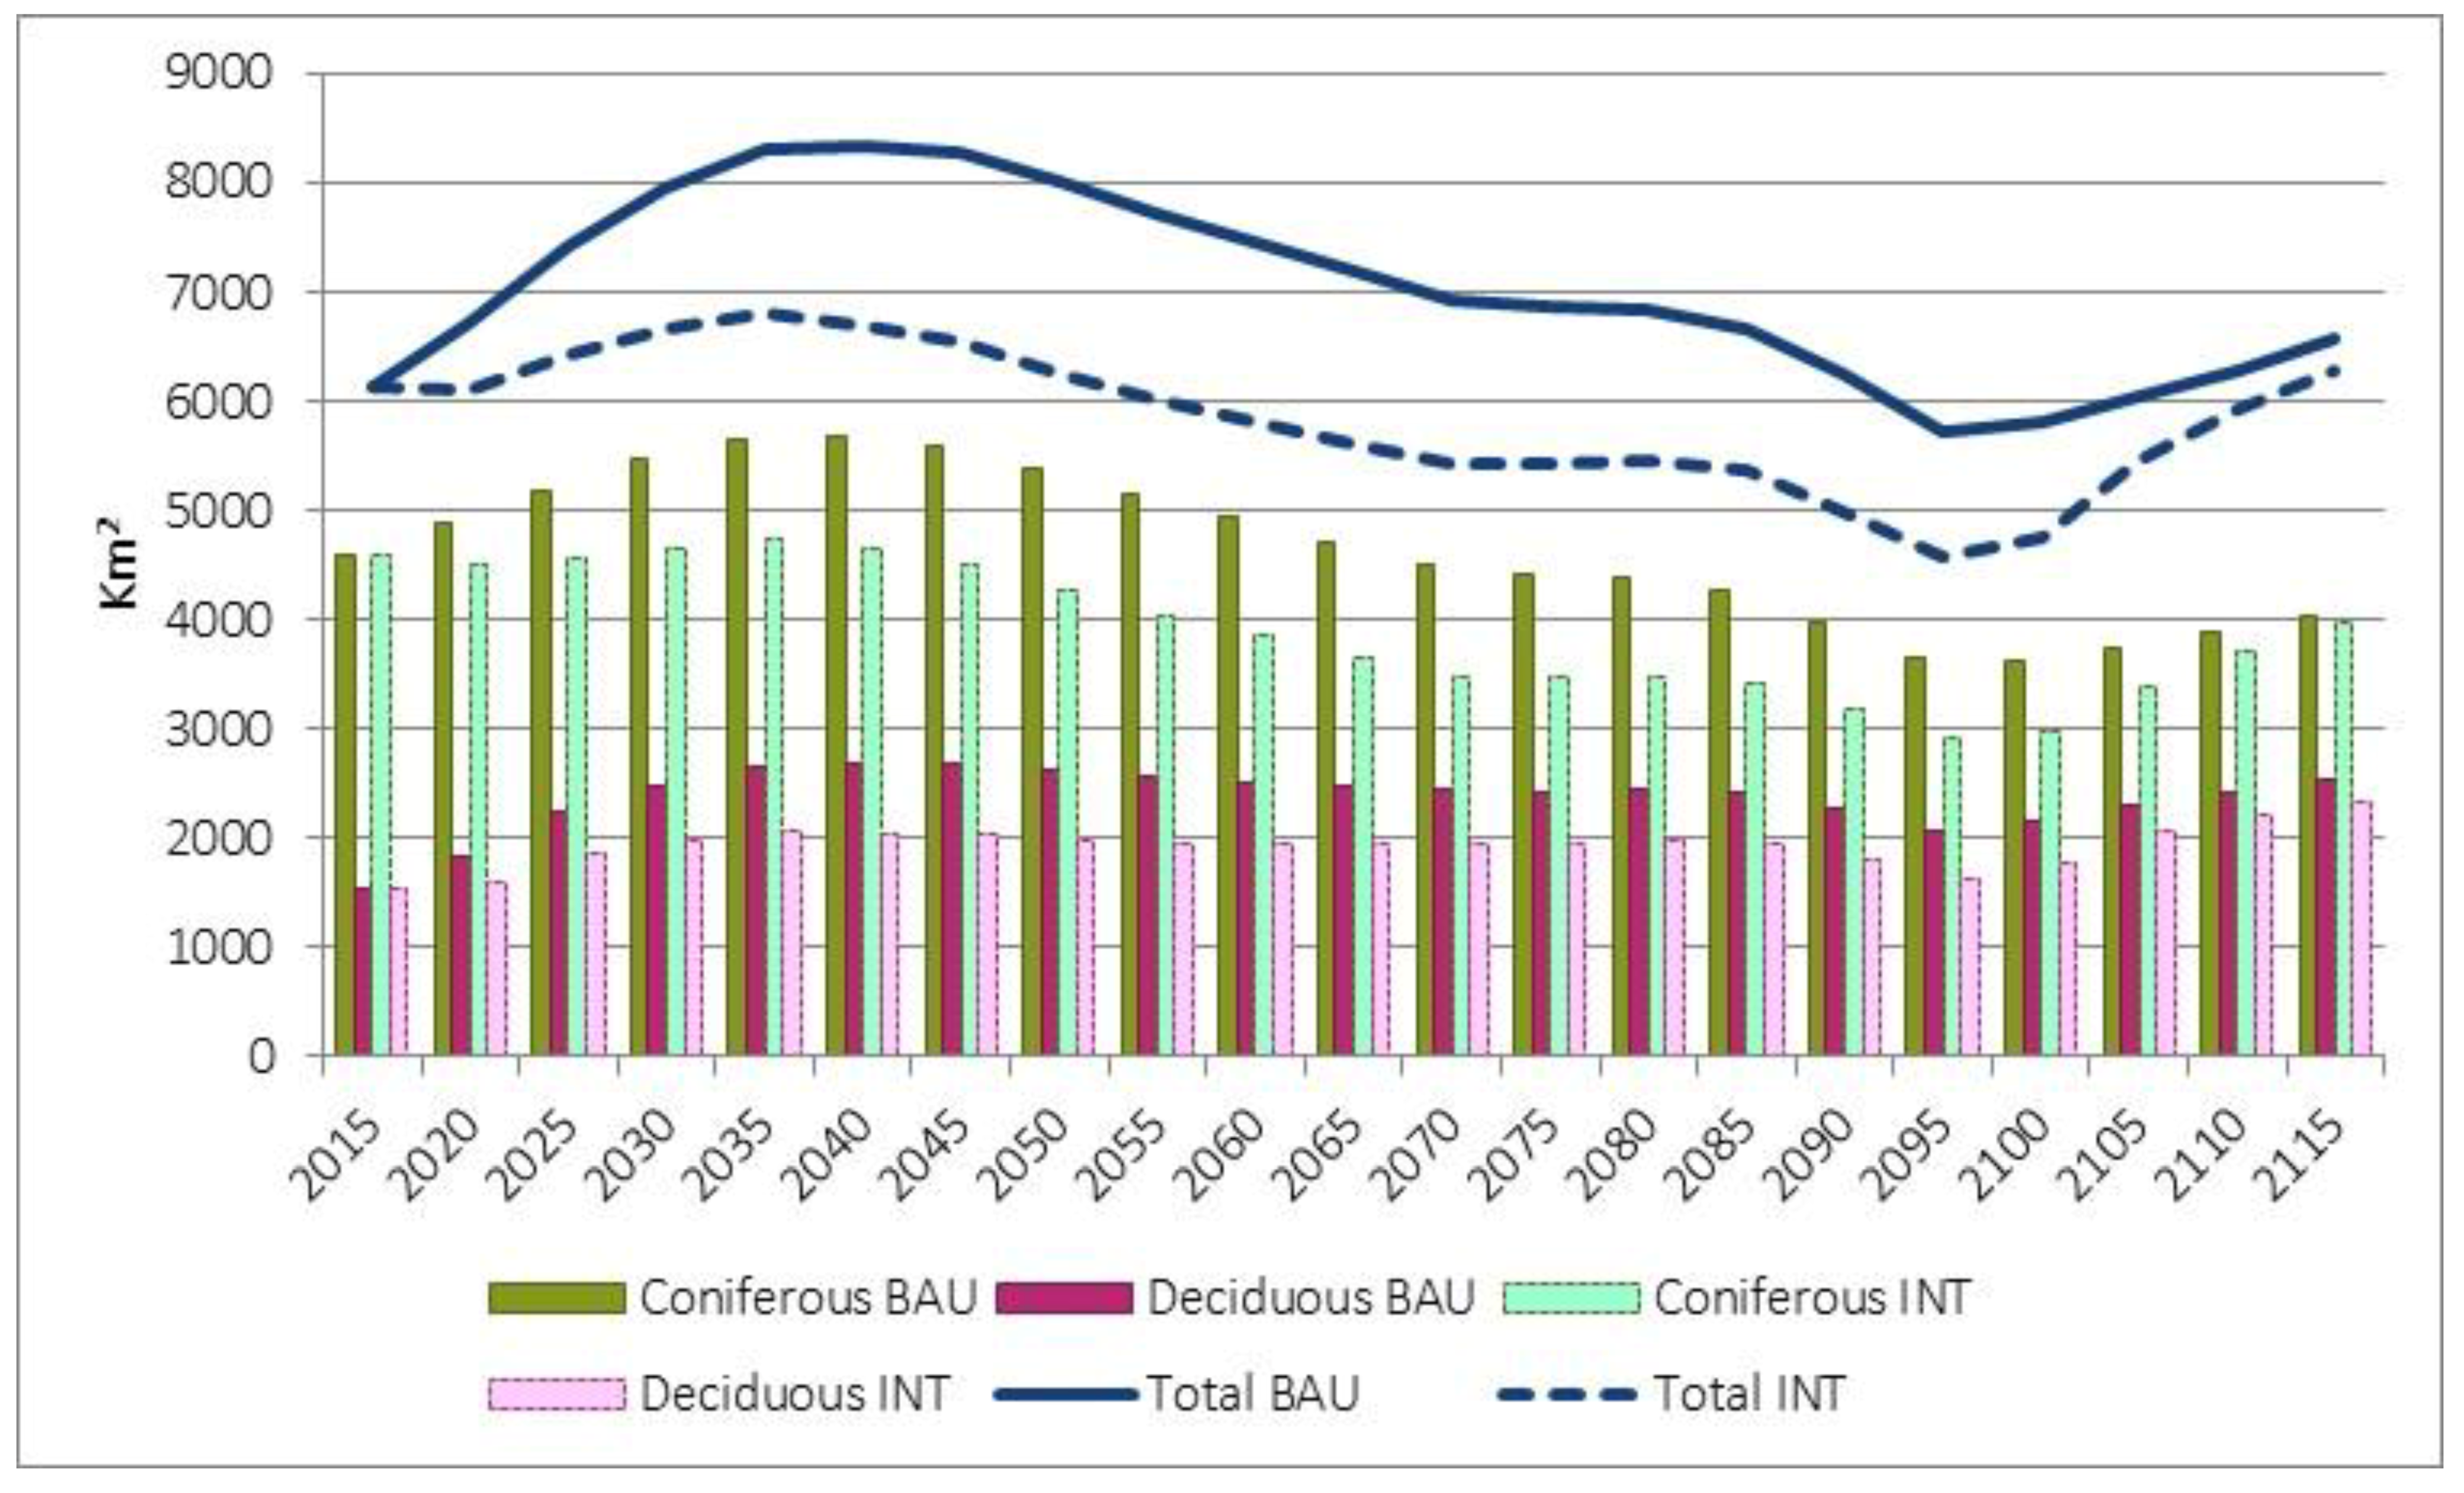
3.2. Forest Older Than 70 Years

The total area of forests older than 70 years, without any species-specific thresholds, was estimated for the simulated time steps. According to the simulations, the total area will increase during the first part of the period, while declining later in Figure 4. As can be seen, with Strategy BAU, the increase is very pronounced during a long period of time, while with Strategy INT, the increase is small and a long time-span with lower numbers than the reference year will occur. This pattern is determined by the distribution of age classes by the reference year 2015 and the age of clear-cutting, which is different for different tree species.
Comparing coniferous and deciduous forest older than 70 years, the total area of coniferous forest was about three times as large as the total area of deciduous forest of this age, by the reference year 2015. With Strategy BAU, the coniferous forest older than 70 years will increase until 2035, then steadily decline to the lowest level by 2100, and then increase somewhat again. However, from year 2070 and onwards the area is expected to be well below the area of the reference year. With Strategy INT, the decline is more pronounced and the peak year is 2035 before the decline starts until the area is very low by 2095, and then it will increase again. The time period of 2045 and onwards the area of coniferous forest >70 years old is expected to be much below the area of the reference year. By contrast, the deciduous forest older than 70 years is expected to increase with both strategies. During the whole simulated period, the area of deciduous forests >70 years will be much larger than in the reference year, about 40% larger in BAU and 20% larger in INT.

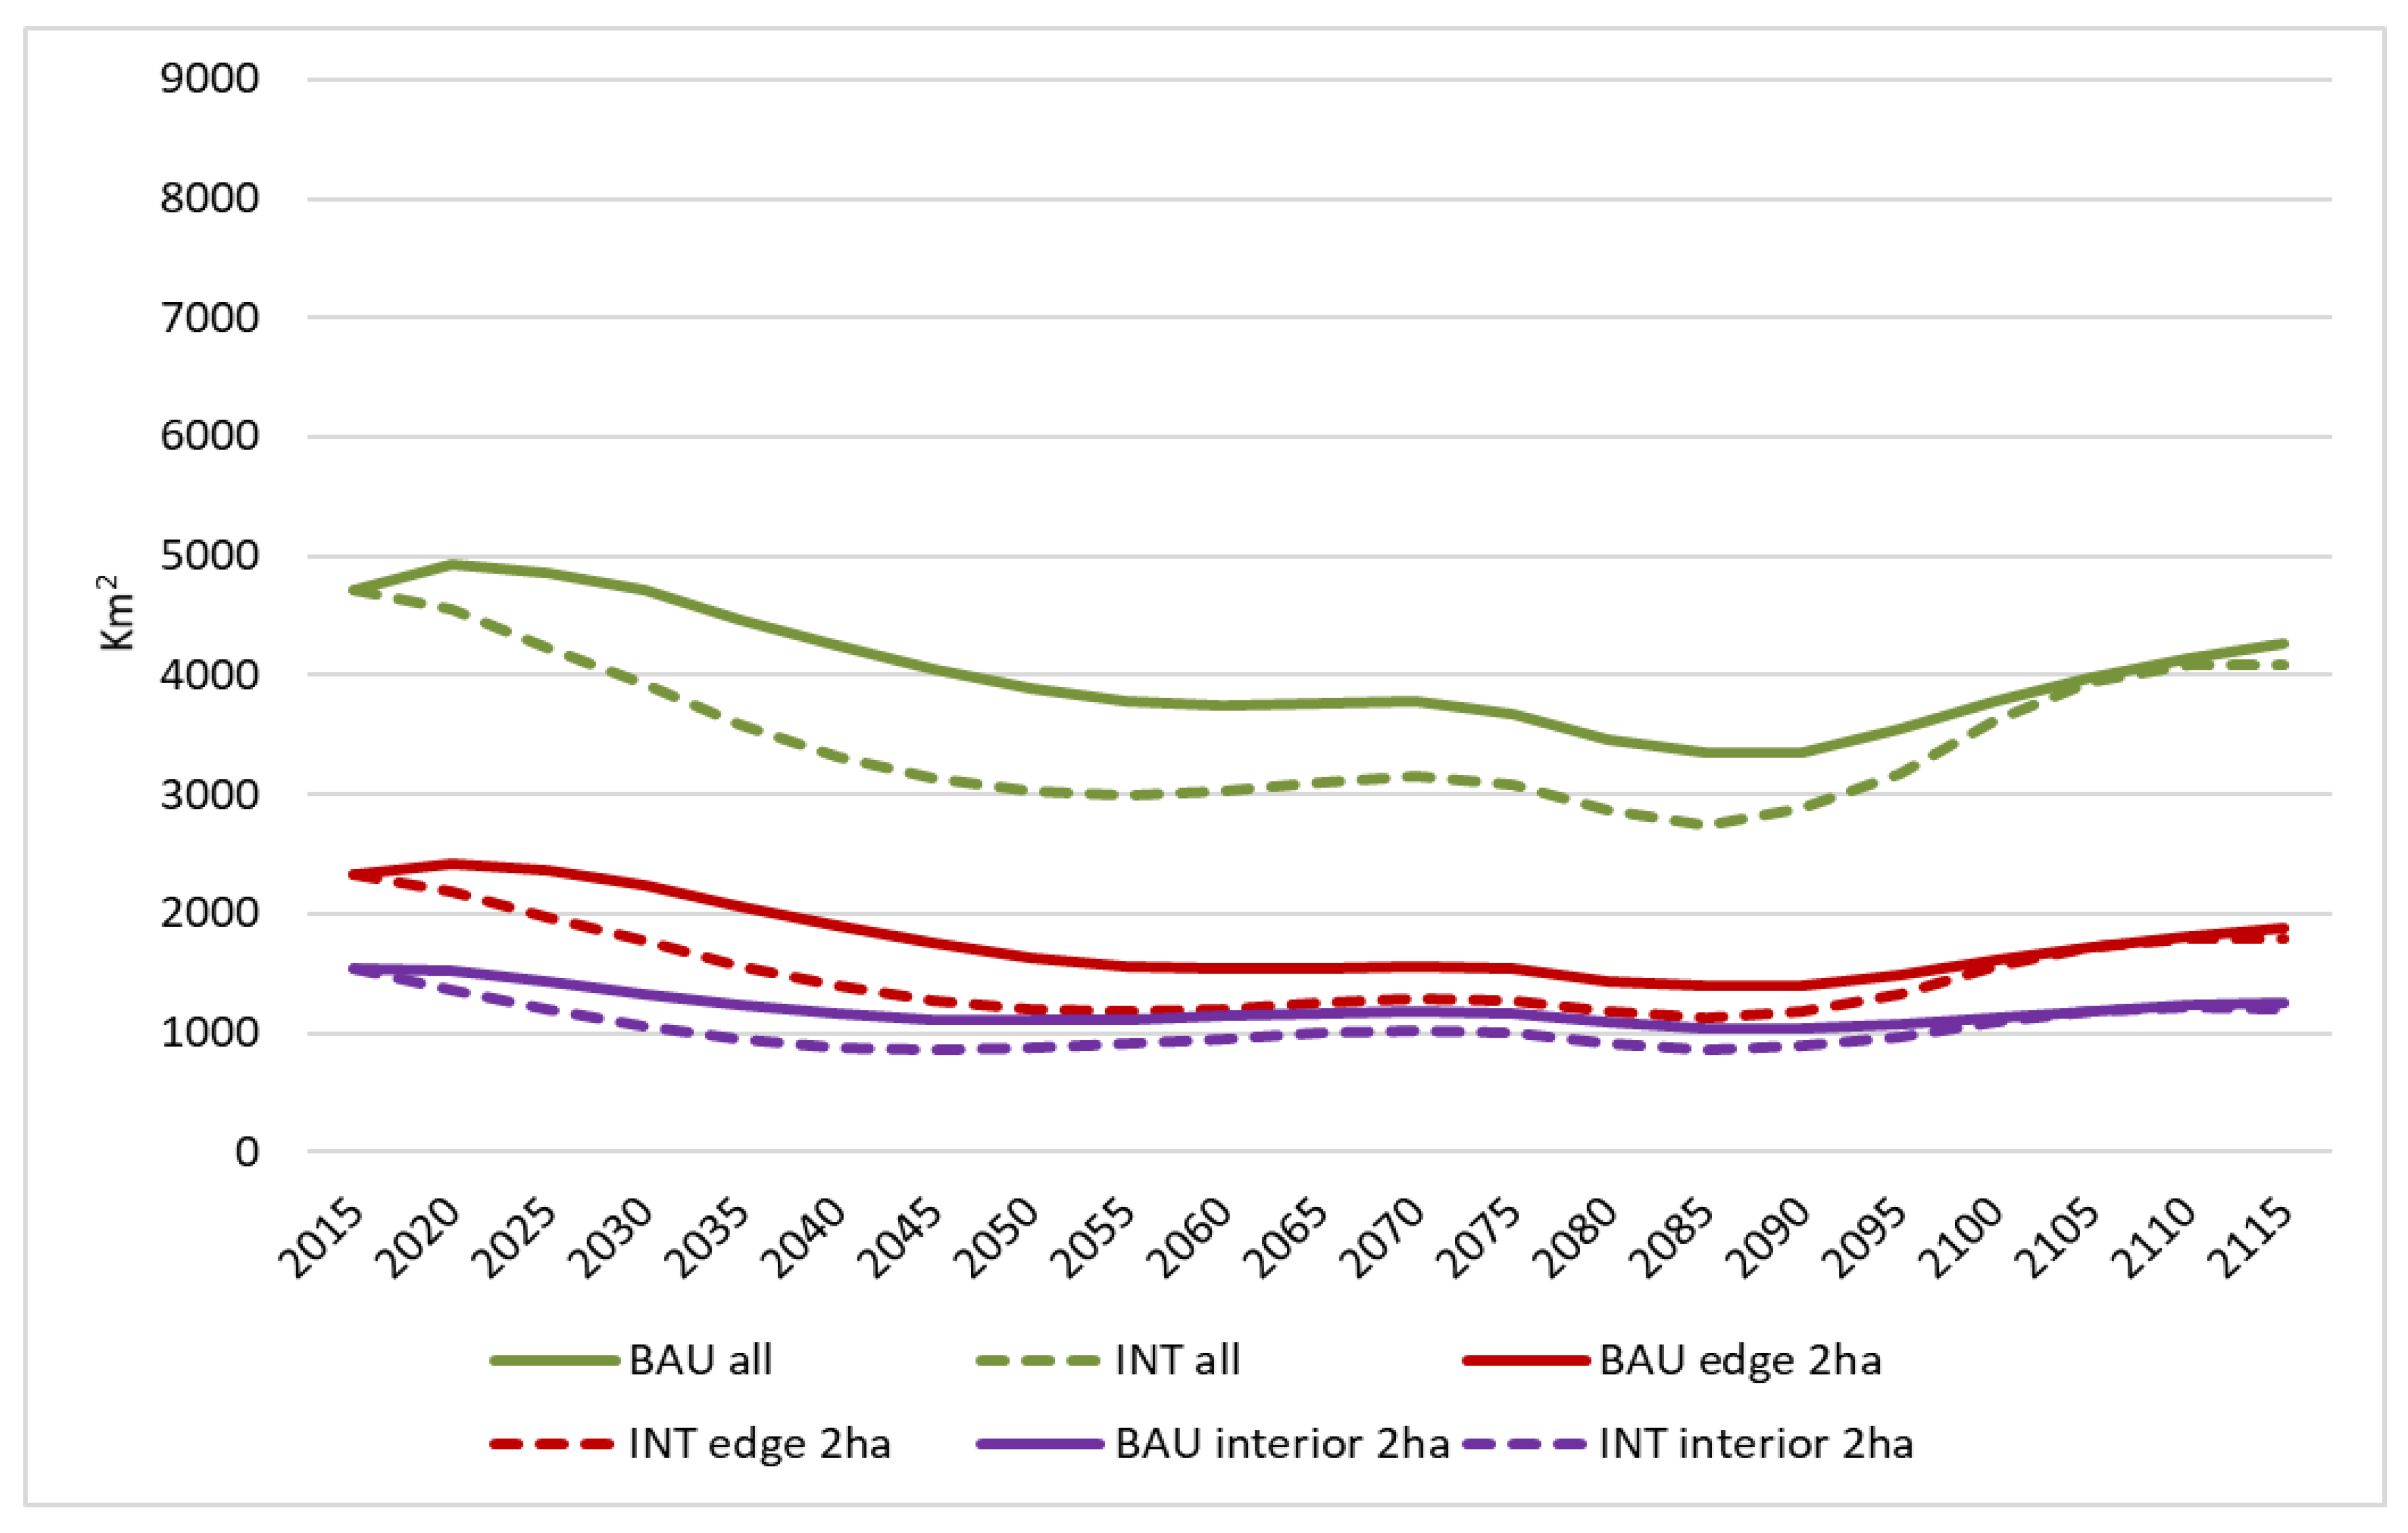
3.3. Forest Biodiversity Indicators—Forest Bird Habitat

According to the LEcA simulations, older forests that met habitat quality criteria concerning age per tree species (Table A2, Appendix A) would comprise larger areas with Strategy BAU than with Strategy INT (Figure 5). As illustrated, when adding habitat configuration, including patch size and either edge or interior habitat, the total habitat area was considerably smaller. In addition, the interior forest habitat comprised an overall smaller area than edge habitat, which would be a sign of a relatively high fragmentation in the study area. For older forests in total, applying species-specific age criteria, 4723 km2 was available in 2015. With Strategy BAU, it first increases and then decreases down to around 75% of the reference year, with the lowest area in 2085. From 2030, the area is below that of the reference year. With Strategy INT, it decreases continuously until 2085 when it is only around 60% of the area of the reference year. At the end of the period, it increases again, but during the whole time, it is much below the area in the reference year. On average, the total forest area that met species-specific age criteria is 15% higher with BAU than with INT.
For forest edge habitat with Strategy BAU, with a minimum patch size of 2 ha, available older forest is 2326 km2 in 2015 (Figure 5). By 2020, the area increases, but then it starts decreasing to around 65% of the reference year from 2055, with the lowest value in 2085, and then it increases again. With Strategy INT, the available habitat area starts from the same level in 2015, then decreases to around 50% of the reference year from 2045, with the lowest value by 2085. At the end of the period, it will increase slightly again. On average, the available edge habitat with BAU is 18% higher than that with INT. For forest interior habitat with Strategy BAU, with a minimum patch size of 2 ha, available older forest is 1533 km2 in 2015. Then, it decreases to around 70% of the reference year, with the smallest area by 2090. In Strategy INT, the available habitat area starts from the same level in 2015, then decreases to around 60% of the reference year during 60 years, with the lowest area in 2045 and in 2085. On average, the available interior habitat with BAU is 14% higher than that with INT.
With Strategy BAU over the whole simulation period, the older forest with species-specific age criteria was 18% of the total forest area in Lithuania, while forest edge habitat was 11% and forest interior habitat was 7% of the total forest area. With Strategy INT over the whole simulation period, the older forest with species-specific age criteria was 16% of the total forest area in Lithuania, while forest edge habitat was 10% and forest interior habitat was 6% of the total forest area. For the reference year 2015, the figures are 22%, 13% and 8%, respectively.

3.4. Trade-Offs

Trade-offs between biomass extraction and biodiversity components are illustrated in Figure 6. With Strategy BAU, the harvested stem volumes would increase substantially to up to 70% by 2050, while decreasing to a level around 50% higher than that of the reference year 2015. With Strategy INT, the increase will be strong already in the beginning of the period and will go up to 75% of the reference year by 2040, but then decline to 40% by 2100, which is still above the reference year but clearly lower than with BAU. Then, the harvested volumes will increase again by the end of the period. Similar patterns can be observed for bioenergy feedstock.
For Assumption A with Strategy BAU (Figure 6), biomass for bioenergy will increase up to 48.5% in 2050, compared to 2015, then go down until 2110, which is still 28.1% higher than the base year 2015. In average over the whole simulated time period, the yearly harvestable volume of bioenergy feedstock would be 34.2% higher than in the reference year. In assumption B in scenario BAU, biomass for bioenergy will increase up to 56.9% in 2050, compared to 2015, then go down until 2100, which is still 25.6% higher than the base year 2015. On average, the yearly harvestable volume would be 53.1% higher than in the reference year.
For Assumption A with Strategy INT (Figure 6), the available volume of biomass for bioenergy will increase strongly in the beginning of the period and go up to 51.1% in 2040, as compared to 2015, then go down until 2100, which it is still 19.6% higher than in the reference year. On average, over the whole simulated time period, the yearly harvestable volume of bioenergy feedstock would be 35.9% higher than in the reference year. For Assumption B with Strategy INT, the available volume of biomass for bioenergy will increase up to 59.6% in 2040, as compared to 2015, then go down until 2100 when it is still 26.6% higher than in the reference year. On average, the yearly harvestable volume would be 57.6% higher than in the reference year.
With Strategy BAU, the volume of forests older than 70 years (considering all tree species) will increase as well up to 36% higher in 2035 compared to 2015. Then, it is projected to decrease so that, after 2090, it will be lower than in 2015 and by 2095 –6% compared to 2015, while at the end it will increase again. With Strategy INT, the volume of forests older than 70 years will increase up to 11% higher in 2035 compared to 2015. Then, it is projected to decrease so that, after 2050, it will be lower than in 2015 and by 2095 –25% compared to 2015, while at the end it will increase again.
Looking at forest habitat with species-specific age criteria, and Strategy BAU, there will be a decline of the total habitat amount from 2030 down to −20% by 2055 and to −29% by 2085, with an average of −15% compared to the reference year 2015. By the end of the simulated period, it will increase again, but below the levels of 2015. Forest edge and interior habitat, taking patch size into account, will follow a similar pattern, but with a decline down to −40% (average −25%) for edge habitat and −33% (average −23%) for interior habitat. With Strategy INT, the decline will start directly and go down to −42% for total habitat amount by 2085, with an average of −27% compared to 2015. By the end of the simulated period, it will increase again, but not to the levels of 2015. Forest edge and interior habitat will again follow a similar pattern, but with a decline down to −51% for edge habitat (average −37%) and down to −44% for interior habitat (average −34%) compared to 2015.

4. Discussion

Intensified forestry could increase forest biomass yields immediately, but not in a longer time perspective, and at the same time be detrimental to forest biodiversity components. With Strategy BAU, we projected a substantial increase in the production of forest biomass with a peak around 2050, with high levels also in the following decades. This pattern is due to the initial state of the forest, before the simulation started, and the applied management regime. The use of intensified forestry (Strategy INT) in order to meet increasing demands for biomass as a RES and other bio-based materials will increase the yields in the short-term. However, in a longer time perspective, in the decades after around 2050, the yearly harvested volumes are expected to be lower than with Strategy BAU (Figure 3). The forest bioenergy feedstock that could be harvested will meet and exceed the projected energy demands and climate-related goals for RES [49] during the first decades. However, with high goals for RES after 2040 and onwards, together with the projected decline in the supply, a deficit is projected with both strategies, but more pronounced with Strategy INT [50].
From a biodiversity perspective, forest edge habitat can have properties that will not be found in the rest of the forest or in the surroundings (e.g., Reference [37]). In our study, among examples of species favored by forest edge habitat are different raptors, such as the lesser spotted eagle (Clanga pomarina), which breeds in edge habitat with older forests adjacent to agricultural land used as a key feeding habitat [77,78]. However, forest edge habitat can be exposed to higher disturbances than interior habitat, when it comes to wind, predation, human disturbances, etc., and for such reasons, other groups of species prefer forest interior habitat (e.g., Reference [38]. Among the examples of species preferring forest interior habitat is black stork (Ciconia nigra), for which strong population declines are reported in Lithuania and overall in the Baltic region during the past decades [79,80]. Other examples of interior-forest species are capercaillie (Tetrao urogallus) and red-breasted flycatcher (Ficedula parva) [54].
Older forests constitute an important habitat from a biodiversity perspective, and therefore, the overall amount of this habitat is important, but it is also important to take habitat configuration into account. Preference for older forests, together with a preference for either edge or interior habitat, as well as for stands of sufficient size, make species highly sensitive to forest management. Strong declines are expected for the three biodiversity indicators with species-specific age criteria, especially with Strategy INT, but also with Strategy BAU (Figure 6). The low levels will continue for a long period of time, the lowest around year 2090. Even if an improvement is expected after that, the populations of species depending on the targeted habitat may not recover and local or regional extinction risks can be expected to increase (e.g., Reference [34]). The long-term population persistence in the landscapes may be at risk, especially for species with low reproduction rate and strong philopatry, for example the Lesser Spotted Eagle [81]. Moreover, most of the tree nesting raptors in Lithuania prefers older forests as breeding territory [59] and nest site level [75,77]. Therefore, such projected bottle-necks in habitat availability should be part of policy and planning considerations.
The difference between total habitat amount, applying species-specific age criteria, and edge or interior habitat, can be seen as a measure of habitat fragmentation. Both edge and interior habitat declines more than the total habitat amount, showing the fragmentation effects on top of the decline in the total habitat amount, which is substantial, especially with Strategy INT. In order to estimate the risks for populations with different forest management strategies, it is thus necessary to take the habitat configuration into account, since only part of the total habitat amount constitutes the available habitat for many species and their populations may be at high risk due to the combination of habitat loss and fragmentation. Thus, even if the total habitat amount is a prerequisite for species’ persistence in landscapes, our findings show that habitat configuration potentially play an important role in these forest landscapes, since it may lead to an elevated threat to populations of sensitive species (see e.g., References [33,34,35,36,38].
With both forest management strategies, the biomass yields increase well above the yields of the reference year, while the biodiversity indicators, to different degrees, show the opposite, with lower levels than for the reference year. Furthermore, Strategy INT results in small-to-no benefits in the long run, concerning potential biomass harvesting, while substantially affecting the biodiversity indicators negatively. In line with this, conflicts between commercial forestry activities and the management of land for biodiversity protection has been identified as a challenge in Lithuania [82]. The high current logging levels in the region has been seen as a major threat to forest biodiversity values, and needs have been expressed for expanding protected forest areas, insightful management of these, and for developing sustainable forest management in commercial forests [2,17,83].
However, compared to a recent study of selected landscapes across several European countries, including Lithuania, their overall conclusions were different, since their results showed almost no reduction in outcomes for biodiversity indicators with an increase in forest biomass harvest [30]. For a selected landscape in Lithuania, they also showed a significant increase in forest biomass production for the studied time period, but when it comes to biodiversity indicators, their study came to a different conclusion based on compositional and structural biodiversity indicators, aggregated across the landscape. Another study [24] reviewed case studies of European temperate forests using aggregated biodiversity indicators of compositional and structural diversity. They also came to the conclusion that biodiversity only changed moderately from unmanaged to managed forests. Explanations for the difference in overall conclusions between these studies and our study may lie in, firstly, differences in the scenarios, since their studies seem to have applied more moderate forest management. Secondly, differences would be due to the difference in biodiversity indicators, where we used more simplified habitat quality indicators (species-specific age criteria) that were both summarized as total habitat area as well as taking habitat configuration into account.
The LEcA tool is spatially explicit, which allows for a landscape pattern induced by forest management strategies to be evaluated. The spatial specificity enables the adjacency between pixels or stands, as well as to other landscape features to be taken into account and used in the assessment. According to Nordström et al., few decision-support tools can handle such spatial relationships, and aggregation of information across stands and landscapes implies a loss of this type of information. For biodiversity indicators, it is crucial that decision support tools include spatial components on landscape scale, as pointed out by in e.g., References [84,85]. In this way, representation of habitat quality can be improved by adding other spatial data such as wetness, soils, etc., and habitat configuration can be assessed. Other benefits of keeping the spatial specificity is the ability to include transportation costs for harvesting, and ownership categories, which are factors that may affect the probability of harvesting both industrial wood and forest residues for bioenergy purposes.
For biomass production, aspects that the LEcA tool did not include are the effects of climate change on forest dynamics, as well as changes to the probability of climate-related extreme events and disturbances such as wildfires, storms and droughts, which are issues that would need attention in future studies [86,87]. It would also be interesting to add more details concerning habitat quality indicators, and to investigate a variety of habitat requirements (quality, quantity and configuration) to address a wider set of biodiversity components related to species traits. In this way, a wider range of complexities and uncertainties could be assessed, which are involved in the projection of the future development of the forest and related sustainability issues.
In the context of the integrated sustainability assessment that is often associated with energy systems models, these seldom take landscape and biodiversity aspects into account [20], and often run up to 2050 or around that, while evaluating scenarios with more or less high ambitions concerning RES (e.g., References [88,89,90]). However, when assessing forest bioenergy feedstock as an RES in this context, it is important to use a longer time frame, such as 100 years or more, to evaluate the strong effects of forest management strategies, despite the pronounced inertia of forest systems. In our study, the negative impacts of Strategy INT not only on biodiversity components, but from a biomass yield perspective, would not have been visible without the long-time perspective. In addition, the use of clearly different forest management strategies, motivated by climate and energy policy, is useful for exploring the limitations of the system for a wider audience, outside forestry expertise.

5. Conclusions

Intensified forestry, as expressed in our study and motivated by climate and energy policy, may not necessarily be an effective climate mitigation measure in the long run and may have negative impacts on biodiversity conservation, targeting forest birds. With both forest management strategies, the simulations indicated that biomass yields will increase well above the yields of the reference year, while the biodiversity indicators to different degrees show the opposite, with lower levels than for the reference year. Furthermore, Strategy INT resulted in small-to-no benefits in the end concerning potential biomass harvesting, while substantially affecting the biodiversity indicators negatively.
From a biodiversity perspective, forest bird species with a preference for older forests, together with a preference for certain habitat configuration, in our study either edge or interior habitat, would be highly sensitive to forest management practices and thus to the development of forests, climate and energy policy. Fragmentation of older forest lead to decline in patch size and interior forest habitat, while increasing the amount of forest edges adjacent to clear-cuts. Therefore, for assessing forest biodiversity, it is important to not only find and summarize the habitat of a certain quality across stands and landscapes, but also to assess its spatial configuration. Furthermore, the implications of the combined changes in habitat quality, quantity and configuration, in terms of persistence of populations of sensitive species in the landscape, still comes with great uncertainties that will need further exploration.
High ambitions concerning climate and energy policy are often played out in scenarios and pathways that include high demands on forest bioenergy feedstock, assuming an intensification of the forestry. The effects of such big changes need to be evaluated to demonstrate the limitations of the system. By applying the LEcA tool, we were able to show that there may be conflicts between sustainability objectives related to climate change mitigation and biodiversity, and the sustainability of proposed forest management strategies could be evaluated. The LEcA tool can demonstrate potential synergies and trade-offs between forest biomass production and forest biodiversity components, taking spatial configuration of habitat into account. Information about biodiversity-related indicators, within suitable system borders, need to be an integrated part of climate and energy policy assessment in future studies where forest bioenergy feedstock is seen as a renewable energy source, in order to evaluate the sustainability of policies.

Author Contributions

Conceptualization, U.M., X.-L.P., R.T. (Renats Trubins) and G.M.; methodology, U.M., X.-L.P., R.T. (Renats Trubins) and G.M.; software, U.M., X.-L.P. and R.T. (Renats Trubins); validation, R.T. (Renats Trubins) and G.M.; formal analysis, U.M., X.-L.P., R.T. (Renats Trubins) and G.M.; investigation, U.M., X.-L.P., R.T. (Rimgaudas Treinys), R.T. (Renats Trubins) and G.M.; resources, U.M., R.T. (Renats Trubins); data curation, U.M., X.-L.P., R.T. (Renats Trubins), G.M.; writing—original draft preparation, U.M., X.-L.P., R.T. (Rimgaudas Treinys), R.T. (Renats Trubins) and G.M.; writing—review and editing, U.M., X.-L.P., R.T. (Rimgaudas Treinys), R.T. (Renats Trubins) and G.M.; visualization, X.-L.P. and U.M.; supervision, U.M.; project administration, U.M.; funding acquisition, U.M. All authors have read and agreed to the published version of the manuscript.

Funding

The project was supported by the REEEM Energy Systems Modelling Project that received funding from the European Union’s Horizon 2020 research and innovation programme under grant agreement No 691739. It is further supported by the Swedish strategic research programme StandUp for Energy.

Institutional Review Board Statement

Not applicable.

Informed Consent Statement

Not applicable.

Data Availability Statement

A data deposit for the REEEM project is available here: https://openenergy-platform.org/dataedit/view/scenario.

Conflicts of Interest

The authors declare no conflict of interest. The funders had no role in the design of the study; in the collection, analyses, or interpretation of data; in the writing of the manuscript, or in the decision to publish the results.

Appendix A

Table A1. Volume expansion factors (VEF) for calculating the volume of harvest residues available for extraction without negative environmental impacts; a) branches and tops, and b) stumps; based on the harvested stem volume (State Forest Service, 2010), adapted from Pang et al. (2019).
(a) Branches and TopsDominating Tree Species
PineSpruceBirchAspenBlack AlderGrey AlderOakAsh
Soil typeVolume Expansion of Harvested Stem Volume (%): Branches and Tops
VEF1: steep, poor eroded, organic poor00000000
VEF2: dry poor, moist poor, organic eroded23222233
VEF3: dry with some fertility1012121010101010
VEF4: dry with high fertility1215141210101315
(b) StumpsDominating Tree Species
PineSpruceBirchAspenBlack AlderGrey AlderOakAsh
Soil typeVolume Expansion of Harvested stem Volume (%): Stumps
VEF1: steep, poor eroded, organic poor00000000
VEF2: dry poor, moist poor, organic eroded44343343
VEF3: dry with some fertility1414101310101210
VEF4: dry with high fertility2121151515141716
Table A2. Specific forest habitat criteria, with age criteria per tree species that were considered to be representative for forest biodiversity requirements in Lithuania, in particular related to bird species (Drobelis 2004; Kamarauskaite et al. 2019; Treinys et al. 2011; Treinys and Mozgeris 2006; Treinys et al. 2009).
Older forest—age requirements by tree species:Ash > 70 years
Aspen > 60 years
Birch > 60 years
Black alder > 60 years
Oak > 120 years
Spruce > 70 years
Forest edge habitatLocated within 300 m from the forest border towards agricultural areas
Forest interior habitatLocated further than 300 m from agricultural land
Patch size2 hectares

References

  1. Felton, A.; Sonesson, J.; Nilsson, U.; Lämås, T.; Lundmark, T.; Nordin, A.; Ranius, T.; Roberge, J.-M. Varying rotation lengths in northern production forests: Implications for habitats provided by retention and production trees. Ambio 2017, 46, 324–334. [Google Scholar] [CrossRef]
  2. Kurlavicius, P.; Kuuba, R.; Lukins, M.; Mozgeris, G.; Tolvanen, P.; Karjalainen, H.; Angelstam, P.; Walsh, M. Identifying high conservation value forests in the Baltic States from forest databases. Ecol. Bull. 2004, 51, 351–366. [Google Scholar]
  3. UN General Assembly. Transforming our World: The 2030 Agenda for Sustainable Development—Resolution A/RES/70/1 Adopted by the General Assembly on 25 September 2015. 2015, p. 35. Available online: http://www.un.org/ga/search/view_doc.asp?symbol=A/RES/70/1&Lang=E (accessed on 15 December 2020).
  4. European Commmission. A Clean Planet for All. A European Strategic Long-Term Vision for a Prosperous, Modern, Competitive and Climate Neutral Economy; Communication from the Commission to the European Parliament, the European Council, The European Economic and Social Committee, the Committee of the Regions and the European Investment Bank; European Commmission: Brussels, Belgium, 2018; p. 25. [Google Scholar]
  5. European Commmission. A Sustainable Bioeconomy for Europe: Strengthening the Connection between Economy, Society and the Environment; Updated Bioeconomy Strategy; European Commmission: Brussels, Belgium, 2018; p. 107. [Google Scholar]
  6. Pelli, P.; Haapala, A.; Pykäläinen, J. Services in the forest-based bioeconomy—Analysis of European strategies. Scand. J. For. Res. 2017, 32, 559–567. [Google Scholar] [CrossRef] [Green Version]
  7. Lidskog, R.; Sundqvist, G.; Kall, A.-S.; Sandin, P.; Larsson, S. Intensive forestry in Sweden: Stakeholders’ evaluation of benefits and risk. J. Integr. Environ. Sci. 2013, 10, 145–160. [Google Scholar] [CrossRef] [Green Version]
  8. Ranius, T.; Roberge, J.-M. Effects of intensified forestry on the landscape-scale extinction risk of dead wood dependent species. Biodivers. Conserv. 2011, 20, 2867–2882. [Google Scholar] [CrossRef] [Green Version]
  9. Thompson, I.D.; Okabe, K.; Tylianakis, J.M.; Kumar, P.; Brockerhoff, E.G.; Schellhorn, N.A.; Parrotta, J.A.; Nasi, R. Forest Biodiversity and the Delivery of Ecosystem Goods and Services: Translating Science into Policy. BioScience 2011, 61, 972–981. [Google Scholar] [CrossRef]
  10. Paillet, Y.; Bergès, L.; Hjältén, J.; Ódor, P.; Avon, C.; Bernhardt-Römermann, M.; Bijlsma, R.-J.; De Bruyn, L.; Fuhr, M.; Grandin, U.; et al. Biodiversity Differences between Managed and Unmanaged Forests: Meta-Analysis of Species Richness in Europe. Conserv. Biol. 2010, 24, 101–112. [Google Scholar] [CrossRef] [PubMed]
  11. UN. Transforming our World: The 2030 Agenda for Sustainable Development; UN: New York, NY, USA, 2015; p. 41. Available online: https://sustainabledevelopment.un.org/post2015/transformingourworld/publication (accessed on 15 December 2020).
  12. IPBES. Summary for Policymakers of the Global Assessment Report on Biodiversity and Ecosystem Services of the Intergovernmental Science-Policy Platform on Biodiversity and Ecosystem Services; IPBES Secretariat: Bonn, Germany, 2019; p. 56. [Google Scholar]
  13. EC. Directive 2009/28/EC of the European Parliament and of the Council of 23 April 2009 on the Promotion of the Use of Energy from Renewable Sources and Amending and Subsequently Repealing Directives 2001/77/EC and 2003/30/EC Journal of the European Union; L 140/16–62 5.6.2009; EC: Brussels, Belgium, 2009. [Google Scholar]
  14. European Commmission. A New EU Forest Strategy: For Forests and the Forest-Based Sector; Communication from the Commission to the European Parliament, the Council, The European Economic and Social Committee and the Committee of the Regions; European Commmission: Brussels, Belgium, 2013; p. 17. [Google Scholar]
  15. Calderon, C. Statistical Report. 2020. Available online: https://bioenergyeurope.org/statistical-report-2019 (accessed on 15 December 2020).
  16. European Commmission. EU Biodiversity Strategy for 2030. Bringing Nature back into our Lives; Communication from the Commission to the European Parliament, the Council, The European Economic and Social Committee and the Committee of the Regions, European Commission; European Commmission: Brussels, Belgium, 2020; p. 23. [Google Scholar]
  17. EC. Natura 2000 and Forests; European Commission: Luxembourg, 2015; p. 114. [Google Scholar]
  18. Lindahl, K.B.; Sténs, A.; Sandström, C.; Johansson, J.; Lidskog, R.; Ranius, T.; Roberge, J.-M. The Swedish forestry model: More of everything? For. Policy Econ. 2017, 77, 44–55. [Google Scholar] [CrossRef] [Green Version]
  19. O’Brien, M.; Wechsler, D.; Bringezu, S.; Schaldach, R. Toward a systemic monitoring of the European bioeconomy: Gaps, needs and the integration of sustainability indicators and targets for global land use. Land Use Policy 2017, 66, 162–171. [Google Scholar] [CrossRef]
  20. Pang, X.; Mörtberg, U.; Brown, N. Energy models from a strategic environmental assessment perspective in an EU context—What is missing concerning renewables? Renew. Sustain. Energy Rev. 2014, 33, 353–362. [Google Scholar] [CrossRef]
  21. Jucker, T.G.; Bouriaud, O.; Avacaritei, D.; Coomes, D.A. Stabilizing effects of diversity on aboveground wood production in forest ecosystems: Linking patterns and processes. Ecol. Lett. 2014, 17, 1560–1569. [Google Scholar] [CrossRef] [Green Version]
  22. Maes, J.; Paracchini, M.; Zulian, G.; Dunbar, M.; Alkemade, R. Synergies and trade-offs between ecosystem service supply, biodiversity, and habitat conservation status in Europe. Biol. Conserv. 2012, 155, 1–12. [Google Scholar] [CrossRef]
  23. Biber, P.; Borges, J.G.; Moshammer, R.; Barreiro, S.; Botequim, B.; Brodrechtová, Y.; Brukas, V.; Chirici, G.; Cordero-Debets, R.; Corrigan, E.; et al. How Sensitive Are Ecosystem Services in European Forest Landscapes to Silvicultural Treatment? Forests 2015, 6, 1666–1695. [Google Scholar] [CrossRef] [Green Version]
  24. Dieler, J.; Uhl, E.; Biber, P.; Müller, J.; Rötzer, T.; Pretzsch, H. Effect of forest stand management on species composition, structural diversity, and productivity in the temperate zone of Europe. Eur. J. For. Res. 2017, 136, 739–766. [Google Scholar] [CrossRef]
  25. Felton, A.; Löfroth, T.; Angelstam, P.; Gustafsson, L.; Hjältén, J.; Felton, A.M.; Simonsson, P.; Dahlberg, A.; Lindbladh, M.; Svensson, J.; et al. Keeping pace with forestry: Multi-scale conservation in a changing production forest matrix. Ambio 2020, 49, 1050–1064. [Google Scholar] [CrossRef] [Green Version]
  26. Van Der Plas, F.; Manning, P.; Allan, E.; Scherer-Lorenzen, M.; Verheyen, K.; Wirth, C.; Zavala, M.A.; Hector, A.; Ampoorter, E.; Baeten, L.; et al. Jack-of-all-trades effects drive biodiversity–ecosystem multifunctionality relationships in European forests. Nat. Commun. 2016, 7, 11109. [Google Scholar] [CrossRef] [PubMed] [Green Version]
  27. Gamfeldt, L.; Snäll, T.; Bagchi, R.; Jonsson, M.; Gustafsson, L.; Kjellander, P.; Ruiz-Jaen, M.C.; Fröberg, M.; Stendahl, J.; Philipson, C.D.; et al. Higher levels of multiple ecosystem services are found in forests with more tree species. Nat. Commun. 2013, 4, 1340. [Google Scholar] [CrossRef]
  28. Petrauskas, E.; Kuliešis, A. Scenario-based analysis of possible management alternatives for Lithuanian forests in the 21st century. Balt. For. 2004, 10, 72–82. [Google Scholar]
  29. Wikström, P.; Edenius, L.; Elfving, B.; Eriksson, L.O.; Lämås, T.; Sonesson, J.; Öhman, K.; Wallerman, J.; Waller, C.; Klintebäck, F. The Heureka forestry decision support system: An overview. Math. Comput. For. Nat. Resour. Sci. 2011, 3, 87–95. [Google Scholar]
  30. Biber, P.; Felton, A.; Nieuwenhuis, M.; Lindbladh, M.; Black, K.; Bahýl’, J.; Bingöl, Ö.; Borges, J.G.; Botequim, B.; Brukas, V.; et al. Forest Biodiversity, Carbon Sequestration, and Wood Production: Modeling Synergies and Trade-Offs for Ten Forest Landscapes Across Europe. Front. Ecol. Evol. 2020, 8. [Google Scholar] [CrossRef]
  31. Fahrig, L. Ecological Responses to Habitat Fragmentation Per Se. Annu. Rev. Ecol. Evol. Syst. 2017, 48, 1–23. [Google Scholar] [CrossRef]
  32. Lindenmayer, D.B.; Blanchard, W.; Foster, C.N.; Scheele, B.C.; Westgate, M.J.; Stein, J.; Crane, M.; Florance, D. Habitat amount versus connectivity: An empirical study of bird responses. Biol. Conserv. 2020, 241, 108377. [Google Scholar] [CrossRef]
  33. Saura, S. The Habitat Amount Hypothesis implies negative effects of habitat fragmentation on species richness. J. Biogeogr. 2021, 48, 11–22. [Google Scholar] [CrossRef]
  34. Haddad, N.M.; Brudvig, L.A.; Clobert, J.; Davies, K.F.; Gonzalez, A.; Holt, R.D.; Lovejoy, T.E.; Sexton, J.O.; Austin, M.P.; Collins, C.D.; et al. Habitat fragmentation and its lasting impact on Earth’s ecosystems. Sci. Adv. 2015, 1, e1500052. [Google Scholar] [CrossRef] [Green Version]
  35. Hanski, I. Habitat fragmentation and species richness. J. Biogeogr. 2015, 42, 989–993. [Google Scholar] [CrossRef]
  36. Martin, C.A. An early synthesis of the habitat amount hypothesis. Landsc. Ecol. 2018, 33, 1831–1835. [Google Scholar] [CrossRef]
  37. Meeussen, C.; Govaert, S.; Vanneste, T.; Calders, K.; Bollmann, K.; Brunet, J.; Cousins, S.A.; Diekmann, M.; Graae, B.J.; Hedwall, P.-O.; et al. Structural variation of forest edges across Europe. For. Ecol. Manag. 2020, 462, 117929. [Google Scholar] [CrossRef] [Green Version]
  38. Valente, J.J.; Betts, M.G. Response to fragmentation by avian communities is mediated by species traits. Divers. Distrib. 2018, 25, 48–60. [Google Scholar] [CrossRef] [Green Version]
  39. Riitters, K.H.; Wickham, J.D.; Costanza, J.K.; Vogt, P. A global evaluation of forest interior area dynamics using tree cover data from 2000 to 2012. Landsc. Ecol. 2016, 31, 137–148. [Google Scholar] [CrossRef] [Green Version]
  40. Ram, D.; Axelsson, A.-L.; Green, M.; Smith, H.G.; Lindström, Å. What drives current population trends in forest birds—Forest quantity, quality or climate? A large-scale analysis from northern Europe. For. Ecol. Manag. 2017, 385, 177–188. [Google Scholar] [CrossRef]
  41. Pang, X.; Nordström, E.-M.; Böttcher, H.; Trubins, R.; Mörtberg, U. Trade-offs and synergies among ecosystem services under different forest management scenarios—The LEcA tool. Ecosyst. Serv. 2017, 28, 67–79. [Google Scholar] [CrossRef]
  42. State Forest Service. Lithuanian Statistical Yearbook of Forestry; Ministry of Environment and State Forest Service: Kaunas, Lithuania, 2019.
  43. Bohn, U.; Gollub, G.; Hettwer, C.; Weber, H.; Neuhäuslova, Z.; Raus, T.; Schlüter, H. Karte der Natürlichen Vegetation Europas/Map of the Natural Vegetation of Europe; Maßstab/Scale 1:2,500,000; Landwirtschaftsverlag: Münster, Germany, 2003. [Google Scholar]
  44. Karazija, S. Lietuvos Miško Tipai [Forest Types in Lithuania]; Mokslas: Vilnius, Lithuania, 1998; pp. 46–48. (In Lithuanian) [Google Scholar]
  45. Leht, M.; Laasimer, L.; Kuusk, V.; Tabaka, L.; Lekavicius, A. Flora of the Baltic Countries: Compendium of Vascular Plants [In Eng. and Russ.] Vol. 1. TAXON 1994, 43, 518. [Google Scholar] [CrossRef]
  46. Lietuvos Respublikos Seimas. Forest Law of the Republic of Lithuania. 1994. Available online: https://www.e-tar.lt/portal/en/legalAct/TAR.5D6D055CC00C/OfQRoJecOC (accessed on 15 December 2020).
  47. Brukas, V. New World, Old Ideas—A Narrative of the Lithuanian Forestry Transition. J. Environ. Policy Plan. 2014, 17, 495–515. [Google Scholar] [CrossRef]
  48. Statistics Lithuania. Database of Indicators; Official Statistics Portal: Kaunas, Lithuania, 2017. [Google Scholar]
  49. Galinis, A. Lietuvos Energetikos Sektoriaus Pletros Tyrimas; Lithuania Energy Institute: Kaunas, Lithuania, 2015. [Google Scholar]
  50. Pang, X.; Trubins, R.; Lekavicius, V.; Galinis, A.; Mozgeris, G.; Kulbokas, G.; Mörtberg, U. Forest bioenergy feedstock in Lithuania—Renewable energy goals and the use of forest resources. Energy Strat. Rev. 2019, 24, 244–253. [Google Scholar] [CrossRef]
  51. Tucker, G.M.; Heath, M.F. Birds in Europe: Their Conservation Status; BirdLife Interntional: Cambridge, UK, 1994. [Google Scholar]
  52. Puumulainen, J. Structural, Compositional and Functional Aspects of Forest Biodiversity in Europe—Geneva Timber and Forest Discussion Papers; United Nations: New York, NY, USA, 2001. [Google Scholar]
  53. Mikusinski, G.; Angelstam, P. Europe as an arena fore developing forest biodiversity targets at the landscape scale. Bioenergy from sustainable forestry: Principles and practice. For. Res. Bull. 2001, 223, 59–70. [Google Scholar]
  54. Angelstam, P.; Roberge, J.M.; Lohmus, A.; Bergmanis, M.; Brazaitis, G.; Dönz-Breuss, M.; Edenius, L.; Kosinski, Z.; Kurlavicius, P.; Larmanis, V.; et al. Habitat modelling as a tool for landscape-scale conservation—A review of parameters for focal forest birds. Ecol. Bull. 2004, 51, 427–453. [Google Scholar]
  55. Ranius, T.; Hämäläinen, A.; Egnell, G.; Olsson, B.; Eklöf, K.; Stendahl, J.; Rudolphi, J.; Sténs, A.; Felton, A. The effects of logging residue extraction for energy on ecosystem services and biodiversity: A synthesis. J. Environ. Manag. 2018, 209, 409–425. [Google Scholar] [CrossRef]
  56. Müller, J.; Bütler, R. A review of habitat thresholds for dead wood: A baseline for management recommendations in European forests. Eur. J. For. Res. 2010, 129, 981–992. [Google Scholar] [CrossRef]
  57. Ampoorter, E.; Barbaro, L.; Jactel, H.; Baeten, L.; Boberg, J.; Carnol, M.; Castagneyrol, B.; Charbonnier, Y.; Dawud, S.M.; Deconchat, M.; et al. Tree diversity is key for promoting the diversity and abundance of forest-associated taxa in Europe. Oikos 2019, 129, 133–146. [Google Scholar] [CrossRef] [Green Version]
  58. Lindenmayer, D.B.; Laurance, W.F. The ecology, distribution, conservation and management of large old trees. Biol. Rev. 2016, 92, 1434–1458. [Google Scholar] [CrossRef]
  59. Treinys, R.; Mozgeris, G. Relationship between the productivity of the Lesser Spotted Eagle Aquila pomarina and forest characteristics at the macrohabitat level. Balt. For. 2010, 16, 87–92. [Google Scholar]
  60. Ministry of Environment. Action Plan on Conservation of Landscape and Biodiversity. 2016. Available online: www.cbd.int/doc/world/lt/lt-nbsap-v2-en.pdf (accessed on 15 December 2020).
  61. Seimas of the Republic of Lithuania. Lietuvos Respublikos Miškų Įstatymas [Law on Forests of the Republic of Lithuania]. 1994. Available online: www.e-tar.lt/portal/lt/legalAct/TAR.5D6D055CC00C/asr (accessed on 15 December 2020).
  62. Biodiversity Information System for Europe. Lithuania—Contribution to the Mid-Term Review of the EU Biodiversity Strategy to 2020 Based on the 5th National Report to CBD. 2017. Available online: https://biodiversity.europa.eu/countries/lithuania (accessed on 15 December 2020).
  63. Mathworks. MATLAB, version 8; The Mathworks, Inc.: Natick, MA, USA, 2015. [Google Scholar]
  64. ESRI. ArcGIS Desktop, 10th ed.; Environmental Systems Research Institute: Redlands, CA, USA, 2011. [Google Scholar]
  65. State Forest Service. Lithuanian Forest Cadastre; Kaunas, Lithuania. 2016. Available online: http://www.amvmt.lt/index.php/kadastras (accessed on 15 December 2020).
  66. Spatial Information Portal of Lithuania. Spatial Data Set of (Geo) Reference Based Cadastre; National Center for Remote Sensing and Geoinformatics. 2017. Available online: www.geoportal.lt/geoportal/en/web/en (accessed on 15 December 2020).
  67. Pang, X.; Mörtberg, U.; Sallnäs, O.; Trubins, R.; Nordström, E.-M.; Böttcher, H. Habitat network assessment of forest bioenergy options using the landscape simulator LandSim—A case study of Kronoberg, southern Sweden. Ecol. Model. 2017, 345, 99–112. [Google Scholar] [CrossRef]
  68. Kuliešis, A.; Kasperavičius, A.; Kulbokas, G. Lithuania. In National Forest Inventories: Pathways for Common Reporting; Tomoop, E., Gschwantner, T., Lawrence, M., McRoberts, R.E., Eds.; Springer: London, UK; New York, NY, USA, 2010; pp. 351–374. [Google Scholar]
  69. Packalen, T.; Sallnäs, O.; Sirkia, S.; Korhonen, K.; Salminen, O.; Vidal, C.; Robert, N.; Colin, A.; Belouard, T.; Schadauer, K. The European Forestry Dynamics Model: Concept, Design and Results of First Case Studies; Publications Office of the European Union: Luxembourg, 2014. [Google Scholar]
  70. State Forest Service. Miskotvarkos Darbu Vykdymo Instrukcija [Instruction for Implementation of Forest Management Planning Activities]; Patvirtinta, Valstybinės miškų tarnybos direktoriaus 2010 m. sausio 14 d. įsakymu Nr. 11-10-V [approved by order No. 11-10-V from 14 January 2010 of the director of State Forest Service]. 2010, p. 3. Available online: https://e-seimas.lrs.lt/portal/legalAct/lt/TAD/TAIS.370142?jfwid=q8i88lw6k (accessed on 15 December 2020).
  71. State Forest Service. Methodology and Norms for Determining the Balance of Consumption of Wood Harvested in Lithuanian Forests; Lithuanian State Forest Service: Kaunas, Lithuania, 2015. [Google Scholar]
  72. State Forest Service. The Balance of Wood and Wood Products Production and Trade; Lithuanian State Forest Service: Kaunas, Lithuania, 2015. [Google Scholar]
  73. Drobelis, E. Lietuvos Miškų Plėšrieji Paukščiai [Birds of Prey of Lithuanian Forests]; Ministry of the Environment of the Republic of Lithuania: Vilnius, Lithuania, 2004.
  74. Treinys, R.; Mozgeris, G. Past and present nest-site requirements of the Lesser Spotted Eagle (Aquila pomarina C.L.Brehm) and their possible conflict with timber harvesting. Balt. For. 2006, 12, 252–258. [Google Scholar]
  75. Treinys, R.; Dementavičius, D.; Mozgeris, G.; Skuja, S.; Rumbutis, S.; Stončius, D. Coexistence of protected avian predators: Does a recovering population of White-tailed Eagle threaten to exclude other avian predators? Eur. J. Wildl. Res. 2011, 57, 1165–1174. [Google Scholar] [CrossRef]
  76. Treinys, R.; Skuja, S.; Augutis, D.; Stončius, D. Nest-site use by Black Stork and Lesser Spotted Eagle in relation to fragmented forest cover: Case study from Lithuania. Ekologija 2009, 55, 182–188. [Google Scholar]
  77. Kamarauskaitė, A.; Skuja, S.; Treinys, R. Nesting habitat overlap between the Common BuzzardButeo buteoand the Lesser Spotted EagleClanga pomarinafor conservation planning in Natura 2000 sites. Bird Study 2019, 66, 224–233. [Google Scholar] [CrossRef]
  78. Bergmanis, U.; Amerika, K.; Väli, Ü.; Treinys, R. Nest site selection and turnover patterns in support of conservation decisions: Case study of the lesser spotted eagle in the core area of its global population. For. Ecol. Manag. 2019, 448, 67–75. [Google Scholar] [CrossRef]
  79. Treinys, R.; Lõhmus, A.; Stončius, D.; Skuja, S.; Drobelis, E.; Šablevičius, B.; Rumbutis, S.; Dementavičius, D.; Naruševičius, V.; Petraška, A.; et al. At the border of ecological change: Status and nest sites of the Lithuanian black stork Ciconia nigra population 2000–2006 vs. 1976–1992. J. Ornithol. 2008, 149, 75–81. [Google Scholar] [CrossRef]
  80. Konovalov, A.; Nellis, R.; Nellis, R.; Nurmla, A.; Sellis, U.; Väli, Ü. Solitude at periphery: Lack of partners limits reproduction of the Black Stork (Ciconia nigra) at the margin of the distribution range. Ornis Fenn. 2019, 96, 13–23. [Google Scholar]
  81. Treinys, R.; Väli, Ü.; Bergmanis, U. Strong territoriality and weak density-dependent reproduction in Lesser Spotted Eagles Clanga pomarina. Ibis 2017, 159, 343–351. [Google Scholar] [CrossRef]
  82. CBD. Fifth National Report on the Implementation of the Convention on Biological Diversity Lithuania. 2014, p. 78. Available online: www.cbd.int/doc/world/lt/lt-nr-05-en.pdf (accessed on 15 December 2020).
  83. Angelstam, P.; Naumov, V.; Elbakidze, M.; Manton, M.; Priednieks, J.; Rendenieks, Z. Wood production and biodiversity conservation are rival forestry objectives in Europe’s Baltic Sea Region. Ecosphere 2018, 9, e02119. [Google Scholar] [CrossRef] [Green Version]
  84. Nobre, S.; Eriksson, L.-O.; Trubins, R. The Use of Decision Support Systems in Forest Management: Analysis of FORSYS Country Reports. Forests 2016, 7, 72. [Google Scholar] [CrossRef] [Green Version]
  85. Filyushkina, A.; Strange, N.; Löf, M.; Ezebilo, E.E.; Boman, M. Non-market forest ecosystem services and decision support in Nordic countries. Scand. J. For. Res. 2016, 31, 99–110. [Google Scholar] [CrossRef]
  86. Lindner, M.; Fitzgerald, J.B.; Zimmermann, N.E.; Reyer, C.; Delzon, S.; van der Maaten, E.; Schelhaas, M.-J.; Lasch, P.; Eggers, J.; van der Maaten-Theunissen, M.; et al. Climate change and European forests: What do we know, what are the uncertainties, and what are the implications for forest management? J. Environ. Manag. 2014, 146, 69–83. [Google Scholar] [CrossRef] [PubMed] [Green Version]
  87. Reyer, C.P.O.; Bathgate, S.; Blennow, K.; Borges, J.; Bugmann, H.; Delzon, S.; Faias, S.P.; Garcia-Gonzalo, J.; Gardiner, B.; Gonzalez-Olabarria, J.R.; et al. Are forest disturbances amplifying or canceling out climate change-induced productivity changes in European forests? Environ. Res. Lett. 2017, 12, 034027. [Google Scholar] [CrossRef]
  88. Mühlenhoff, J.; Bonadio, J. Buidling a Paris Agreement Compatible (PAC) Energy Scenario, CAN Europe/EEB technical summary of key elements. In Paris Agreement Compatible Scenarios for Energy Infrastructure. 2020, p. 52. Available online: https://www.pac-scenarios.eu/fileadmin/user_upload/PAC_scenario_technical_summary_29jun20.pdf (accessed on 15 December 2020).
  89. Capros, P.; Kannavou, M.; Evangelopoulou, S.; Petropoulos, A.; Siskos, P.; Tasios, N.; Zazias, G.; DeVita, A. Outlook of the EU energy system up to 2050: The case of scenarios prepared for European Commission’s “clean energy for all Europeans” package using the PRIMES model. Energy Strat. Rev. 2018, 22, 255–263. [Google Scholar] [CrossRef]
  90. Iribarren, D.; Martín-Gamboa, M.; Navas-Anguita, Z.; García-Gusano, D.; Dufour, J. Influence of climate change externalities on the sustainability-oriented prioritisation of prospective energy scenarios. Energy 2020, 196, 117179. [Google Scholar] [CrossRef]
Figure 1. The study area of Lithuania, with the forest management zones that are applied in the country. Coordinate system LKS_1994_Lithuania_TM, spatial data State Forest Service (2016).
Sustainability 13 02789 g001
Figure 2. Overview of data and modules of the LEcA tool that was used in the current study. Climate and energy goals are often driving energy systems analysis with climate ambitions (Pang et al. 2014), while biodiversity goals (red dotted arrow) need to be better integrated in sustainability assessments.
Sustainability 13 02789 g002
Figure 3. Total harvested stem volume and bioenergy feedstock, with forest management strategies BAU and INT, applying two different assumptions (A and B) on use of the harvested volumes.
Sustainability 13 02789 g003
Figure 4. The development of forest older than 70 years, applying the same age threshold for all tree species; coniferous, deciduous and total, with Strategy BAU and Strategy INT.
Sustainability 13 02789 g004
Figure 5. Development of forest habitat over the simulated time period, including all forest that met the species-age criteria, as well as forest interior and edge habitat taking patch size into account.
Sustainability 13 02789 g005
Figure 6. Trade-offs between bioenergy and biodiversity indicators, comparing with the base year 2015 in%, for the forest management strategies BAU and INT. The overall forest biomass harvest volumes, as well as the development of forests of any tree species >70 years are also illustrated for comparison.
Sustainability 13 02789 g006aSustainability 13 02789 g006b
Table 1. Input and output data of the LEcA tool used in the analyses. The first two parameters were dynamic, while the other were static and stayed the same as the reference year 2015.
Input ParametersUse
Description
Forest ageMean age of forest stand in five-year classes (dynamic parameter, 33 classes) 1Forest simulation, bioenergy assessment, habitat assessment
Forest volumeStanding volume (stems) in forest with bark (dynamic parameter, 13 classes) 1Forest simulation, bioenergy assessment
Tree speciesDominating tree species (>50% of standing volume) (8 classes) 1Forest simulation, bioenergy assessment, habitat assessment
ProductivitySite productivity (2 classes) 1Forest simulation
OwnershipOwnership (2 classes) 1Forest simulation
Forest groupForest management group related to current policy (4 classes) 1Forest simulation, bioenergy assessment
Agricultural landArable land and grasslands 2Habitat assessment
Output parameters (five-year time steps for 100 years) of the yield calculator
FirewoodVolume (roundwood) with bark
Industrial woodVolume (roundwood) with bark
Industrial waste woodVolume (chips and sawdust)
Harvest residuesVolume (chips)
Output parameters (five-year time steps for 100 years) of the habitat assessment model
Forest > 70 yearsArea (km2) of all forest, coniferous forest and deciduous forest
Older forestArea (km2) of forest with species-specific age criteria
Interior forest habitatArea (km2) of interior forest habitat with species-specific age criteria and patch size criterion
Edge forest habitatArea (km2) of edge forest habitat with species-specific age criteria and patch size criterion
1 State Forest Service (2016). 2 GIS-Centras (2017).
Publisher’s Note: MDPI stays neutral with regard to jurisdictional claims in published maps and institutional affiliations.

