
The Impact of On-Demand Collective Transport Services on Sustainability: A Comparison of Various Service Options in a Rural and an Urban Area of Switzerland


Abstract
1. Introduction
2. Literature Review
3. Materials and Methods
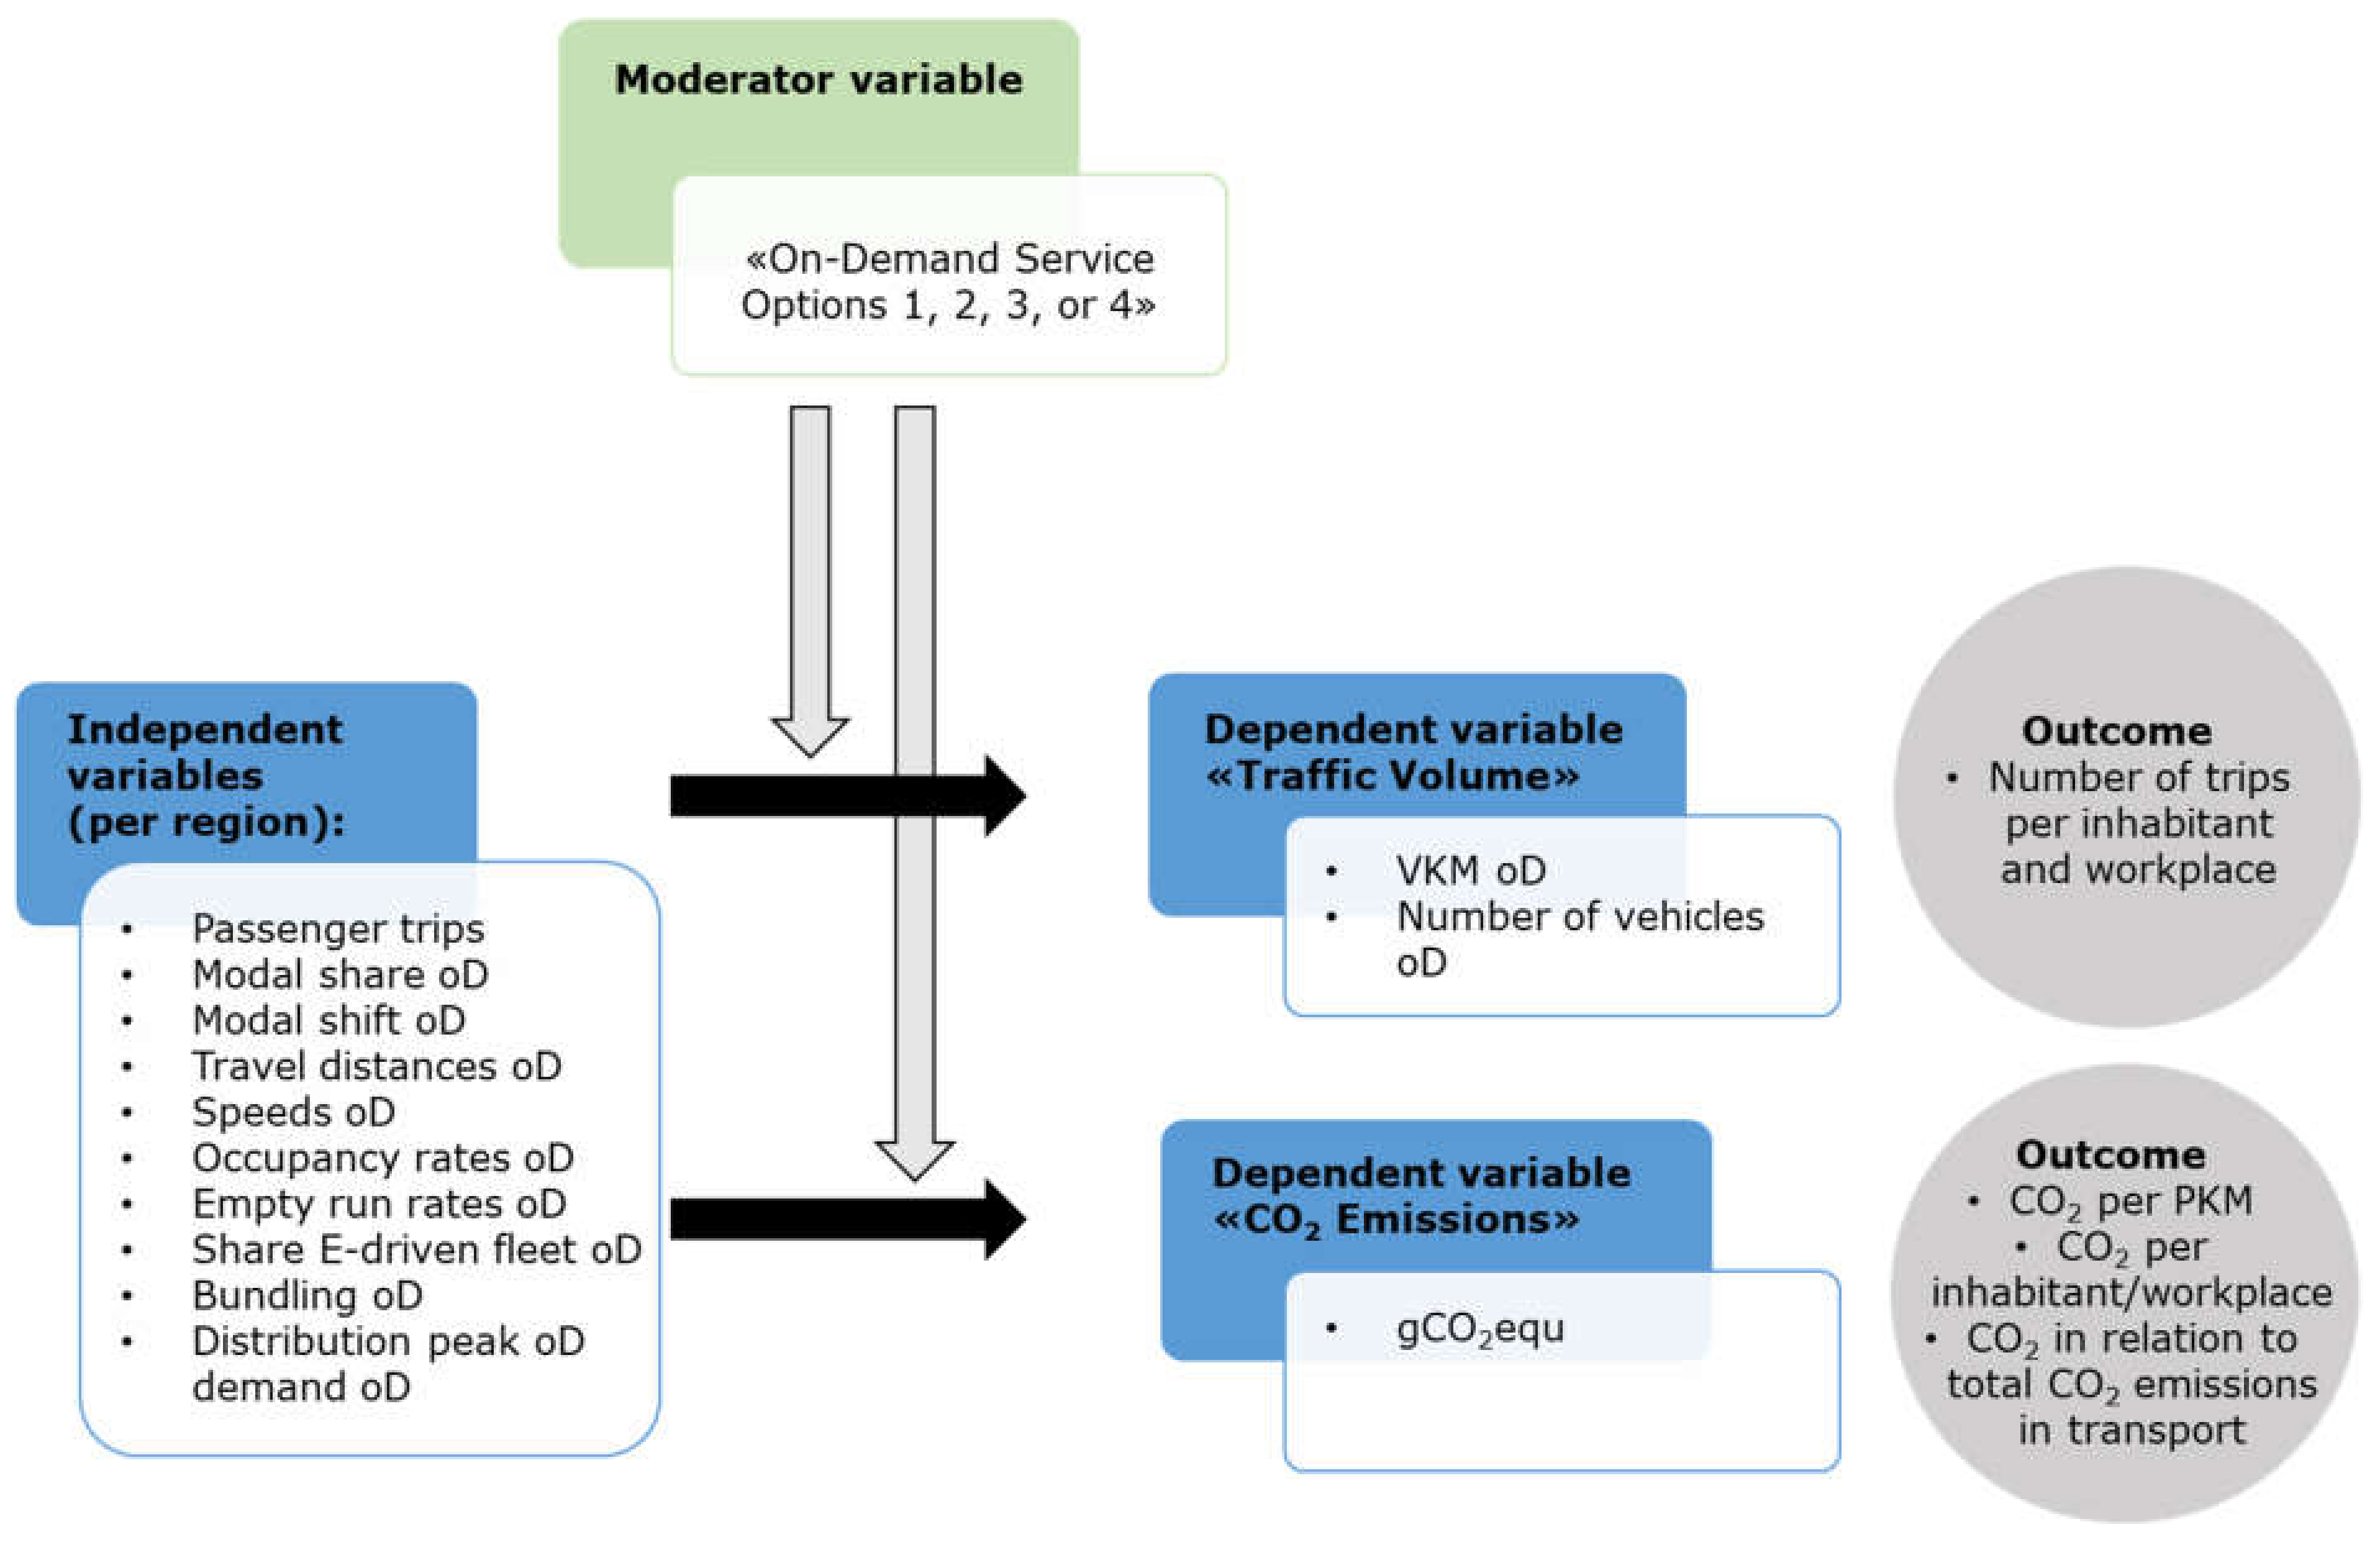
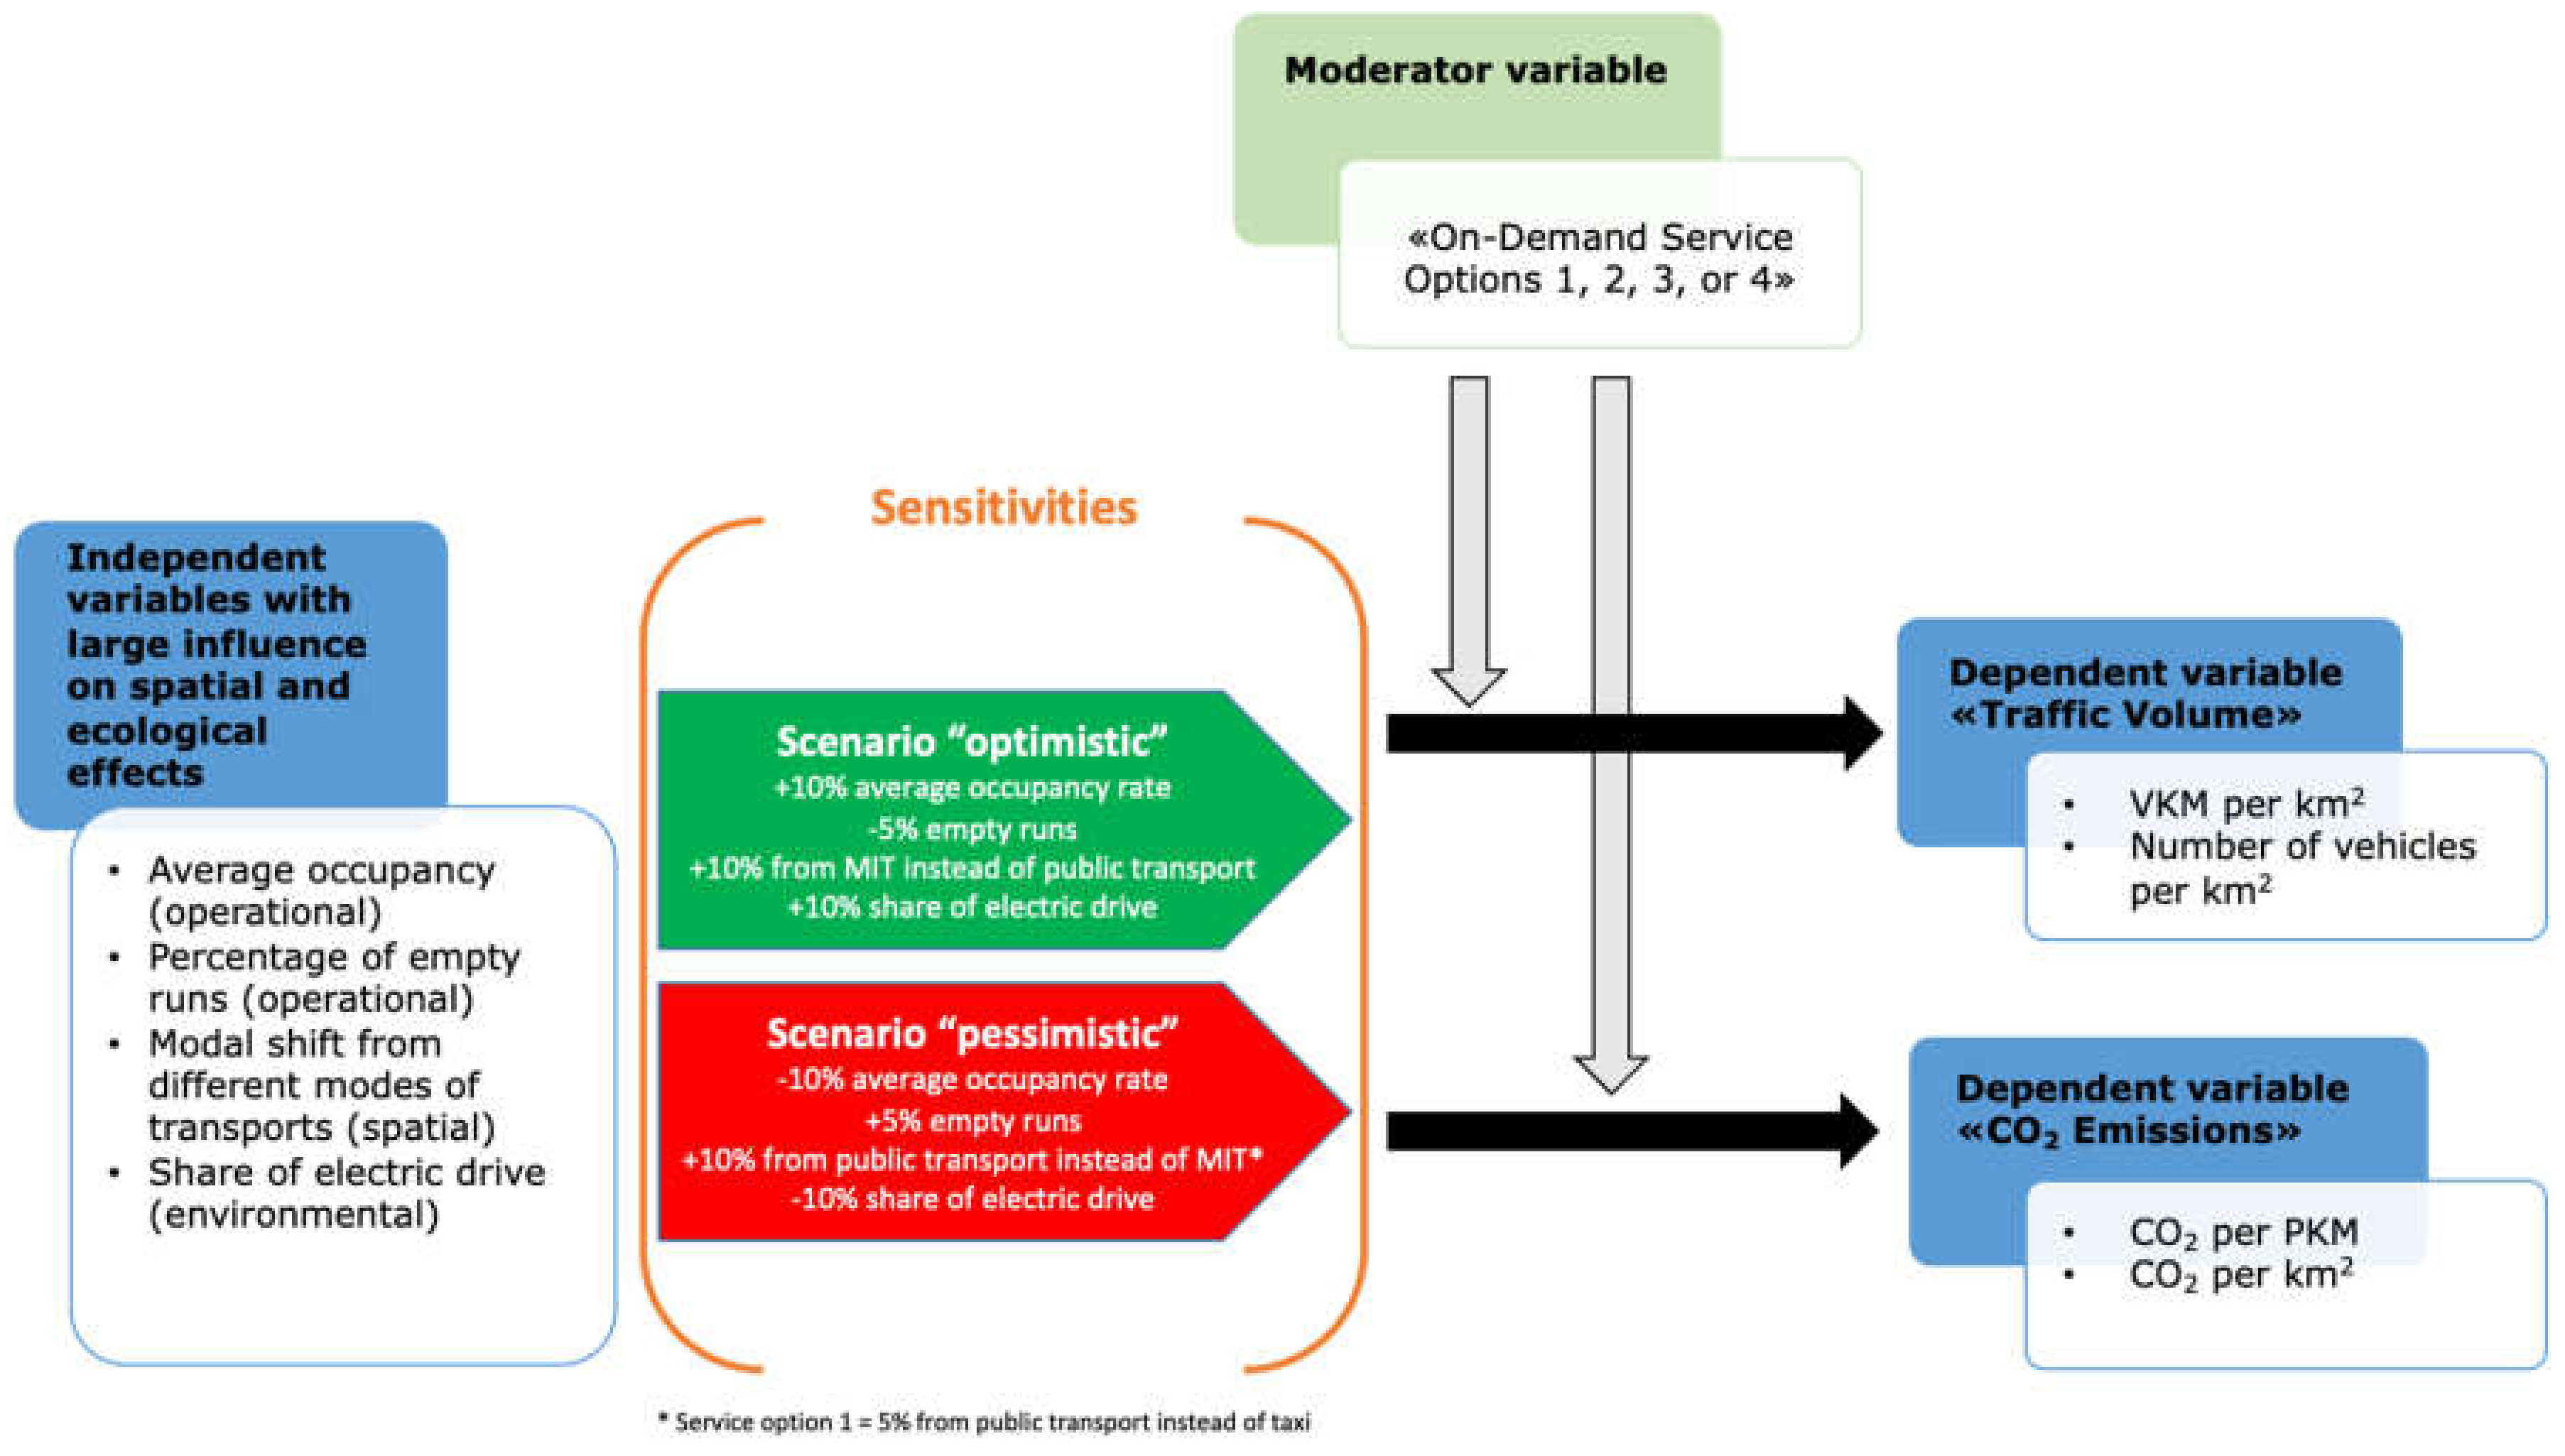
3.1. Analysis Approach
3.2. Service Options
- Service Option 1: on-demand line operation: the first service option is a mixture of a public transport and an on-demand collective transport service. The concept is strongly based on existing public bus routes. With minibuses, passengers are taken to virtual stops at major road junctions near the customer’s address (we assumed that such a virtual stop is about 250 m from the front door). Furthermore, the minibus does not follow a rigid timetable, particularly in off-peak hours, but can be ordered at short notice via an app at any time. The aim of this application is to continue to offer journeys that coordinate with the public transport timetable, especially with train connections. In contrast to Service Options 2–4, only the under-used bus routes are made more flexible. The vehicles used are large eight-seater all-purpose vehicles.
- Service Option 2: on-demand collective transport service at off-peak and marginal times as a public transport supplement: the second service option is based on an on-demand collective transport system that is intended to supplement public transport at off-peak times. With an on-demand service, the operating times that are currently poorly served by public transport (for example, in off-peak hours) would become more attractive. A comfort surcharge of 2 Swiss francs (CHF) per trip is added to the public transport fare. The service is offered door to door or via virtual stops from a certain mobility hub and only for a defined service area. Standard four-seater all-purpose vehicles are used.
- Service Option 3: on-demand collective transport service as a public transport replacement with integration into public transport pricing: analogous to Service Option 2, Service Option 3 replaces the public transport bus with an on-demand collective transport service. In this case, however, the fare system is fully integrated into the public transport fare system. The use of the on-demand collective transport service is thus as costly as taking the suburban railway or train, and any public transport season ticket is accepted for use. The vehicles used are large eight-seater all-purpose vehicles.
- Service Option 4: commercial on-demand (collective) transport service with own fares: in contrast to Service Option 3, the on-demand driving service in this service option requires a market-based tariff. The offer is thus not integrated into the public transport system and is in competition with the existing public transport offer. There are no defaults for the fares, nor is there any restriction of connections with existing public transport or service areas. It is thus left to the commercial provider to decide where, with how many vehicles and whether they are electric or conventional, and at what price they want to offer their services. In contrast to Service Options 1–3, this does not have to be a collective transport (pooling); this means that the pooling of separate, similar travel requests is only partially carried out. Standard four-seater all-purpose vehicles are used.
3.3. Spatial Comparison
3.4. Key Input Factors and Assumptions for the Four Service Options
3.4.1. Operational Input Variables
- Used vehicles: two general categories of vehicles were considered in this study. A standard four-seater all-purpose vehicle as a mid-range car (example: Volkswagen Golf) was used for the public transport supplement (Service Option 2) and commercial on-demand offer (Service Option 4). For the on-demand line operation (Service Option 1) and public transport replacement (Service Option 3), a large 8-seater all-purpose vehicle (example: VW Multivan) was used.
- Average occupancy without empty runs: the average occupancy rate was calculated by dividing the average number of passengers in the vehicle by the number of seats. The values for the average number of passengers per vehicle was adapted from [40], and was set in relation to the vehicle size. This resulted in the following calculations: 2.6/8 = 0.325, 2.4/4 = 0.6, 2.6/8 = 0.325, and 1.6/4 = 0.4. It can be critically noted that due to the lack of empirical data, we did not assume any differences in the occupancy rate of on-demand vehicles between rural and urban areas [40].
3.4.2. Spatial Input Variables
- Travel distances: travel distances vary widely between urban and rural areas. In Glarus, they are more than twice as far as in Basel. On the one hand, this leads to a higher traffic volume per inhabitant and a higher number of VKM in the countryside than in the city. On the other hand, longer travel distances with on-demand systems lead to a higher proportion of empty runs. Table 4 shows the travel distances used in the model per service option and spatial context.
- Speed: another difference between urban and rural regions concerns speed. The lower the average speed at which a vehicle travels during a journey, the more vehicles must be deployed to serve a certain demand. In cities, the lower average speed means that proportionally more vehicles are needed than in the countryside. For Service Options 1, 3, and 4, the same average speeds were used within the respective regions: 31.3 km/h for Glarus South and 20.6 km/h for Basel-St. Johann. Furthermore, for Service Option 2, we used 32.2 km/h for Glarus South and 21.9 km/h for Basel-St. Johann. The speeds for Service Option 2 speeds were slightly higher as this service option serves off-peak hours, during which time vehicles tend to be travel faster.
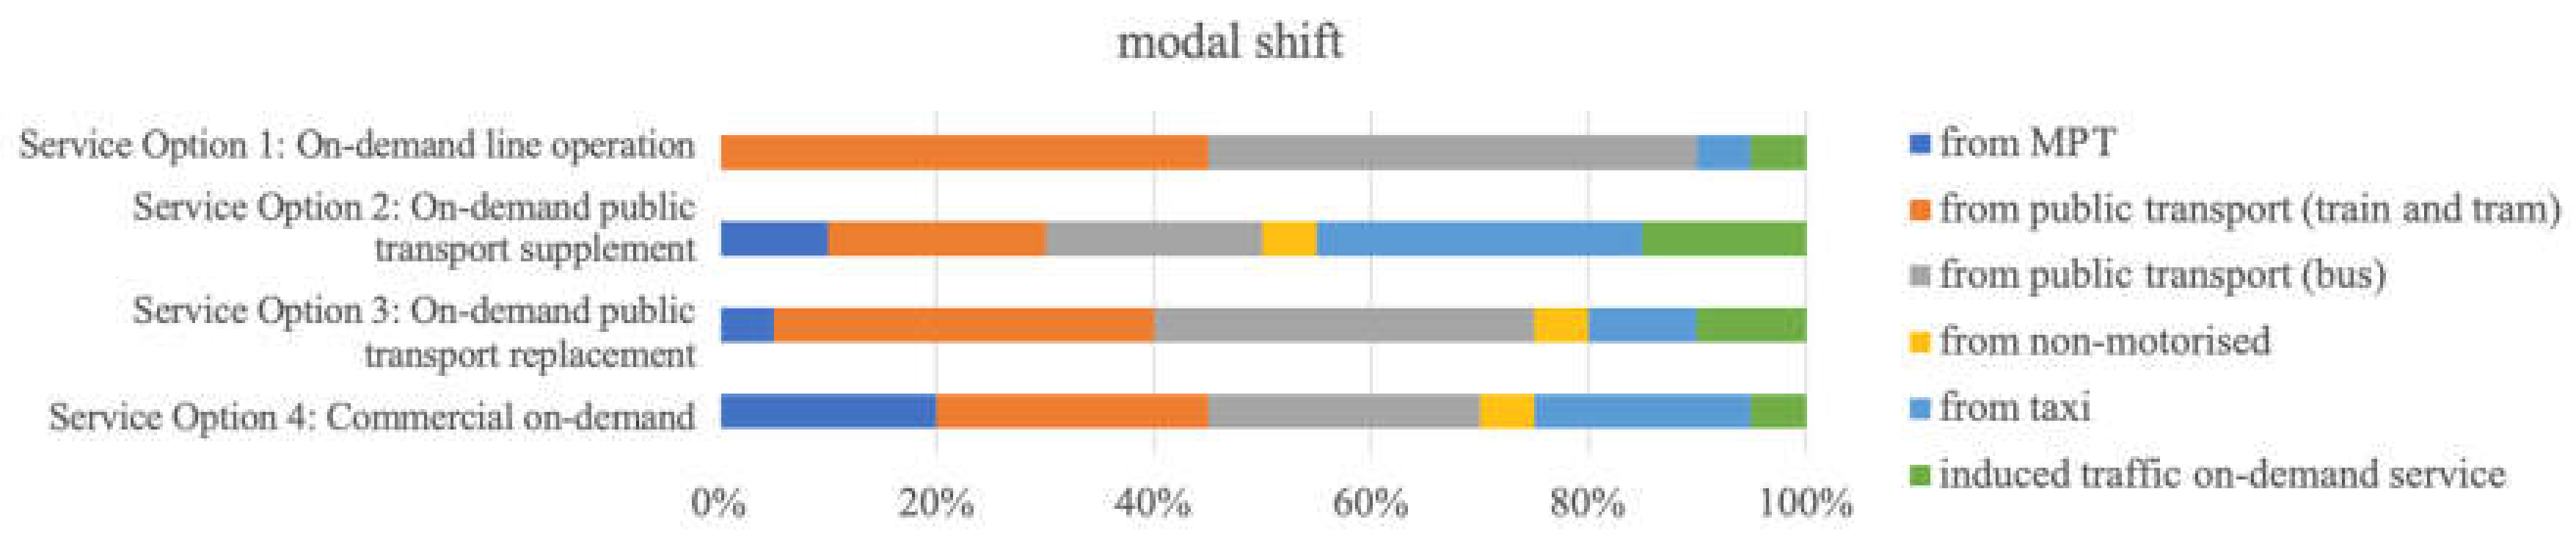
- Modal shift: the modal shift describes the percentage of new journeys generated by an on-demand collective transport service that substitute other modes of transport. If an on-demand service option attracts passengers from less sustainable transport, the effect on sustainability is more positive than if the customers come from, for example, non-motorised transport. If public transport is completely replaced, it is assumed in a simplified way that all public transport journeys switch to the on-demand services. A factor for induced trips was derived from the findings from domestic and international on-demand (collective) transport services e.g., [53,54]. The modal shift was based on the following assumptions as shown in Figure 2. First, it was assumed that in Service Option 1, hardly any trips could be gained from motorised private transport (MPT), because it does not offer door-to-door operations. Instead, around 90% of the generated trips in Service Option 1 stem from passengers that switch from public transport (train, tram, bus) to this new on-demand mobility service. Second, for Service Option 2, the modal shift was based on existing studies from abroad, e.g., [54,55,56,57]. A considerable proportion of the trips that supplement public transport are likely to come from taxis since on-demand driving services offer a cost-effective alternative. Although on-demand services in this option supplement public transport, the cannibalisation of public transport is apparent, but lowest for Service Option 2 compared to all other options. Third, in Service Option 3, the majority of the generated trips (around 60%) are former public transport trips since the conventional public transport service is replaced. An increase in attractiveness is created by the door-to-door connection, which is why former car and taxi rides are also substituted. Fourth, Service Option 4 is a commercial offer, which deliberately seeks to attract MPT drivers as well. The share of people switching from MPT to Service Option 4 is the highest in comparison of all options. The share of people stemming from MPT, train and tram, bus, as well as taxi, is roughly balanced. The modal shift corresponds to studies from Switzerland and abroad e.g., [54,55,56,57]. Fifth, the modal shift was not differentiated by spatial context due to a lack of data. To calculate the sustainable effects of on-demand collective transport services, the following modal shifts (shown in Figure 2) as explained above were made.

| Service Option | Travel Distances 4 | ||
|---|---|---|---|
| Glarus South | Basel St. Johann | ||
| 1 | On-demand line operation | 10.5 km 5 | 3.5 km 6 |
| 2 | On-demand public transport supplement | 11 km | 4 km |
| 3 | On-demand public transport replacement | 11 km | 4 km |
| 4 | Commercial on-demand | 15 km 7 | 7 km 8 |
- 4.
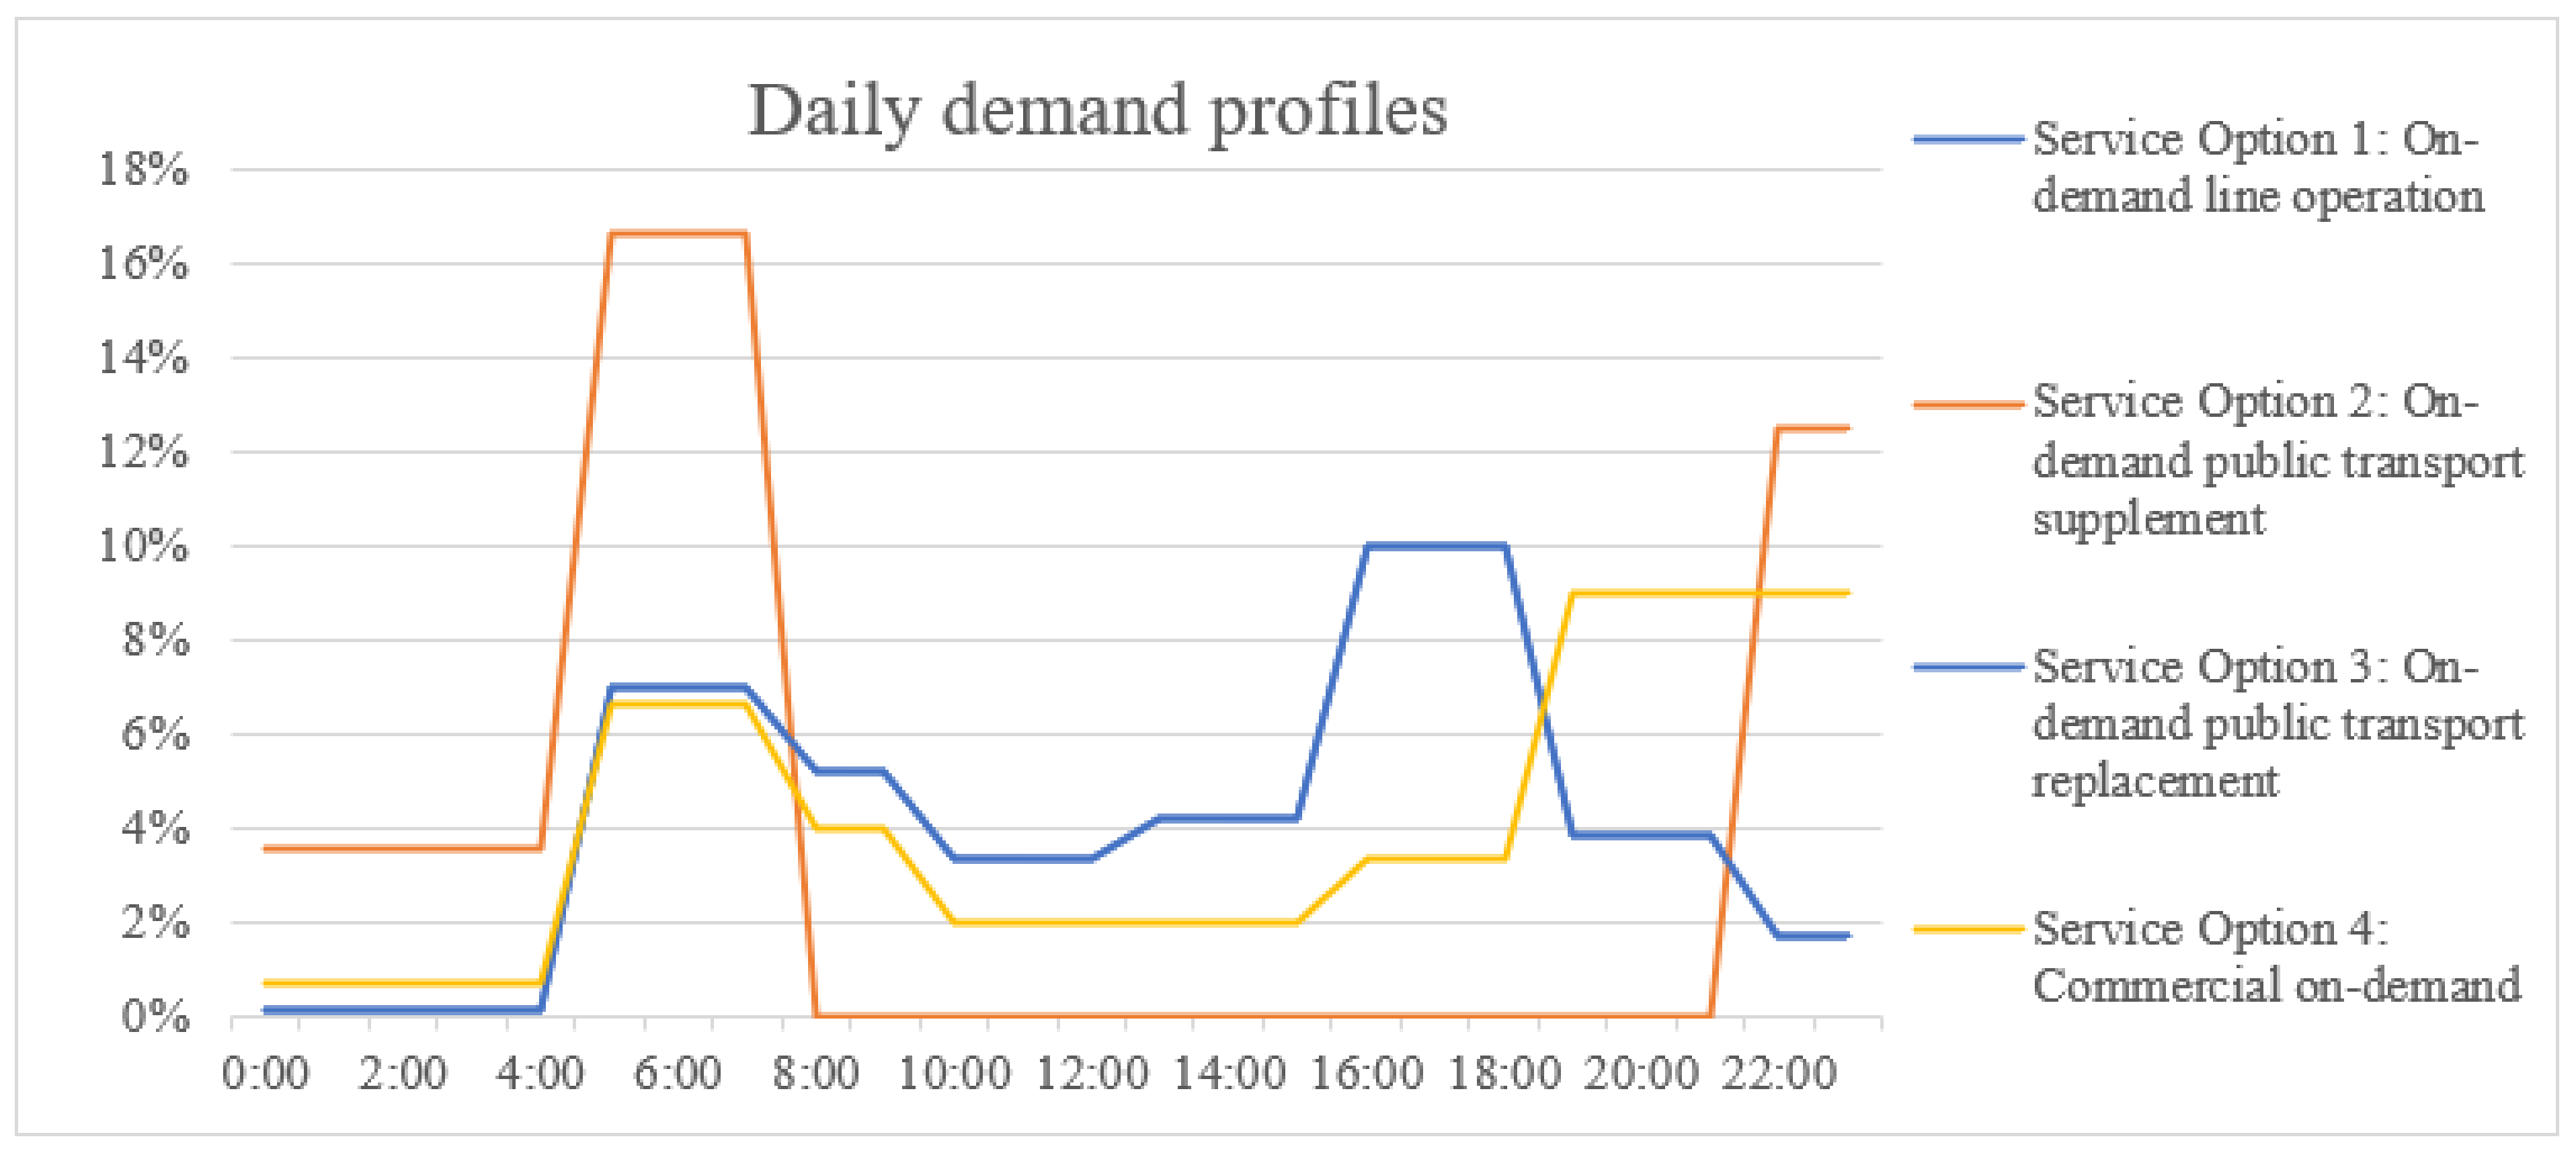
- Daily demand profile: depending on the service option, different assumptions were made for the daily flow of traffic. First, if on-demand collective transport services replace public transport, a typical public transport daily flow of traffic, according to the mobility survey (Mobility and Transport Microcensus) conducted every five years by the Swiss Federal Statistical Office see [59], was used (Service Options 1 and 3). Second, if on-demand services are only offered during off-peak hours, the daily flow of traffic was adjusted to off-peak hours. Third, investigations of on-demand collective transport services in Switzerland and abroad show an atypical course of daily walking compared to other means of transport, e.g., [27], but only if they are used commercially in competition with a public transport offer (see Service Option 4). The daily demand profile (as shown in Figure 3) influences the number of vehicles required and thus the volume of traffic during peak hours.
3.4.3. Environmental Input Variables
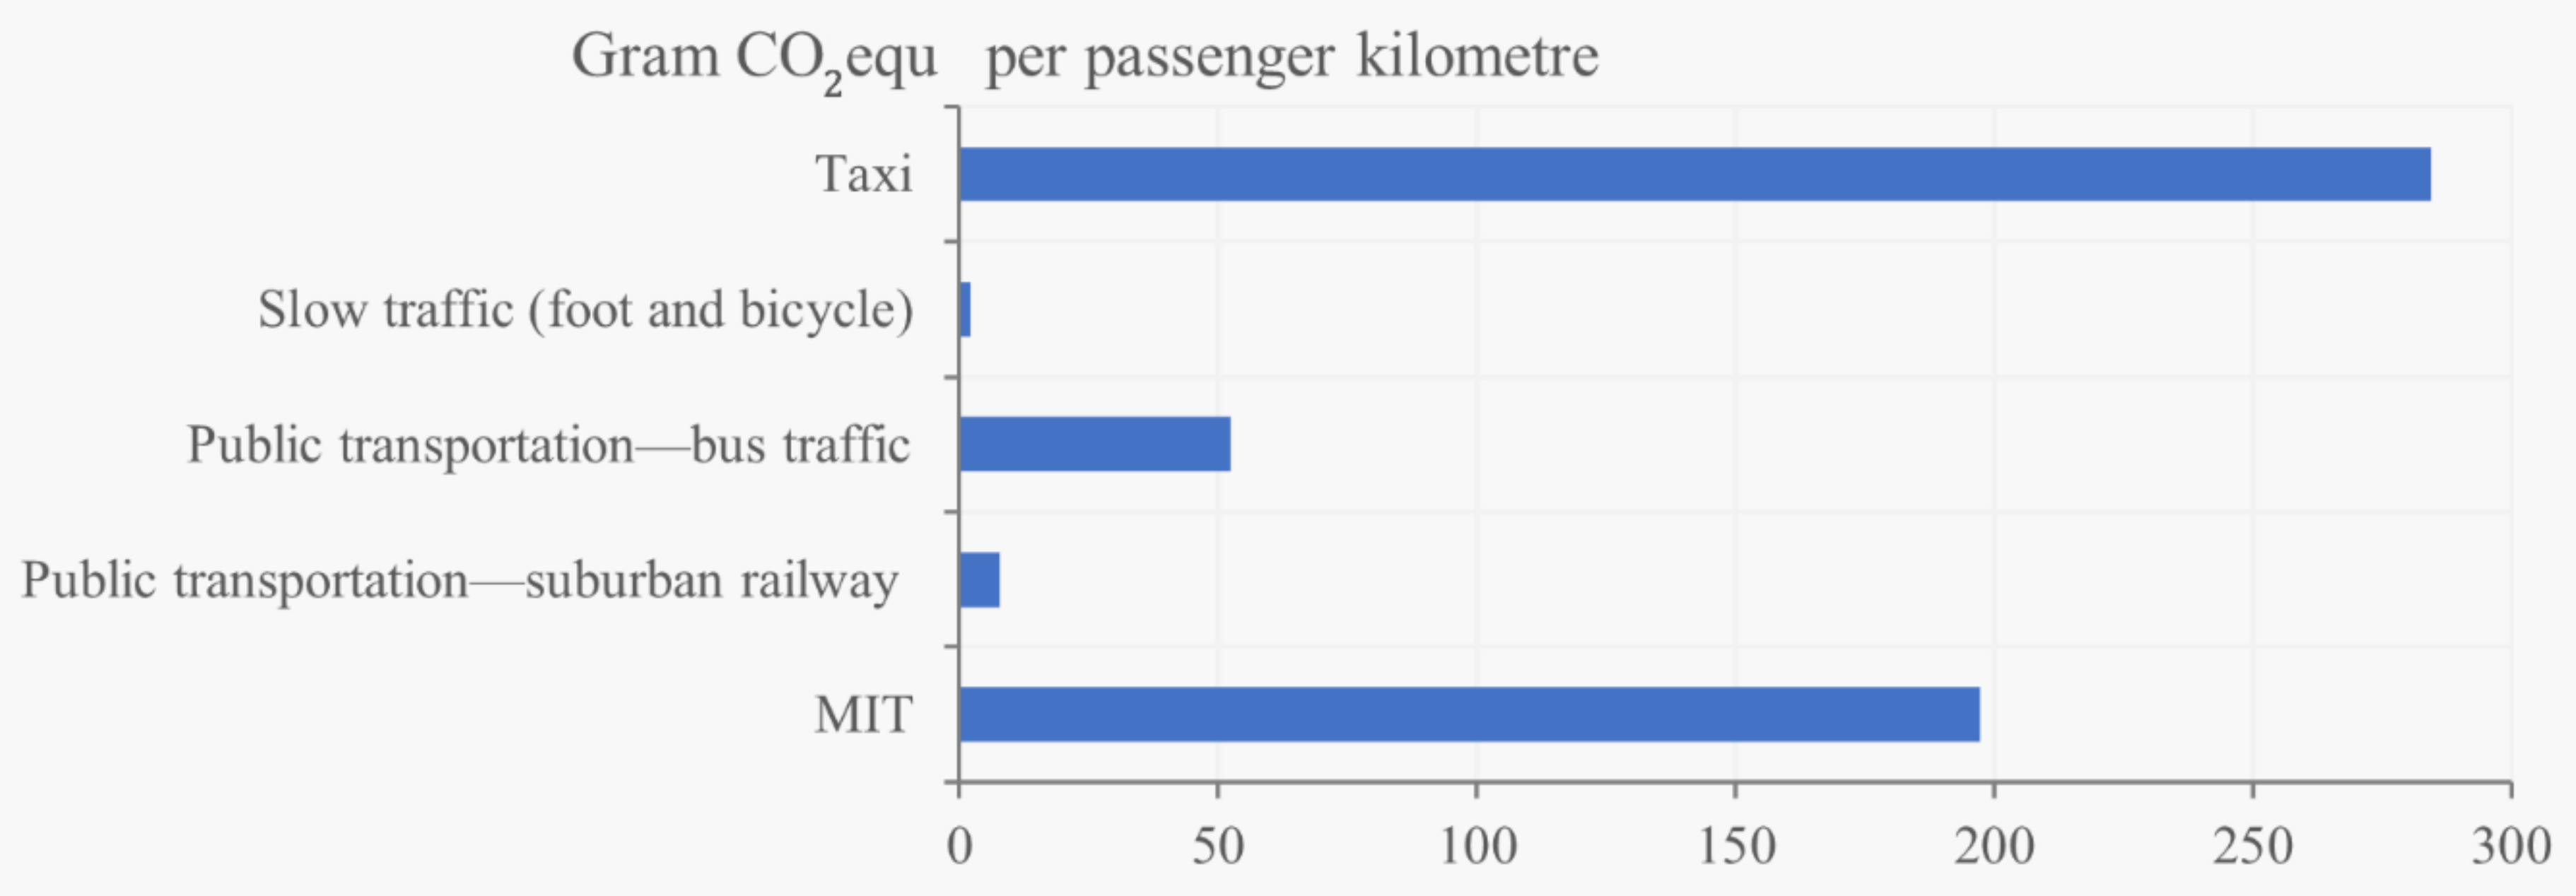
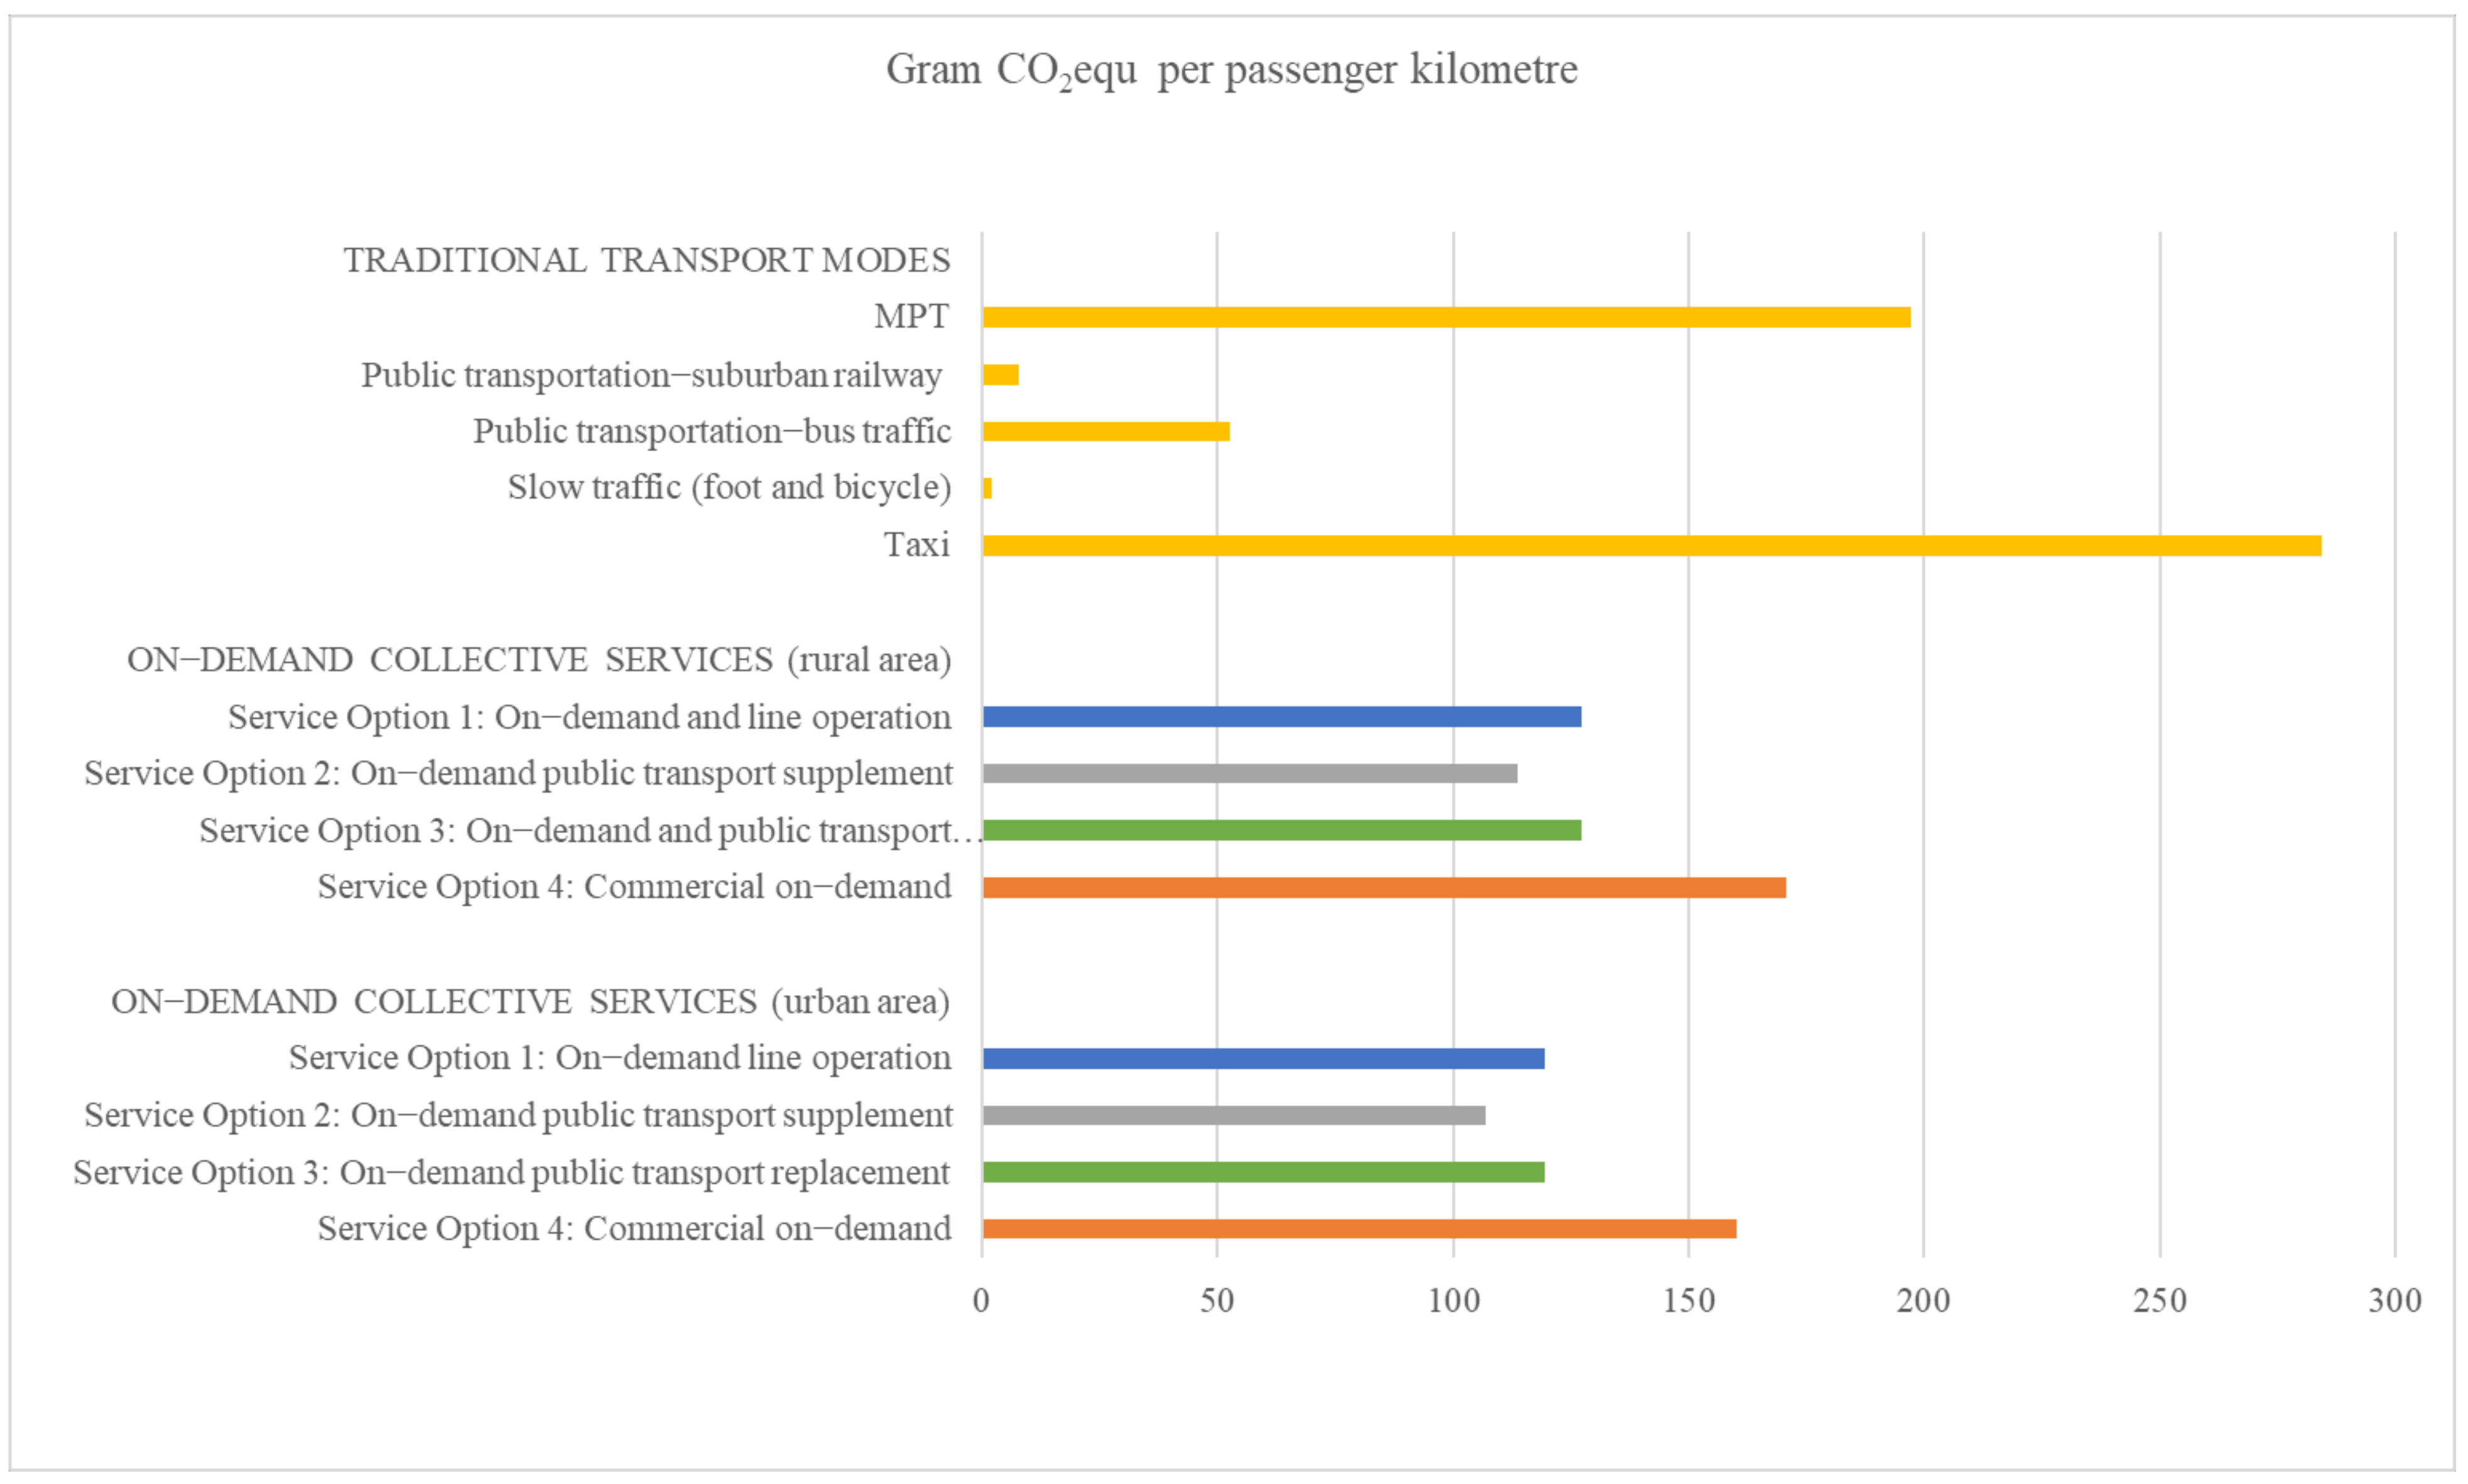
- Grams of CO2equ per passenger kilometre: the values take into account the fuel and electricity consumption per VKM, the use of the means of transport and the drive technology. The current Swiss electricity mix is stored for electrically powered vehicles [60].
- 2.
- Assumptions for on-demand collective services: since no values are stored in the mobitool for on-demand collective driving services, it was assumed that the driving services in Service Options 2 and 4 (standard vehicles) consume the same amount of energy per vehicle kilometre as a private car. For Service Options 1 and 3 (both eight-seater vans) a 50% and 20%, respectively, higher consumption per vehicle kilometre was used, based on the stored vehicle sizes in mobitool. Furthermore, it was assumed that on-demand vehicles included a higher proportion of electric vehicles (25%) and that the average use, at least in Service Options 1–3, is higher than that of a car with 1.6 passengers. Emissions per PKM are negatively influenced by the additional empty kilometres. To calculate CO2 emissions of electric vehicles, the current Swiss electricity mix was used [60].
3.4.4. Market Potential in the Study Area
4. Results
4.1. Traffic Volume

4.2. Ecological Effects
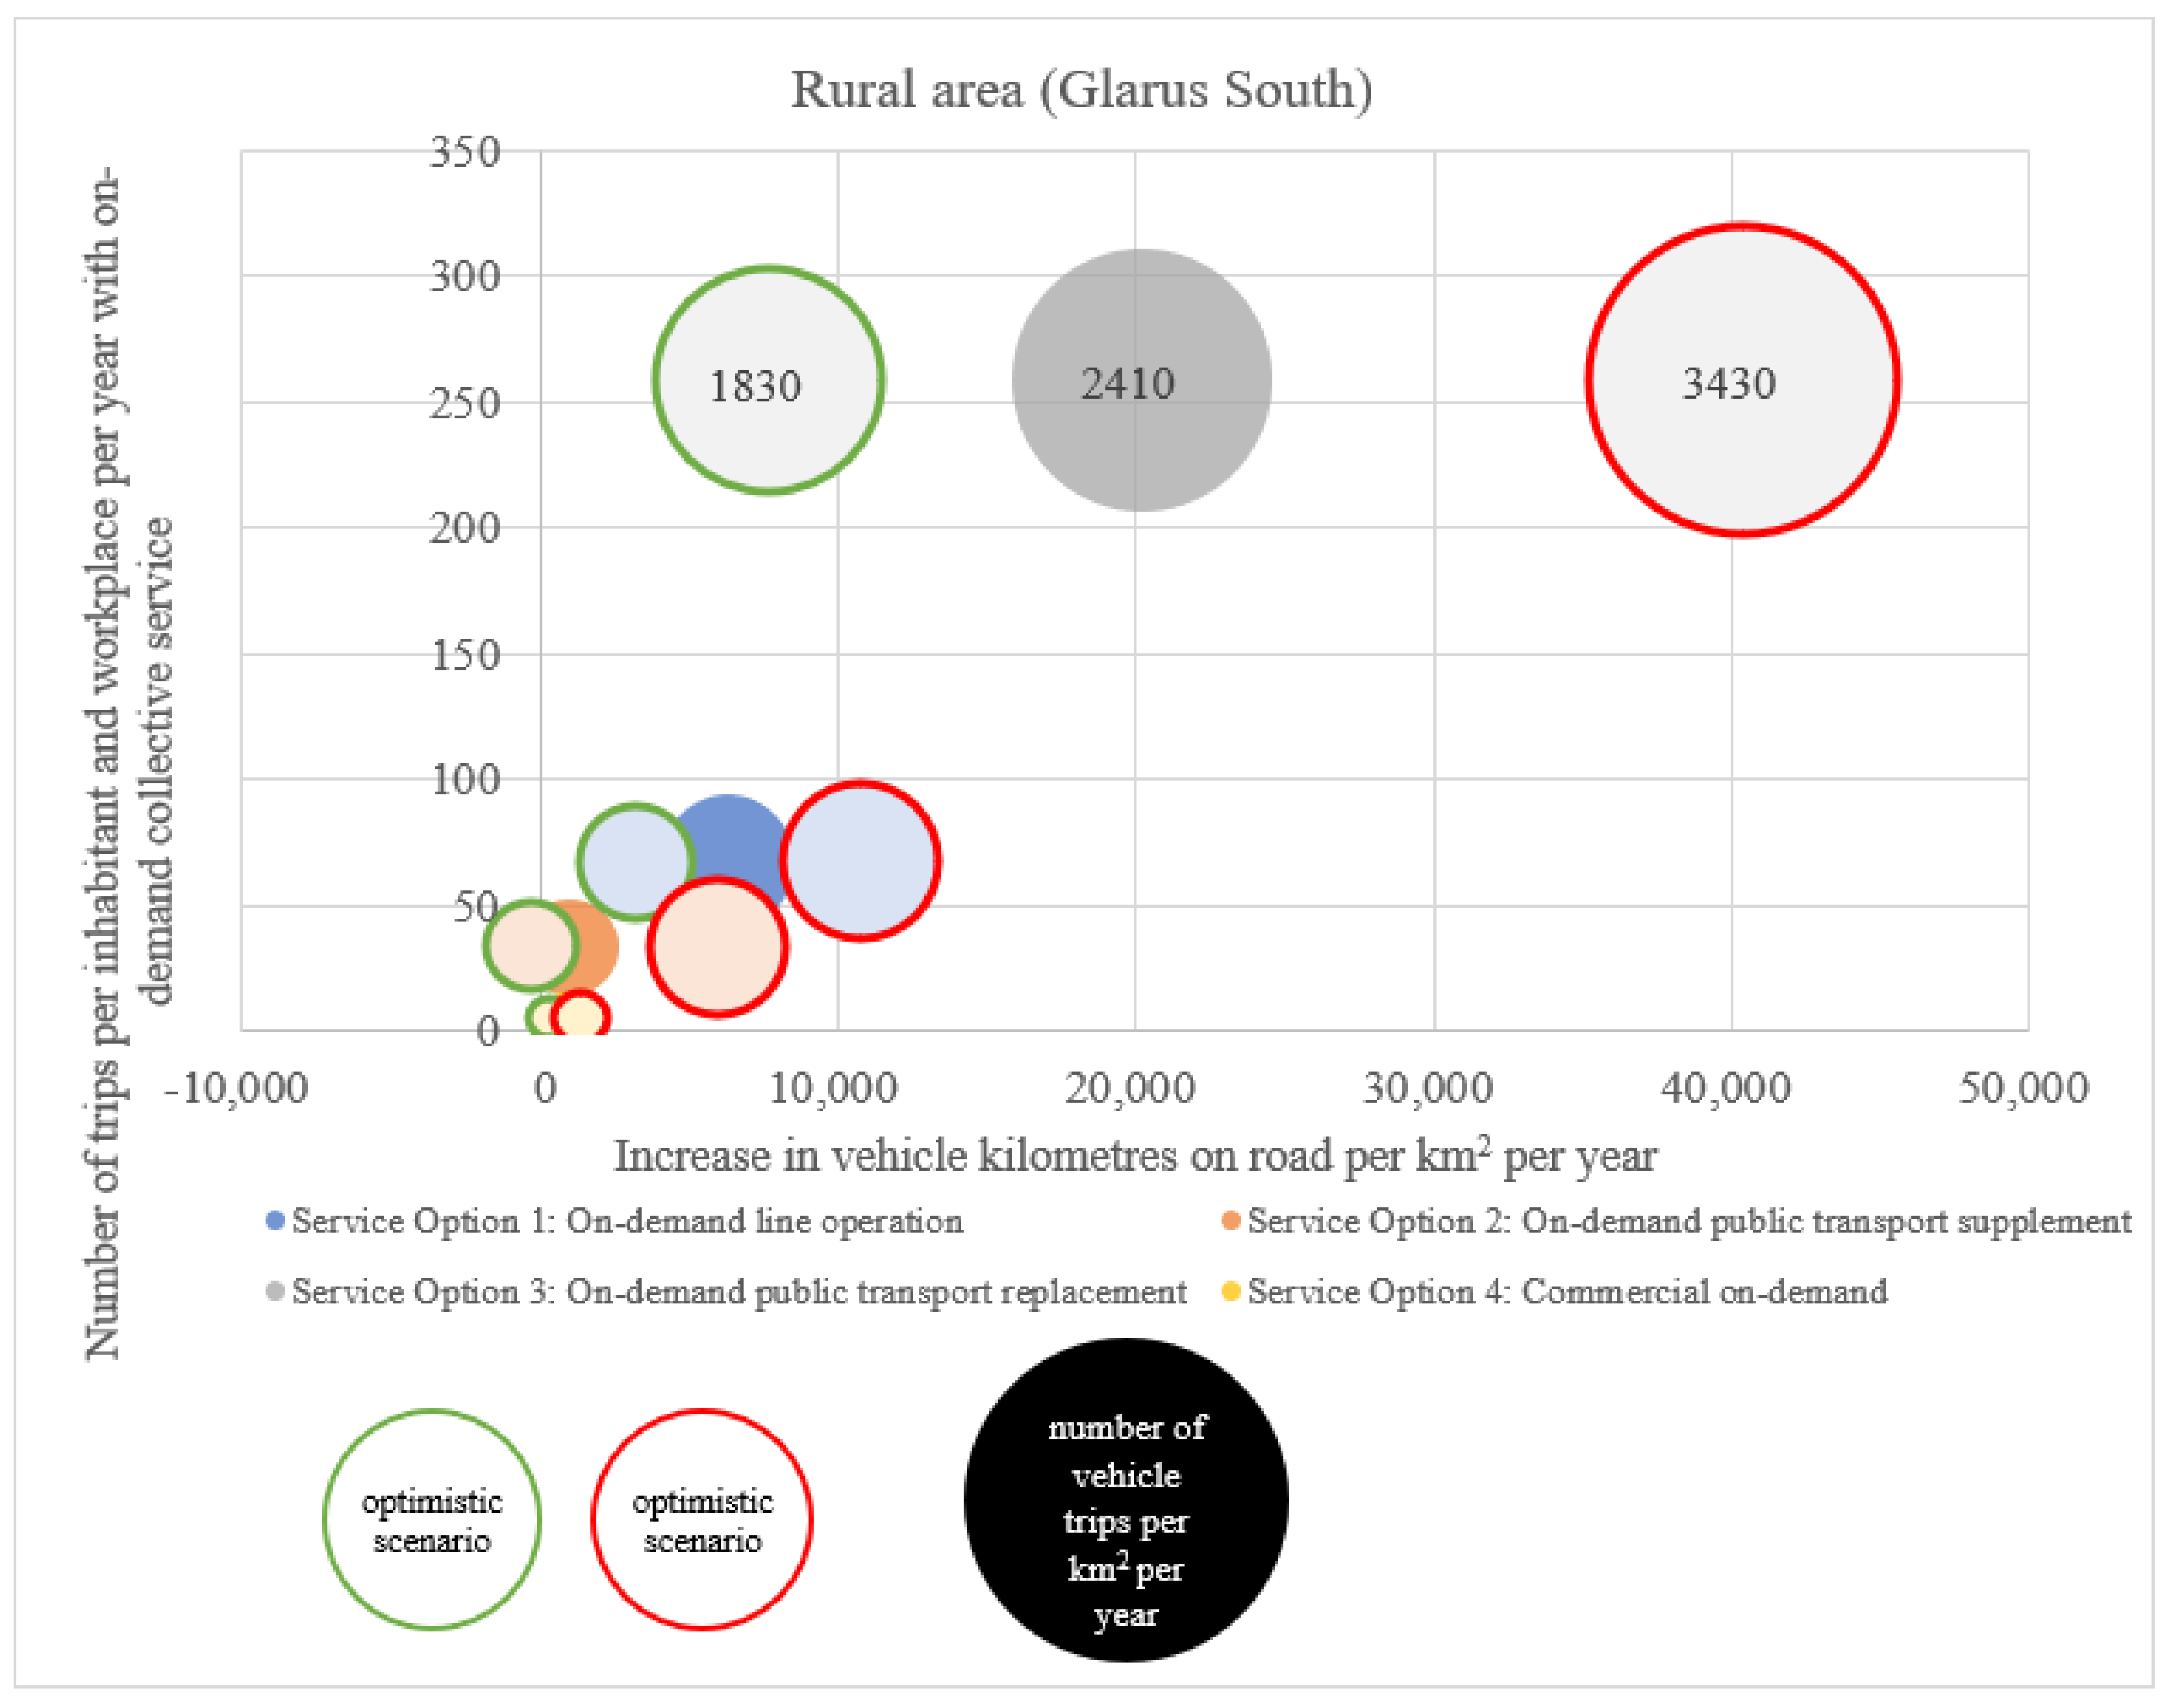
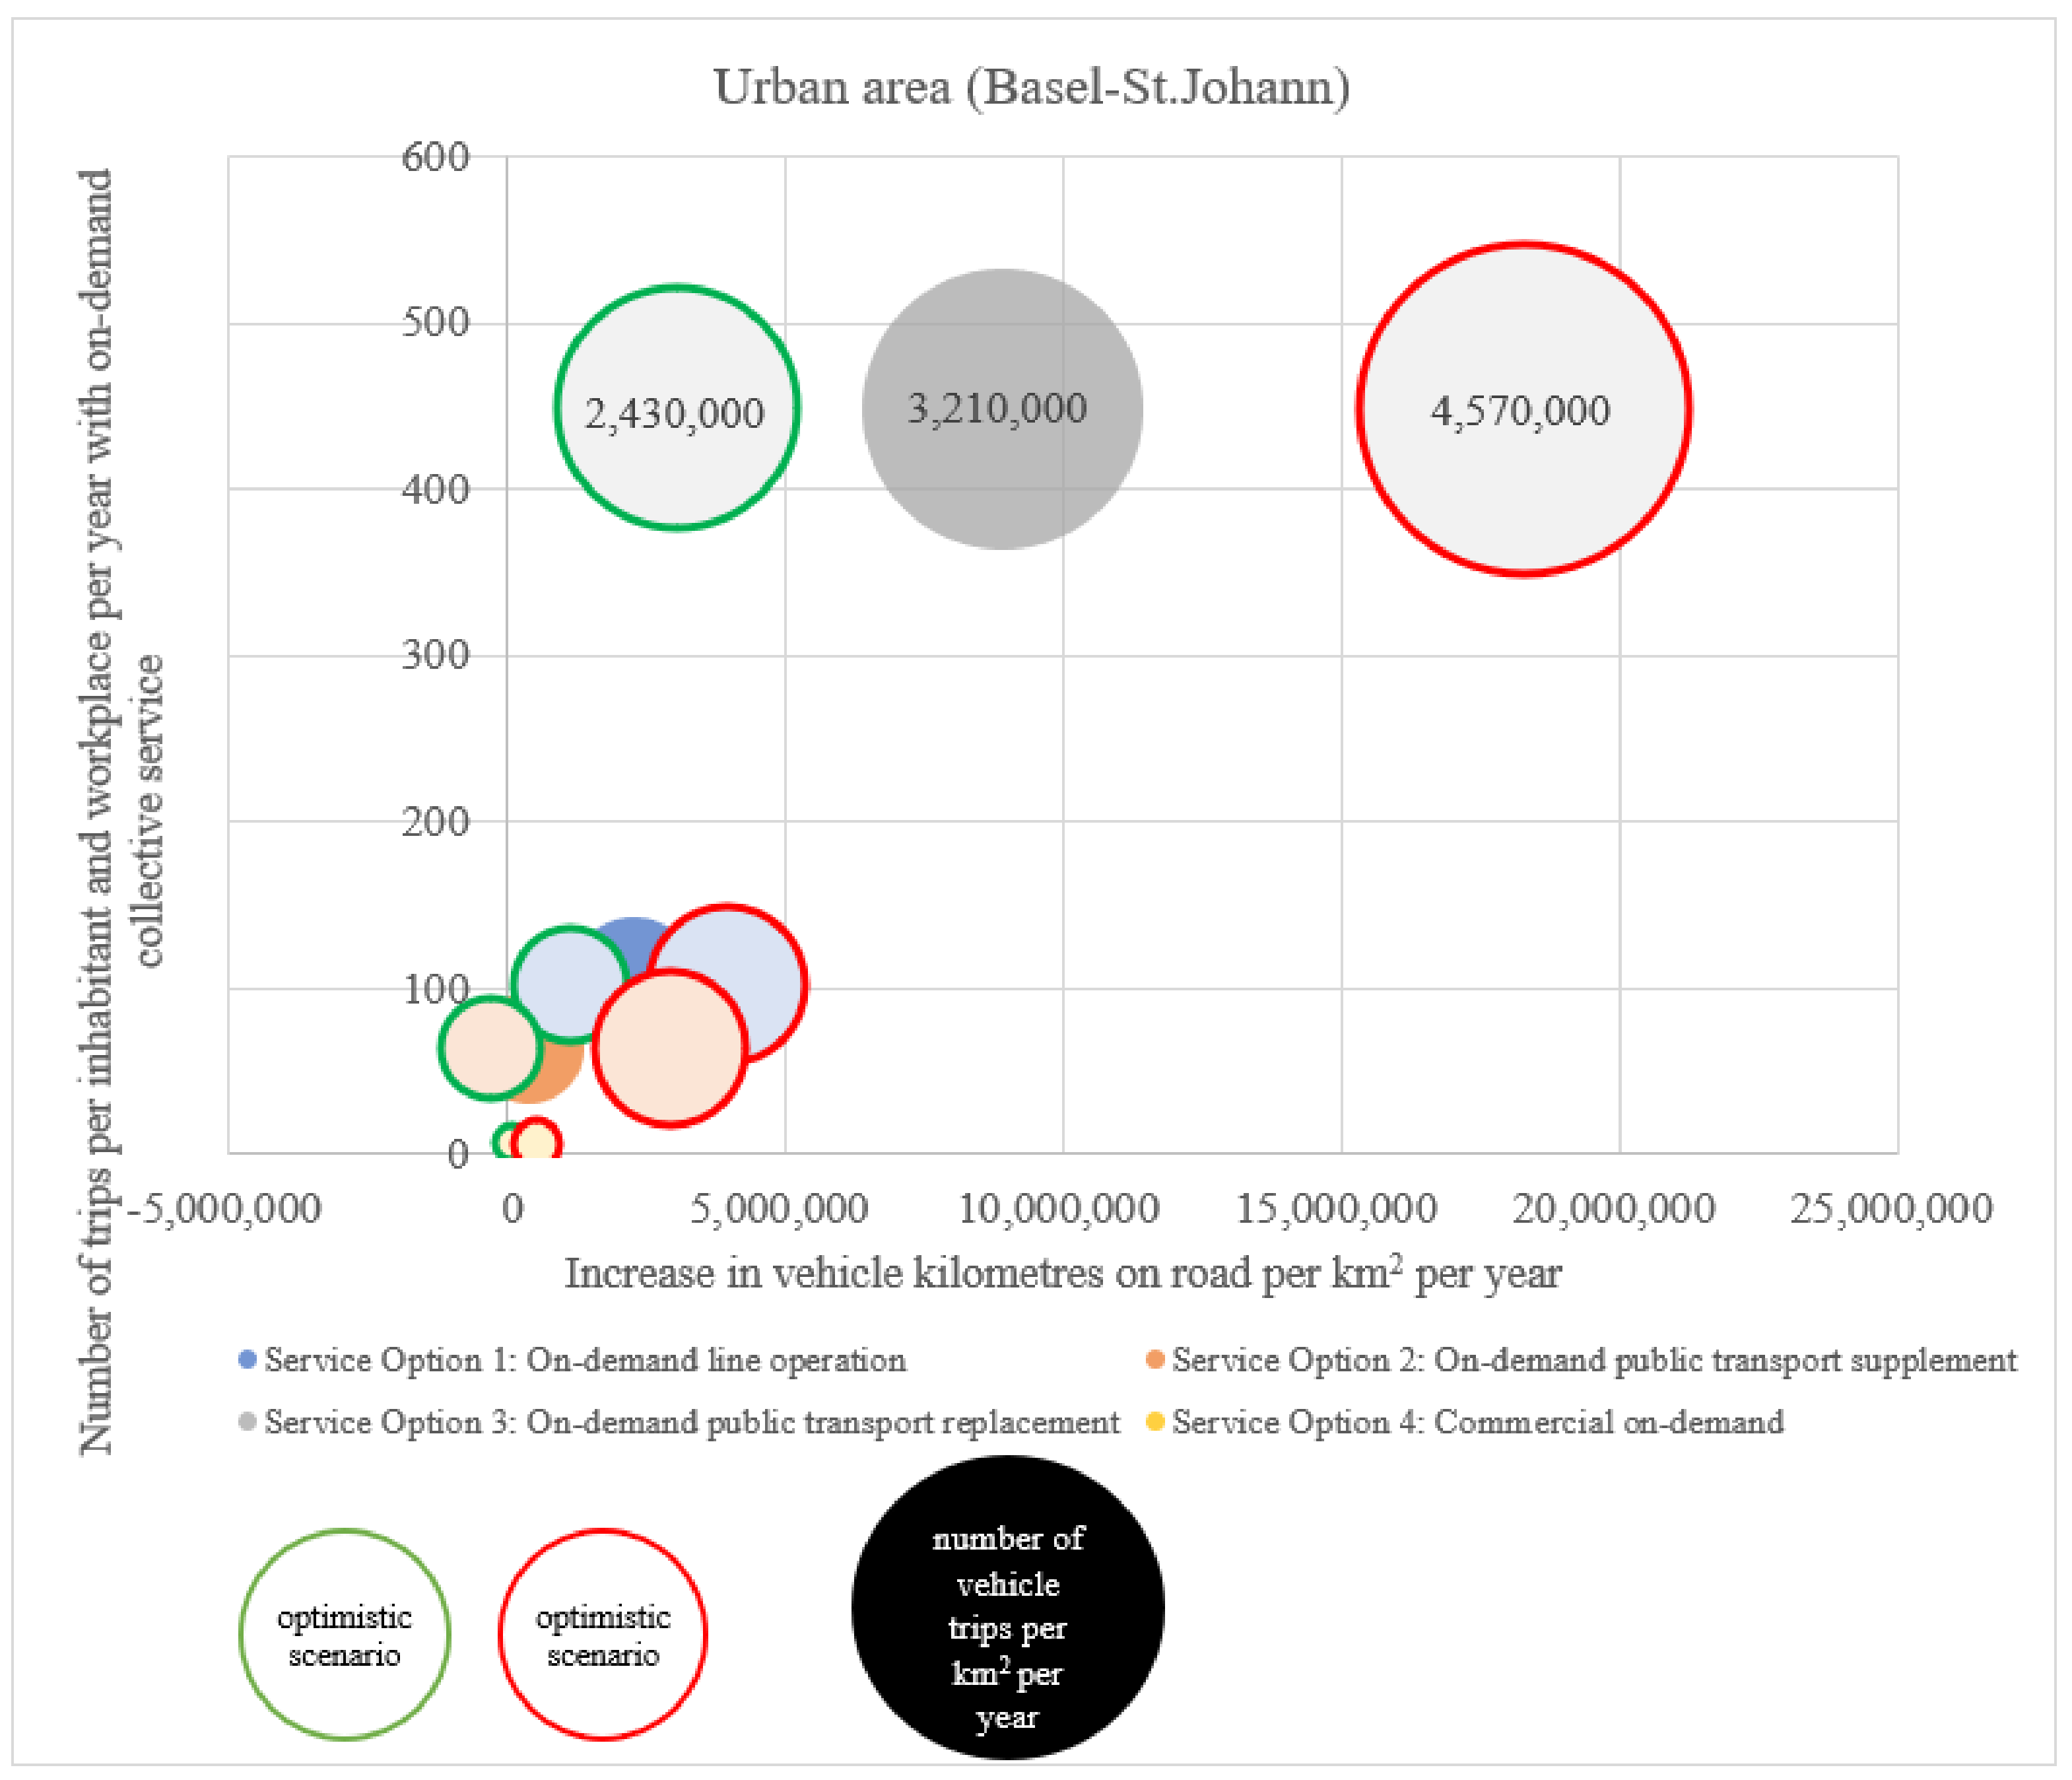
4.3. Sensitivities
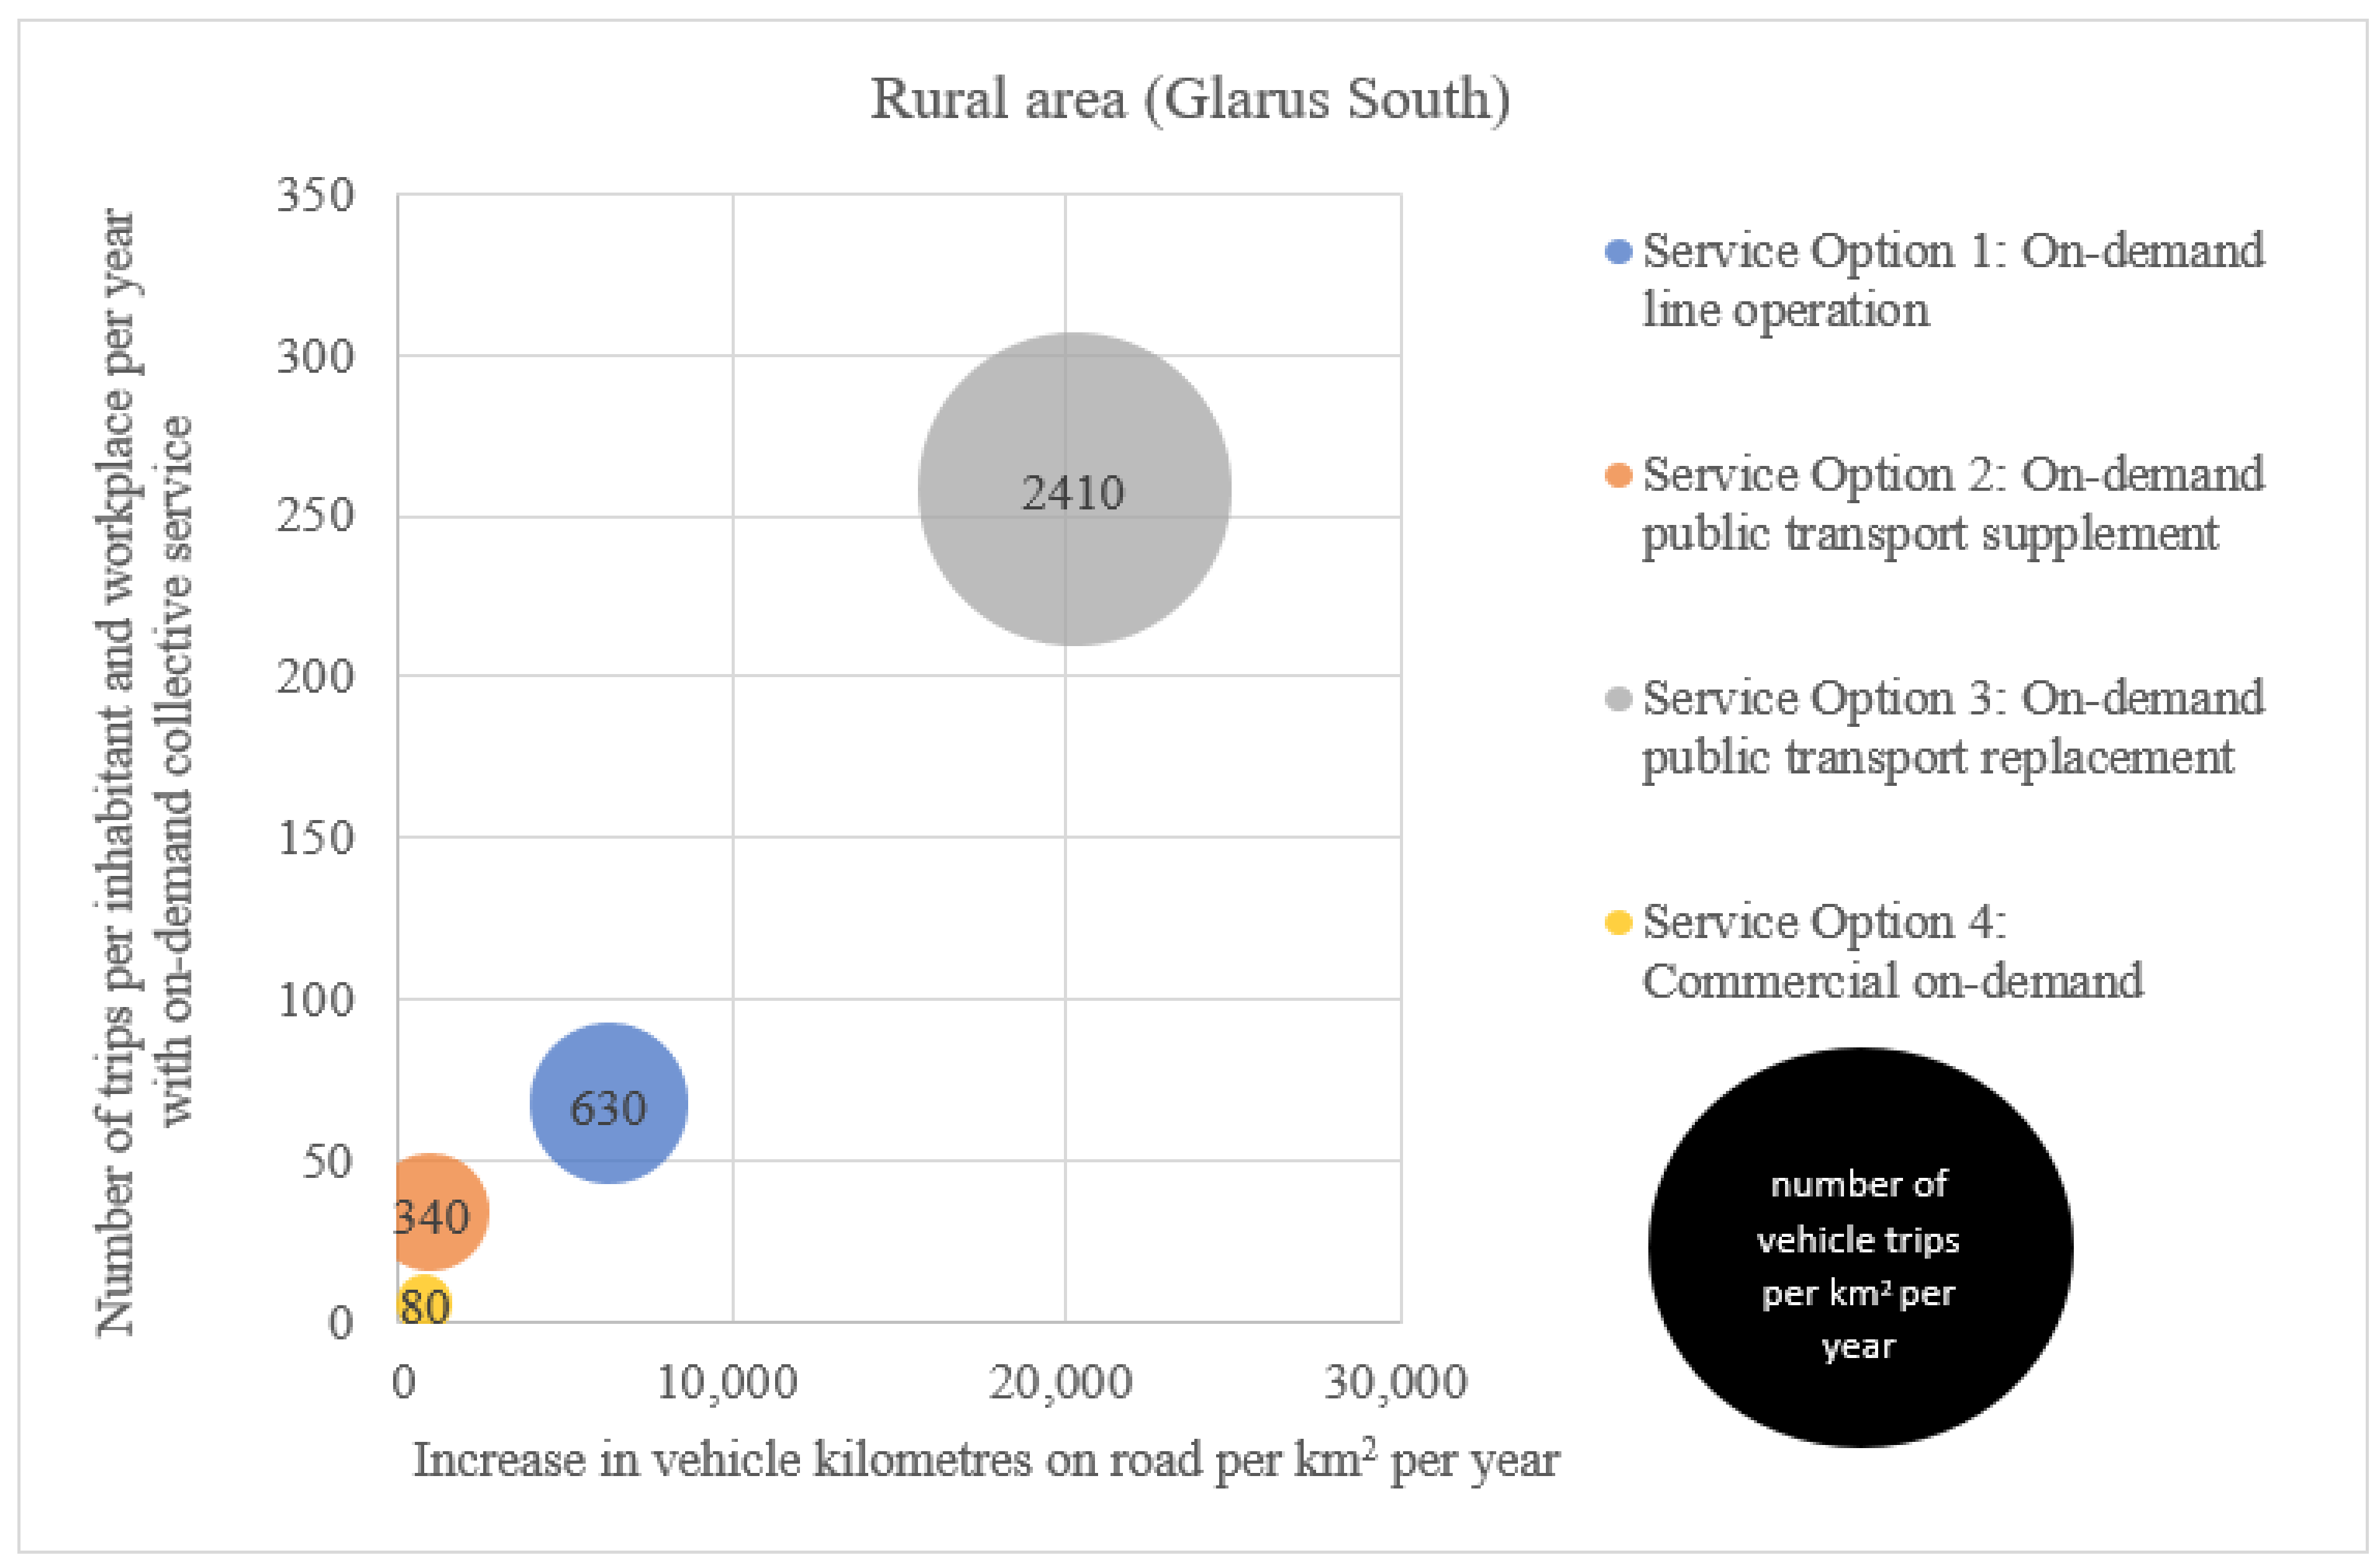
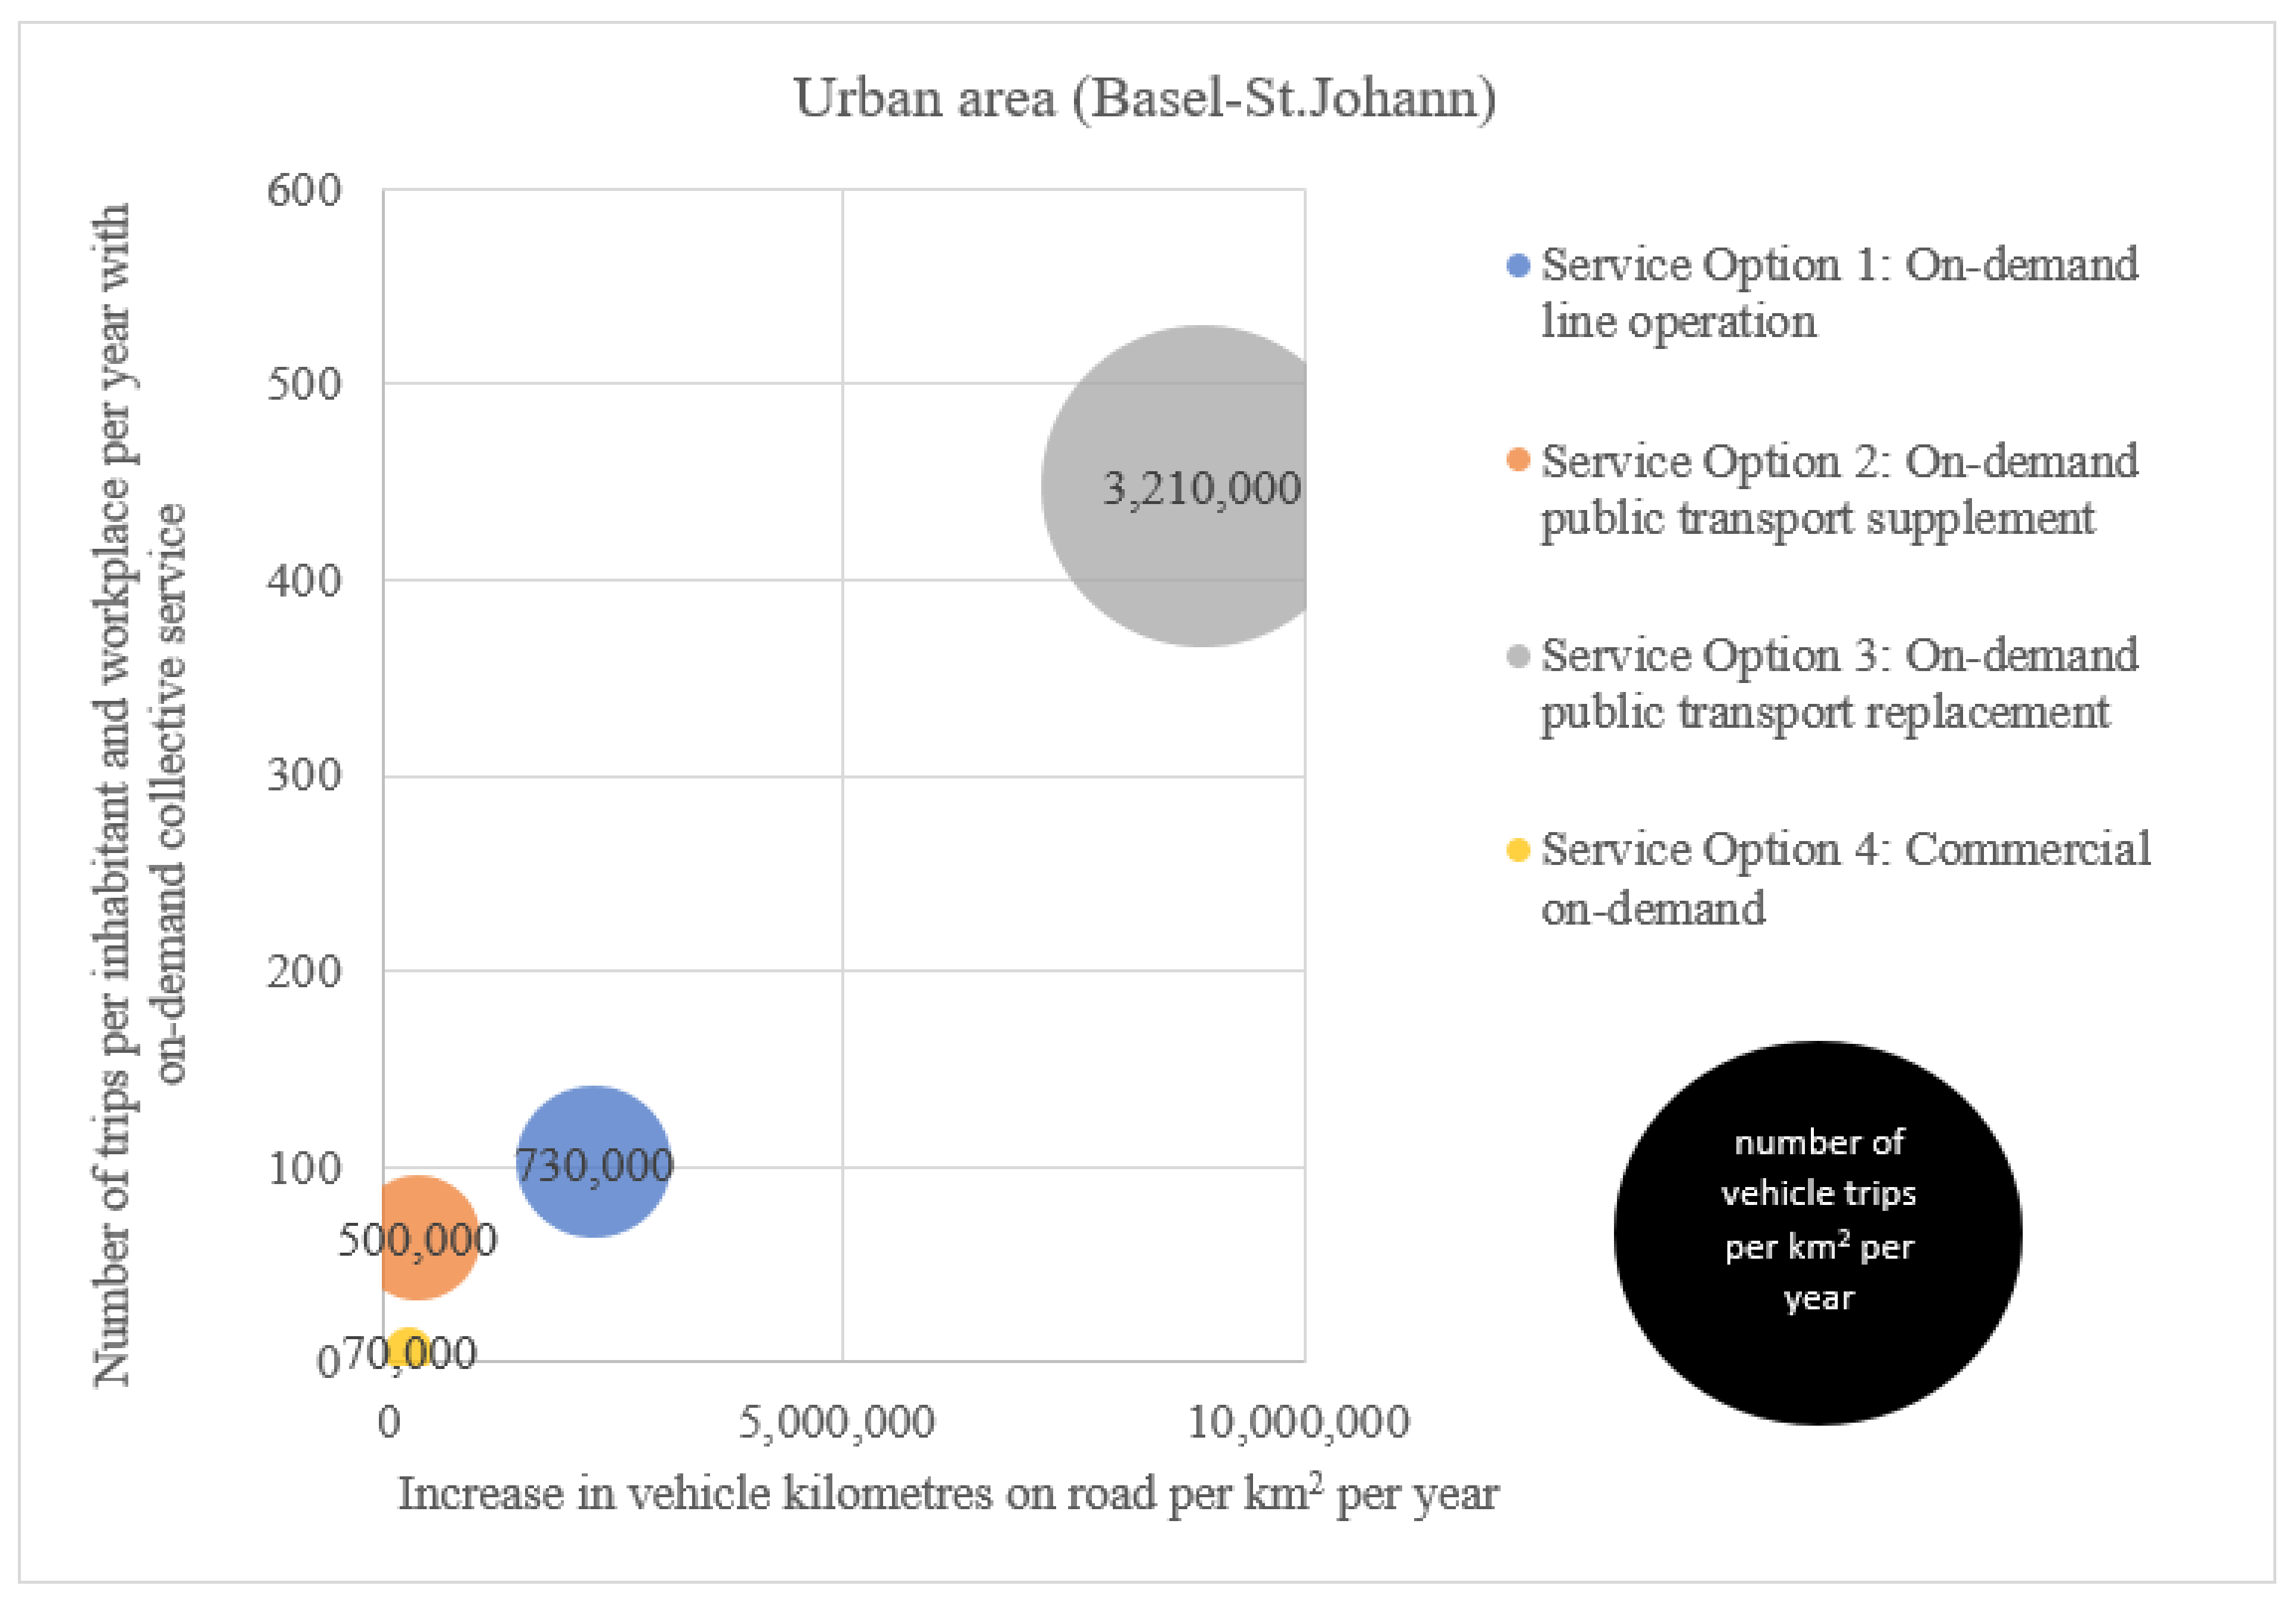
- Traffic volume: even with more optimistic assumptions regarding the above input factors, the introduction of an on-demand collective service is likely to result in an overall increase in road traffic. Nevertheless, the increase in vehicle kilometres on the road per year (see Figure 10 and Figure 11) would be approximately halved for Service Options 1, 3, and 4, compared to the basis scenario in Glarus South and Basel-St. Johann. For Service Option 2 (on-demand collective service as a public transport supplement), a very optimistic average occupancy rate and a high rate of substituted car trips, as undertaken in the optimistic scenario, could even lead to less road traffic overall in both areas. If more pessimistic input factors are used (pessimistic scenario), all service options lead to significantly higher road traffic growth (+50–100%). The increase is particularly large for Service Option 2, where around five to six times more road traffic growth is recorded than in the basis scenario. The sensitivities only have an impact on the total traffic volume, not on the PKM and number of trips per inhabitant and workplace covered by on-demand services per year (y-axis).
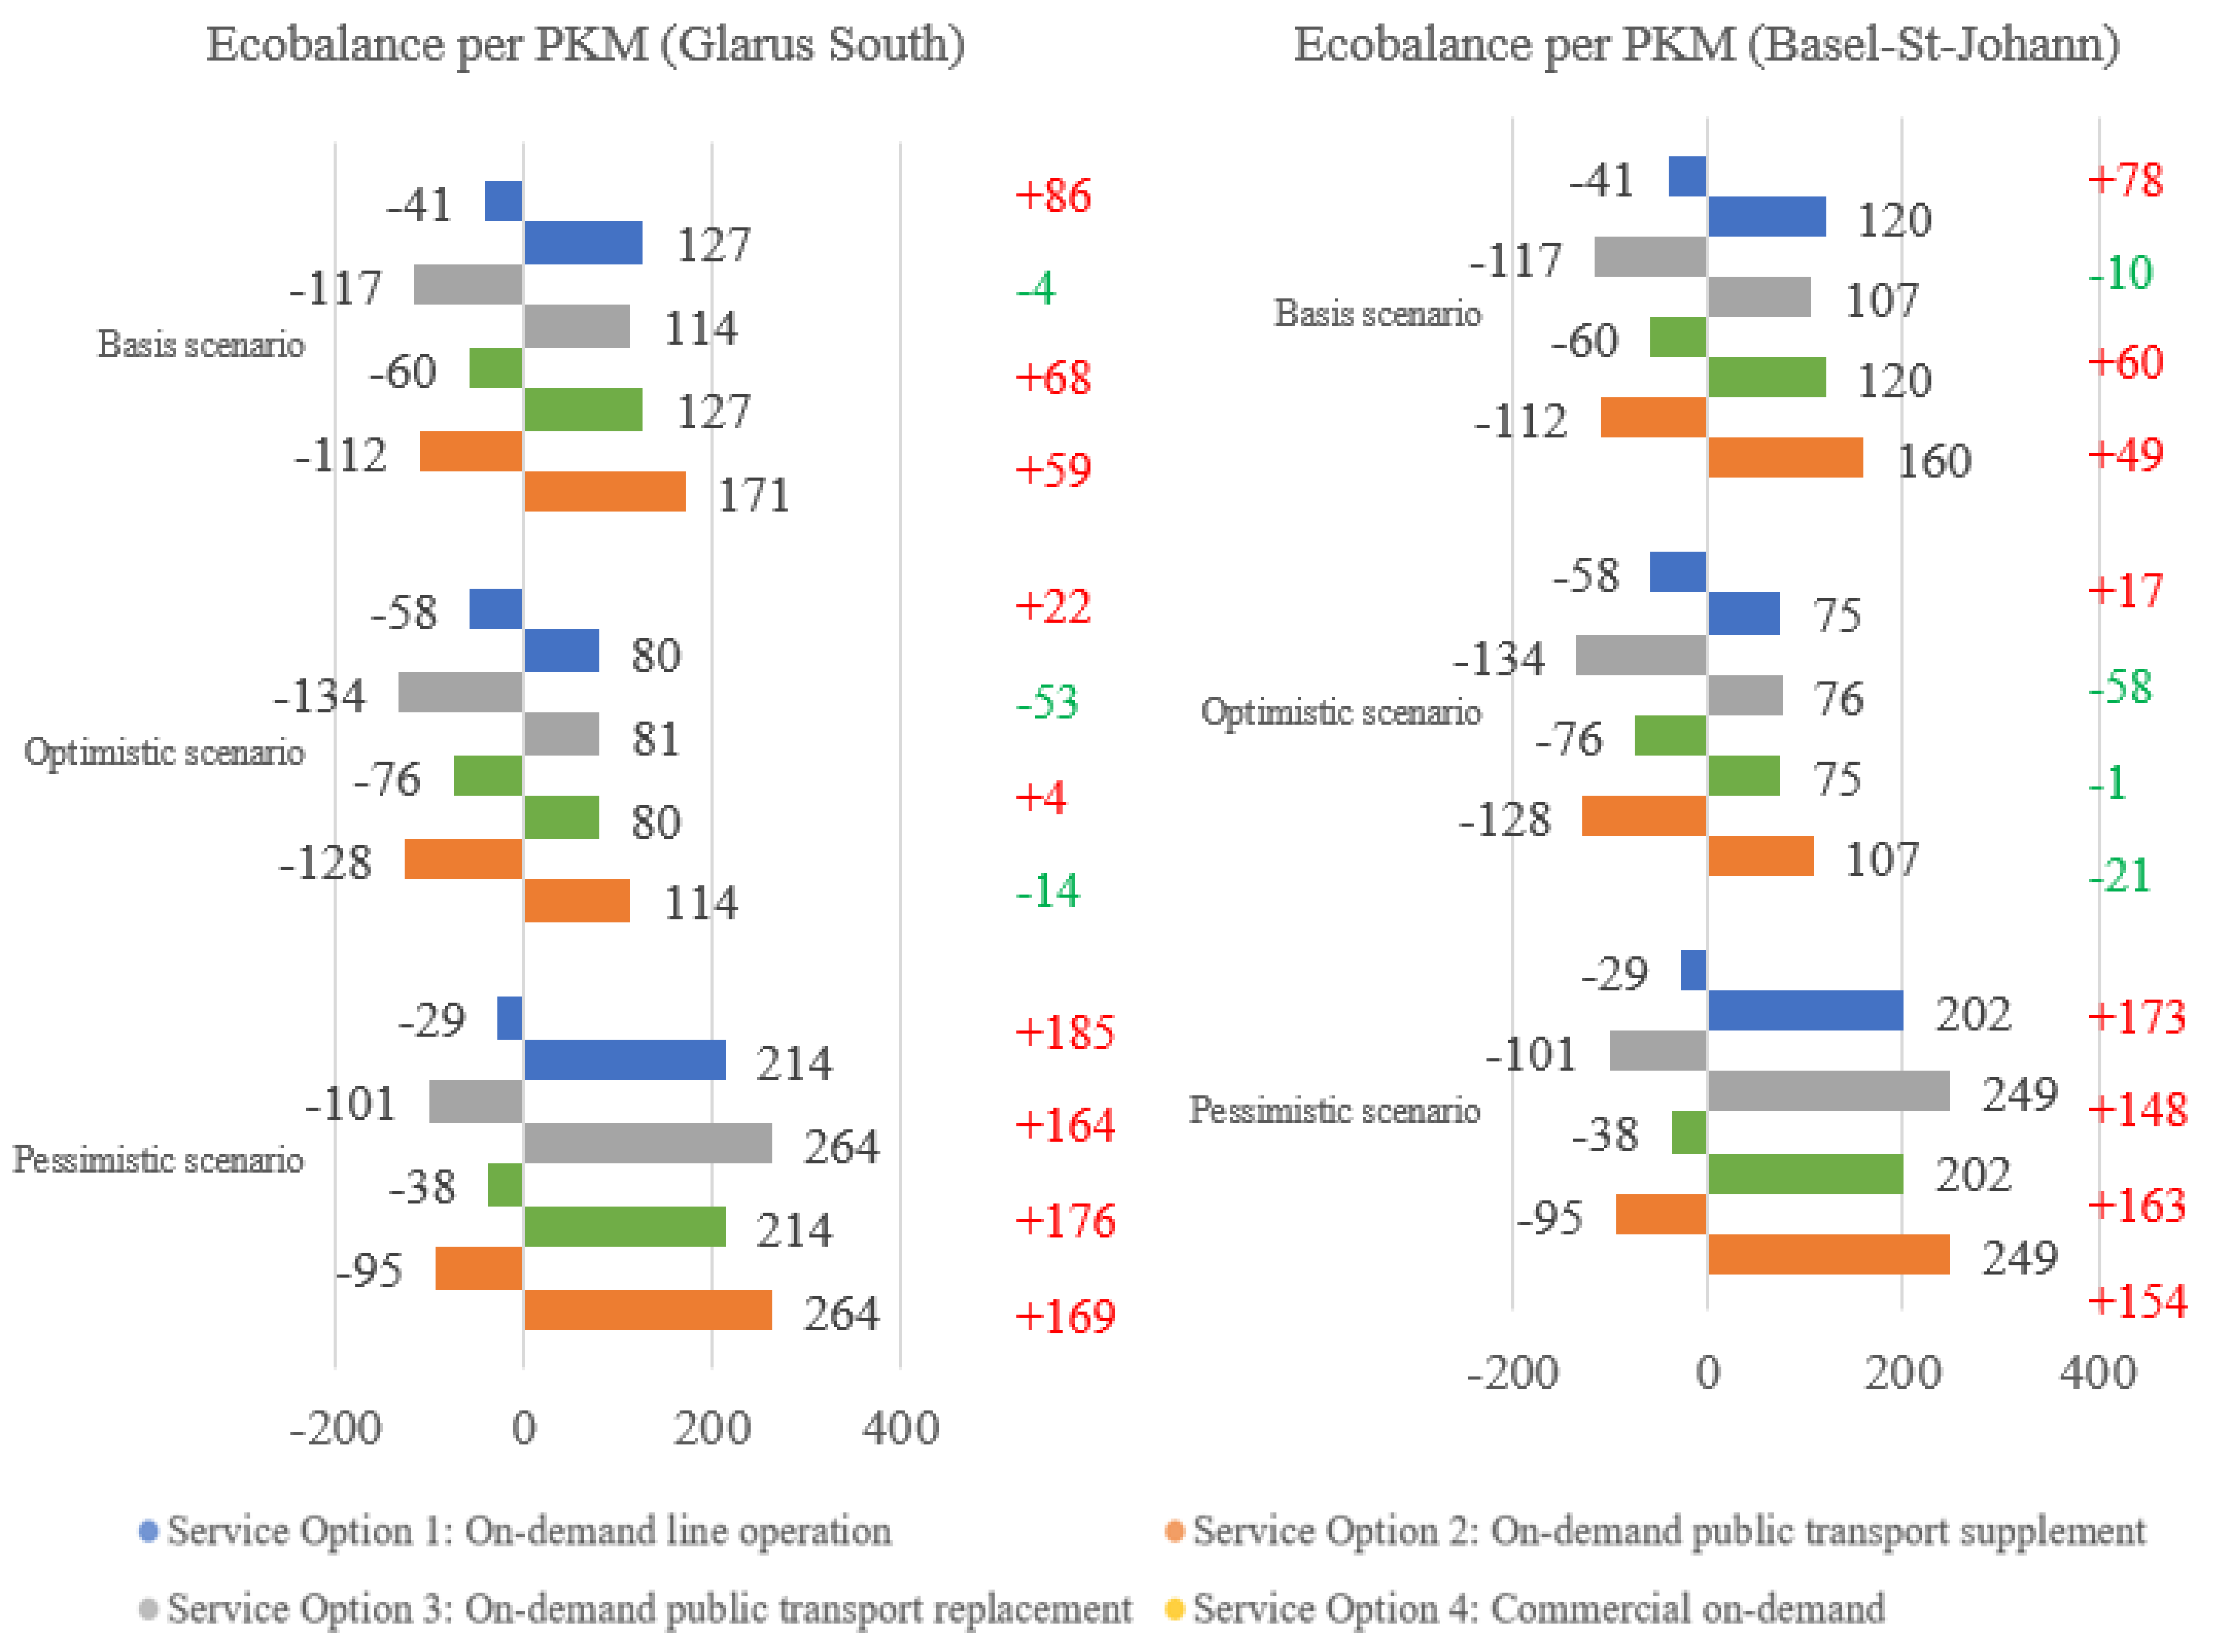
- 2.
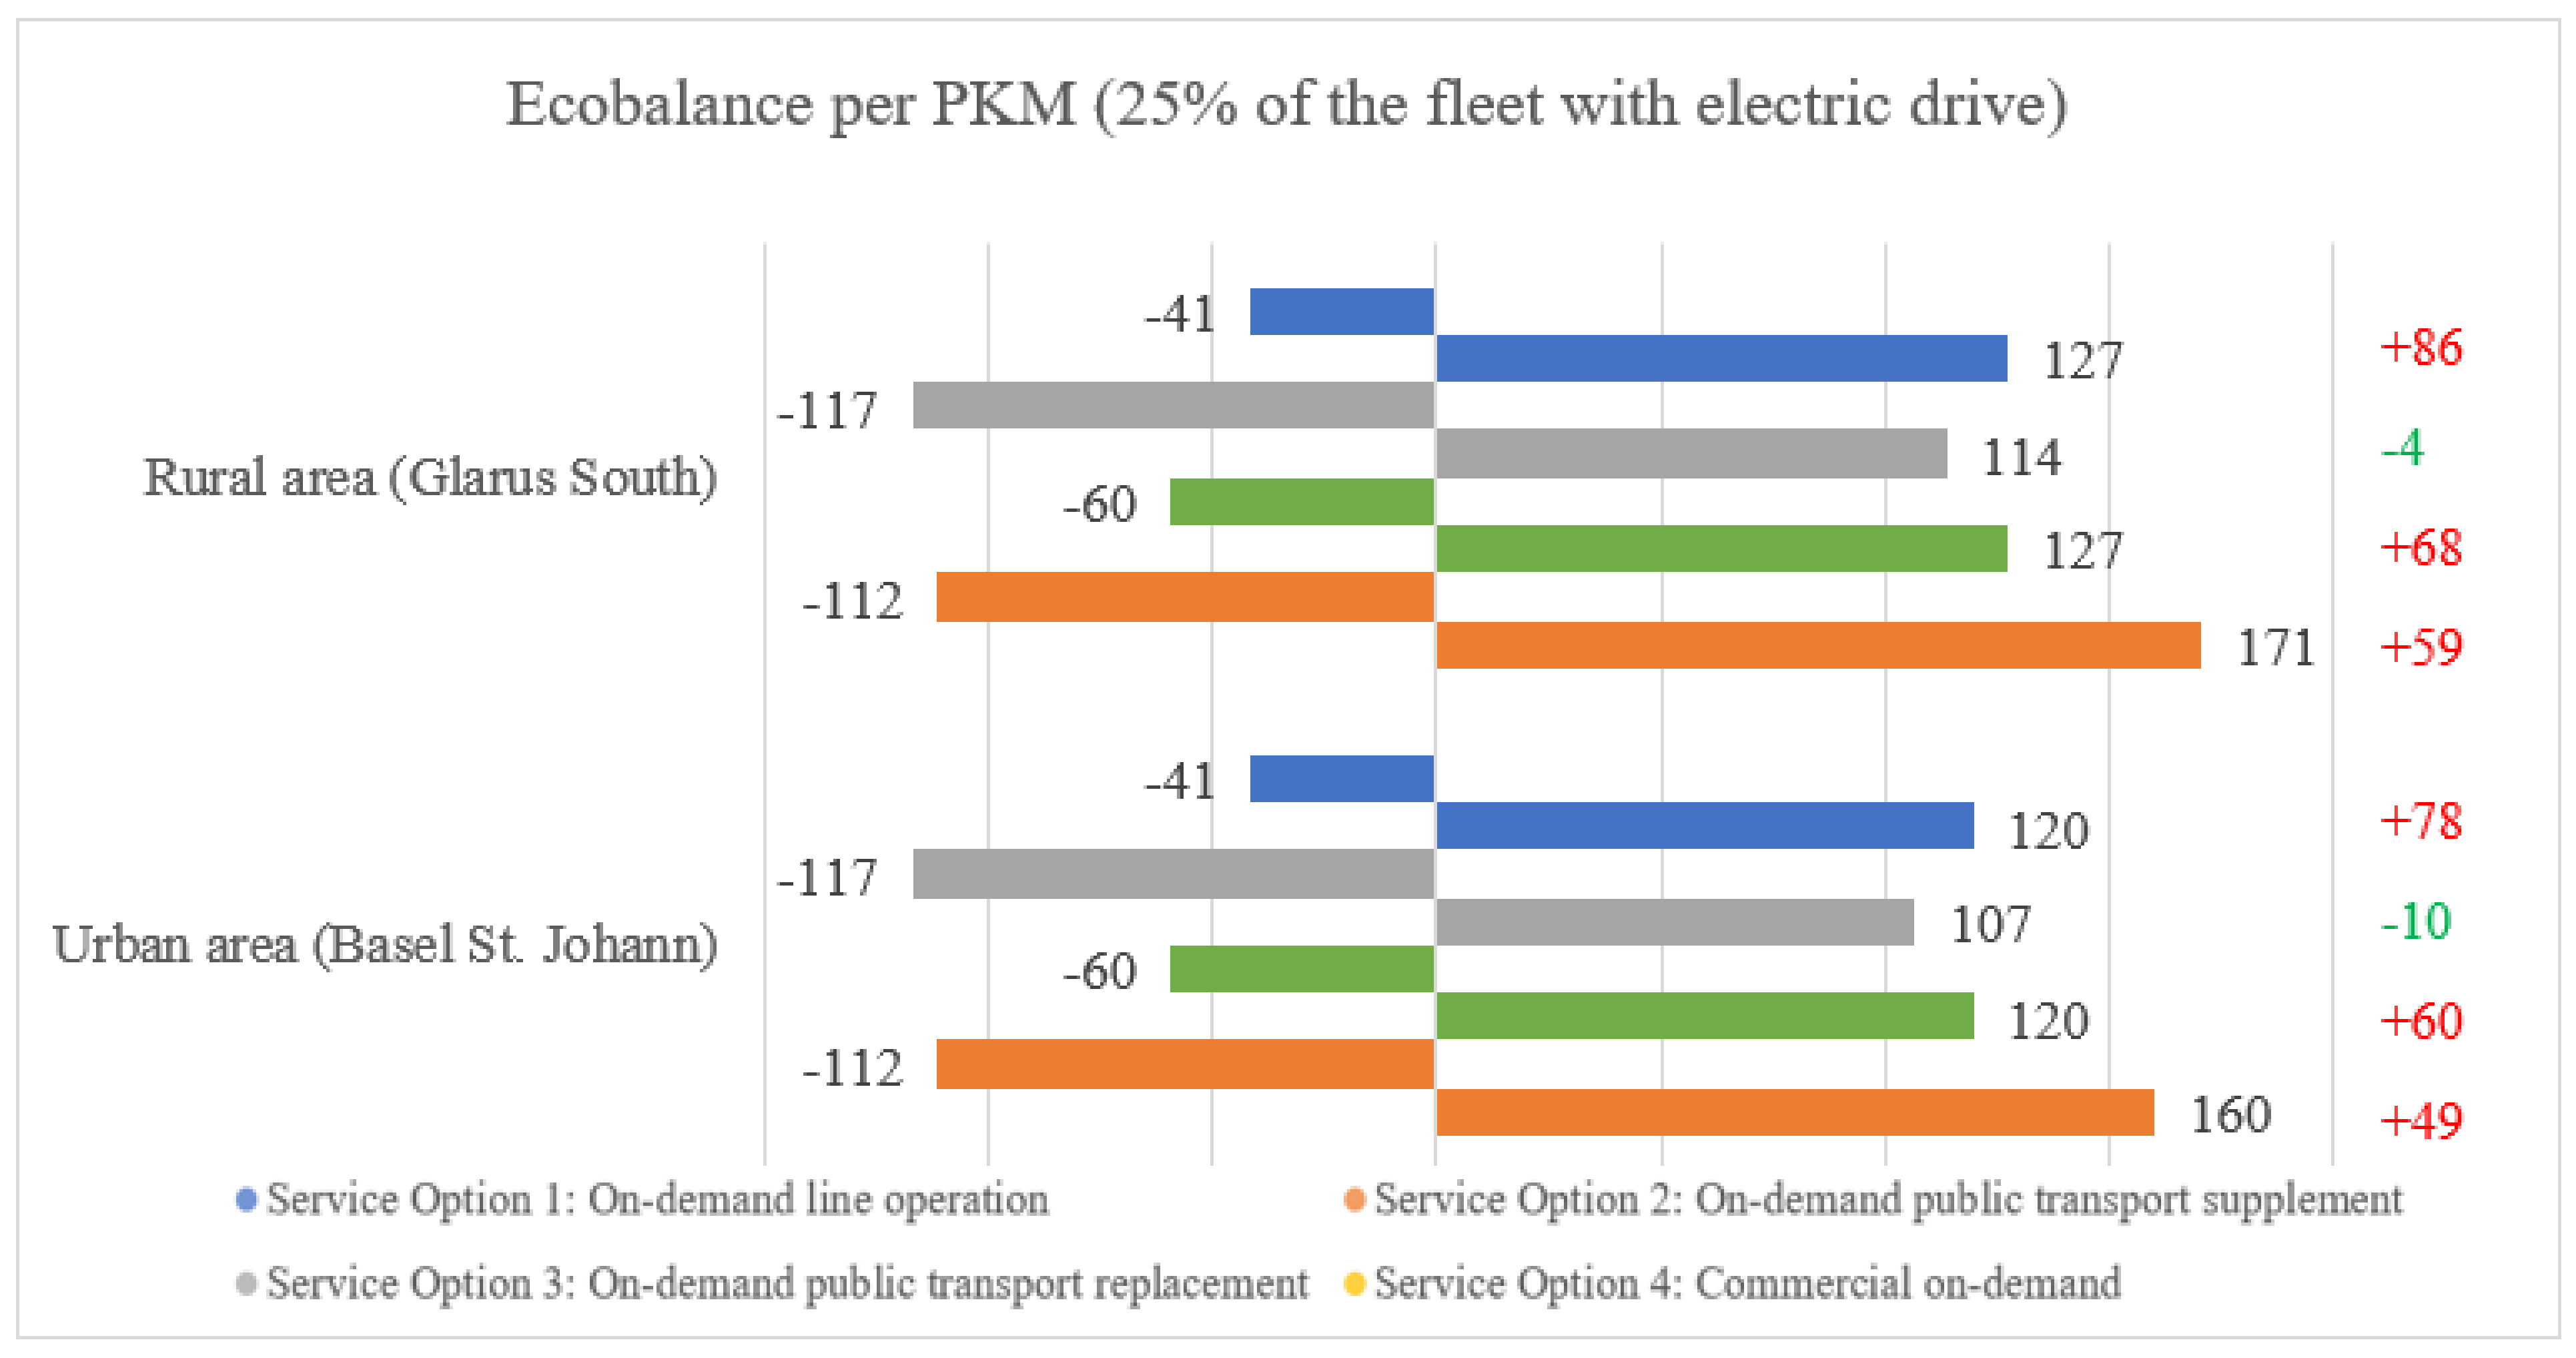
- Ecological effects: the more optimistic assumptions regarding the average occupancy rate, empty runs, modal shift, and share of electric drive would also lead to a positive ecological balance for Service Option 4 (in both areas) and Service Option 3 (in only the urban area) in addition to Service Option 2 (see Figure 12). CO2 emissions per PKM would decrease by around one-third for all four service options. However, Service Option 3 is rather unrealistic in an urban context due to the high increase in road traffic. Assuming more pessimistic assumptions than in the basis scenario, all service options without exception lead to a negative ecobalance; i.e., up to 2.3 times higher CO2 emissions per PKM.
5. Conclusions
5.1. Discussion of Results
- Traffic volume: the modal shift, the average usage and the bundling rate (that is to say, the occupancy rate) have a particularly high influence on the generated traffic. If the majority of trips could be shifted from MPT to the new on-demand mobility services and, at the same time, an average capacity higher than that of a private car could be achieved, there would be positive effects on space and environment. These aspects are particularly important in densely populated areas with high traffic volumes. Conversely, there are negative effects on traffic volume and the environment if many passengers change from large public transport offers with high bundling to minibuses with low bundling.
- Ecological effects: the introduction of on-demand collective transport services leads to less traffic and thus to lower CO2 emissions when making optimistic assumptions regarding the bundling of travel requests, the empty rate and the shift from private cars. The electrification of the vehicle fleet has a major effect, while the average distance per passenger has a small effect.
5.2. Study Limitations
5.3. Avenues for Future Research
Author Contributions
Funding
Data Availability Statement
Conflicts of Interest
References
- Shaheen, S.A.; Lipman, T.E. Reducing greenhouse emissions and fuel consumption: Sustainable approaches for surface transportation. IATSS Res. 2007, 31, 6–20. [Google Scholar] [CrossRef]
- Taiebat, M.; Brown, A.L.; Safford, H.R.; Qu, S.; Xu, M. A review on energy, environmental, and sustainability implications of connected and automated vehicles. Environ. Sci. Technol. 2018, 52, 11449–11465. [Google Scholar] [CrossRef]
- Nigro, A.; Bertolini, L.; Moccia, F.D. Land use and public transport integration in small cities and towns: Assessment methodology and application. J. Transp. Geogr. 2019, 74, 110–124. [Google Scholar] [CrossRef]
- Gil, J.; Duarte, J.P. Tools for evaluating the sustainability of urban design: A review. In Proceedings of the Institution of Civil Engineers-Urban Design and Planning; Institution of Civil Engineers-Urban Design and Planning: London, UK, 2013; Volume 166. [Google Scholar]
- Santos, J.; Ferreira, A.; Flintsch, G. A life cycle assessment model for pavement management: Road pavement construction and management in Portugal. Int. J. Pavement Eng. 2015, 16, 315–336. [Google Scholar] [CrossRef]
- Luers, A.L.; Mastrandrea, M.D.; Hayhoe, K.; Frumhoff, P.C. How to Avoid Dangerous Climate Change: A Target for US Emissions Reductions; Union of Concerned Scientists: Cambridge, MA, USA, 2007. [Google Scholar]
- United Nations Framework Convention on Climate Change. Adoption of the Paris Agreement; United Nations: Paris, France, 2015. [Google Scholar]
- Sgobbo, A.; Basile, M. Sharing sustainability. UPLanD 2017, 2, 255–297. [Google Scholar]
- Kramers, A.; Höjer, M.; Lövehagen, N.; Wangel, J.; Ab, E. ICT for sustainable cities: How ICT can support an environmentally sustainable development in cities. In ICT4S 2013: Proceedings of the First International Conference on Information and Communication Technologies for Sustainability; ETH: Zurich, Switzerland, 2013; pp. 183–188. [Google Scholar]
- Pakusch, C.; Stevens, G.; Boden, A.; Bossauer, P. Unintended effects of autonomous driving: A study on mobility preferences in the future. Sustainability 2018, 10, 2404. [Google Scholar] [CrossRef]
- Wong, Y.Z.; Hensher, D.A.; Mulley, C. Mobility as a service (MaaS): Charting a future context. Transp. Res. Part A Policy Pract. 2020, 131, 5–19. [Google Scholar] [CrossRef]
- Clewlow, R.R.; Mishra, G.S. The Adoption, Utilization, and Impacts of Ride-Hailing in the United States; Institute of Transportation Studies, University of California: Davis, CA, USA, 2017. [Google Scholar]
- Fagnant, D.J.; Kockelman, K.M.; Bansal, P. Operations of shared autonomous vehicle fleet for Austin, Texas, market. Transp. Res. Rec. 2015, 2563, 98–106. [Google Scholar] [CrossRef]
- Rayle, L.; Dai, D.; Chan, N.; Cervero, R.; Shaheen, S. Just a better taxi? A survey-based comparison of taxis, transit, and ridesourcing services in San Francisco. Transp. Policy 2016, 45, 168–178. [Google Scholar] [CrossRef]
- Walker, W.E.; Marchau, V.A. Dynamic adaptive policymaking for the sustainable city: The case of automated taxis. Int. J. Transp. Sci. Technol. 2017, 6, 1–12. [Google Scholar] [CrossRef]
- Chin, V.; Jaafar, M.; Moy, J.; Phong, M.; Wang, S.; McDonnell, M.; Prawiradinata, I. Unlocking Cities: The Impact of Ridesharing in Southeast Asia and Beyond; The Boston Consulting Group: Kuala Lumpur, Malysia, 2017. [Google Scholar]
- Krueger, R.; Rashidi, T.H.; Rose, J.M. Preferences for shared autonomous vehicles. Transp. Res. Part C Emerg. Technol. 2016, 69, 343–355. [Google Scholar] [CrossRef]
- Suatmadi, A.Y.; Creutzig, F.; Otto, I.M. On-demand motorcycle taxis improve mobility, not sustainability. Case Stud. Transp. Policy 2019, 7, 218–229. [Google Scholar] [CrossRef]
- Trommer, S.; Kolarova, V.; Fraedrich, E.; Kröger, L.; Kickhöfer, B.; Kuhnimhof, T.; Lenz, B.; Phleps, P. Autonomous Driving: The Impact of Vehicle Automation on Mobility Behaviour. Institute for Mobility Research. 2016. Available online: https://elib.dlr.de/110337/1/ifmo_2016_Autonomous_Driving_2035_en.pdf (accessed on 27 February 2021).
- Röth, T.; Pielen, M.; Wolff, K.; Lüdiger, T. Urban vehicle concepts for the shared mobility. ATZ Worldw. 2018, 120, 18–23. [Google Scholar] [CrossRef]
- Cuevas, V.; Estrada, M.; Salanova, J.M. Management of on-demand transport services in urban contexts. Barcelona case study. Transp. Res. Procedia 2016, 13, 155–165. [Google Scholar] [CrossRef]
- Mehlert, C.; Schiefelbusch, M. Rufbus meets Mobility 4.0: Lernen aus 40 Jahren flexiblem Nahverkehr. Nahverkehr 2018, 36, 29–35. [Google Scholar]
- Cramer, J.; Krueger, A.B. Disruptive change in the taxi business: The case of Uber. Am. Econ. Rev. 2017, 106, 177–182. [Google Scholar] [CrossRef]
- Gehrke, S.R.; Felix, A.; Reardon, T.G. Substitution of ride-hailing services for more sustainable travel options in the greater Boston region. Transp. Res. Rec. 2019, 2673, 438–446. [Google Scholar] [CrossRef]
- Anair, D.; Martin, J.; Pinto de Moura, M.C.; Goldmann, J. Ride-Hailing’s Climate Risks: Steering a Growing Industry toward a Clean Transportation Future; Union of Concerned Scientists: Cambridge, MA, USA, 2020; Available online: https://www.ucsusa.org/sites/default/files/2020-02/Ride-Hailing%27s-Climate-Risks.pdf (accessed on 15 November 2020).
- Liyanage, S.; Dia, H.; Abduljabbar, R.; Bagloee, S.A. Flexible mobility on-demand: An environmental scan. Sustainability 2019, 11, 1262. [Google Scholar] [CrossRef]
- Feigon, S.; Murphy, C. Transit Cooperative Research Program Research Report 195: Broadening Understanding of the Interplay among Public Transit, Shared Mobility, and Personal Automobiles; The National Academies Press: Washington, DC, USA, 2018. [Google Scholar]
- Caulfield, B. Estimating the environmental benefits of ride-sharing: A case study of Dublin. Transp. Res. Part D Transp. Environ. 2009, 14, 527–531. [Google Scholar] [CrossRef]
- Bischoff, J.; Maciejewski, M. Current and future dynamic passenger transport services–Modeling, simulation, and optimization in a sustainable transport system. In Sustainable Transportation and Smart Logistics; Elsevier: Amsterdam, The Netherlands, 2019; pp. 337–360. [Google Scholar]
- Cazzola, P.; Crist, P. Good to Go? Assessing the Environmental Performance of New Mobility; OECD: Paris, France, 2020. [Google Scholar]
- Chen, T.D.; Kockelman, K.M. Management of a shared autonomous electric vehicle fleet: Implications of pricing schemes. Transp. Res. Rec. 2016, 2572, 37–46. [Google Scholar] [CrossRef]
- Davidson, P.; Spinoulas, A. Driving alone versus riding together–How shared autonomous vehicles can change the way we drive. Road Transp. Res. 2016, 25, 51–65. [Google Scholar]
- Gkourtzounis, I.; Rigas, E.S.; Bassiliades, N. Towards online electric vehicle scheduling for mobility-on-demand schemes. In European Conference on Multi-Agent Systems; Springer: Cham, Switzerland, 2018; pp. 94–108. [Google Scholar]
- Rigas, E.S.; Tsompanidis, K.S. Congestion Management for Mobility-on-Demand Schemes that use Electric Vehicles. In Multi-Agent Systems and Agreement Technologies; Springer: Cham, Switzerland, 2020; pp. 52–66. [Google Scholar]
- Fagnant, D.J.; Kockelman, K. Preparing a nation for autonomous vehicles: Opportunities, barriers and policy recommendations. Transp. Res. Part A Policy Pract. 2015, 77, 167–181. [Google Scholar] [CrossRef]
- Greenblatt, J.B.; Saxena, S. Autonomous taxis could greatly reduce greenhouse-gas emissions of US light-duty vehicles. Nat. Clim. Chang. 2015, 5, 860–863. [Google Scholar] [CrossRef]
- Chong, Z.J.; Qin, B.; Bandyopadhyay, T.; Wongpiromsarn, T.; Rankin, E.S.; Ang, M.H.; Low, K.H. Autonomous personal vehicle for the first- and last-mile transportation services. In IEEE 5th International Conference on Cybernetics and Intelligent Systems (CIS); Institute of Electrical and Electronics Engineers: Qingdao, China, 2011; pp. 253–260. [Google Scholar]
- Imhof, S.; Frölicher, J.; von Arx, W. Shared autonomous vehicles in rural public transportation systems. Res. Transp. Econ. 2020, 83, 1–7. [Google Scholar] [CrossRef]
- Enbel-Yan, J.; Leonard, A. Mobility hub guidelines: Tools for achieving successful station areas. ITE J. 2012, 82, 42–47. [Google Scholar]
- Hörl, S.; Becker, F.; Dubernet, T.J.P.; Axhausen, K.W. Induzierter Verkehr Durch Autonome Fahrzeuge: Eine Abschätzung; Bundesamt für Strassen: Bern, Switzerland, 2019. [Google Scholar]
- Inturri, G.; Le Pira, M.; Giuffrida, N.; Ignaccolo, M.; Pluchino, A.; Rapisarda, A.; D’Angelo, R. Multi-agent simulation for planning and designing new shared mobility services. Res. Transp. Econ. 2019, 73, 34–44. [Google Scholar] [CrossRef]
- Ministry of Regional Development and Transport. Modell für die Berechnung von CO2-Emissionen. Magdeburg, Germany. 2019. Available online: https://lvwa.sachsen-anhalt.de/fileadmin/Bibliothek/Politik_und_Verwaltung/LVWA/LVwA/Dokumente/3_wirtschaft_kultur_verbrschutz_bau/307/EFRE/Intelligente_Verkehrssysteme/IVS_Zuweisung/1.1_Anlage_1_zum_Antrag_Berechnungsmodul.pdf (accessed on 3 March 2021).
- Helsinki Regional Transport Authority. Kutusplus–Final Report. Helsinki. 2016. Available online: https://www.hsl.fi/sites/default/files/uploads/8_2016_kutsuplus_finalreport_english.pdf (accessed on 27 February 2021).
- NSW Transport. On Demand Public Transport. 2020. Available online: https://transportnsw.info/travel-info/ways-to-get-around/on-demand (accessed on 15 November 2020).
- Shaheen, S.; Cohen, A. Mobility on demand in the United States: From operational concepts and definitions to early pilot projects and future automation. In Analytics for the Sharing Economy: Mathematics, Engineering and Business Perspectives; Crisostomi, E., Ghaddar, B., Häusler, F., Naoum-Sawaya, J., GRusso, G., Shorten, R., Eds.; Springer Nature: Cham, Switzerland, 2020; pp. 227–254. [Google Scholar]
- Sieber, L.; Ruch, C.; Hörl, S.; Axhausen, K.W.; Frazzoli, E. Improved public transportation in rural areas with self-driving cars: A study on the operation of Swiss train lines. Transp. Res. Part A Policy Pract. 2020, 134, 35–51. [Google Scholar] [CrossRef]
- Swiss Federal Statistical Office. Gemeindetypologie und Stadt/Land-Typologie; Federal Statistical Office: Neuchâtel, Switzerland, 2017. [Google Scholar]
- Federal Office for Spatial Development. Modalsplit in den Agglomerationen-Ergebnisse 2015. Bern, Switzerland. 2018. Available online: https://www.are.admin.ch/dam/are/de/dokumente/verkehr/dokumente/mikrozensus/modalsplit_agglomerationen.pdf.download.pdf/Modalsplit_Agglomerationen_2015.pdf (accessed on 27 February 2021).
- Federal Office for Spatial Development. Dichte und Mobilitätsverhalten. 2018. Available online: https://www.are.admin.ch/are/de/home/medien-und-publikationen/publikationen/grundlagen/dichte-und-mobilitatsverhalten.html (accessed on 27 February 2021).
- Bösch, P.M.; Müller, K.; Ciari, F. The IVT 2015 Baseline Scenario. 16th Swiss Transport Research Conference. Available online: https://www.research-collection.ethz.ch/bitstream/handle/20.500.11850/117938/2/ab1163.pdf (accessed on 27 February 2021).
- Makido, Y.; Dhakal, S.; Yamagata, Y. Relationship between urban form and CO2 emissions: Evidence from fifty Japanese cities. Urban Clim. 2012, 2, 55–67. [Google Scholar] [CrossRef]
- Khalil, H.A. Energy efficiency strategies in urban planning of cites. In 7th International Energy Conversion Engineering Conference; American Institute of Aeronautics and Astronautic: Reston, VA, USA, 2019. [Google Scholar]
- New York City Department of Transportation. Citywide Mobility Survey. 2017. Available online: https://www1.nyc.gov/html/dot/downloads/pdf/nycdot-citywide-mobility-survey-report-2017.pdf (accessed on 27 February 2021).
- Schaller, B. The New Automobility: Lyft. Uber and the Future of American Cities. 2018. Available online: http://schallerconsult.com/rideservices/automobility.pdf (accessed on 27 February 2021).
- Schaller, B. Making Congestion Pricing Work for Traffic and Transit in New York City. 2018. Available online: http://www.schallerconsult.com/rideservices/makingpricingwork.pdf (accessed on 3 March 2021).
- Leisy, C.A. Transportation Network Companies and Taxis; Routledge: London, UK, 2019. [Google Scholar]
- Rodier, C. The Effects of Ride Hailing Services on Travel and Associated Greenhouse Gas Emissions. 2018. Available online: https://escholarship.org/content/qt2rv570tt/qt2rv570tt_noSplash_11ef3f6f9b4f64f6cd7730c9faf5cca8.pdf?t=qenf5z (accessed on 3 March 2021).
- Swiss Federal Statistical Office. Mobilität in der Schweiz–Ergebnisse des Mikrozensus Mobilität und Verkehr 2010. 2012. Available online: https://www.are.admin.ch/dam/are/de/dokumente/verkehr/mobilitaet_in_derschweiz-ergebnissedesmikrozensusmobilitaetundve.pdf.download.pdf/mobilitaet_in_derschweiz-ergebnissedesmikrozensusmobilitaetundve.pdf (accessed on 27 February 2021).
- Swiss Federal Statistical Office. Verkehrsverhalten der Bevölkerung–Ergebnisse des Mikrozensus Mobilität und Verkehr 2015; Federal Statistical Office: Neuchâtel, Switzerland, 2017. [Google Scholar]
- Swiss Federal Office of Energy. Gesamtenergiestatistik. 2018. Available online: https://www.bfe.admin.ch/bfe/de/home/versorgung/statistik-und-geodaten/energiestatistiken/gesamtenergiestatistik.html (accessed on 27 February 2021).
- Swiss Federal Office for the Environment. Indikator Klima. 2020. Available online: https://www.bafu.admin.ch/bafu/de/home/themen/thema-klima/klima--daten--indikatoren-und-karten/klima--indikatoren/indikator-klima.pt.html/aHR0cHM6Ly93d3cuaW5kaWthdG9yZW4uYWRtaW4uY2gvUHVibG/ljL0FlbURldGFpbD9pbmQ9S0wwMDImbG5nPWRlJlN1Ymo9Tg%3D%3D.html (accessed on 15 November 2020).
- Swiss Federal Office for the Environment. Klima: Das Wichtigste in Kürze. 2020. Available online: https://www.bafu.admin.ch/bafu/de/home/themen/klima/inkuerze.html#-1190322929 (accessed on 15 November 2020).


| Service Option | Stops | Line Operation | Timetable | Operating Hours | Relation to Public Transport | Type of Vehicle | Seats | |
|---|---|---|---|---|---|---|---|---|
| 1 | On-demand line operation | Existing bus stops | Yes | Yes, but on demand | Adapted to public transport | Extension | Van | 8 |
| 2 | On-demand public transport supplement | Door-to-door or virtual stops | No | No | Only at off-peak times | Addition | Standard | 4 |
| 3 | On-demand public transport replacement | Door-to-door or virtual stops | No | No | Adapted to public transport | Replacement | Van | 8 |
| 4 | Commercial on-demand | Door-to-door or virtual stops | No | No | Not necessarily adapted to public transport | Competition | Standard | 4 |
| Type of Space | Example Localities | Are in km2 | Population Density (Inhabitants/ km2) | Workplaces per km2 | Existing Transport Offer | Number of Passenger Trips per Day 1 | Modal Split (in Relation to Trips) | |
|---|---|---|---|---|---|---|---|---|
| A | Rural peripheral municipality | Glarus South | 430 | 22 | 1.87 | One train line, several bus lines (30–60-min intervals) | 32,000 | MPT: 71% Public transport: 21% Non-motorised: 6% Other: 2% |
| B | Urban municipality of a large agglomeration | Basel-St. Johann | 2.24 | 8341 | 10,241 | Several train, suburban railway and bus lines (frequency intervals) | 146,000 | MPT: 58% Public transport: 30% Slow transport: 11% Other: 2% |
| Service Option | Used Vehicles | Average Occupancy without Empty Runs 2 | Percentage of Empty Runs 3 | |||||
|---|---|---|---|---|---|---|---|---|
| Type | Seats | Share of Electric Drive | Glarus South | Basel St. Johann | Glarus South | Basel St. Johann | ||
| 1 | On-demand line operation | Van | 8 | 25% | 32.5% | 32.5% | 15% | 8% |
| 2 | On-demand public transport supplement | Standard | 4 | 25% | 60% | 60% | 15% | 8% |
| 3 | On-demand public transport replacement | Van | 8 | 25% | 32.5% | 32.5% | 15% | 8% |
| 4 | Commercial on-demand | Standard | 4 | 25% | 40% | 40% | 15% | 8% |
| Service Option | Share of On-Demand Collective Transport Service 9 | ||
|---|---|---|---|
| Glarus South | Basel St. Johann | ||
| 1 | On-demand line operation | 6% | 8% |
| 2 | On-demand public transport supplement | 3% | 5% |
| 3 | On-demand public transport replacement | 23% | 35% |
| 4 | Commercial on-demand | 0.5% | 0.5% |
| Service Option | Increase in Vehicle Kilometres on Road per km2 per Year due to On-Demand Collective Services | Numver of Trips per Inhabitant and Workplace per Year with On-Demand Collective Services | Number of Vehicle Trips per km2 per Year with On-Demand Collective Services | ||||
|---|---|---|---|---|---|---|---|
| Glarus South | Basel St. Johann | Glarus South | Basel St. Johann | Glarus South | Basel St. Johann | ||
| 1 | On-demand line operation | 6300 | 2,290,000 | 67 | 102 | 630 | 730,000 |
| 2 | On-demand public transport supplement | 1000 | 370,000 | 34 | 64 | 340 | 500,000 |
| 2 | On-demand public transport replacement | 20,200 | 8,900,000 | 259 | 448 | 2410 | 3,210,000 |
| 4 | Commercial on-demand | 800 | 280,000 | 6 | 6 | 80 | 70,000 |
| Service Option | Required Fleet Size in Total | per km2 | |||
|---|---|---|---|---|---|
| Glarus South | Basel St. Johann | Glarus South | Basel St. Johann | ||
| 1 | On-demand line operation | 24 | 85 | 0.06 | 38 |
| 2 | On-demand public transport supplement | 23 | 99 | 0.05 | 44 |
| 3 | On-demand public transport replacement | 99 | 429 | 0.23 | 192 |
| 4 | Commercial on-demand | 9 | 18 | 0.02 | 8 |
| Service Option | per Inhabitant and Workplace (in Tonnes per Year) | CO₂ Increase in % in Relation to Total CO₂ Emissions in Transport 10 | |||
|---|---|---|---|---|---|
| Glarus South | Basel St. Johann | Glarus South | Basel St. Johann | ||
| 1 | On-demand line operation | +0.061 | +0.028 | +4.4% | +2.0% |
| 2 | On-demand public transport supplement | −0.001 | −0.003 | −0.1% | −0.2% |
| 3 | On-demand public transport replacement | +0.193 | +0.108 | +13.9% | +7.7% |
| 4 | Commercial on-demand | +0.005 | +0.002 | +0.4% | +0.2% |
Publisher’s Note: MDPI stays neutral with regard to jurisdictional claims in published maps and institutional affiliations. |
© 2021 by the authors. Licensee MDPI, Basel, Switzerland. This article is an open access article distributed under the terms and conditions of the Creative Commons Attribution (CC BY) license (http://creativecommons.org/licenses/by/4.0/).
Share and Cite
Dang, L.; von Arx, W.; Frölicher, J. The Impact of On-Demand Collective Transport Services on Sustainability: A Comparison of Various Service Options in a Rural and an Urban Area of Switzerland. Sustainability 2021, 13, 3091. https://doi.org/10.3390/su13063091
Dang L, von Arx W, Frölicher J. The Impact of On-Demand Collective Transport Services on Sustainability: A Comparison of Various Service Options in a Rural and an Urban Area of Switzerland. Sustainability. 2021; 13(6):3091. https://doi.org/10.3390/su13063091
Chicago/Turabian StyleDang, Lisa, Widar von Arx, and Jonas Frölicher. 2021. "The Impact of On-Demand Collective Transport Services on Sustainability: A Comparison of Various Service Options in a Rural and an Urban Area of Switzerland" Sustainability 13, no. 6: 3091. https://doi.org/10.3390/su13063091
APA StyleDang, L., von Arx, W., & Frölicher, J. (2021). The Impact of On-Demand Collective Transport Services on Sustainability: A Comparison of Various Service Options in a Rural and an Urban Area of Switzerland. Sustainability, 13(6), 3091. https://doi.org/10.3390/su13063091