Abstract
With increasing urban populations, high vehicle miles have made the concept of a compact city imperative. A compact city is characterized by high-density development and mixed land use with no urban sprawl. City managers are trying hard to make their cities compact and livable. The potential conformance to a compact city development requires scaling before any significant intervention. Several studies have been conducted on the different aspects of the compact city in the developed world, but there is limited understanding in the South Asian context. This study aimed to fill this research gap and proposes a theoretical matrix to gauge the potential compactness of Lahore, Pakistan. It comprises some key attributes, such as landscape ecology, measurement of density, density distribution, transportation network, accessibility, dispersion index, and mixed-use land consumption, which were analyzed in this research. The data were analyzed using Geographical Information System (GIS) and ERDAS IMAGINE software to make a scaling matrix. The research findings show that Lahore is a semi-compact city, with high potential to become a true compact city. The paper recommends that the urban extent should not be extended until targeted colonization is achieved, and the spatial growth of the city should be managed by encouraging infilled development, high-density living, and public transport provision. This research will help policymakers, urban planners, and transport planners devising policies for compact city development.
1. Introduction
The idea of a compact city has gained worldwide recognition due to rising urban populations and high vehicle miles [1]. City managers are trying hard to make their cities compact and livable to ensure a high quality of life and fewer vehicle miles. However, at the same time, a debate for a sustainable urban form and development has also started. It is argued that the challenge of attaining sustainability in post-socialist urban formations and how this out play out in everyday life are largely ignored at the national, regional, and local scales [2]. Large urban areas and megacities are facing accelerated spatial transformation, whereas the small and medium-sized cities have found a slow growth in their urban restructuring, with dissimilar outcomes at the local scale [3].
The concept of sustainable development encompasses seven attributes in urban areas, namely compactness, sustainable transport, population density, mixed land uses, diversity, passive solar design, and greening [4,5]. Globally, the compact city is recognized as the most pertinent model to stimulate sustainable urban development [6,7,8]. There is no general definition of the compact city in the previous literature, but there are many available definitions focused on the core elements of the sustainable urban form. Notably, Burton [9] defined the compact city as “a relatively high density, mixed-use city, based on an efficient public transport system and dimension that encourage walking and cycling”. This compact city model plays a vital role in concurrent urban planning. It is indivisible, associated with the concept of sustainable development [10,11]. A compact city is marked by high density, mixed land use, pedestrian-oriented habitation, utilization of development reserves for construction projects, and the structural transformation of the former industrial areas or fallow land into service or residential areas of high quality [12]. A compact city is also referred to as a city of short distances, in contrast to a car-oriented and urban sprawled modern city of the world [7]. It can be characterized by an efficient, multifunctional, and multi-modal transport system, while fostering relatively high population densities [13]. The compact city consists of various elements such as high density, mixed uses, public transportation, accessibility, social equity, and urban containment [14,15].
The compact city allows exemplifying mobility management, and unlike the dispersed city, discourages the use of private vehicles. It favors and implements the use of the public road network. This city model, which is nothing more than the evolution of the historical model, proposes all the characteristics of integration between urbanity and infrastructure that have become alien to the diffuse city. Different forms of mobility are promoted to encourage sustainable travel modes such as walking, cycling, and using public transport. Environmental, social, and economic benefits are suggested to accrue as there would be less dependence on cars and reduced greenhouse gas emissions [7,16,17,18].
It is necessary at the same time to consider that by increasing densities in and around the compact city, public transport systems can no longer meet the dispersed pattern of the transport demands of all citizens [19,20]. Therefore, two alternatives should be referred to, namely the commonly used line-by-line approach and the integrated and nodal approach. Events such as the recent pandemic have led to a profound crisis in the public transport sector due to the risk of contagion and the need to respect social distancing. In these terms, mobility should be reviewed from the aspect of sustainability by encouraging green means and the aspect of resilience, i.e., contemplating solutions that can be well adapted to different scenarios [21,22].
The concept of a compact city involves strategies that intend to achieve compactness and densities that will eventually eliminate the problems of modern cities [23]. Previous studies have described several significant indicators to determine the potential of compact city development. The indicators of a compact city include compactness, accessibility, the transport system, and urban regeneration with the development of brownfield lands and public spaces [10]. The attributes to determine urban compactness include population densification, activity concentration, public transport intensification, city size and accessibility, and socioeconomic welfare targets [24]. The various indicators to measure urban compactness characteristics in Nasiriyah city include development clustering, centrality, proximity, diversity, and the percentage ratio of blocks to spaces [25]. Six indicators were used for the sustainability assessment of Indonesian urban camping in Malang City, namely compactness, accessibility, density, diversity, poverty, and community participation [26].
In Pakistan, the population is highly dynamic and continues changing over time. Pakistan is the most urbanized country in South Asia, with an urban population growth of 2.52% per year [27]. The total population of Pakistan was recorded to be 207.77 million in the population census of the year 2017. It was 132.35 million in 1998 and 84.25 million in 1981 [28]. It is estimated that the total number of households is about 32.2 million, with an average household size of 6.45 people [29]. According to the 2017 census, 36.40% of the population lived in urban areas of Pakistan, which was 32.5% in the year 1998 and 28.3% in 1981. It further revealed that almost 47% of the urban population lived in ten major cities, each with more than one million people [30]. It is estimated that nearly half of the population of Pakistan will live in urban areas by 2025 [31]. According to UNDP Pakistan [31], a natural increase in the population, migration, and expansion of urban boundaries are the main factors that contribute to steady urban growth in Pakistan. The natural increases in population, migration, and city boundaries expansion constitute 70%, 20%, and 10% of the urban growth, respectively.
Lahore is a provincial capital and the second megacity of Pakistan. The urban population of Lahore was 861,279 in 1951 and 5,209,088 in 1998, with an annual compound growth rate of 3.32%. The population of Lahore was recorded as 11.12 million, with an average growth rate of 3% during the period from 1998 to 2017 [32]. The average household size in Lahore increased from 5.8 in 1961 to 7.2 in 1998 [33]. Lahore is comprised of nine administrative zones and one cantonment [34]. Due to rapid urbanization, the city is sprawling haphazardly [35]. Lahore is growing in the south and southeast directions due to restrictions or the presence of a physical barrier posed by River Ravi towards the north and west. Furthermore, growth towards the east is also restricted due to the Indian border. In Lahore, during the past 40 years, 114,630 hectares of arable land was converted for urban use, and 18% of this converted land fell to 252 sprawling housing schemes, due to the lack of proper regulations and institutional framework [35,36].
Figure 1 highlights the growth pattern of Lahore city during different periods, ranging from the year 1850 to the year 2017. The figure validated that initially, in 1850, Lahore was confined within a radius of 1 kilometer (km). Furthermore, the city was growing in a circular way around a wall with the haphazard growth of old population centers outside the wall. The essential growth was observed in the 1960s when the population growth rate was extremely high. Due to a high population growth rate, the city expanded towards the south and southeast in an unplanned manner [35]. The population growth was restricted in the east due to the Indian border. The expansion of the city in the western direction was restricted due to River Ravi. The figure further reveals that Lahore experienced massive growth in the 1970s and late 1990s. Lahore is now expanding rapidly and crossed a radius of 38 km in 2017 in an unplanned manner. In Lahore, people move to the outskirts or peripheral areas to enjoy lower land prices and a large area for their houses [35]. Educational and health facilities are available in these areas but are substandard and expensive. Therefore, to avail themselves cheaper and better health and educational facilities, they commute to central areas. The existing public transport system is insufficient to meet the travel demand of the peripheral residents. Consequently, the demand for personal cars and vehicles has been surging to attain a level that exacerbates pollution and congestion in central areas [17]. The congestion is estimated as more flagrant since privately owned vehicles are increasing day by day. The percentage of private vehicles (cars, motorcycles, and three-wheelers) registered in the year 2012 was 92.94% of total vehicles. The percentage of the aforementioned vehicle types in Lahore was recorded to be 93.37% in 2013, 93.98% in 2014, 94.31% in 2015 and 94.89% in 2016 [32].
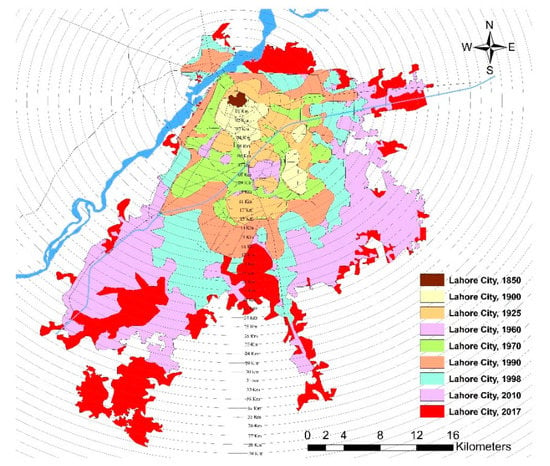
Figure 1.
The historical growth pattern of Lahore city from 1850 to 2017.
The compact city development model is being followed in Pakistan, but with limited adherence to the principles of compact development and the standards it sets. For instance, in Pakistan, the traditional development pattern encourages high-density living and mixed land uses but could not be followed due to the dissuasion of existing building bye-laws, and the absence of mixed land uses zones in the Master Plan of the city [37]. Lahore is Pakistan’s second-largest city and faces several issues regarding sustainability. Therefore, there is a need to examine the potential of compact development in Lahore, as compact development can help to protect agricultural land, reduce distances, promote walkability, cycling, public transport, reduce car use, reduce the development costs, save energy, increase social equity, and promote sustainable development in the urban areas of Lahore.
Many studies on the different dimensions of the compact city have been conducted in developed countries, but research is still in the early stages in developing countries like Pakistan. Thus, this research aims to scale the potential of compact city development in the context of Lahore, Pakistan. This research will be helpful for other countries of the world with a similar population, area, geographical conditions, and structure to that of Lahore.
2. Compact Urban Form and Its Attributes
Several methods to measure compact urban form and compact development have been developed by researchers. Many studies were carried out on compact cities in the world by scholars and researchers. These are focused on different aspects of urban form and compact city development but carry some common vital indicators useful for the spatial analysis of Lahore. These indicators are highlighted in Table 1.

Table 1.
Approaches to measuring compact urban form.
Table 1 shows approaches and indicators to measure compact city development, which provided a guide for selecting appropriate indicators for this research. Several authors have focused on quantitative measures to characterize compact urban form and have suggested some common indicators such as density, mixed land use, accessibility, land use, urban design, dispersion index, and compactness. Bertaud [41] has suggested that the new emerging technologies, including satellite imagery, digital mapping, and GIS, can be utilized to obtain better urban shape results. This present research study primarily focuses on using GIS and ERDAS IMAGINE and other quantitative measures to quantify the compact urban form of Lahore.
These research studies (Table 1) identified and defined the various aspects of urban form and compactness. It also outlined the indicators used to measure each of these aspects quantitatively and qualitatively, which are beneficial for devising compact city development policies to improve the compact urban form in the cities. The aforementioned studies identified the principles that balance the urban population growth, rapid urbanization, and compact urban development.
The worldwide several essential case studies are summarized in Table 2. In all the indicated case studies, compact city policies were formulated and developed to address rapid urbanization, population density, agricultural land, green spaces, urban sprawl, traffic congestion, and increasing car ownership. The issues of various cities in the world and policies to cater to them under the umbrella of compact cities are also highlighted in Table 2.
Table 2.
Important case studies of the world.
Table 2 describes a range of well-recognized and active relevant policies and plans required to contest existing issues and ensure sustainable development. Globally, policy prescription has increasingly favored compact city development policies to provide a more sustainable development pattern.
However, there is an emerging need to formulate separate policies on compact city development to promote sustainable development in the world’s cities. The population of Lahore was 11.12 million people in the year 2017 [32], and is increasing at an unprecedentedly seen rate due to rural–urban migration. In the wake of the urbanization of Lahore, there is a need to formulate compact development policies so that the city may cater to the current urban sprawl and promote sustainable development.
3. Materials and Methods
Research methodology was designed to systematically achieve the objectives of our research. Given the recommendations [55,56], the sample size of the case study area was determined by using a number of households as the population in the following formula:
where n is the sample size, N is the total households, and e is the sampling error. According to the Pakistan Bureau of Statistics, the total number of households was 1,757,691 in Lahore in 2017. The sampling error was taken as 5%. The calculated sample size was 399.91 (≈400) households. This sample size was determined to collect primary data from the study area through household surveys in the city.
n = N/1 + Ne2
The literature review, including case studies of the world, was consulted to finalize compact city development indicators in the case study area. The urban form’s measurement, based on compact city development, was carried out using suitable indicators. These indicators were derived from the national and international literature on compact city development. After deliberating with the Town Municipal Administration’s relevant officers and their suitability to determine compact development potential, they were finalized. The computation of these variables is further deliberated in Table 3.
Table 3.
Derived set of indicators and their computations.
Based on these indicators, primary surveys comprised of household surveys, observation sheets, and interviews were conducted. These surveys were conducted to collect household data by considering the various variables/questions on personal information, household information, neighborhood information, public transport, accessibility of facilities, and the accessibility of public transport. The stratified random sampling technique was used to collect household data. The secondary data, relevant to the historical growth and trends of the city, population density, and transport networks of Lahore were collected from some essential studies of Lahore, like the Integrated Master Plan for Lahore (IMPL) 2021, the Urban Transport Master Plan for Lahore (UTMPL) 2012, the Punjab Development Statistics Reports 2013–2018, and the Pakistan Bureau of Statistics Reports, etc. The data regarding the colonization of housing schemes were collected from the Lahore Development Authority officials and the developers of various housing schemes by conducting their interviews and observation surveys.
The analysis of the data comprised of development indicators was done using different statistical techniques and mathematical objects like dispersion index and congestions index, road network density, and average land consumptions. Microsoft Excel and Statistical Package for the Social Sciences (SPSS) were used to analyze the data such as mode share and the colonization of the housing scheme. GIS and ERDAS IMAGINE were used to prepare spatial maps related to the city’s growth pattern for different years, perform land use and land cover analysis, measure density distribution, and check the accessibility of public facilities. Landsat data were acquired from USGS Earth Explorer to perform the land use and land cover analysis and determine the saturation level of Lahore for the years 1998, 2010, and 2017. A scaling matrix was developed for measuring the potential of a compact city for Lahore based on the results of the aforementioned selected indicators for this study.
4. Results
In this research, a set of indicators, including landscape ecology, density measurement, density distribution, transportation network, accessibility, shape performance, and mixed land consumption, was analyzed using SPSS. The spatial maps were developed by using GIS and ERDAS IMAGINE for Lahore. These derived indicators were used to assess the existing level of compactness and the potential of compact development as a growth option for Lahore.
4.1. Landscape Ecology
The first perspective of urban form focused on the undeveloped land. Landscape ecology only focused on land covers such as urban land, cropland, forest, etc., rather than land use like residential, commercial, and industrial. Various tools were used to perform landscape ecology analysis, such as ERDAS IMAGINE and GIS [45]. Land use and land cover analysis and saturation level were performed under landscape ecology.
The freely available Landsat satellite images of different years, i.e., 1998, 2010, and 2017, were acquired from USGS Earth Explorer for Lahore. The primary purpose of acquiring Landsat images is to determine temporal changes in Lahore. The radiometric correction was made to increase the satellite images’ quality to attain the required information on a good scale. The boundaries of zones and Lahore were taken from IMPL 2021. The classification was made on ERDAS IMAGINE, distinguishing satellite imageries into different classes. Signatures were defined after the pixels of the images were sorted into classes. Three major classification fields were defined to include the built-up area, vegetation, and water bodies.
Figure 2, Figure 3 and Figure 4 highlight temporal changes in land use and land cover. These figures also indicate that the city’s built-up area is increasing by a steady decrease in vegetation area due to the rapid urbanization and city growth in a haphazard way. It was observed that the built-up area of Lahore was 68,680 ha (686.8 km2), 82,890 (828.9 km2), and 92,580 ha (925.8 km2) in the years 1998, 2010, and 2017, respectively. Furthermore, a significant proportion of the residents were shifting away from the city center to the outskirts because of cheaper land values.
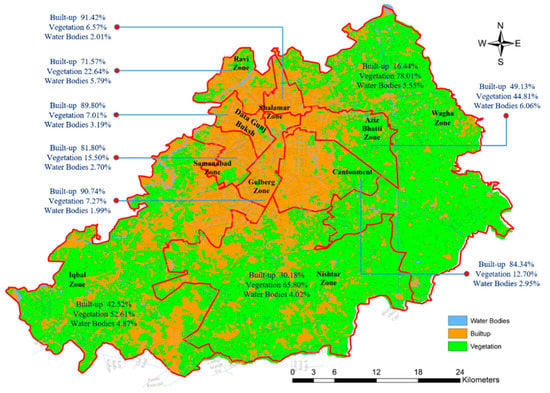
Figure 2.
Land use and land cover for 1998.
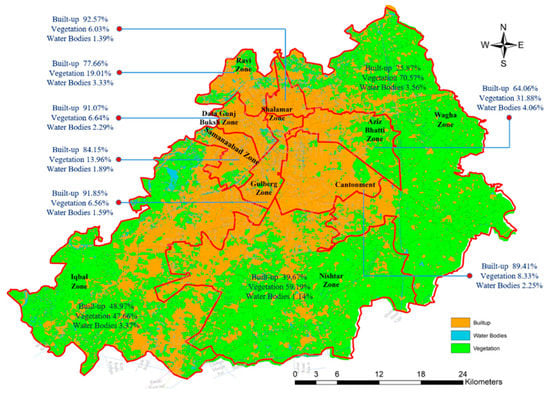
Figure 3.
Land use and land cover for 2010.
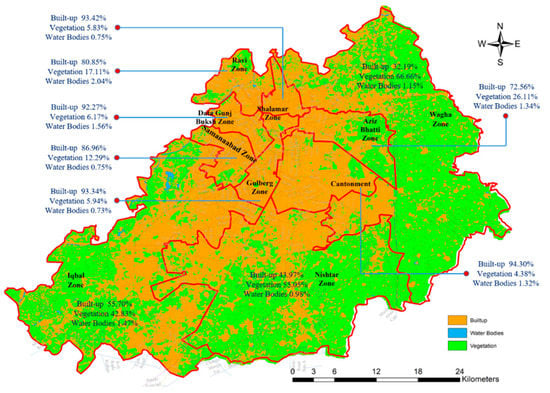
Figure 4.
Land use and land cover for 2017.
Table 4 shows the zone-wise distribution of the built-up area, vegetation, and water bodies. It highlights that the built-up area in every zone increased, whereas vegetations and water bodies decreased during the years 2000, 2010, and 2017. The saturation level analysis was conducted to quantify the temporal change in the built-up to total area ratio [57]. The saturation analysis was performed to measure the urban sprawl of Lahore. The saturation level of Lahore decreased with time. The saturation level was 0.90 in 1998, and it was 0.87 in 2010, and then it decreased to 0.85 in 2017, which means that the city has been gradually sprawling.
Table 4.
Zone wise land use and land cover analysis for the years 1998, 2010, and 2017.
Figure 5 highlights a comparative expansion and trends of built-up areas in Lahore for the years 1998, 2010, and 2017.
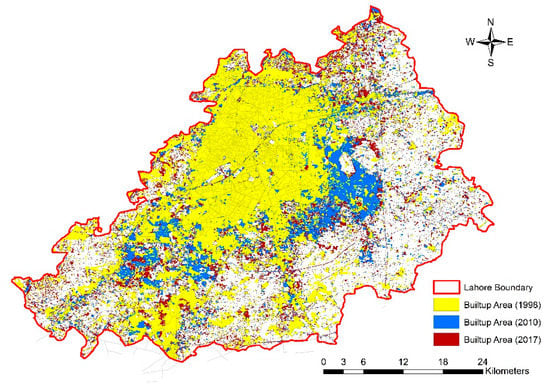
Figure 5.
Comparative expansion and trends of built-up areas for 1998, 2010, and 2017.
4.2. Density Measurement
The density and the spatial distribution of land uses are the core components of a compact city. Four sub-indicators, namely, gross population density, built-up area density, land use breakup, and average land consumption per capita were considered to comprehend the density pattern. It is recommended that the population density within a sustainable neighborhood should be at least 15,000 persons per km2 (150 persons/ha) [48]. The gross population density of Lahore was 4883 persons per km2 and 6279 persons per km2 in 2010 and 2017, respectively. The increase in density means that Lahore city is experiencing compactness. The average land consumption per capita in Lahore is 58.0 m2 [37]. It is less than average land consumption in Berlin and New York, where land consumption per capita is 279 m2 and 249 m2, respectively [41]. Lahore must restrict the usage of cars for promoting compact city development in the near future. It is calculated that the built-up area density of Lahore was 10,439 persons/km2 in the year 2010 and 12,018 persons/km2 in the year 2017, which shows that the city is acquiring a compact urban form. Table 5 highlights the breakup of land uses in Lahore, which clearly indicates that most area is under agricultural use. The land use breakup is vibrant due to rapid changes in land uses due to urbanization. The agricultural area (45.43% of the total area) causes a deficit of open spaces, which is only 0.66% of the city’s total area. Furthermore, the area of parks and roads is also not sufficient for the dwellers of Lahore. According to the UN-Habitat, the area of open spaces should be at least 15% for the sustainable city [48].
Table 5.
Land use breakup of Lahore.
4.3. Density Distribution
The census data and land use map are joined to represent the spatial distribution of the population. Union Councils (blocks) have been taken as sub-zones for density distribution in Lahore [34]. The density has been calculated by dividing the population by the area by using the GIS [58]. The density distribution includes the density profile and population by the distance to the Central Business District (CBD). The density profile for Lahore has been prepared by using GIS. Figure 6 highlights the density of the city within a specified radial distance. Buffer analysis was performed in an interval of 2 km by considering Gulberg as a CBD. The Gulberg zone comprises commercial centers, business centers, shopping markets, offices, banks, education and health facilities, etc. Gulberg is now considered the city center of Lahore. The density profile represents densities that are high at the center and will decrease with increasing distance from the CBD area. It has been found that the density is more than 150 persons per hectare (PPH) within the radius of 14 km of CBD, and beyond 14 km, it is less than 150 PPH. The density profile also inferred that many people have easy access to the city center in Lahore. It is estimated that only 24.38% of the total population resides within a radius of 5 km from CBD (refer to Figure 7). In urban areas, 5 km is considered a short distance and can be traveled by using a bicycle in 15 to 20 min or 10–15 min by motorcycle and public transport [46]. It is also assessed that the 59.13% and 16.49% population reside within a radius of 5–14 km and 14–38 km, respectively, from CBD. It observed that people are moving to the core city’s outskirts to benefit from the lesser value of the land.
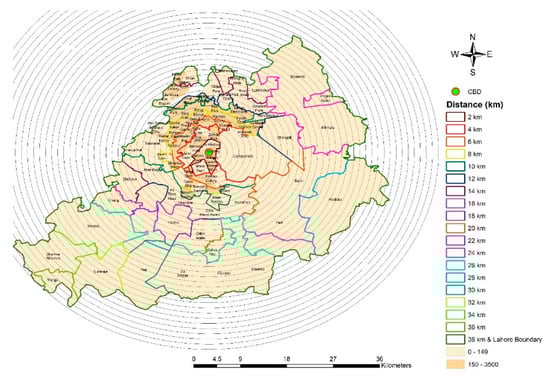
Figure 6.
Density profile and population density persons per hectare for Lahore.
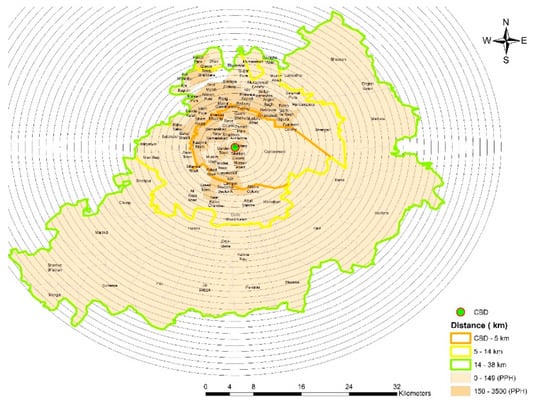
Figure 7.
Population through distance to CBD and population density persons per hectare for Lahore.
4.4. Transportation Network
Transportation network shapes urban forms. In this context, a relationship between transportation networks and urban form is valuable to determine the accessibility and connectivity required for sustainable compact development. Better transport networks and shorter trip distances encourage the use of public transport in the city. Kotharkar, Bahadure [46] proposed four indicators, namely mode share, average trip length, road network density, and congestion index, which have been selected in this research. Non-motorized vehicle trips, including walking, contribute about 43.09% of the total trips in the city. Figure 8 shows a comparison of the mode share of Lahore with important cities of the world. It highlights that the role of transit is minimal compared to the other important cities of the world. In the case of Lahore, the share of public transport is only 18.25% of the total vehicles, whereas the percentage of private vehicles (38.66% of the total share) is increasing at a rapid pace [17,59]. The lesser share of public transport is because of a lesser investment in transit infrastructure. Sabir and Anjum [60] pointed out that the lack of park and ride facilities discourages public transport use. The average trip length is expressed as the total passenger–kilometers ratio traveled to the total number of trips [46]. It has been calculated that an average trip length in Lahore is 2.76 km/day for work, shopping, recreation, health, and educational trips. The average travel time is 11.04 min for the daily routine work. Therefore, it can be inferred that an average trip length is shorter for the city.
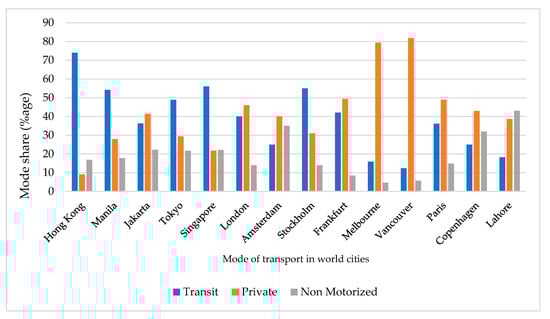
Figure 8.
Comparison of mode share with the world cities.
The road network density with a high value and the road length per person with a low value designates a sustainable compact urban form concerning transportation indicators. A higher value of road network density may control congestion by giving more transport alternative routes and corridors. Gross road network density (m/ha) is calculated by the total length of the roads divided by the city’s total built-up area. The average gross road network density is 52.18 m/ha, and the road length per person is 0.42 m/person in Lahore. The congestion index of the city is 0.17, which shows better mobility but typically congested roads in the core area of Lahore.
4.5. Accessibility
Accessibility has varying applications. It is a short distance to reach a specific place utilizing public transportation. The concepts that are associated with accessibility may involve access to places within walking distance. The walking distance to essential services can measure walkability in a neighborhood, usually from 400 to 450 m in compact city development [48]. Two indices can measure accessibility, i.e., the Service Accessibility Index and Public Transport Accessibility Index. The Service Accessibility Index is based on the percentage of work trips completed within 15 min time, 15–30 min time, and more than 30 min. It was determined that some typical service trips like health were completed within thirty minutes, whereas frequently demanded service trips were completed within fifteen minutes. It was calculated that 86.03% of trips were completed within 15 min, and 13.97% of trips were completed in 15–30 min. It is inferred that Lahore has good service accessibility. The Public Transport Accessibility Index was calculated as an inverse of the average distance (km) needed to travel to the nearest bus stop. A higher index value represents better public transport accessibility. In the case of Lahore, the value of the Public Transport Accessibility Index is 0.33, which indicates the less accessibility of public transport.
4.6. Shape Performance
The dispersion index is calculated as the ratio of the average distance per person to the center [40]. The average distance per person to the center of a circle whose area would be equal to the built-up area with a uniform density is called the dispersion index. The dispersion index of Lahore was calculated by taking the distances of the centroids from the CBD. The distances were measured through the GIS, and the population was taken from Punjab Development of Statistics. A higher value of the dispersion index means that the city is more scattered. The measured values of the dispersion index for Lahore are 1.02 in 2010 and 0.94 in 2017, close to the ideal value of 1.00. The value of the dispersion index at 1.0 is contemplated as a threshold between the compactness and dispersion. Currently, Lahore is between compactness and dispersion and exhibits a gradually moving trend towards a compact urban form [29].
4.7. Mixed-Use Land Consumption
The ratio of residential to non-residential use and the built-up area ratio to the open area are essential components in a compact urban form of the city [38]. The ratio of residential to non-residential use and the ratio of built-up area to the open area is used for the trend relationship [38] and the city’s development pattern [40]. It was calculated that the ratio of residential to non-residential use for Lahore is 0.2, and the ratio of built-up to non-built-up area is 0.42. This shows that a high proportion of the area is lying vacant in Lahore.
4.8. Colonization of Housing Scheme
Housing schemes at the urban fringes of Lahore are the result of the rapid conversion of agricultural land [61]. In Lahore, particularly, more housing schemes have been built recently at the outskirts, which not only devoid the city from a significant proportion of agricultural land but have also promoted the city’s sprawling trend. Consequently, this has resulted in more car-oriented development. Due to land speculation, most of the plots are lying vacant in these housing schemes. Low colonization also contributes less towards the sustainability of compact growth. Innovative greening technologies are required for improving sustainability [62]. Figure 9 shows the colonization trend in various housing schemes in peripheral areas of Lahore. This shows that some housing schemes developed during the period 1980–1990 have not been colonized yet. It has been found that 21.03% of total plots are lying vacant due to speculation in the housing schemes launched during the period 1980–1990. This indicates that perhaps, Lahore is spreading from the outskirts without any proper planning and zoning.
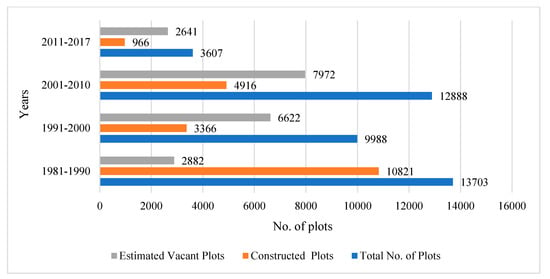
Figure 9.
Colonization of housing scheme.
5. Scaling the Potential of Compact Development
Different approaches to measuring the compact urban form, as summarized in Table 1, revealed that the concept of compact urban development is largely recognized in the global context. Numerous aspects of compact urban development have been utilized in European, American, Australian, and Asian contexts. The multidimensional aspects of compact development helped to analyze critically and provided a basis for this research. This further provided an opportunity and rationale to conceptualize and scale the compact development for Lahore, Pakistan.
The scale of potential compact development is shown in the form of a matrix (Table 6). It was developed by considering the selected indicators and expert opinions of town planners, architects, and engineers working in Lahore Development Authority, Metropolitan Corporation, and Transport Departments. Furthermore, applied standards, such as the minimum population density of 15,000/km2 in a sustainable city, as recommended by UN-Habitat in 2015, require at least 30% of land and 15%–20% of land to be allocated for roads and open public spaces, respectively. These standards could be met if supported by policies like density zoning to lead the compact development in Lahore, as recommended by the interviewed planners. Table 6 shows a scaling matrix, which compares the key indicators with the standard values to assess compact city development’s potential and sustainability in Lahore.
Table 6.
Matrix to scale the potential of sustainable compact development in Lahore.
The above matrix was developed to indicate whether a theme characteristic enabled access to a level compact development in the study area. Table 6 illustrates that the built-up area density, congestion index, and dispersion index have good potential for compact development in Lahore, but the rest of the indicators show the sprawling nature of the city. Rationally, Lahore has somewhat complied with the compact city model, but the absence of sustainability is due to various factors such as the unplanned growth pattern, rapid increase in private vehicles, land speculation, lack of comprehensive planning regulations, absence of compact city, and land use and transport policies. Finally, we can conclude from the scaling matrix that Lahore is partially a compact city with high potential to become a true compact city in the future. Moreover, sustainability for the development of Lahore as a compact city is very much on the agenda and flourishing.
6. Discussion
Lahore is predominantly a monocentric city, with a major central commercial area and informal sub-centers spread all over the city. This study determined that the city’s saturation level is decreasing with time. The saturation level was 0.90 in 1998 and 0.87 in 2010, which declined to 0.85 in 2017. This revealed that the city is sprawling at a significant pace. The gross population density of Lahore was 4883 persons per km2 and 6279 persons per km2 in the year 2010 and 2017, respectively, which was well short of the recommended standard of the UN-Habitat. The recommended density for compact development is at least 15,000 km2.
Similarly, the built-up area density is also short of the recommended standard. The breakup of the land uses in Lahore is dynamically complex due to the rapid changes—as permissible under the change in land use policy to cater to urbanization needs. For instance, an agricultural chunk of land may be converted into a housing colony. The average land consumption per person is 58.02 m2 for Lahore, which is far less than that in developed world cities. A car requires 40 m2 of space to park and maneuver [46], which is 68.96% space of a person. Thus, the presence of cars occupies a significant portion of the land. The density profile represents that densities are higher at the center of the city and decrease the greater the distance is from the CBD area. The density profile also concluded that many people have easy access to the city center in Lahore. Furthermore, 24.38% of the total population resides within a radius of 5 km from CBD, which is less than the requirement of the compact city. It is observed that large parcels of the land are readily available in the outskirts, which are encouraging low-density development in Lahore.
The average gross road network density is 52.18 m/ha, and the road length per person was 0.42 m/person for the year 2017, which is less than that of compact cities like London, San Francisco, and Sydney. The value of the congestion index for Lahore is 0.17, which shows better mobility but typical congestion on the roads of central areas. The availability of public transport is lower in Lahore when compared with that of other cities of the world. Non-motorized trips constitute more than 43% of overall trips, depicting a significant compact city indicator. The ownership of cars is also gradually increasing, which is not a good trend for compact city development.
Similarly, the average traveled distance in Lahore is 2.76 km/day for work, shopping, recreation, health, and educational trips. The average travel time is 11.04 min for daily routine work. Therefore, it may be inferred that the average trip length is shorter for Lahore. It was found that 86.03% of trips are completed within 15 min, and 13.97% of trips are completed in 15–30 min. It is, therefore, inferred that Lahore has good service accessibility. In the case of Lahore, the value of the Public Transport Accessibility Index is 0.33, which shows the less accessibility of public transport.
The value of the dispersion index for Lahore was 1.02 in 2010 and 0.94 in 2017, close to the ideal value of 1.00. At present, the standing of Lahore was between compactness and dispersion and may represent a trend of gradually moving towards a compact urban form. It is estimated that the residential to non-residential use ratio is 0.2, and the ratio of built-up to non-built-up area is 0.42. This ratio shows that a high proportion of the area in Lahore lies vacant. This research study determined that 21.03% of total plots are lying vacant due to speculation in the housing schemes launched during the period 1980–1990. This shows that the city is spreading on the outskirts without any proper planning and zoning.
Finally, the research study inferred that some important indicators comply with the concept of compact development. Lahore is partially compact with high potential to become a true compact city. Furthermore, sustainability for the development of Lahore as a compact city is very much on the agenda and flourishing. Given the above discussion, the following strategies are recommended for Lahore:
- The urban extent of the city should be time bound. It may be allowed after the achievement of the targeted colonization of the previous limit of the city.
- The spatial growth of the city should be managed by encouraging infilled development and high public transport accessibility.
- Population density should be increased through vertical development. There is a need to amend building regulations, especially the provisions relevant to a vertical rise like the floor area ratio.
- Density zones should be defined in terms of low, medium, and high. Incentives should be given to developers/owners who want to construct high-rise buildings.
- The provision of apartment buildings should be made mandatory, and the percentage of apartment buildings should be increased in private housing schemes and the land sub-division rules of Lahore Development Authority.
- Policies should be made on land conservation for future development instead of permitting all available peripheral land.
7. Conclusions and Future Research
This study aimed to gauge the potential of compact city development in Lahore, Pakistan. Some urban form characteristics, such as the built-up area density, density distribution, congestion index, and the dispersion index show that Lahore once had an experience of a compact city, while it is now gradually dispersing. Furthermore, some indicators, including density measurement, accessibility, mixed-use land consumption, and the housing scheme’s colonization, indicate a sprawling trend. The lack of proper institutional structure and regulations/policies for fulfilling the extensive demand for compact urban form can lead to low-density and car-oriented development in Lahore. Additionally, informal development in Lahore is high, which is an obstacle to formal development, pushing the city to urban sprawl. This study also concluded that the compact city model is an appropriate model to achieve sustainable urban development in Lahore. This research study can provide critical insights for policymakers, urban planners, and transport planners for formulating the policies for compact city development. Furthermore, it can support future studies who want to work on the city’s spatial structure connected with the quality of life. Future research can be conducted to explore the integration of land use and transport towards sustainable development. Lastly, the proposed matrix can be implemented and be particularly helpful to gauge the potential of compact development in other cities with similar geographical contexts, population, area, and structure to Lahore.
Author Contributions
Conceptualization, M.N. and A.A.; methodology, M.N. and A.A.; software, M.N. and M.A.A.-R.; validation, M.N., A.A., M.A.A.-R., and M.A.; formal analysis, M.N.; investigation, M.N., and M.A.A.-R.; resources, M.A.A.-R., G.T., and T.C.; data curation, M.N.; writing—original draft preparation, M.N.; writing—review and editing, M.N., A.A., M.A.A.-R., M.A., G.T., and T.C.; supervision, A.A.; funding acquisition, G.T. and T.C. All authors have read and agreed to the published version of the manuscript.
Funding
Consejeria de Educacion, Junta de Castilla y León [Grant/Award No. SA069G18]; Ministerio de Ciencia e Innovacion (Grant/Award No. ECO2013-43838P); Ministerio de Ciencia, Innovación y Universidades (Grant/Award No. RTI2018-093423-B-I00); and Universidad de Salamanca (Grant/Award No. USAL2017-DISAQ) Junta de Castilla y León y Fondo Europeo de Desarrollo Regional (Grant/Award No. CLU-2019-03 Unidad de Excelencia “Gestión Económica para la Sostenibilidad” (GECOS)).
Institutional Review Board Statement
Not applicable.
Informed Consent Statement
Not applicable.
Data Availability Statement
The data presented in this study are available on request from the corresponding authors. The data are not publicly available because certain measures still need to be used in other studies.
Acknowledgments
The authors acknowledge the resources provided by the Department of City and Regional Planning, University of Engineering and Technology, Lahore, Pakistan, in conducting this research.
Conflicts of Interest
The authors declare no conflict of interest.
References
- Zhu, Q.; Leibowicz, B.D. Vehicle efficiency improvements, urban form, and energy use impacts. Cities 2020, 97, 102486. [Google Scholar] [CrossRef]
- Jucu, I.S.; Voiculescu, S. Abandoned places and urban. Marginalized sites in Lugoj municipality, three decades after Romania’s state-socialist collapse. Sustainability 2020, 12, 7627. [Google Scholar] [CrossRef]
- Jucu, I.S. Recent issues of spatial restructuring in Romanian medium-sized towns: Spatial conversion and local urban regeneration. Int. Multidiscip. Sci. GeoConference SGEM 2016, 3, 493–500. [Google Scholar]
- Verma, V.; Kumar, R. Compact city development a comparative assessment. Int. J. Eng. Res. Technol. 2019, 8, 270–279. [Google Scholar]
- Bibri, S.E. Compact urbanism and the synergic potential of its integration with data-driven smart urbanism: An. extensive interdisciplinary literature review. Land Use Policy 2020, 97, 104703. [Google Scholar] [CrossRef]
- Adelfio, M.; Kain, J.H.; Thuvander, L.; Stenberg, J. Disentangling the compact city drivers and pressures: Barcelona as a case study. Norsk Geogr. Tidsskr. Nor. J. Geogr. 2018, 72, 287–304. [Google Scholar] [CrossRef]
- Jenks, M. Compact City. In The Wiley Blackwell Encyclopedia of Urban and Regional Studies; John Wiley & Sons: Hoboken, NJ, USA, 2019; pp. 1–4. [Google Scholar]
- Kjærås, K. Towards a relational conception of the compact city. Urban Studies 2020, 58, 1176–1192. [Google Scholar] [CrossRef]
- Burton, E. Measuring urban. Compactness in UK towns and cities. Environ. Plan. B Plan. Des. 2002, 29, 219–250. [Google Scholar] [CrossRef]
- Ogrodnik, K. Indicators of the compact city concept-necessary data and the possibility of application. Archit. Civ. Eng. Environ. 2019, 12, 23–36. [Google Scholar] [CrossRef]
- Bibri, S.E.; Krogstie, J.; Kärrholm, M. Compact city planning and development: Emerging practices and strategies for achieving the goals of sustainability. Dev. Built Environ. 2020, 4, 100021. [Google Scholar] [CrossRef]
- Tappert, S.; Klöti, T.; Drilling, M. Contested urban green spaces in the compact city: The (re-)negotiation of urban gardening in Swiss cities. Landsc. Urban Plan. 2018, 170, 69–78. [Google Scholar] [CrossRef]
- Sana, A.; Vries, W.T.D.; Masum, F.; Espinoza, J.; Graefen, C. Scaling Up Compact City Development Strategies—A Solution to Cope With Urban. Sprawl in Developing Countries? In Annual World Bank Conference on Land and Poverty; The World Bank: Washington, DC, USA, 2016; pp. 1–34. [Google Scholar]
- Matthey-Doret, A. The Compact City: A Dead-End for Urban Sustainability?: An Analysis of the Compact City’s Desirability Dimension: A Case Study of Geneva. Series in Environmental Studies and Sustainability Science. Master’s Thesis, Lund University, Lund, Sweden, 2015. [Google Scholar]
- Bhagwat, J.M.; Devadas, V. Planning for a sustainable compact city: A way forward. WIT Trans. Ecol. Environ. 2020, 241, 113–122. [Google Scholar]
- Al-Rashid, M.A.; Goh, H.C.; Harumain, Y.A.S.; Ali, Z.; Campisi, T.; Mahmood, T. Psychosocial barriers of public transport. Use and social exclusion among older adults: Empirical evidence from Lahore, Pakistan. Int. J. Environ. Res. Public Health 2021, 18, 185. [Google Scholar]
- Shirwani, R.; Gulzar, S.; Asim, M.; Umair, M.; Al-Rashid, M.A. Control of vehicular emission using innovative energy solutions comprising of hydrogen for transportation sector in Pakistan: A case study of Lahore City. Int. J. Hydrogen Energy 2020, 45, 16287–16297. [Google Scholar] [CrossRef]
- Al-Rashid, M.A.; Nahiduzzaman, K.M.; Ahmed, S.; Campisi, T.; Akgün, N. Gender-responsive public transportation in the Dammam metropolitan region, Saudi Arabia. Sustainability 2020, 12, 9068. [Google Scholar] [CrossRef]
- Clercq, F.L.; Vries, J.S.D. Public transport. and the compact city. Transp. Res. Rec. 2000, 1735, 3–9. [Google Scholar] [CrossRef]
- Harumain, Y.A.S.; Nordin, N.A.; Zaid, S.M.; Goh, H.C.; Woodcock, A.; Mcdonagh, D.; Al-Rashid, M.A.; Faiz, K. Understanding factors of using public transportation among women in Kuala Lumpur. J. Pengemb. Kota 2020, 8, 109–115. [Google Scholar] [CrossRef]
- Campisi, T.; Basbas, S.; Skoufas, A.; Akgün, N.; Ticali, D.; Tesoriere, G. The impact of COVID-19 pandemic on the resilience of sustainable mobility in Sicily. Sustainability 2020, 12, 8829. [Google Scholar] [CrossRef]
- Moraci, F.; Errigo, M.F.; Fazia, C.; Campisi, T.; Castelli, F. Cities under pressure: Strategies and tools to face climate change and pandemic. Sustainability 2020, 12, 7743. [Google Scholar] [CrossRef]
- Kotharkar, R.; Bahadure, P.; Vyas, A. Compact City Concept: It’s Relevance and Applicability for Planning of Indian Cities. In Proceedings of the 28th International PLEA Conference, Opportunities, Limits & Needs: Towards an Environmentally Responsible Architecture, Lima, Peru, 7–9 November 2012. [Google Scholar]
- Roychansyah, M.S.; Felasari, S. Does ICT make city compactness higher? Evidences from compact city attributes in Yogyakarta City’s districts. In IOP Conference Series: Earth and Environmental Science; IOP Publishing: Bristol, UK, 2018. [Google Scholar]
- Al-Khafaji, A.; Al-Salam, N. Measurement of urban. sprawl and compactness characteristics Nasiriyah City—Iraq as case Study. Int. J. Civil Eng. Technol. 2018, 9, 335–343. [Google Scholar]
- Surjono, A.; Ridhoni, M. Lessons learnt from and sustainability assessment of Indonesian urban kampong. IOP Conf. Ser. Earth Environ. Sci. 2017, 70, 012061. [Google Scholar] [CrossRef]
- Government of Pakistan. National Report of Pakistan for HABITAT III Ministry of Climate Change; Ministry of Climate Change, Ed.; Government of Pakistan: Islamabad, Pakistan, 2015.
- Pakistan Bureau of Statistics. Provisional Summary Results of 6th Population and Housing Census 2017; Pakistan Bureau of Statistics: Islamabad, Pakistan, 2017.
- Nasir, J.; Maira, K. 6th Population & Housing Census 2017: A Comprehensive Summary of Results; The Urban Gazette: Lahore, Pakistan, 2018; pp. 1–4. [Google Scholar]
- Kedir, M.; Schmidt, E.; Wagas, A. Pakistan’s Changing Demography: Urbanization and Peri-Urban Transformation over Time; Working Paper No. 39; International Food Policy Researh Intitute: Washington, DC, USA, 2016. [Google Scholar]
- United Nations Development Program Pakistan. Development Advocate Pakistan; United Nations: New York, NY, USA, 2018. [Google Scholar]
- Punjab Bureau of Statistics. Punjab Development of Statistics; Punjab Bureau of Statistics: Lahore, Pakistan, 2017.
- Shirazi, S.A.; Kazmi, S.J.H. Analysis of population growth and urban development in Lahore-Pakistan using geospatial techniques: Suggesting some future options. South Asian Stud. 2014, 29, 269–280. [Google Scholar]
- Al-Rashid, M.A.; Rao, M.N.; Ahmad, Z. Using GIS measures to analyze the spatial equity to public parks in Lahore metropolitan. J. Res. Archit. Plan 2020, 28, 8. [Google Scholar]
- Rana, I.A.; Bhatti, S.S. Lahore, Pakistan—Urbanization challenges and opportunities. Cities 2018, 72, 348–355. [Google Scholar] [CrossRef]
- Baloch, A.A. Urbanization of arable land in Lahore City in Pakistan: A case-study. Can. Soc. Sci. 2011, 7, 58–66. [Google Scholar]
- Nadeem, O.; Haydar, S.; Sarwar, S.; Ali, M. Consideration of environmental impacts in the integrated master plan for Lahore-2021. Pak. J. Sci. 2013, 65, 310. [Google Scholar]
- Jabareen, Y.R. Sustainable urban. forms: Their typologies, models, and concepts. J. Plan. Educ. Res. 2006, 26, 38–52. [Google Scholar] [CrossRef]
- Jenks, M.; Jones, C. (Eds.) Elements of Urban. Form. Dimensions of the Sustainable City; Springer: London, UK, 2010. [Google Scholar]
- Song, Y.; Knaap, G.-J. Measuring urban form: Is Portland winning the war on sprawl? J. Am. Plan. Assoc. 2004, 70, 210–225. [Google Scholar] [CrossRef]
- Bertaud, A. Metropolis: A measure of the spatial organization of 7 large cities. Unpublished working paper; 2001; pp. 1–22. [Google Scholar]
- Krizek, K.J. Operationalizing neighborhood accessibility for land use-travel behavior research and regional modeling. J. Plan. Educ. Res. 2003, 22, 270–287. [Google Scholar] [CrossRef]
- Jones, C.; MacDonald, C. Sustainable Urban Form and Real Estate Markets. In Proceedings of the Annual European Real Estate Conference, Milan, Italy, 2–5 June 2004. [Google Scholar]
- Tsai, Y.-H. Quantifying Urban. Form.: Compactness versus Sprawl. Urban Studies 2005, 42, 141–161. [Google Scholar] [CrossRef]
- Clifton, K.; Ewing, R.; Knaap, G.J.; Song, Y. Quantitative analysis of urban form: A multidisciplinary review. J. Urban. Int. Res. Placemaking Urban Sustain. 2008, 1, 17–45. [Google Scholar] [CrossRef]
- Kotharkar, R.; Bahadure, P.; Sarda, N. Measuring compact urban form: A case of Nagpur City, India. Sustainability 2014, 6, 4246–4272. [Google Scholar] [CrossRef]
- OECD. Compact City Policies: A Comparative Assessment; OECD: Paris, France, 2012. [Google Scholar]
- UN-Habitat. A New Strategy of Sustainable Neighbourhood Planning: Five Principles; United Nations Human Settlements Programme: Nairobi, Kenya, 2014. [Google Scholar]
- Lau, S.S.; Wang, J.; Giridharan, R. Smart and Sustainable City—A Case Study from Hong Kong. In Smart and Sustainable Built Environmets; Blackwell Publishing Ltd.: Hoboken, NJ, USA, 2005; pp. 33–42. [Google Scholar]
- Suzuki, H.; Dastur, A.; Moffatt, S.; Yabuki, N.; Maruyama, H. Eco2 Cities: Ecological Cities as Economic Cities; The World Bank: Washington, DC, USA, 2010. [Google Scholar]
- Bharti, M.; Mehrotra, S. Metropolitan Ahmedabad: Scaling Up with Contiguous Replication of Town Planning Schemes; The World Bank: Washington, DC, USA, 2020. [Google Scholar]
- Nabielek, K. The Compact City: Planning Strategies, Recent Developments and Future Prospects in the Netherlands. In Proceedings of the 26th AESOP Annual Congress, Ankara, Turkey, 11–15 July 2012. [Google Scholar]
- Arbury, J. From Urban Sprawl to Compact City: An Analysis of Urban Growth Management in Auckland. Unpublished work. 2005. [Google Scholar]
- Kaczorowska, A. Urban. Transformation and Implementation of Green Development Strategies—Case of Gothenburg. In IOP Conference Series: Earth and Environmental Science; IOP Publishing: Bristol, UK, 2020. [Google Scholar]
- Altares, P.; Copo, A.R.I.; Gabuyo, Y.A.; Laddaran, A.T.; Mejia, L.D.P.; Policarpio, I.A.; Sy, E.A.G.; Tizon, H.D.; Yao, A.M.S.D. Elementary Statistics: A Modern Approach; Rex Bookstore Inc.: Manila, Philippines, 2003. [Google Scholar]
- Adanza, E. Research Methods: Principles and Applications; Rex Book Store Inc.: Manila, Philippines, 1995. [Google Scholar]
- Maryam, I.; Sana, R. Lahore Growth—Past & Future; The Urban Unit: Lahore, Pakistan, 2018; pp. 1–8.
- Sweitzer, J.; Langaas, S.; Folke, C. Land use and population density in the Baltic Sea drainage basin: A GIS database. Ambio 1996, 25, 191–198. [Google Scholar]
- Javid, M.A. Influence of situational constraints and public transport incentives on acceptability of car use restrictions in Lahore, Pakistan. Proc. Pak. Acad. Sci. 2015, 52, 109–116. [Google Scholar]
- Sabir, S.; Anjum, G.A. Problems and prospects of curbside parking in Lahore: Policyimplications for effective management. Mehran Univ. Res. J. Eng. Technol. 2017, 36, 867–880. [Google Scholar] [CrossRef][Green Version]
- Gul, A.; Nawaz, M.; Basheer, M.A.; Tariq, F.; Shah, S.A.R. Built houses as a tool to control residential land speculation—A case study of Bahria Town, Lahore. Habitat Int. 2018, 71, 81–87. [Google Scholar] [CrossRef]
- Jim, C.Y. Sustainable urban greening strategies for compact cities in developing and developed economies. Urban Ecosyst. 2013, 16, 741–761. [Google Scholar] [CrossRef]
- Liaqat, H.; Waheed, A.; Malik, N.A.; Vohra, I.A. Measuring urban sustainability through compact city approach: A case study of Lahore. J. Sustain. Dev. Stud. 2017, 10, 61–81. [Google Scholar]
- Government of Pakistan. National Reference Manual on Planning and Infrastructure Standards; E.U.A.D. Ministry of Housing & Works, Ed.; Government of Pakistan: Islamabad, Pakistan, 1986.
Publisher’s Note: MDPI stays neutral with regard to jurisdictional claims in published maps and institutional affiliations. |
© 2021 by the authors. Licensee MDPI, Basel, Switzerland. This article is an open access article distributed under the terms and conditions of the Creative Commons Attribution (CC BY) license (https://creativecommons.org/licenses/by/4.0/).