Article

Security Analysis of Hybrid Multi-Carrier Energy Systems

Department of Electrical Engineering, Marvdasht Branch, Islamic Azad University, Marvdasht, Iran
*
Author to whom correspondence should be addressed.
Sustainability 2021, 13(6), 3102; https://doi.org/10.3390/su13063102
Submission received: 4 January 2021 / Revised: 30 January 2021 / Accepted: 12 February 2021 / Published: 12 March 2021

Abstract

:
Multi-carrier energy systems (MCESs) provide collaboration between various kinds of energy carriers to supply the electricity, heating, and cooling demands. With the widespread use of MCESs in recent years, the security assessment of energy systems has attracted the attention of many contemporary researchers. However, the complexity of an MCES, including electrical, natural gas, and district heating networks, and different uncertainties imposes vast challenges to keep a safe operation energy supply. In this paper, a systematic methodology for the security analysis of MCESs is presented. For this purpose, considering electrical, natural gas, and district heating networks, an integrated model of energy systems is introduced. The security analysis of this framework is evaluated using some indices. In this approach, two well-known performance indices, including power performance index (PIP) and voltage performance index (PIV), are used to analyze the electrical networks’ security. Besides, the concept of Energy not supplied (ENS) is used for natural gas and district heating networks. In this regard, security analysis of a typical MCES including the IEEE 14-bus electrical network, the IEEE 30-bus electrical network, 20-node Belgian natural gas network, and 14-node district heating network is examined. The applicability of the proposed technique will be proven using comprehensive simulation analysis.

1. Introduction

This clearly implies that electricity is regarded as a particular important part across all types of energy such as heat, cold, and gas in the next-generation energy sectors. The main reasons for this fact, it can be noted (i) the significant developments in the renewable-based power generation systems (ii) increasing attention to the utilization of high-efficiency power generation systems such as heat pumps in other energy areas like heating and cooling networks [1]. Thus, in addition to the attempts to offer new efficient solutions for renewable technologies, it will be useful to implement novel methodologies for ameliorating the power output of distributed energy technologies in a cost-effective scheme [2,3].
The combined heat and power (CHP), as one of the most common distributed energy technologies, not only can generate heat and power, but also efficiency of system can be increased up to 90%. Besides, the greenhouse gas (GHG) emissions and its related threatens can be reduced by almost 13–18% [4]. Planning and operating in the presence of CHP necessitates to study the issues such as high reliability and security in the supply of energy required for more coupled systems entitled “carrier energy systems” [5,6,7]. The need to adopt various types of energy carriers and human needs to provide their energy requirements has also become an important reason for the emergence of these systems [8,9]. For a more practical description of these systems, the concept of energy hub has been used which combines various energy units with distinct infrastructures.
With the expansion of the above view and the need for multi-carrier energy systems (MCESs) about the role of this issue in the energy industry, the utilization of networks such as electrical, natural gas, and district heating networks is inevitable [4,10,11]. The main reason for implementing MCESs is to study the interactions of energy networks with each other, minimizing costs and consumer supply security [12,13]. Following the concept of the energy hub in 2005, a decomposition technique was introduced by Arnold and Anderson in 2008 [14] to convert the optimal power flow (OPF) into multiple sub-problems and solve them using repetitive but coordinated methods to cover the subject. In a more comprehensive study, authors of [15] developed the multi-agent genetic algorithm for solving the multi-carrier OPF where a non-convex optimization problem without removing the main advantages of analysis MCESs is, continuously, decomposed into its conventional OPF.
Based on the load flow approach, the gas load flow problem with the consideration of compressors has been solved in [6] using the Newton-nodal scheme. However, in [16], the transmission lines of the electrical network were not considered. Therefore, in the same year, the authors extended this research with another innovation called gas load distribution, considering the consumption flows of gas generators as loads in the mentioned network. For instance, an MCES with two fixed and variable efficiency approaches has been developed in [17] for the equipment of an energy hub using heuristic methodologies to minimize the cost of energy networks. A unified framework is adopted in [18] to combine various infrastructures, including electrical, natural gas, and district heating networks, while the power flow problem has been solved by the Newton Raphson (NR) technique.
Regarding the issue of security and reliability, the authors of [19] studied the reliability assessment of MCESs with different levels of demand in various climatic conditions. To appraise the reliability of the MCES suggested in [19] under various situations, different sizes of network equipment with two distinct weather conditions are analyzed. The planning of MCESs in the presence of wind resources is investigated in [20] by considering the N-1 events related to the gas pipeline and power transmission lines. The security zone of integrated natural gas-electricity networks in a decision-making area is discussed in [21]. To evaluate the security of MCESs, this research work first introduces the concept of the security zone. The hyperplane approximation method is used to obtain the essential boundaries and further determine the security zone based on the critical points. In this regard, in [17], the gas network’s security zone in the MCES concerning the impact of the integrated electrical and natural gas networks has been studied. Research on evaluating the reliability of an MCES based on the concept of energy hub [22] has been analyzed. Assessing the reliability of the MCES under the uncertainty of the natural gas pipeline network is accomplished in [23]. In this study, an analytical method that can provide a probabilistic aspect of gas network pipelines is adopted for evaluating the reliability of the integrated system. Likewise, a systematic methodology, which can offer managers with extensive knowledge of system reliability, is developed in [24] to analyze the supply reliability of an MCES under fluctuation of demand and uncertainties renewable resources. By formulating a bi-level optimization scheme, a model of the security-constrained economic dispatch has been presented in [24] for an integrated natural gas system with wind power penetration. The purpose of [25] is to analyze energy storage technologies from the perspective of energy security, while the influence of interdependency of electrical and natural gas networks in view of the security system has been discussed in [26].
This paper aims to offer a comprehensive model for security analysis of MCESs [27,28,29]. For this purpose, an MCES is modeled in which electrical, natural gas, and district heating networks are considered as the energy networks. The proposed model allows combining the various infrastructures of the MCES with different properties while preserves the security problem of the overall system. The model is configured in such a way that derives the right balance between the efficiency of simulation and the computational need for the security analysis. From a security perspective, this paper seeks to ensure the power system’s security to maintain the system in good working order. In the event that equipment of the power system fails (for example, the generation unit is out of the circuit due to defect; or its maximum production capacity is restricted), the rest of the system in this situation can compensate for the performance of the equipment. In conclusion, the contributions of this paper are as follows:
  • The security assessment of MCESs with various energy networks, including electrical, natural gas, and district heating networks, is analyzed.
  • In the electrical network, the NR technique is adopted to investigate possible events, where the calculation of the performance indices is made by employing the PIP and PIV for each line or component.
  • The security assessment of natural gas and district heating networks is accomplished by adopting the concept of Energy not supplied (ENS).
Finally, the applicability of the proposed strategy on the IEEE-14 bus electrical network, the IEEE 30-bus electrical network, 20 nodes Belgian natural gas network, and 14 node district heating network is investigated. Table 1 illustrates a comparison between the suggested model and the state-of-the-art methods in the literature.
The rest of this paper is organized as follows: Section 2 presents the models of Multi-carrier energy systems, while the security issue is formulated in Section 3. The security analysis is conducted in Section 4 by simulating a MCES, including electrical, natural gas, and thermal networks. The obtained results are concluded in Section 5.

2. MCES Modeling

2.1. Electrical Network

The constraints of the electrical network can be expressed using the following equations [18].
P E , i g e n = P E , i d e m + R e ( V i j = 1 N E Y i j * V j * )
Q E , i g e n = Q E , i d e m + i m ( V i j = 1 N E Y i j * V j * )
The above equations show the active and reactive power balance in an electrical network. The second part of the above equations shows the power passing through the lines connected to bus-i.

2.2. Natural Gas Network

In summary, the Equations (3)–(5) are commonly used for the gas network [33,34].
f G , i g e n = f G , i d e m + j = 1 N G f G , i j l i n e
s i g n f G , i j l i n e f G , i j l i n e 2 = C G , i j l i n e 2 P r , i 2 P r , j 2
C G , i j l i n e = ε G 18.06   T 0   D G , i j l i n e 8 / 3 P r 0 δ G L G , i j l i n e T G Z G
In this work, the analysis of load distribution in the gas network was carried out using the Newton–Raphson method. In this method, two types of nodes are considered for thermal networks—nodes whose injection flow is known, but the pressure of the corresponding node is unknown. There are other nodes that, unlike the previous type, have a known pressure but an unknown injection flow, which we will follow during the load distribution process. The nodes of the second type are generally considered as reference nodes. Finally, it should be noted that in gas networks, it is assumed that no leakage occurs during gas transmission. Thus, in solving the distribution of gas loads, the goal is to find the pressure of the nodes and the amount of flow produced by the reference node. With these values, the flow rate through the pipelines is also obtained.

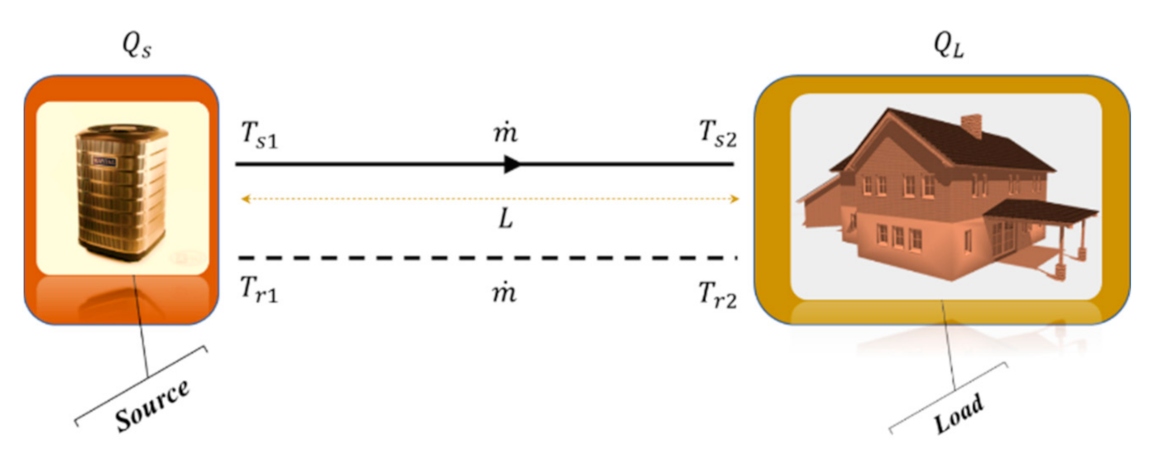
2.3. District Heating Network

A district heating network consists of two reciprocating circuits, as shown in Figure 1. The circuit transfers the hot water from the source to the loads. The heated water enters the return circuit after entering the thermal loads by losing its temperature. The return water returns to the heat sources and enters the transmission lines by increasing the temperature again and gaining the necessary thermal power, and the said cycle is completed. In the meantime, the purpose of heat network analysis is to find the amount of heat produced in reference sources, the amount of heat transferred from the lines, water flow, and heat losses resulting from the difference between ambient temperature and pipelines. The amount of heat transfer power between two points depends on the mass flow rate and the temperature difference between the two points [33,34].
In this Figure, the upper pipeline transfers the heated water from the source to the heat load. After wasting the heated water in the path of passing and crossing the thermal load and supplying it with a certain and constant temperature (assumption of this article), it leaves the heat load and returns to the source. In this case, the amount of heat sent by the source is obtained from the following equation.
Q s = m ˙ c p T s 1 T r 1
The balance of heat power in the whole system can be expressed as follows:
Q s = m ˙ c p T s 2 T r 2 + m ˙ c p T s 1 T s 2 + m ˙ c p T r 2 T r 1
The temperature drop in the heat pipelines can be expressed as follows:
T s , j = ψ H , i j l i n e T s , i T g + T g
T r , j = ψ H , i j l i n e T r , i T g + T g
ψ H , i j l i n e = exp L H , i j l i n e U c p m ˙ H , i j l i n e

2.4. Network Components

2.4.1. Gas Power Plants

Generator heat rate (HR) curves are related to the ratio of fuel consumption to power output. The mathematical expression of this problem is as follows [35]:
H R i g e n = a i g e n P E , i g e n 2 + b i g e n P E , i g e n + c i g e n
In addition, HR expresses the amount of thermal power required to produce the desired electrical power. This parameter can be used for the amount of fuel needed to create such heat power. Assuming that the fuel used by the generators is natural gas, the amount of natural gas required to generate power by this generator is obtained from (12), in which GHVG is the amount of gross heating value.
f G , i g e n = H R i g e n G H V G

2.4.2. Combined Heat and Power (CHP)

Another unit of energy production that has been studied in this work is the units of simultaneous production of heat and electricity. In many countries, CHP has been added to the power grid to generate both electricity and heat.
The heat power generated at the CHP output is considered constant. Therefore, the following equation can be used to calculate the amount of electrical power by this unit [19]:
P E , i c h p = { a i c h p Q H , i c h p + b i c h p T s , i c h p + c i c h p                                                 , d 1 , i chp Q H , i chp Q H , i c h p d 2 , i c h p Q H , i c h p , m a x a i c h p Q H , i c h p + b i c h p T s , i c h p + c i c h p y 1 , i c h p             , d 2 , i c h p Q H , i c h p , m a x Q H , i c h p d 1 , i c h p Q H , i c h p , m a x a i c h p Q H , i c h p + b i c h p T s , i c h p + c i c h p y 1 , i c h p y 2 , i c h p             , Q H , i c h p , m i n Q H , i c h p d 2 , i c h p Q H , i c h p , m a x
The parameters y 1 , i c h p and y 2 , i c h p are called load effect constants and are obtained from the following equations:
y 1 , i c h p = d 1 , i c h p Q H , i c h p , m a x Q H , i c h p e 1 , i c h p
y 2 , i c h p = d 2 , i c h p Q H , i c h p , m a x Q H , i c h p e 2 , i c h p
All the coefficients of (14) and (15) are fixed, and their values are given in [33]. To calculate the amount of gas consumed by these units, one can say:
f G , i c h p = 3.412 G H V G P E , i c h p + Q H , i c h p η t , i c h p
It is worth mentioning that the coefficient of 3.412 has been used to match the unit and dimension of the parties to the equation, because the unit G H V G is usually in terms of B T U / m 3 and the unit of interest for electrical power and thermal power in the expressed relations is watts. It should be noted that the amount of gas consumed, calculated from (16), will be in terms of standard cubic meters per hour (SCM /h).

2.4.3. Gas Boiler

The amount of gas required by the boiler to produce a certain amount of heat at its outlet can be obtained from the following equation [33]:
f G , i b o i l = 3.412 G H V G Q H , i b o i l + a i b o i l Q H , i b o i l , m a x b i b o i l

2.4.4. Compressor

Gas networks for gas transmission over long distances face pressure-drop problems in remote locations. On the other hand, a certain amount of pressure is required to supply the consumers of the network. Compressors are used to compensate for pressure drops and control their profile. The compression ratio can be expressed as follows [36]:
H G , i j c o m p = P r i , o u t c o m p P r i , i n c o m p
The amount of energy consumed by the compressor in terms of horsepower per hour is equal to:
E i j c o m p = 151.4653 η i j c o m p P r 0 T 0 λ G λ G 1 z G T G f G ,   i j l i n e H G , i j c o m p λ G 1 λ G 1
The amount of electrical power that an electric compressor consumes is related to the amount of energy it consumes, as follows:
P E , i c o m p = 745.7 × 10 6 3600 E i j c o m p

2.4.5. Circulating Pump

In the heat networks, the circulating pumps are utilized for sending and pumping heated water. The amount of power required by pumps is derived from the following equation [9]:
P E , i p u m p = m ˙ H , i p u m p g H p u m p η i p u m p

3. Security Indices in MCESs

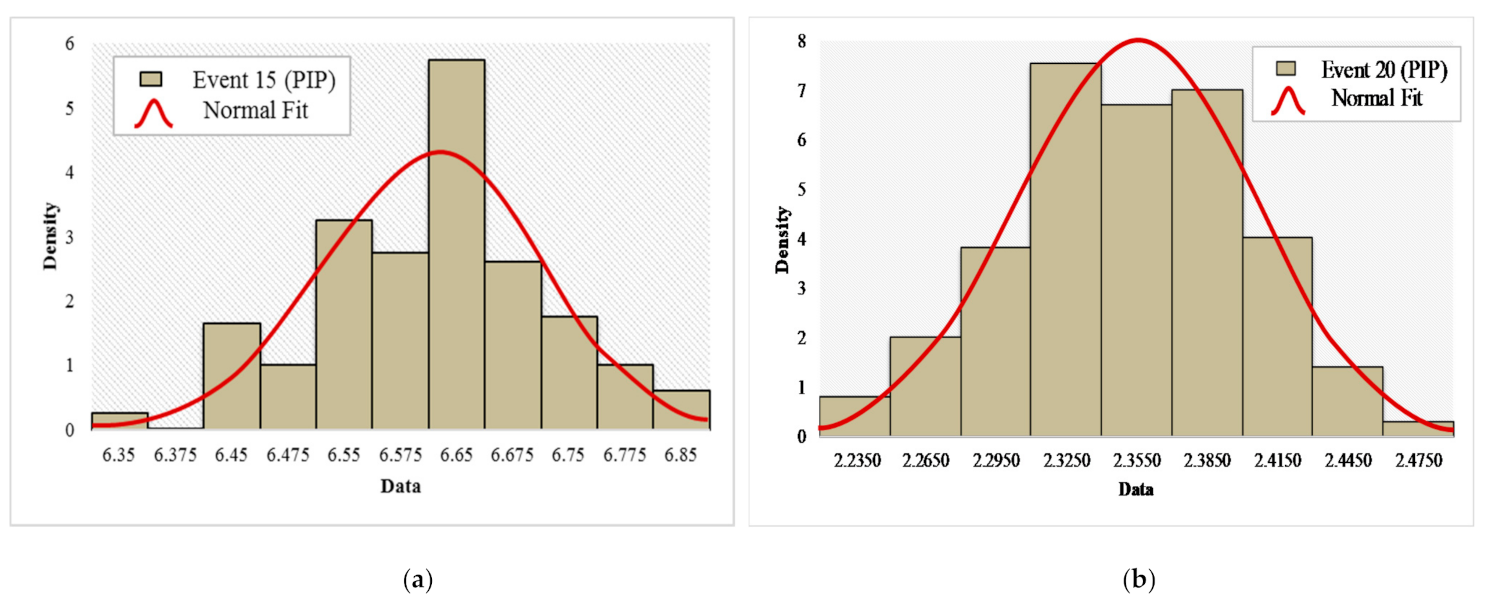
3.1. Performance Index of Power (PIP)

In assessing the safety, overload lines, transformers, and other equipment, as well as overvoltage and voltage reduction in the bus will be studied. To evaluate the static security from the point of view of overload of power system lines and equipment, the Performance Index (PI) of (22) is frequently adopted in the literature [37,38]:
P I P = l = 1 N L w l 2 n P l P l M a x 2 n
where P l is the power passing through the l the line in terms of MW and P l M a x is the maximum apparent power passing through the l the line in terms of MW (thermal limit), N L is the number of power system lines, w l is the positive weight coefficient for each line (if some network lines are more important, the weight factor for those lines can be considered larger), and n is a fixed number, where its larger values mean that the effect of overloaded lines is greater. In most studies, the values of w l and n are generally set as 1 and 2, respectively.

3.2. Performance Index of Voltage (PIV)

One of the drawbacks of the performance indicator presented above is that this relationship only considers the overload of lines and other network equipment and does not take into account the voltage of the buses. In order to solve this problem, the efficiency index for bus voltage is usually defined as the following equation [37,39]:
P I V = i = 1 M w v i 2 n V i V i s p Δ V i l i m 2 n
where V i s p = V i M a x + V i m i n / 2 and Δ V i l i m = V i M a x V i m i n / 2 . Here, w v i is the weight factor for each of the buses. If some network buses are more important, the weight factor related to those buses can be considered larger. In addition, n is a constant number, and its larger values indicate the greater effect of the buses on the voltage, which is more or less the allowable value. V i m i n and V i M a x are the minimum and maximum acceptable voltages on the ithe bus, respectively.

3.3. Energy Not Supplied (ENS)

In this paper, the Energy not supplied (ENS) is used to assess the security of natural gas and district heating networks [40,41]. This index is calculated as the amount of load lost due to the definite effect of a line or the outage of a unit. The following indicators can be used for these two networks:
f i f i = f d f g f d * 100 ,   Q I Q i = Q d Q g Q d * 100
With the output of each element of the natural gas network, f i f i is calculated. In other words, f i f i indicates the amount of gas ENS in the i the event. The higher the value of this parameter, the higher the unloaded load. Higher values of this parameter also mean an increase in untimely times. It should be noted that the district heating network has two categories of return lines. In this paper, it is assumed that if one of the lanes goes out of the network, the corresponding return line is also removed. Thus, with the output of each of these elements, Q I Q i is calculated. In other words, Q I Q i indicates the amount of thermal ENS in the event i .
The proposed method solves the problem sequentially. It should be noted that the solutions of load flow of the electrical network are derived using the NR method, while the natural gas and district heating networks are solved only by calculating the ENS values. The flowchart of the proposed model is presented as depicted in Figure 2.

4. Simulation Results

4.1. Test System

The security studies of the MCESs are carried out in the MATLAB software. Firstly, the experiments are performed in an IEEE-14 bus electrical network, which has been frequently studied in the literature [42]. In order to generalize the proposed method and use multiple networks in the simulation, in addition to the first case test, 30 electric bus networks were analyzed [34,43]. Figure 3, Figure 4, Figure 5 and Figure 6 illustrate a multi-carrier system, including an IEEE 14-bus electrical network, IEEE 30-bus electrical network, 20-node Belgian natural gas network, and 14-node district heating network. In addition, the required data are listed in Table 2. The definitions of system parameters and abbreviations are presented in nomenclature section. Connections between different devices under the networks are based on Table 3. Further details and the required data of these networks associated with each test-system are provided in [18,34,44,45].
The electrical network has two generators, three condensers, and 20 lines. In the simulation, each of these 25 items goes out of the circuit in sequence, and calculations are performed in the absence of the equipment. Security indicators are obtained in such conditions. By comparing the security indicators obtained in this situation, we can comment on the electrical network. It should be noted that in the electrical network, in one of the cases related to the outage of lines, part of the network becomes an island. In this application, the standard NR technique is utilized to solve the system equations, which is described completely in [18].

4.2. Results and Discussion

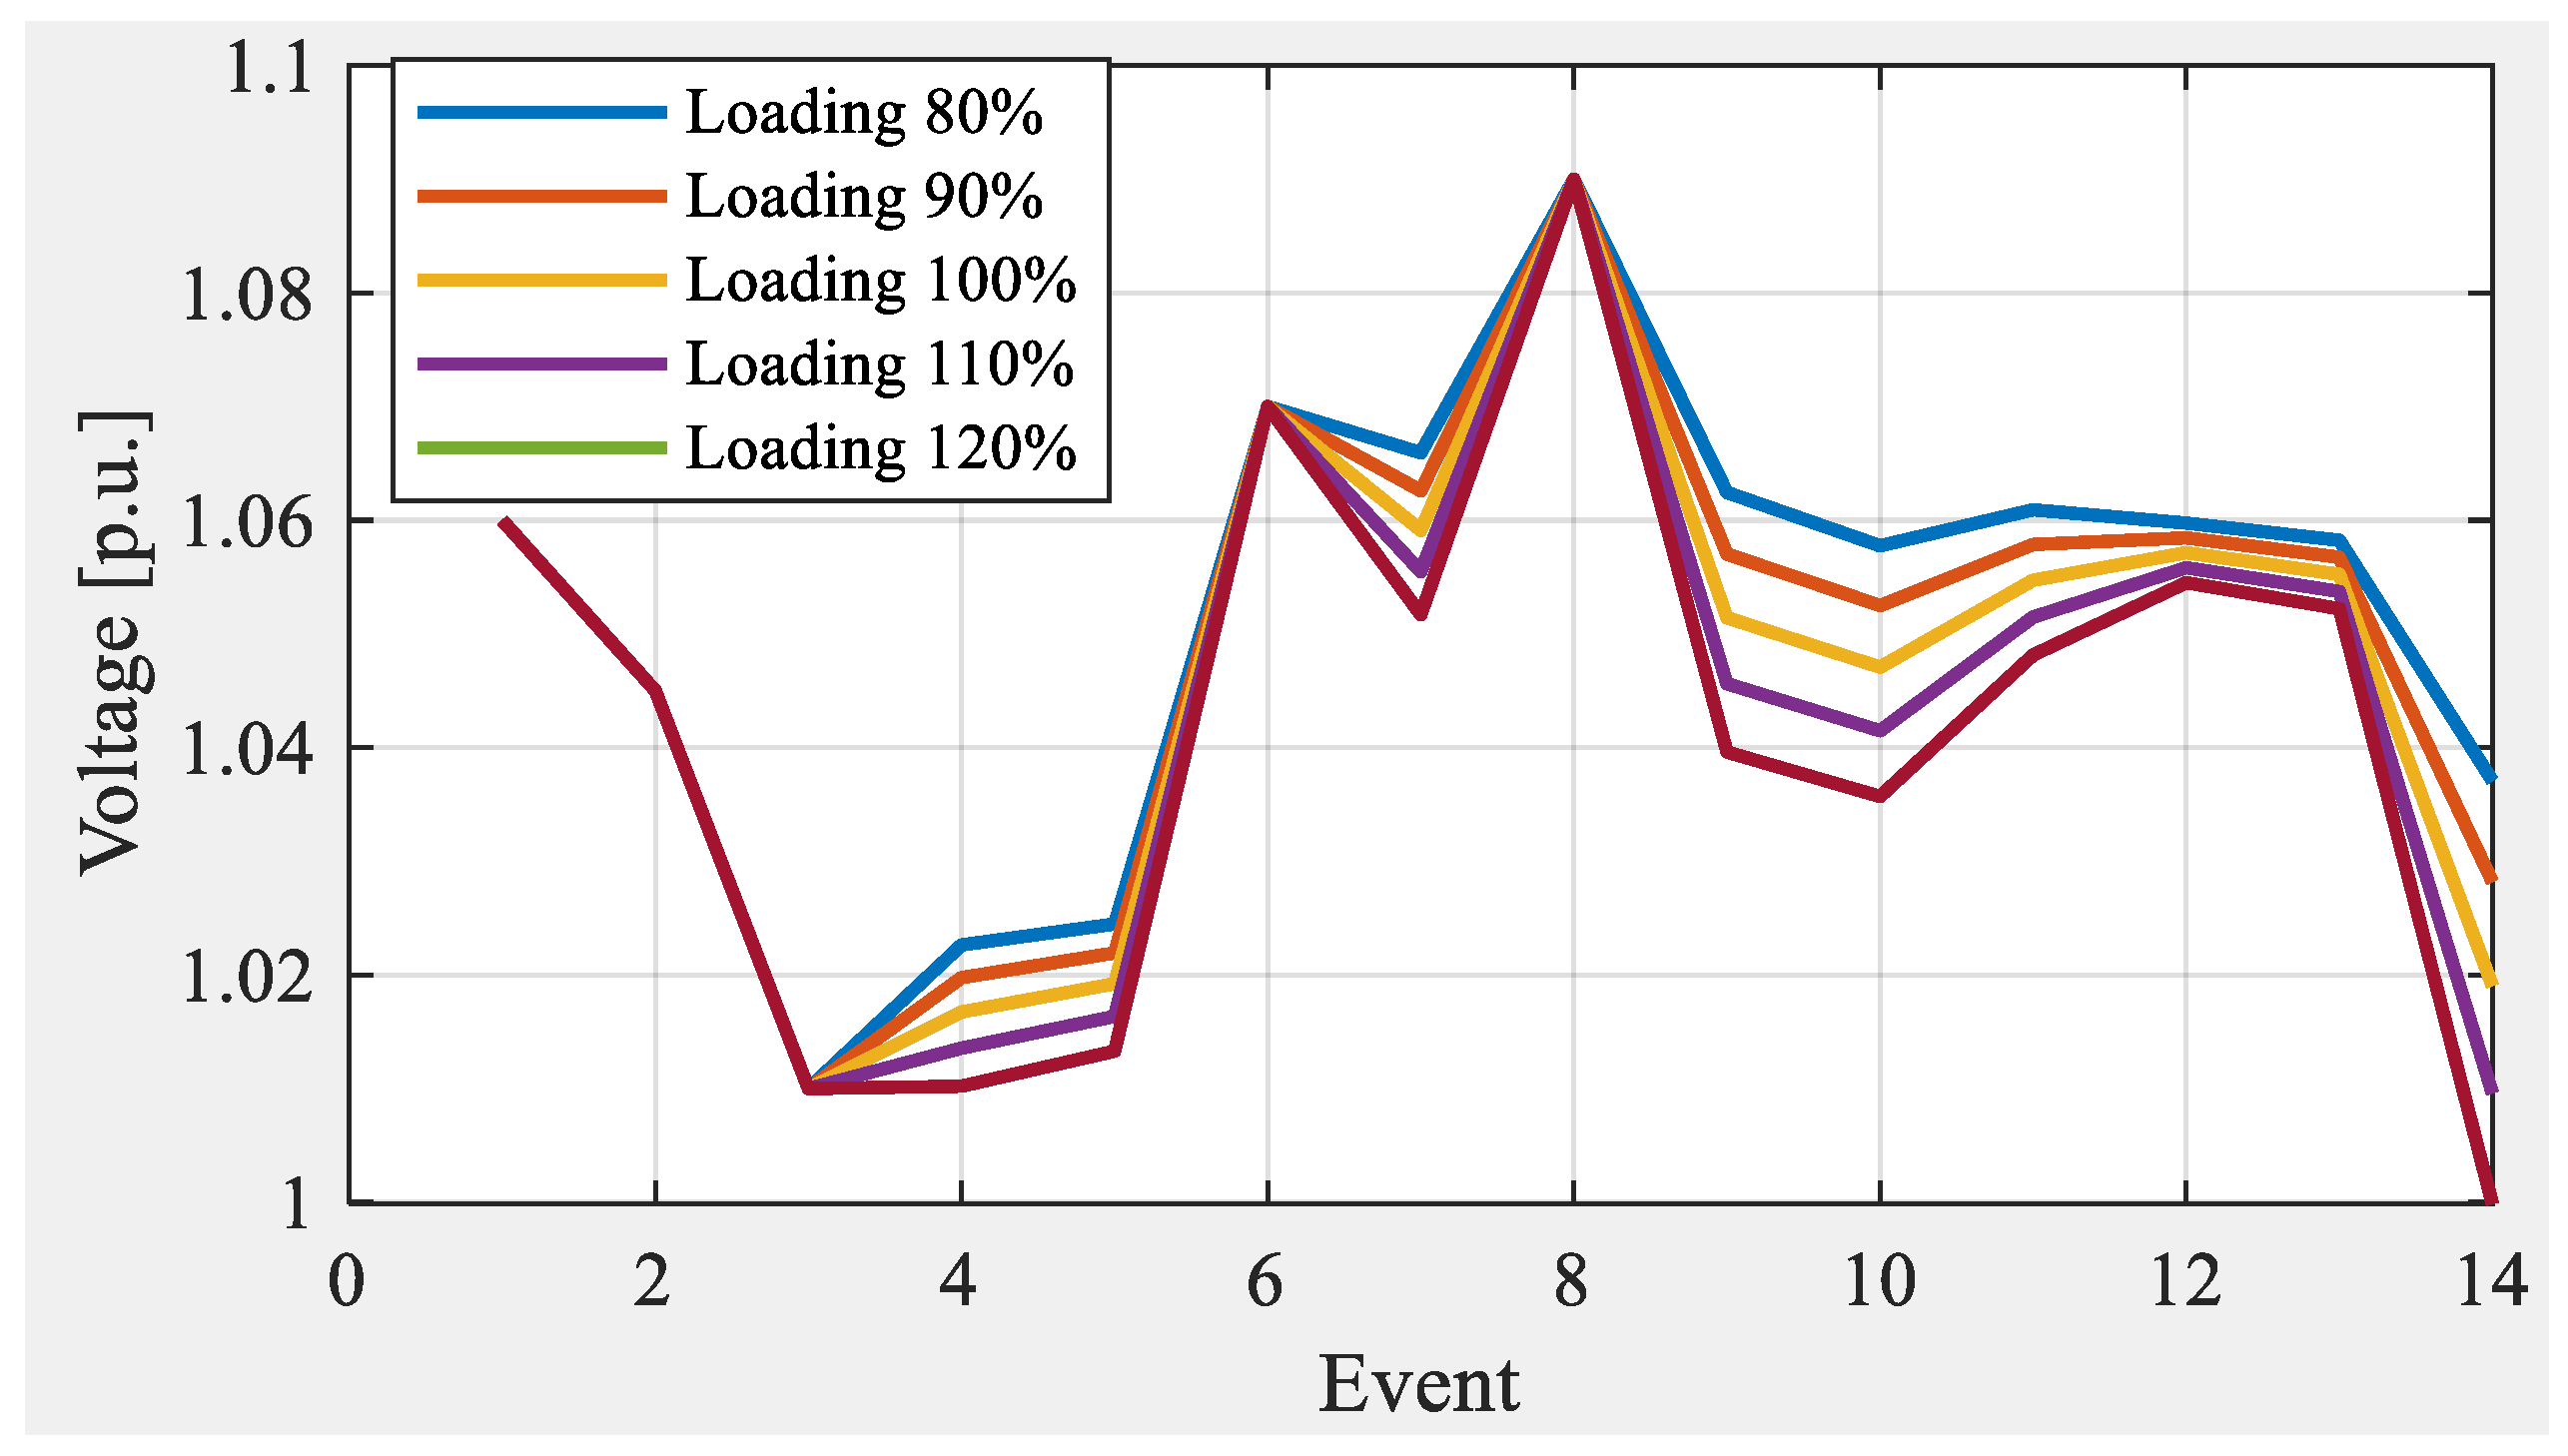
4.2.1. Test-System1: (IEEE 14-Bus)

The values obtained for security indicators in the electrical network are given in Figure 7. In Figure 7, the first five events are related to the outage of generator and condenser units, while another 20 events are obtained from the outage of the lines. The values obtained in the bar charts are indicators for PIV and the PIP through the lines. When these values are larger, the outage conditions of the unit or the corresponding line becomes more sensitive. Based on the results, the highest values for the indicators introduced occurred at the outage of line 10, where this line is between buses 5 and 6. According to Figure 7, the outage of the above line creates a significant effect on the network, which is also confirmed by the obtained indicators.
There are nine heat supply sources and 13 heat lines in the district heating network. In this network, five boilers and four CHPs are installed, which are responsible for supplying heat to the loads. With the departure of each of these nine equipment or lines related to the network, the ENS coefficient is calculated. By comparing them, the most effective lines can be identified so that the security of the network can be provided to an acceptable level. Obviously, due to the radial structure of the thermal network, the output of each line divides the network into two separate parts. Network security requires that production units in each of the sub-sectors are able to meet the needs of consumers. Therefore, if the amount of production in a part is higher than the amount of consumption, in such circumstances, all the needs of the network will be met in that part. Otherwise, part of the load will be unsecured, which is given in the ENS coefficient.
Similar to thermal networks, in the natural gas network, the goal is to remove gas lines and tanks, which will be used to obtain the ENS coefficient for the network. There are six gas tanks and 19 pipelines in the natural gas network. Gas networks also have a radial structure and when a line leaves them, the network is divided into two separate parts. Similar to the above, to supply all consumers in the event of an outage of units or lines, the amount of gas tank production must be higher than the amount consumed in that sector.
The curves of ENS corresponding to the natural gas and thermal networks are illustrated in Figure 8a,b, respectively. In Figure 8, the values of the first events are related to the output of the units and the output of the lines is given after that. For example, in the ENS of the natural gas network, the first six events are related to the outage of gas tanks, while the next 19 numbers are related to the outage of lines. The highest value obtained for the gas network is related to the outage of lines 10 and 11, which led to the value of 54.0026 for the security index. In the district heating network, the first nine values are related to the outage of heat production units, and the next 13 numbers are for the outage of lines. In the thermal network, the highest value obtained for ENS is related to the slack boiler, which is equal to 45.3125. In other words, the outage of the slack boiler has led to the highest ENS value.
One of the standard tools for evaluating the performance of integrated systems is sensitivity analysis. In this section, the sensitivity of security indicators to the amount of electrical network load is examined. Therefore, in Figure 9 and Figure 10, the sensitivity of security indicators (PIV and PIP) from 80 to 120% loading is plotted.
By comparing Figure 11 and Figure 12, it can be observed that, for example, 80% load has the highest PIP value and the lowest PIV value, while for 120% loading, the opposite happened. In terms of voltage profile, the voltage sensitivity of electrical network buses can also be obtained by the amount of load, where this problem is illustrated in Figure 11.
Sometimes security indicators can be examined in the probabilistic space. In this way, it first considers the network loads as probabilities, and then repeats them in 100 simulation scenarios using the Monte Carlo method. In this section, the results of scenarios 75 and 100 are given, for example, in Figure 12 and Figure 13.
The critical observation of Figure 12 and Figure 13 reveals which of the highest values obtained for PIV and PIP at both the scenarios (scenario 75 and scenario 100) is related to the event 15the. In scenario 75, the event 15the is as 6.0950 for PIV and 6.6478 for PIP, while it is obtained as 6.0942 for PIV and 6.6901 for PIP in scenario 100. Thus, it can be inferred that among the 25 events, the worst condition is imposed on the network by this event 15the.
In the natural gas and district heating networks, these values are kept constant due to no-load distribution. While they can be changed if needed. To better express the potential problem, events 15 and 20 are obtained from the security indicators of PIV and PIP which are illustrated in Figure 14 and Figure 15, respectively. These figures demonstrate the probability of each outage where the shapes are approximated by a normal curve.
In Figure 14 and Figure 15, based on the normal distribution functions, 100 random samples are selected for the electrical network loads. For each of the outages in the electrical network, the values of PIP and PIV are obtained for all these possible samples. The 15th event experienced higher values in comparison with the 20th event, which confirms that the worst condition of supply is imposed on the network by the 15th event, as demonstrated in the previous analysis.

4.2.2. Test-System 2: (IEEE 30-Bus)

The 30-bus electrical network has 6 generators and 41 transmission lines. Similar to the previous case test, in the simulation of each of the above 47 cases, the circuit of elements are cut off and calculations are performed in the absence of the element. As an example, the values obtained for security indicators at a specific load (network outage load) for the electrical network are given in Figure 16. In this Figure, the first six lines related to the outage of generator units and another 41 lines related to the outage of lines are obtained. According to the results, the highest value for the PIV index occurred at the outage of the third generator, and the highest value for the PIP occurred at the outage of the 30th line.
Figure 17 shows the ENS values of gas and thermal networks. It is observed that due to the different amount of fuel consumption of the units related to the 30-bus network, the values obtained in this test-system are different compared to the corresponding case in the first test-system (IEEE 14-bus).
In order to analyze the sensitivity indices in the probabilistic way, the network loads are considered as probabilistic, and implemented in 100 scenarios by Monte Carlo method. In this section, for example, the results of scenario 75 are illustrated in Figure 18. Possible behavior related to event 20 is obtained from the security indicators, as depicted in Figure 19.

5. Conclusions

The MCESs consisting of electrical, natural gas, and thermal networks have always been of interest to operators. One of the most important studies related to such networks is the study of a security problem concerning its components and energy carriers. This paper examined security with indicators appropriate to each network, including PIP/PIV for electrical networks and the ENS index for natural gas and thermal networks. Firstly, the safe operation of an electrical network for an IEEE 14-bus was investigated, and the critical security indicators in the network (PIV and PIP) from 80 to 120% loading were analyzed and compared. For a comprehensive study of MCES security analysis, the ENS of natural gas and district heating networks was assessed. By implementing the Monte Carlo technique with 100 simulation repetitions, security indicators were evaluated using the probabilistic method. In addition, the probability distribution corresponding to the PIP and PIV for the 15the and 20the events were analyzed. The simulation outcomes confirm that the proposed method is suitable for checking the security of subnets. To study the feasibilities of the suggested approach, the study is extended to a more complex plant, entitled the IEEE 30-bus system. The results show that by changing the case study and the networks under study, the proposed method is still effective and not dependent on the problem conditions. In addition, the proposed method is not dependent on the system elements and their number, and can be adopted for any number of equipment installed in the subnets.

Author Contributions

Formal analysis, T.N.; Investigation, J.E.; Resources, M.S. All authors have read and agreed to the published version of the manuscript.

Funding

This research received no external funding.

Institutional Review Board Statement

Not applicable.

Informed Consent Statement

Not applicable.

Data Availability Statement

The data presented in this study are available on request from the corresponding author.

Conflicts of Interest

The authors declare no conflict of interest.

Nomenclature

A. MCES Coefficients/Variables
V i , V j Voltage amplitude of buses i   and j
Y i j Admittance between buses i   and j
P E , i d e m , Q E , i d e m Active and reactive demand of the ithe bus
θ i , θ j Voltage angle of buses i   and j
θ i j Difference between angles of buses i and bus   j
G E , i j l i n e ,   B E , i j l i n e Conductance and sustenance of transmission line between buses i and j
f G , i j l i n e Gas flow passing through the pipeline connected between nodes i and   j
f G , i d e m , C G , i j l i n e Gas demand and constant of the pipeline connected between nodes i and j
δ G Gas density against air
ε G Specific gravity of the gas
Z G Average coefficient of gas compressibility
λ G , T G Specific heat ratio and gas temperature
L G , i j l i n e , D G , i j l i n e Length and diameter of the gas pipeline between nodes i and j
P r , i ,   P r , j Gas pressures related to nodes i and j
P r 0 , T 0 Standard values of pressure and temperature
m ˙ Mass flow rate of through pipelines
T s i , T r i Supply and return temperature at node i
c p Water specific heat capacity
ψ H , i j l i n e Transmission pipe constant
T g Ambient temperature
U Heat transfer coefficient of the pipe length
L H , i j l i n e , m ˙ H , i j l i n e Length and mass flow rate between nodes i and j
a i g e n , b i g e n , c i g e n Cost coefficient of the ith generator
P E , i g e n Generated power by ith generator
H R i g e n Heat rate of the ith generator
G H V G Gross heating value
P E , i c h p ,   Q H , i c h p Electrical and heat power of ith CHP
Q H , i c h p , m i n ,   Q H , i c h p , m a x Minimum/maximum amount of heat output
T s , i c h p Supply temperature of ith CHP
y 1 , i c h p ,   y 2 , i c h p Load effect variables
η t , i c h p Thermal efficiency of the ith CHP
Q H , i b o i l Heat power of the ith boiler
a i b o i l ,   b i b o i l Part load constants of the ith boiler
P r i , i n c o m p ,   P r i , o u t c o m p Inlet and outlet pressures of ith compressor
η i j c o m p Compressor efficiency
m ˙ H p u m p Mass flow rate through the pump
H p u m p Pump head
g Ground gravity
η i p u m p Efficiency of the ith circulating pump
B. Security Assessment Coefficients/Variables
P l Power passing through the line l
P l M a x Maximum apparent power passing through line l
N L Number of lines in the power system
w l Positive weight coefficient of network lines
n Constant parameter
w v i Weight factor for the bus i
V i m i n , V i M a x Minimum/maximum acceptable voltages on the bus i
f i f i , Q I Q i Amount of gas and thermal ENS in the event i
Abbreviations
MCESMulti-carrier energy system
OPFOptimal power flow
CHPCombined heat and power
ENSEnergy not supplied
HRHeat rate
GHVGross heating value
MCMonte Carlo
PIPPower performance index
PIVVoltage performance index

References

  1. Arabkoohsar, A.; Nami, H. Thermodynamic and economic analyses of a hybrid waste-driven CHP–ORC plant with exhaust heat recovery. Energy Convers. Manag. 2019, 187, 512–522. [Google Scholar] [CrossRef]
  2. Diesendorf, M.; Elliston, B. The feasibility of 100% renewable electricity systems: A response to critics. Renew. Sustain. Energy Rev. 2018, 93, 318–330. [Google Scholar] [CrossRef]
  3. Arabkoohsar, A.; Andresen, G. Supporting district heating and cooling networks with a bifunctional solar assisted absorption chiller. Energy Convers. Manag. 2017, 148, 184–196. [Google Scholar] [CrossRef]
  4. Nazari-Heris, M.; Mohammadi-Ivatloo, B.; Asadi, S. Optimal Operation of Multi-Carrier Energy Networks Considering Uncertain Parameters and Thermal Energy Storage. Sustainability 2020, 12, 5158. [Google Scholar] [CrossRef]
  5. Martinez-Mares, A.; Fuerte-Esquivel, C.R. A Unified Gas and Power Flow Analysis in Natural Gas and Electricity Coupled Networks. IEEE Trans. Power Syst. 2012, 27, 2156–2166. [Google Scholar] [CrossRef]
  6. Geidl, M.; Andersson, G. Operational and structural optimization of multi-carrier energy systems. Eur. Trans. Electr. Power 2006, 16, 463–477. [Google Scholar] [CrossRef]
  7. Nazari-Heris, M.; Mohammadi-Ivatloo, B.; Asadi, S. Optimal operation of multi-carrier energy networks with gas, power, heating, and water energy sources considering different energy storage technologies. J. Energy Storage 2020, 31, 101574. [Google Scholar] [CrossRef]
  8. Geidl, M.; Andersson, G. Operational and topological optimization of multi-carrier energy systems. In Proceedings of the International Conference on Future Power Systems, Amsterdam, The Netherlands, 16–18 November 2005; p. 6. [Google Scholar]
  9. Geidl, M.; Andersson, G. Optimal Power Flow of Multiple Energy Carriers. IEEE Trans. Power Syst. 2007, 22, 145–155. [Google Scholar] [CrossRef]
  10. Waller-Hunter, J. Caring for Climate: A Guide to the Climate Change Convention and the Kyoto Protocol; UNFCCC: Bonn, France, 2005. [Google Scholar]
  11. Heris, M.-N.; Mirzaei, M.A.; Asadi, S.; Mohammadi-Ivatloo, B.; Zare, K.; Jebelli, H.; Marzband, M. Evaluation of hydrogen storage technology in risk-constrained stochastic scheduling of multi-carrier energy systems considering power, gas and heating network constraints. Int. J. Hydrogen Energy 2020, 45, 30129–30141. [Google Scholar] [CrossRef]
  12. Niemi, R.; Mikkola, J.; Lund, P. Urban energy systems with smart multi-carrier energy networks and renewable energy generation. Renew. Energy 2012, 48, 524–536. [Google Scholar] [CrossRef]
  13. Geidl, M. Integrated Modeling and Optimization of Multi-Carrier Energy Systems. Ph.D. Thesis, Technical University ETH Zurich, Zurich, Switzerland, 2007. [Google Scholar]
  14. Arnold, M.; Andersson, G. Decomposed Electricity and Natural Gas Optimal Power Flow. Available online: https://citeseerx.ist.psu.edu/viewdoc/download?doi=10.1.1.164.5769&rep=rep1&type=pdf (accessed on 1 January 2021).
  15. Moeini-Aghtaie, M.; Abbaspour, A.; Fotuhi-Firuzabad, M.; Hajipour, E. A Decomposed Solution to Multiple-Energy Carriers Optimal Power Flow. IEEE Trans. Power Syst. 2013, 29, 707–716. [Google Scholar] [CrossRef]
  16. Li, Q.; An, S.; Gedra, T.W. Solving Natural Gas Loadflow Problems Using Electric Loadflow Techniques. pp. 1–7. Available online: https://citeseerx.ist.psu.edu/viewdoc/download?doi=10.1.1.80.9709&rep=rep1&type=pdf (accessed on 28 February 2021).
  17. Li, X.; Tian, G.; Shi, Q.; Jiang, T.; Li, F.; Jia, H. Security region of natural gas network in electricity-gas integrated energy system. Int. J. Electr. Power Energy Syst. 2020, 117, 105601. [Google Scholar] [CrossRef]
  18. Shabanpour-Haghighi, A.; Seifi, A.R. An Integrated Steady-State Operation Assessment of Electrical, Natural Gas, and District Heating Networks. IEEE Trans. Power Syst. 2015, 31, 3636–3647. [Google Scholar] [CrossRef]
  19. Gargari, M.Z.; Ghaffarpour, R. Reliability evaluation of multi-carrier energy system with different level of demands under various weather situation. Energy 2020, 196, 117091. [Google Scholar] [CrossRef]
  20. Bai, L.; Li, F.; Jiang, T.; Jia, H. Robust Scheduling for Wind Integrated Energy Systems Considering Gas Pipeline and Power Transmission N-1 Contingencies. IEEE Trans. Power Syst. 2016, 32, 1. [Google Scholar] [CrossRef]
  21. Chen, S.; Wei, Z.; Sun, G.; Sun, Y.; Lu, N. Steady-state security regions of electricity-gas integrated energy systems. In Proceedings of the IEEE Power and Energy Society General Meeting (PESGM), Boston, MA, USA, 17–21 July 2016; pp. 1–5. [Google Scholar]
  22. Li, G.; Kou, Y.; Jiang, J.; Lin, Y.; Bie, Z. Researches on the reliability evaluation of integrated energy system based on Energy Hub. In Proceedings of the China International Conference on Electricity Distribution (CICED), Xi’an, China, 10–13 August 2016; pp. 1–9. [Google Scholar]
  23. Yang, H.; Zhang, Y.; Ma, Y.; Zhang, D.; Sun, L.; Xia, S. Reliability assessment of integrated energy system considering the uncertainty of natural gas pipeline network system. IET Gener. Transm. Distrib. 2019, 13, 5033–5041. [Google Scholar] [CrossRef]
  24. Li, G.; Zhang, R.; Jiang, T.; Chen, H.; Bai, L.; Li, X. Security-constrained bi-level economic dispatch model for integrated natural gas and electricity systems considering wind power and power-to-gas process. Appl. Energy 2017, 194, 696–704. [Google Scholar] [CrossRef]
  25. Azzuni, A.; Breyer, C. Energy security and energy storage technologies. Energy Procedia 2018, 155, 237–258. [Google Scholar] [CrossRef]
  26. Li, T.; Eremia, M.; Shahidehpour, M. Interdependency of Natural Gas Network and Power System Security. IEEE Trans. Power Syst. 2008, 23, 1817–1824. [Google Scholar] [CrossRef]
  27. Yan, M.; Zhang, N.; Ai, X.; Shahidehpour, M.; Kang, C.; Wen, J. Robust two-stage regional-district scheduling of multi-carrier energy systems with a large penetration of wind power. IEEE Trans. Sustain. Energy 2018, 10, 1227–1239. [Google Scholar] [CrossRef]
  28. Shariatkhah, M.-H.; Haghifam, M.-R.; Parsa-Moghaddam, M.; Siano, P. Modeling the reliability of multi-carrier energy systems considering dynamic behavior of thermal loads. Energy Build. 2015, 103, 375–383. [Google Scholar] [CrossRef]
  29. Fathtabar, H.; Barforoushi, T.; Shahabi, M. Dynamic long-term expansion planning of generation resources and electric transmission network in multi-carrier energy systems. Int. J. Electr. Power Energy Syst. 2018, 102, 97–109. [Google Scholar] [CrossRef]
  30. Naik, S.; Khedkar, M.; Bhat, S. Effect of line contingency on static voltage stability and maximum loadability in large multi bus power system. Int. J. Electr. Power Energy Syst. 2015, 67, 448–452. [Google Scholar] [CrossRef]
  31. Pazouki, S.; Mohsenzadeh, A.; Ardalan, S.; Haghifam, M. Optimal place, size, and operation of combined heat and power in multi carrier energy networks considering network reliability, power loss, and voltage profile. IET Gener. Transm. Distrib. 2016, 10, 1615–1621. [Google Scholar] [CrossRef]
  32. Lei, Y.; Hou, K.; Wang, Y.; Jia, H.; Zhang, P.; Mu, Y.; Jin, X.; Sui, B. A new reliability assessment approach for integrated energy systems: Using hierarchical decoupling optimization framework and impact-increment based state enumeration method. Appl. Energy 2018, 210, 1237–1250. [Google Scholar] [CrossRef]
  33. Liu, X.; Jenkins, N.; Wu, J.; Bagdanavicius, A. Combined Analysis of Electricity and Heat Networks. Energy Procedia 2014, 61, 155–159. [Google Scholar] [CrossRef] [Green Version]
  34. Shabanpour-Haghighi, A.; Seifi, A.R. Simultaneous integrated optimal energy flow of electricity, gas, and heat. Energy Convers. Manag. 2015, 101, 579–591. [Google Scholar] [CrossRef]
  35. Liu, X.; Wu, J.; Jenkins, N.; Bagdanavicius, A. Combined analysis of electricity and heat networks. Appl. Energy 2016, 162, 1238–1250. [Google Scholar] [CrossRef] [Green Version]
  36. Shabanpour-Haghighi, A.; Seifi, A.R. Energy Flow Optimization in Multicarrier Systems. IEEE Trans. Ind. Inform. 2015, 11, 1067–1077. [Google Scholar] [CrossRef]
  37. Sachan, S.; Gupta, C. Analysis of contingent conditions in power system. In Proceedings of the 2014 Students Conference on Engineering and Systems, Allahabad, India, 28–30 May 2014; pp. 1–5. [Google Scholar]
  38. Sekhar, P.; Mohanty, S. Power system contingency ranking using Newton Raphson load flow method. In Proceedings of the Annual IEEE India Conference (INDICON), Mumbay, India, 13–15 December 2013; pp. 1–4. [Google Scholar]
  39. Gongada, S.R.; Rao, T.S.; Rao, P.M.; Salima, S. Power system contingency ranking using fast decoupled load flow method. In Proceedings of the International Conference on Electrical, Electronics and Optimization Techniques (ICEEOT), Chennai, India, 3–5 March 2016; pp. 4373–4376. [Google Scholar]
  40. Hashemi-Dezaki, H.; Askarian-Abyaneh, H.; Haeri-Khiavi, H. Reliability optimization of electrical distribution systems using internal loops to minimize energy not-supplied (ENS). J. Appl. Res. Technol. 2015, 13, 416–424. [Google Scholar] [CrossRef] [Green Version]
  41. Heggset, J.; Kjolle, G.H.; Trengereid, F.; Ween, H.O. Quality of supply in the deregulated Norwegian power system. In Proceedings of the IEEE Porto Power Techology Proceedings (Cat. No.01EX502), Porto, Portugal, 10–13 September 2001. [Google Scholar]
  42. Unsihuay, C.; Lima, J.W.M.; De Souza, A.Z. Modeling the Integrated Natural Gas and Electricity Optimal Power Flow. In Proceedings of the IEEE Power Engineering Society General Meeting, Tampa, FL, USA, 24–28 June 2007; pp. 1–7. [Google Scholar]
  43. Soeprijanto, A.; Abdillah, M. Type 2 fuzzy adaptive binary particle swarm optimization for optimal placement and sizing of distributed generation. In Proceedings of the 2nd International Conference on Instrumentation Communications, Information Technology, and Biomedical Engineering, Bandung, Indonesia, 8–9 November 2011; pp. 233–238. [Google Scholar]
  44. Iyambo, P.; Tzoneva, R. Transient stability analysis of the IEEE 14-bus electric power system. In Proceedings of the 2nd International Conference on Instrumentation, Communications, Information Technology and Biomedical Engineering, Bandung, Indonesia, 8–9 November 2011; pp. 1–9. [Google Scholar]
  45. De Wolf, D.; Smeers, Y. The Gas Transmission Problem Solved by an Extension of the Simplex Algorithm. Manag. Sci. 2000, 46, 1454–1465. [Google Scholar] [CrossRef] [Green Version]
Figure 1. Heat network with a reciprocating path.
Sustainability 13 03102 g001
Figure 2. The flowchart of the proposed model.
Sustainability 13 03102 g002
Figure 3. The IEEE 14-bus electrical network.
Sustainability 13 03102 g003
Figure 4. The IEEE 30-bus electrical network.
Sustainability 13 03102 g004
Figure 5. The 20-node natural gas network.
Sustainability 13 03102 g005
Figure 6. The 14-node district heating network.
Sustainability 13 03102 g006
Figure 7. Security indicators of the electrical network corresponding to test-system 1.
Sustainability 13 03102 g007
Figure 8. The graphs of the ENS (Energy not supplied) index corresponding to test-system 1 for (a) natural gas, and (b) thermal networks.
Sustainability 13 03102 g008
Figure 9. Sensitivity of the PIV (Performance index of voltage) index to load changes.
Sustainability 13 03102 g009
Figure 10. Sensitivity of PIP (Performance index of power) index to load changes.
Sustainability 13 03102 g010
Figure 11. The sensitivity of electrical network voltage to load changes.
Sustainability 13 03102 g011
Figure 12. Security indicators for the electrical network of test-system 1 in scenario 75.
Sustainability 13 03102 g012
Figure 13. Security indicators for the electrical network of test-system 1 in scenario 100.
Sustainability 13 03102 g013
Figure 14. The probability distribution of the PIV index for test-system 1 corresponding to (a) the 15th event, and (b) the 20th event.
Sustainability 13 03102 g014
Figure 15. The probability distribution of the PIP index for test-system 1 corresponding to (a) the 15th event, and (b) the 20th event.
Sustainability 13 03102 g015
Figure 16. Security indicators of the electrical network corresponding to test-system 2.
Sustainability 13 03102 g016
Figure 17. The graphs of the ENS index corresponding to test-system 2 for (a) natural gas and (b) thermal networks.
Sustainability 13 03102 g017
Figure 18. Security indicators for the electrical network of test-system 2 in scenario 75.
Sustainability 13 03102 g018
Figure 19. The probability distribution corresponding to the 20th event for test-system 2: (a) the PIV index, and (b) the PIP index.
Sustainability 13 03102 g019
Table 1. Comparison of contributions of suggested scheme and the literature.
Type of Energy
Carriers
Technique
Formulation
Energy Not-Supplied AnalysisSensitivity Analyisis of the PIV/PIV
Proposed ModelIEEE 14-bus system, IEEE 30-bus, 20-node Belgian gas network, and 14-node district 18 heating networkNewton-Raphson (N-R)
Ref. [5]IEEE 14-bus electrical network, a 15-node gas network and Belgian gas networkNewton-Raphson (N-R) ˟
Ref. [29]Six bus power network and 24-bus IEEE
electrical network
Mixed integer linear programming
(MILP)
˟
Ref. [30]26 bus power systemNewton-Raphson (N-R) ˟
Ref. [31]Electrical and gas networks with 32 demand pointsGenetic algorithm (GA) ˟
Ref. [32]IEEE-33 bus system with 14-node gas system combined with the IEEE 118-bus power system and Belgian
gas network
Hierarchical decoupling optimization ˟
Table 2. The data required for the networks.
Electrical NetworkNatural Gas NetworkDistrict Heating Network
a G C = 0.01
b G C = 4.0
c G C = 150
G H V = 40.611
η G C = 0.8
α G C = γ G C = 0
β G C = 0.001
ε G = 0.05   mm
z G = 0.8
δ G = 0.6106
λ G = 1.309
T 0 G = 273.15
T G C = 281.15
π 0 G = 1.01325
μ G = 0.288 × 10 6
c p = 4182
U H = 0.2
ρ W = 960
g = 9.81
ε H = 1.25
μ W = 0.294 × 10 6
H p = 100
η H P = 0.65
T g = 10   ° C
Table 3. Connections Between Equipment and Subnets.
UnitElectric BusGas NodeThermal Node
Slack generator112---
Generator 2219---
Compressor motor 149---
CHP, boiler, and pump6154
CHP, boiler, and pump1379
CHP, boiler, and pump14610
CHP, boiler, and pump81013
Publisher’s Note: MDPI stays neutral with regard to jurisdictional claims in published maps and institutional affiliations.

