Abstract
Deteriorating soil fertility and gradually decreasing rice productivity along with higher greenhouse gas emissions from paddy fields have emerged as serious threats to the sustainability of rice production and food security. Rice production in the subtropical environment in Bangladesh is mostly dependent on synthetic inorganic fertilizer to maintain productivity; however, the inorganic fertilizer has negative effects on global warming. Climate-smart and resilient agricultural production systems are major concerns nowadays to meet sustainable development goals. The study was conducted to evaluate the optimum rate and source of organic amendments on rice productivity and soil fertility along with CH4 emission. A total of nine nutrient combinations were used in the study. The CH4 emission, soil redox potential (Eh), soil pH, soil nitrogen and organic carbon, available phosphorus, rice grain and straw were greatly affected by the application of different rates and sources of the nutrient. However, the soil exchangeable K content, plant height, and harvest index were not affected. Among the treatments, the application of 75% recommended fertilizer (RF) + biosolid 2 t ha−1 (T3) was the most effective and showed the superior performance in terms of available P (12.90 ppm), the number of grains panicle−1 (121), and 1000-grain weight (24.6g), rice grain, and straw yield along with the moderate CH4 emission (18.25 mg m−2h−1). On the other hand, the lowest soil Eh (−158 mV) and soil pH (6.65) were measured from the treatment T3. The finding of this study revealed that the application of 75% of RF + biosolid 2 t ha−1 can be recommended as the preferable soil amendment for boosting rice yield, reduce CH4 emissions, and sustainably maintain soil fertility. Furthermore, this finding may help to introduce preferable soil amendment doses, which will contribute to boosting rice productivity and economic turnouts of the farmers.
1. Introduction
Globally, rice (Oryza sativa L.) is the second most important staple food after maize as it fulfills the dietary requirement of over half of the human population and considers as the major food crop of economic significance in Asia [1,2,3]. Among South Asian countries, Bangladesh ranks second in terms of areas and production of rice, where it is being cultivated on over 82% of the total cropped land, while aman rice shares over 37% of total rice production [4]. In Bangladesh, rice alone provides 76% of the calorie intake and 66% of the total protein requirement [5]. To ensure the food security of the increasing population, high-yielding rice cultivars are being cultivated on large scale with intensive use of chemicals (fertilizers, pesticides, etc.), but commercial oriented farming practices have seriously deteriorated soil health along with contributing to environmental pollution.
In addition to soil degradation, the modern intensive cropping systems have increased methane emission from paddy fields along with soil acidity, depletion of surface and underground water, pollution of farm and non-farm environment, and heavy metals toxicity [6]. The soil fertility status is very alarming in Bangladesh, the current average organic matter in the soil is less than 1% which has multiplied the need of fertilizers input. The use of rice residues as animal feed has seriously declined its application as soil amendment source. In addition, the use of organic matter from external sources is also negligible. The current practice where mostly depends on inorganic fertilizer is not a sustainable practice for soil fertility as well as the environment. Organic matter is called the heart of soil and amendments of soil; by applying organic matter solely or in combination with inorganic fertilizers can be a biologically and economically viable approach to maximize rice yield sustainably along with a significant reduction in methane emission from rice fields [7,8].
Cultivation of rice is an important distribution channel of anthropogenic greenhouse gas (GHG) emission, contributing to global warming and climate change aspects [9]. It has been revealed that over 50% of CH4 emissions are of anthropogenic origin globally, while irrigated and puddled rice accounts for up to 12% of this flux [10]. Another study estimated that CH4 emission from rice fields ranged 39–112 Tg CH4 annually [11]. Therefore, the reduction of CH4 emissions from paddy fields without adversely affecting crop production is direly needed to curb environmental pollution through reduced use of chemical fertilizers.
Nowadays, the use of biogas and plant by-products are becoming popular to boost the fertility status of the soil. Among plant by-products, biochar, and charcoal, also called black carbon, have emerged as valuable amendments for degraded soils [12]. Biochar application has also been reported to reduce N2O and CH4 emissions depending upon agro-environmental conditions [13]. In addition, it was found to be equally effective in alleviating heavy metal stress which severely hampers plants’ growth and microbes’ functioning in soil [14]. The rice straw compost or farmyard manure (FYM)was reported effective in minimizing CH4 emissions from the rice field, with the co-benefits of increased soil fertility and crop productivity [15]. From the above aspects, the present study was conducted to evaluate the effects of different rates of NPK (inorganic) fertilizer along with the single or combined application of biosolids and FYM concerning soil fertility, rice productivity, and CH4 emission from the transplanted aman rice field.
2. Materials and Methods
2.1. Experiment Location, Soil Characteristics, and Climate
The field experiment was conducted at the research farm of Environmental Science Field Laboratory, Bangladesh Agricultural University, Mymensingh. The area is plain land with sufficient irrigation and drainage facilities. The soil of the experimental field was silty loam in texture having a pH of 6.5. The detailed physio-chemical characteristics of the experimental soil are presented in Table 1. The climate of the region is classified as subtropical characterized by high temperatures, humidity, and precipitation during the spring season (April to September). The weather data (temperatures, relative humidity, rainfall, and sunshine hours) of the experimental site during the period of the experiment have been presented in Table 2.

Table 1.
(a) Morphological characteristics of the experimental field. (b) Physical and chemical properties of the experimental soil.
Table 2.
Monthly record of air temperature, rainfall and relative humidity of the experimental site during the period from July to December 2015.
2.2. Experimental Treatments and Design
The trial included nine treatments such as recommended fertilizer (RF, T1) (180—110—70 kg ha−1 N—P—K, respectively), 100% RF + farmyard manure (FYM) 5 t ha−1 (T2), 75% RF + biosolid 2 t ha−1 (T3), 75% RF + biosolid 2 t ha−1 + FYM 5 t ha−1 (T4), 50 RF + biosolid 4 t ha−1 (T5), 50% RF + biosolid 4 t ha−1 + FYM 5 t ha−1 (T6), 25% RF+ biosolid 6 t ha−1 (T7), 50% RF + biosolid 6 t ha−1 + FYM 5 t ha−1 (T8), and 0% RF + biosolid 8 t ha−1 + FYM 5 t ha−1 (T9). The experiment was laid out in a randomized complete block design with three replications. The experimental area was divided into three blocks and each block representing a replication. The size of the unit plot was 2.5 × 4.0 m (10 m2), where block to block and plot to plot distances were 1.0 and 0.5 m, respectively. The recommended fertilizer treatments used in this study were based on the BARC fertilizer recommendation guide. The nutrient composition of the FYM used in this study were total N = 0.8%; P = 0.3%; K = 0.6%; Organic carbon = 27.5%; and C/N: 34:1, and for the Biosolidtotal N = 1.2%; P = 0.88%; K = 0.95%; Organic carbon = 21.9%; and C/N: 18:1. The rice variety BINA Dhan–7 was used as planting material for the present study.
2.3. Land Preparation and Crop Management
The land was prepared thoroughly by performing single tillage with a tractor-drawn rotovator and subsequently plowing four times with a tractor while laddering followed it. All weeds, stubbles, and crop residues were removed from the fields to obtain desirable puddling conditions. The whole amount of muriate of potash (MoP), triple super phosphate (TSP), farmyard manure (FYM), and Biosolid (according to the treatments decided) were broadcast and incorporated into the soil during land preparation. The urea fertilizer as per the treatment plan was applied in three equal splits at 15 days after transplanting (DAT), 25 DAT, and 35 DAT. Twenty-nine days old seedlings were transplanted in each hill having hill–hill and row–row spacings of 25 cm each. Due to the frequent rains during the crop season, therefore there was no need to apply any irrigation. Weeds were managed by manual hand weeding twice, while disease and insect management remained need-based.
2.4. Data Collection
2.4.1. Crop Data
Rice grain and straw yields were measured when plants had over 90% golden yellow seeds and for this crop were harvested manually in 1 m2 area of each experimental plot. Separate bundles of harvested plants were made, tagged as per treatments, and subsequently threshed manually. The cleaning of grains was done and subsequently dried until their moisture content reached to 14%. For recording straw yield, straws were adequately sun-dried. Final grain, as well as straw yields, were recorded and converted to t ha−1. For recording plant and yield contributing characters, five hills per plot were randomly selected during the harvesting time. Plant height was recorded from plant base to the panicle tip, the number of effective tillers hill−1 was recorded by counting the tillers which developed panicle, the number of non-effective tillers hill−1 were recorded by counting the tillers which did not bear any panicle, panicle length was recorded from the neck to the apex of each panicle, numbers of filled and unfilled grains were counted randomly selected of 20 panicles, one thousand grains were randomly counted from the seed stock of each experimental plot and an electric balance was used to record their weights. Biological yield (t ha−1) was calculated using the formula:
Biological yield = Grain yield (t ha−1) + Straw yield (t ha−1)
Harvest index (%)was calculated using the formula (Gardner et al., 1985).
2.4.2. Methane Emission Data
The modified closed-chamber (size of 62 × 93 cm and transparent glasses) method was used to collect the gas samples from the paddy crop by manually installing the gas chambers in the experimental field (the middle portion of the treatment plot). The collection of gas samples was done at different growth stages of rice such as tillering, flowering and heading. The collection of gas samples was done using 50 mL gas-tight syringes. The interval between gas sample collections was 0, 10, and 20 min after chamber placement. Gas Chromatograph equipped with flame ionization detector (Shimadzu corporation, Kyoto, Japan) was used for gas samples analyses and for determination of CH4 concentration (FID). A stainless steel column having Porapak NQ (Q 80–100 mess) was used in the analysis column. The column, injector and detector temperatures were adjusted at 100 °C, and 200 °C, respectively. The concentration differences were used to calculate methane emissions rates. The samples were analyzed at the Central Laboratory of Bangladesh Agricultural University, Mymensingh.
Calculation of Methane Gas Flux
The slope curves of the linear regression against the chamber closure time (ppm min−1) was used for the estimation of CH4 emission. The emission rates recorded in ppm min−1 were subsequently converted into mg m−2d−1 as suggested by [16].
where gas chamber volume is 56.7 L, t CH4 molecular weight is 16, 60 and 24 are correction factors for data conversion on per day basis, the volume of 1 mole gas is 22.4 L and 273°K is the standard temperature inside the gas chamber.
2.4.3. Post-Harvest Soil Physio-Chemical Data
After harvest, the crop the soil was collected from each treatment plots for further soil physio-chemical analysis.
Particle size analysis: Soil analysis pertaining to particle size was done using the hydrometer method [17]. The textural class of experimental soil was determined by plotting Marshall’s triangular coordinates against recorded values of sand, silt, and clay.
Soil redox potential (Eh) and soil pH: Soil redox potential (Eh) was measured by Eh meter (Model NU HACH, USA). Glass electrode pH meter was used to measure soil pH, as described by [18].
Organic carbon: Wet oxidation method was put into use for estimation of organic carbon as suggested by [19], and the organic carbon was multiplied with Van Bemmlen factor (1.73) to record organic matter content.
Total nitrogen (N) content: Micro–Kjeldahl method was used for N estimation in the experimental soil samples. A catalyst mixture of K2SO4: CuSO4. 5H2O having a 100:10:1 ratio and concentatedH2SO4 were used for digestion of samples. Digestion was followed by distillation with NaOH (40%), and then titration of distillate trapped in H3BO3 with 0.01 N H2SO4 was performed [20].
Available phosphorus content: Olsen method was followed for available phosphorus estimation [21]. The reduction of the phospho-molybdate complex using SnCl2 gave the blue colour of the sample and subsequently color was compared colorimetrically at 660 nm wavelength.
Exchangeable potassium content: A flame photometer was used to determine exchangeable K with the help of 1N NH4OAc (pH 7.0) extract of the soil [17].
Cation exchange capacity: The ammonium acetate saturation method was used for measuring the cation exchange capacity of the soil samples. In this method, soil samples were saturated with 1N sodium acetate (NaOAc) solution. Then the soil samples were washed by 99% isopropyl alcohol. The sodium ions were replaced from saturated samples by NH4OAc solution. Displaced sodium in the solution was then measured by a flame photometer [17,20].
2.5. Statistical Analyses
Data pertaining to all recorded variables were compiled and subjected to statistical analyses. A computer based statistical program (MSTAT–C) was used for performing statistical analyses as recommended by [22]. The difference among treatment means was evaluated by employing Duncan’s multiple range test (DMRT) [23].
3. Results and Discussion
3.1. Effect of Organic Amendments on Soil Properties
3.1.1. Soil pH
The soil pH at different growth stages of rice greatly varied due to different sources and rates of nutrients applied (Figure 1). At 28 DAT, the highest pH content (6.55) of soil was recorded from 25% RF + biosolid 6 t ha−1, and the treatment biosolid 8 t ha−1 + FYM 5 t ha−1 showed statistically identical pH (6.54). The lowest pH (6.27) was recorded from the treatment 75% RF + biosolid 2 t ha−1. Similarly, at 60 DAT, 75% RF + biosolid 2 t ha−1 remained effective in lowering pH value, while 25% RF + biosolid 6 t ha−1 obtained the highest pH (6.66). At 84 DAT, the ranges of pH were 6.65 to 6.75 in all the treatments where the lowest was found from the treated soil of 75% RF + biosolid 2 t ha−1 (T3), and the highest was observed from the treated soil of both 25% RF + biosolid 6 t ha−1 and biosolid 8 t ha−1 + FYM 5 t ha−1 in (Figure 1). Results of the study showed that the pH content significantly increased with an increase in time of DAT while the minimum increase was recorded for 75% RF+ biosolid 2 t ha−1 treated soil. Previously it was reported that the biochar application significantly affected soil pH and applied organic amendment solely remained effective in reducing soil pH which led to higher availability of nutrients [9].
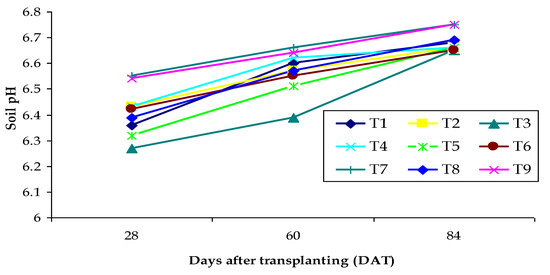
Figure 1.
Effect of different nutrient sources and rates on soil pH at different growth stages of aman rice.T1: 100% recommended fertilizer(RF); T2: 100% of RF + FYM 5 tha−1; T3: 75% of RF + Biosolid2 t ha−1; T4: 75% of RF + Biosolid2 t ha−1 + FYM 5 tha−1; T5: 50% of RF + Biosolid 4 t ha−1; T6: 50% of RF + Biosolid 4 t ha−1 + FYM 5 tha−1; T7: 25% of RF + Biosolid 6 t ha−1; T8: 50% of RF + Biosolid 6 t ha−1 + FYM 5 tha−1; T9: 0% of RF + Biosolid 8 t ha−1 + FYM 5 tha−1.
3.1.2. Soil Redox Potential
The soil redox potential(Eh) was decreased significantly with the advancement of the rice growth stages (Figure 2). The Eh was ranged from −40 to −48 mV at 14 DAT, −81 to −91 mV at 28 DAT, −149 to −174mV at 60 DAT, and −158 to −270 mV at 84 DAT. At 14 and 28 DAT, the Eh was similar for all the treatments; however, the profound difference was recorded from the growth stage at 60 and 84 DAT. At 60 DAT, plots treated with 75% RF+ biosolid 2 t ha−1 showed the higher capability to reduce the increment amount of soil redox potential (−149 mV). At 84 DAT, the Eh greatly varied among treatments, the lowest and the highest reduction of Eh were recorded from 75% RF + biosolid 2 t ha−1 (−196 mV) and 50% RF + biosolid 4 t ha−1, respectively (Figure 2). Results of this study indicated that the application of biosolid with chemical fertilizer significantly reduced the reduction of Eh as compared to chemical fertilizer with FYM and sole chemical fertilizer. Ref. [9] found that the biochar application in paddy fields having loamy soils recorded lower redox potential and suppressed the CH4 emission.
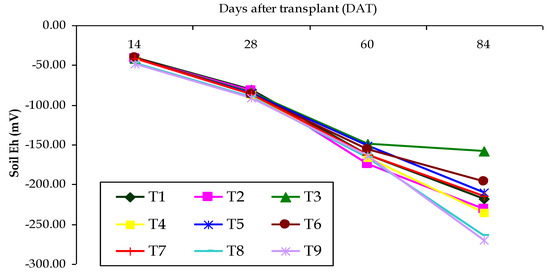
Figure 2.
Effect of different nutrient sources and rates on soil redox potential (Eh) at different growth stages of aman rice. T1:100% recommended fertilizer (RF); T2: 100% of RF + FYM 5 t ha−1; T3: 75% of RF + Biosolid2 t ha−1; T4: 75% of RF + Biosolid2 t ha−1 + FYM 5 t ha−1; T5: 50% of RF + Biosolid 4 t ha−1; T6: 50% of RF + Biosolid 4 t ha−1 + FYM 5 t ha−1; T7: 25% of RF + Biosolid 6 t ha−1; T8: 50% of RF + Biosolid 6 t ha−1 + FYM 5 t ha−1; T9: 0% of RF + Biosolid 8 t ha−1 + FYM 5 t ha−1.
3.1.3. Total Nitrogen (N)
The nitrogen content of the post-harvest soil varied significantly by different types and rates of organic amendments applied with or without inorganic fertilizers (Table 3). The treatment 0% RF + biosolid 8 t ha−1 + FYM 5 t ha−1 remained the most effective for giving the highest N content than other treatments followed by the application of biosolid 2 t ha−1 combined with 75% RF. The lowest content of N was recorded by 100% RF. This result revealed that the different types of organic amendments, such as biosolid had more capability to enhance the N content as compared to chemical fertilizer. Nigussie et al. ([24], reported that biochar application enhanced the soil properties, while [25] Kamara et al. (2015) also reported that the biochar treated soils exhibited higher N content compared to without biochar treated soil. This result implies that the enhancement of N content is mostly affected by biosolid than that of commercial fertilizer.
Table 3.
Effect of organic amendments along with or without chemical fertilizer on chemical properties and composition of post-harvest soil.
3.1.4. Organic Carbon (OC) and Organic Matter (OM) Content
Different types and rates of organic amendments applied solely or in combination with chemical fertilizers significantly influenced the organic carbon (Table 3). The OC varied from 0.71 to 2.71%, where the lowest amount of OC was found from the 100% RF. The treatment of 0% RF + biosolid 8 t ha−1 + FYM 5 t ha−1 showed the highest (2.25%) percentage of OC followed by 25% RF + Biosolid 6 t ha−1 + FYM 5 t ha−1. This result revealed that biosolid and FYM as an organic amendment could be produced more OC in soil compared to chemical fertilizer, and a similar observation was also found by [26]. They found that biochar positively affected soil fertility, such as total organic carbon (TOC). Ref. [27] also found that soil organic C was increased in biochar treated soils. Organic matter content in post-harvest soil followed the same trends to OC. Biochar could be commercialized in a broad context to obstacle the challenge of reduced organic carbon in the soil, especially in rice fields.
3.1.5. Available Phosphorus and Exchangeable Potassium
The available phosphorus content in post-harvest soil varied significantly due to the effect of different organic amendments applied solely or in combination chemical fertilizers (Table 3). The highest content of phosphorus (12.90 ppm) was recorded from the treated soil of 75% RF + biosolid 2 t ha−1 (T2). The treatments 50% RF + biosolid 4 t ha−1 (T5), 25% RF + biosolid 6 t ha−1 (T7), and biosolid 8 t ha−1 + FYM 5 t ha−1 (T9) treated soil had statistically similar P content. The plots treated with 100% RF (without organic amendments) gave the lowest content of P (9.80 ppm) (Table 3). This result indicated that the application of biosolid as an organic amendment had more effective in producing more P content as compared to the sole application of inorganic fertilizer and even organic FYM. The results of this study are at par with the results of the previous study of [25] where biochar improved the available phosphorus, exchangeable cations, and cation exchange capacity of the soils. However, the exchangeable potassium content in the post-harvest soil was not affected by different organic amendments (Table 3).
3.1.6. Effect of Organic Amendments on Rice Productivity
Plant height in the study was not affected by different sources and doses of organic amendments (Table 4).
Table 4.
Effect of organic amendments along with or without chemical fertilizer on growth, yield, and yield contributing characters of BINAdhan–7.
Number of grains panicle−1 were affected by different rates and sources of the nutrient and the highest number of grains panicle−1 (121.3) were recorded for 75% RF + biosolid 2 t ha−1, while and the lowest (116.7) was given by 50% RF + biosolid 4 t ha−1 + FYM 5 t ha−1. The intermediate grains panicle−1 were recorded from the treatment RF. Ref. [28] found significant variation in the number of grains panicle−1, where they found that grains panicle−1 was the highest in plots treated with combined application of FYM and inorganic fertilizers.
The highest 1000-grain weight was recorded for 75% RF + biosolid 2 t ha−1 while 100% NPK showed the lowest 1000 (Table 4). The higher organic matter remained effective and biologically viable in increasing the 1000-grain weight as reported by many previous studies [28,29]. The grain yield ranged from 3400–5250 kg ha−1, and 75% RF + biosolid 2 t ha−1 produced the highest grain yield while the lowest was recorded for 25% RF + biosolid 6 t ha−1 + FYM 5 t ha−1 (Table 4). The highest grain yield in treatment RF + biosolid 2 t ha−1 compared to RF might be due to the highest contribution of a number of grains panicle−1, and 1000-grain weight. Ref. [14] found that the soil amendment using biochar increased rice yield by 25–26% compared to inorganic fertilizers, while [25] found that the most remarkable increase in rice plant growth and yield contributing characteristics was attributed to biochar addition in the soil.
Similar to the rice grain yield, straw yield also varied significantly among the different treatments of organic amendments (Table 4). The highest straw yield was found 25% RF + biosolid 6 t ha−1), which was statistically identical to 50% RF+ biosolid 4 t ha−1 and 75% RF + biosolid 2 t ha−1. The treatment 25% RF + biosolid 6 t ha−1 + FYM 5 t ha−1 showed the lowest yield of straw (Table 4). Refs. [29,30] recorded significant variation in straw yield due to different organic amendments where FYM at the rate of 5 t ha−1 remained superior by producing significantly higher straw yield. Ref. [5] also found that the highest straw yield was found with the treatment of poultry litter, followed by FYM, livestock manure, MSW compost, biochar, vermicompost, and control, respectively. The harvest index did not differ significantly due to different organic amendments (Table 4).
3.1.7. Effect of Organic Amendments on CH4Emission
The CH4 emission rate was significantly affected by different types and rates of organic amendments (Figure 3). CH4 emission from the rice field in this study increased with advancing crop growth stages; however, the rate of increment varied greatly among treatments. In all the growth stages the lowest CH4 emission was recorded from the treatment T7 (25% RF + biosolid 6 t ha−1) and the highest from the treatment T4 (75% RF + Biosolid 2 t ha−1 + FYM 5 t ha−1). The treatment T3 (75% RF + biosolid 2 t ha−1) showed overall moderate CH4 emission during the whole growth period. The plots which received the combination of chemical fertilizer with FYM had always higher CH4 emission than the plots that received chemical fertilizer with biosolid. This result might be attributed to FYM or chemical fertilizer application which increased methane production and emission. Similar to our results, [31] found that biochar performed better in terms of the lowest CH4 emission compared to FYM. Ref. [2] reported that the application of biochar amendments solely and in conjunction with Azolla-cyanobacteria amendments to paddy soils effectively decreased N2O emissions. Ref. [14] reported the ameliorative effect of biochar for degraded soil especially for mitigating the emission of CH4 from paddy fields. Biochar application significantly reduced the fluxes of greenhouse gases compared to control plots reported by [32].

Figure 3.
Effect of different organic amendments on CH4 gas emission at different growth stages of BINA Dhan–7. T1: 100% recommended fertilizer (RF); T2: 100% of RF + FYM 5 t ha−1; T3: 75% of RF + Biosolid2 t ha−1; T4: 75% of RF + Biosolid2 t ha−1+ FYM 5 t ha−1; T5: 50% of RF + Biosolid 4 t ha−1; T6: 50% of RF + Biosolid 4 t ha−1+FYM 5 t ha−1; T7: 25% of RF + Biosolid 6 t ha−1; T8: 50% of RF + Biosolid 6 t ha−1 + FYM 5 t ha−1; T9: 0% of RF + Biosolid 8 t ha−1+FYM 5 t ha−1.
3.1.8. Correlation Coefficient
The grain yield of rice was positively correlated with soil Eh, number of panicle hill−1, straw yield, and harvest index, while CH4 emission, soil pH, soil OC, plant height, and number of filled grains hill−1 were negatively correlated with grain yield (Table S1). Among these, grain yield had a highly positive significant correlation with the number of hill plots−1 (0.644**) followed by straw yield and harvest index (0.533 ** and 0.457 *, respectively). In contrast, grain yield had a highly negative correlation with soil pH and CH4 emission (−0.363 and 0.312, respectively). Ref. [33] found that grain and straw yield were positively correlated with tillers hill−1, panicle length, filled grains panicle−1, and 1000-grain weight. Among whole correlation, the highest positive and significant correlation was obtained between the number of filled grains hill−1 and panicle length (0.718**) followed by soil pH and OC (0.715**) and number of hill plot−1 and grain yield (0.644**) (Table S1). The highest negative correlation was recorded between Eh and soil pH (−0.487**) followed by CH4 and the number of hill plots−1 (−0.440*) in this study. CH4 emission was negatively correlated with soil Eh, panicle number hill−1, number of filled grains hill−1, grain yield, straw yield, and harvest index while positively correlated with soil pH, soil OC, and plant height.
4. Conclusions
Our findings proved in line with the postulated hypothesis as different sources and doses of organic amendments applied solely or in conjunction with chemical fertilizers had varying effect on rice productivity and methane emission. The combination of 75% RF along with biosolid 2 t ha−1 performed better by increasing the soil fertility and rice productivity along with moderately reducing CH4 emission. Therefore, the present study suggested that the soil amendment with biosolid materials (2 t ha−1) could reduce the application of chemical fertilizer (25% less NPK fertilizer), leading to substantial decline in the cost of rice production, increase paddy yield and can contribute to reduce the CH4 emission from the rice fields. Further study may be needed to ensure the treatment performance in another agro-ecological zone of Bangladesh to observe adaptability and more organic amendments and application rates may be evaluated with different rice cultivars.
Supplementary Materials
The following are available online at https://www.mdpi.com/2071-1050/13/6/3103/s1, Table S1: Studies of correlation coefficients on soil properties, yield and yield contributing eleven characters in the relation of CH4 emission.
Author Contributions
Conceptualization, M.M.H. and J.D.; methodology, M.M.H., J.D., and S.A.; software, M.M.H.; validation, T.A., M.E., M.N.K., M.S.A., M.A.I., and M.M.H.; formal analysis, M.M.H. and T.A.; investigation, M.M.H. and J.D.; resources, M.E. and M.N.K., data curation M.M.H., writing—original draft preparation, M.M.H. and J.D; writing—review and editing, A.H., S.A., and A.E.S.; visualization, A.B., A.E.S., and S.A.; supervision, A.E.S. and S.F; project administration, A.B. and A.E.S., funding acquisition, A.B., A.H., and A.E.S. All authors have read and agreed to the published version of the manuscript.
Funding
The authors are thankful to the DOST organization, Pakistan, for their support and cooperation in completing this research. In addition, the authors are thankful to Taif University Researchers Supporting Project number (TURSP—2020/295), Taif University, Taif, Saudi Arabia.
Institutional Review Board Statement
Not applicable.
Informed Consent Statement
Informed consent was obtained from all subjects involved in the study.
Data Availability Statement
Data is not publicly available, though the data may be made availble on request from the corresponding author.
Acknowledgments
The authors are thankful to the DOST organization, Pakistan, for their support and cooperation in completing this research. In addition, the authors extend their appreciation to Taif University for funding current work by Taif University Researchers Supporting Project number (TURSP—2020/295), Taif University, Taif, Saudi Arabia.
Conflicts of Interest
The authors declare no conflict of interest.
References
- Ahmed, S.; Alam, M.J.; Hossain, A.; Islam, A.K.; Awan, T.H.; Soufan, W.; Qahtan, A.A.; Okla, M.K.; El Sabagh, A. Interactive effect of weeding regimes, rice cultivars, and seeding rates influence the rice-weed competition under dry direct-seeded condition. Sustainability 2021, 13, 317. [Google Scholar] [CrossRef]
- Ali, S.; Iqbal, M.A.; Sher, A.; Afzal, M.I. Growth, kernel quality and yield assessment of aerobic aromatic rice (Oryza sativa L.) under different mulching types and spatial arrangements. World J. Agric. Sci. 2015, 12, 84–90. [Google Scholar]
- Iqbal, M.A.; Shahbaz, A. Evaluation of yield and yield components of aerobic fine rice (Oryza sativa L.) as influenced by different mulches and planting patterns. Am. Eurasian J. Agric. Environ. Sci. 2015, 14, 1089–1094. [Google Scholar]
- BBS (Bangladesh Bureau of Statistics). Summary Crop Statistics and Crop Indices (2010–11); Bangladesh Bureau of Statistics Division, Govt. of the People’s Republic of Bangladesh: Dhaka, Bangladesh, 2012; pp. 35–37. [Google Scholar]
- Alam, M.R. Effect of Different Rates of Manure Application on Methane Emission and Crop Yield in Aman Rice. Master’s Thesis, Department of Environment Science, Bangladesh Agricultural University, Mymensingh, Bangladesh, 2012. [Google Scholar]
- Iqbal, M.A. Productivity and quality of direct seeded rice under different types of mulches and planting patterns: A review. Am. Eurasian J. Agric. Environ. Sci. 2015, 14, 1240–1247. [Google Scholar]
- Swift, R.S. Organic matter characterization. Methods Soil Anal. Part Chem. Methods 1996, 5, 1011–1069. [Google Scholar]
- Baldock, J.A.; Nelson, P.N. Soil Organic Matter; CRC Press: Boca Raton, FL, USA, 2000; pp. 25–84. [Google Scholar]
- Phy, C.; Dejbhimon, K.; Tulaphitak, D.; Lawongsa, P.; Keophila, M.; Thammasom, N.; Saenjan, P. Biochar amendment to different paddy soils on CH4 production, labile organic carbon, ph and electrical conductivity dynamics: Incubation experiment. Int. J. Environ. Rural Dev. 2014, 5, 1. [Google Scholar]
- IPCC. The Physical Science Basis. Contribution of Working Group Ito the Fourth Assessment Report of the Intergovernmental Panel on Climate Change; Working Paper No. 57; Cambridge University Press: Cambridge, UK, 2007. [Google Scholar]
- Denman, K.L.; Brasseur, A.; Chidthaisong, A.; Clais, P.E.; Holland, O.; Jacob Lohmann, U.; Ramachandram, S.; Silva, D.F.L. Coupling between changes in the climate system and biogcoehemistry. In The Physical Science Basis Conlribution of Working Group I to the Fourth Assessment Report of the Inter governmental Panel on Climate Change; Solomon, S., Qin, D., Manning, M., Chen, Z., Marquis, M., Averyt, K.B., Tignor, M., Miller, M.L., Eds.; Cambridge University Press: Cambridge, UK, 2007; pp. 499–587. [Google Scholar]
- Benger, K.; Tian, H.; Lu, C. Do nitrogen fertilizers stimulate or inhabit methane emissions from rice fields? Glob. Chang. Biol. 2012, 18, 3252–3267. [Google Scholar]
- Wang, W.; Jian, L.U.; Qing, Y.; Xiao, K.; Hui, L.I. Effects of N, P, K fertilizer application on grain yield, quality, nutrient uptake and utilization of Rice. Chin. J. Rice Sci. 2011, 5, 645–653. [Google Scholar]
- Zhang, A.; Bian, R.; Li, L.; Wang, X.; Zhao, Y.; Hussain, Q.; Pan, G. Enhanced rice production but greatly reduced carbon emission following Biosolid amendment in a metal–polluted rice paddy. Environ Sci. Poll Res. Inst. 2015, 22, 18977–18986. [Google Scholar] [CrossRef] [PubMed]
- Khosa, M.K.; Sidhu, B.S.; Benbi, D.K. Methane emission from rice fields in relation to management of irrigation water. J. Environ. Biol. 2011, 32, 169–172. [Google Scholar] [PubMed]
- Gaihre, Y.K.; Padre, T.A.; Wassmann, R.; Aquino, E.; Pangga, G.V.; Sta Cruz, P.C. Spatial and temporal variations in methane fluxes from irrigated lowland rice fields. J. Philipp. Agric. Sci. 2011, 94, 335–342. [Google Scholar]
- Black, A.A. (Ed.) Methods of Soil Analysis; Agronomy Service, No. 9; American Society of Agronomy. Incorporated: Madison, WI, USA, 1965. [Google Scholar]
- Jackson, M.L. Soil Chemical Analysis; Prentice Hall Inc.: Englewood Cliffe, NJ, USA, 1962. [Google Scholar]
- Walkey Black, C.A. An examination of Digtiareff method for determining soil organic matter and proposed modification for the chromic acid titration method. Soil Sci. 1934, 37, 29–38. [Google Scholar] [CrossRef]
- Page, A.L.; Miller, R.H.; Keeney, D.R. Methods of Soil Analysis, Part 2, 2nd ed.; American Society of Agronomy: Madison, WI, USA, 1982. [Google Scholar]
- Olsen, S.R.; Cole, C.U.; Watanable, F.S.; Deun, L.A. Estimation of available P in soil extraction with sodium bicarbonate. US Agril Cir. 1954, 929, 19. [Google Scholar]
- Russel, D.F. Mstat–C Package Programme; Crop and Soil Sci. Dept., Michigan State Univ.: Michigan, MI, USA, 1962. [Google Scholar]
- Gomez, K.A.; Gomez, A.A. Statistical Procedure for Agricultural Research, 2nd ed.; John Wiley and Sons: New York, NY, USA, 1984; p. 64. [Google Scholar]
- Nigussie, A.; Kissi, E.; Misganaw, M.; Ambaw, G. Effect of biosolid application on soil properties and nutrient uptake of lettuces (Lactuca sativa) grown in Chromium polluted soils. Am. Eurasian J. Agric. Environ. Sci. 2012, 12, 369–376. [Google Scholar]
- Kamara, A.; Kamara, H.S.; Kamara, M.S. Effect of rice straw biosolid on soil quality and the early growth and biomass yield of two rice varieties. Agric. Sci. 2015, 6, 798–806. [Google Scholar]
- Petter, F.A.; Madari, B.E.; Silva, M.A.S.D.; Carneiro, M.A.C.; Carvalho, M.T.D.M.; MarimonJúnior, B.H.; Pacheco, L.P. Soil fertility and upland rice yield after biochar application in the Cerrado. Pesqui. Agropecuária Bras. 2012, 47, 699–706. [Google Scholar] [CrossRef]
- Ajayi, A.; Holthusen, D.; Horn, R. Changes in microstructural behaviour and hydraulic functions of biochar amended soils. Soil Tillage Res. 2016, 155, 166–175. [Google Scholar] [CrossRef]
- Oo, A.N.; Banterng, P.; Polthanee, A.; Trelo-Ges, V. The Effect of Different Fertilizers Management Strategies on Growth and Yield of Upland Black Glutinous Rice and Soil Property. Asian J. Plant Sci. 2010, 9, 414–422. [Google Scholar] [CrossRef][Green Version]
- Hasan, M.S. Effects of Organic and Inorganic Amendments on Boro Rice (Binadhan–8) in Saline Soils. Master’s Thesis, Department of Soil Science, Bangladesh Agricultural University, Mymensingh, Bangladesh, 2014; p. v. [Google Scholar]
- Priyanka, G.; Sharma, G.D.; Rachana, R.; Lal, B. Effect of integrated nutrient management and spacing on growth parameters, nutrient content and productivity of rice under system of rice intensification. Int. J. Res. Biol. Sci. 2013, 2, 53–59. [Google Scholar]
- Alam, J.M. Effect of organic amendments on methane emission and rice productivity at Bangladesh Agricultural University farm. Master’s Thesis, Department of Environmental Science, Bangladesh Agricultural University, Mymensingh, Bangladesh, 2012. [Google Scholar]
- Castaldi, S.; Riondino, M.; Baronti, S.; Esposito, F.R.; Marzaioli, R.; Rutigliano, R.A.; Vaccari, F.P.; Miglietta, F. Impact of Biosolid Application to a Mediterranean Wheat Crop on Soil Microbial Activity and Greenhouse Gas Fluxes. Chemosphere 2011, 85, 1464–1471. [Google Scholar] [CrossRef] [PubMed]
- Jahan, I. Response of Boro and Transplant Aman Rice to Npk Fertilization in Madhupur Soil. Master’s Thesis, Department of Agricultural Chemistry, Bangladesh Agricultural University, Mymensingh, Bangladesh, 2014; p. v. [Google Scholar]


Publisher’s Note: MDPI stays neutral with regard to jurisdictional claims in published maps and institutional affiliations. |
© 2021 by the authors. Licensee MDPI, Basel, Switzerland. This article is an open access article distributed under the terms and conditions of the Creative Commons Attribution (CC BY) license (http://creativecommons.org/licenses/by/4.0/).