
Psychometric Investigation of the Cultural Intelligence Scale Using the Rasch Measurement Model in South Korea


Abstract
:1. Introduction
2. Literature Review
2.1. Definition and Dimensions of CQ
2.2. Measurement and Validity of CQ
3. Method
3.1. Procedure and Participants
3.2. Measurement
3.3. Translation Procedure
3.4. Statistical Analysis
4. Results
4.1. Content Validity
4.2. Substantive Validity
4.3. Structural Validity
4.4. Generalizability
5. Discussion and Conclusions
6. Limitations and Future Directions
Author Contributions
Funding
Institutional Review Board Statement
Informed Consent Statement
Data Availability Statement
Conflicts of Interest
References
- Molinsky, A.L.; Davenport, T.H.; Iyer, B.; Davidson, C. Three skills every 21st century manager needs. Harv. Bus. Rev. 2012, 90, 139–143. [Google Scholar]
- Ang, S.; Van Dyne, L.; Tan, M.L. Cultural intelligence. In The Cambridge Handbook of Intelligence; Sternberg, R.J., Kuffman, S.B., Eds.; Cambridge University Press: New York, NY, USA, 2011; pp. 582–602. [Google Scholar]
- Van Dyne, L.; Ang, S.; Ng, K.Y.; Rockstuhl, T.; Tan, M.L.; Koh, C. Sub-dimensions of the four factor model of cultural intelligence: Expanding the conceptualization and measurement of cultural intelligence. Soc. Personal. Psychol. Compass 2012, 6, 295–313. [Google Scholar] [CrossRef]
- Andreason, A.W. Expatriate adjustment to foreign assignments. Int. J. Commer. Manag. 2003, 13, 42–61. [Google Scholar] [CrossRef]
- Ang, S.; Van Dyne, L.; Rockstuhl, T. Cultural intelligence: Origins, evolution, and methodological diversity. In Advances in Culture and Psychology; Gelfand, M., Chiu, C.Y., Hong, Y.Y., Eds.; Oxford University Press: New York, NY, USA, 2015; Volume 5, pp. 273–324. [Google Scholar]
- Earley, P.C. Redefining interactions across cultures and organizations: Moving forward with cultural intelligence. Res. Organ. Behav. 2002, 24, 271–299. [Google Scholar] [CrossRef]
- Earley, P.C. Cultural intelligence. In Encyclopedia of Management Theory; Kessler, E.H., Ed.; SAGE Publications, Inc.: Thousand Oaks, CA, USA, 2013. [Google Scholar]
- Ang, S.; Dyne, L.V.; Koh, C.; Ng, K.Y.; Templer, K.J.; Tay, C.; Chandrasekar, N.A. Cultural intelligence: Its measurement and effects on cultural judgment and decision making, cultural adaptation and task performance. Manag. Organ. Rev. 2007, 3, 335–371. [Google Scholar] [CrossRef]
- Van Dyne, L.; Ang, S.; Koh, C. Development and validation of the CQS. In Handbook of Cultural Intelligence: Theory, Measurement, and Application; M.E. Sharpe: Armonk, NY, USA, 2008; pp. 16–38. [Google Scholar]
- Ward, C.; Fischer, R.; Zaid Lam, F.S.; Hall, L. The convergent, discriminant, and incremental validity of scores on a self-report measure of cultural intelligence. Educ. Psychol. Meas. 2009, 69, 85–105. [Google Scholar] [CrossRef]
- Matsumoto, D.; Hwang, H.C. Assessing cross-cultural competence: A review of available tests. J. Cross-Cult. Psychol. 2013, 44, 849–873. [Google Scholar] [CrossRef] [Green Version]
- Ang, S.; Inkpen, A.C. Cultural intelligence and offshore outsourcing success: A framework of firm-level intercultural capability. Decis. Sci. 2008, 39, 337–358. [Google Scholar] [CrossRef]
- Thomas, D.C.; Liao, Y.; Aycan, Z.; Cerdin, J.-L.; Pekerti, A.A.; Ravlin, E.C.; Stahl, G.K.; Lazarova, M.B.; Fock, H.; Arli, D.; et al. Cultural intelligence: A theory-based, short form measure. J. Int. Bus. Stud. 2015, 46, 1099–1118. [Google Scholar] [CrossRef]
- Bücker, J.; Furrer, O.; Lin, Y. Measuring cultural intelligence (CQ) A new test of the CQ scale. Int. J. Cross Cult. Manag. 2015, 15, 259–284. [Google Scholar] [CrossRef] [Green Version]
- Rockstuhl, T.; Ang, S.; Ng, K.Y.; Lievens, F.; Van Dyne, L. Putting judging situations into situational judgment tests: Evidence from intercultural multimedia SJTs. J. Appl. Psychol. 2015, 100, 464–485. [Google Scholar] [CrossRef] [PubMed] [Green Version]
- Bücker, J.; Furrer, O.; Weem, T.P. Robustness and cross-cultural equivalence of the Cultural Intelligence Scale (CQS). J. Glob. Mobil. 2016, 4, 300–325. [Google Scholar] [CrossRef]
- Gozzoli, C.; Gazzaroli, D. The cultural intelligence scale (CQS): A contribution to the Italian validation. Front. Psychol. 2018, 9, 1–8. [Google Scholar] [CrossRef] [PubMed]
- Barzykowski, K.; Majda, A.; Szkup, M.; Przyłęcki, P. The Polish version of the Cultural Intelligence Scale: Assessment of its reliability and validity among healthcare professionals and medical faculty students. PLoS ONE 2019, 14, e0225240. [Google Scholar] [CrossRef]
- Ang, S.; Van Dyne, L.; Koh, C. Personality correlates of the four-factor model of cultural intelligence. Group Organ. Manag. 2006, 31, 100–123. [Google Scholar] [CrossRef]
- Earley, P.C.; Ang, S. Cultural Intelligence: Individual Interactions across Cultures; Stanford University Press: Stanford, CA, USA, 2003. [Google Scholar]
- Thomas, D.C.; Elron, E.; Stahl, G.; Ekelund, B.Z.; Ravlin, E.C.; Cerdin, J.L.; Poelmans, S.; Brislin, R.; Pekerti, A.; Lazarova, M.B. Cultural intelligence: Domain and assessment. Int. J. Cross Cult. Manag. 2008, 8, 123–143. [Google Scholar] [CrossRef]
- Brislin, R.; Worthley, R.; Macnab, B. Cultural intelligence: Understanding behaviors that serve people’s goals. Group Organ. Manag. 2006, 31, 40–55. [Google Scholar] [CrossRef]
- Ang, S.; Van Dyne, L. Conceptualization of cultural intelligence: Definition, distinctiveness, and nomological network. In The Cambridge Handbook of Acculturation Psychology; Sam, D.L., Berry, J.W., Eds.; Cambridge University Press: Cambridge, UK, 2008; pp. 3–15. [Google Scholar]
- Earley, P.C.; Peterson, R.S. The elusive cultural chameleon: Cultural intelligence as a new approach to intercultural training for the global manager. Acad. Manag. Learn. Educ. 2004, 3, 100–115. [Google Scholar] [CrossRef] [Green Version]
- Alon, I.; Boulanger, M.; Elston, J.A.; Galanaki, E.; de Ibarreta, C.M.; Meyers, J.; Muñiz-Ferrer, M.; Vélez-Calle, A. Business cultural intelligence quotient: A five-country study. Thunderbird Int. Bus. Rev. 2016, 60, 237–250. [Google Scholar] [CrossRef]
- Zhou, C.; Hu, N.; Wu, J.; Gu, J. A new scale to measure cross-organizational cultural intelligence. Chin. Manag. Stud. 2018, 12, 658–679. [Google Scholar] [CrossRef]
- Yates, S.M. Rasch and attitude scales: Explanatory style. In Applied Rasch Measurement: A Book of Exemplars; Alagumalai, S., Curtis, D.D., Hungi, N., Eds.; Springer: Dordrecht, The Netherlands, 2005; pp. 207–225. [Google Scholar]
- Wolfe, E.W.; Smith, E.V. Instrument development tools and activities for measure validation using Rasch models: Part II—Validation activities. J. Appl. Meas. 2007, 8, 204–234. [Google Scholar] [PubMed]
- Bond, T.G.; Fox, C.M. Applying the Rasch Model: Fundamental Measurement in the Human Sciences, 3rd ed.; L. Erlbaum: Mahwah, NJ, USA, 2015. [Google Scholar]
- Andrich, D. A rating formulation for ordered response categories. Psychometrika 1978, 43, 561–573. [Google Scholar] [CrossRef]
- Wright, B.D.; Linacre, J.M. Reasonable mean-square fit values. Rasch Meas. Trans. 1994, 8, 370–371. [Google Scholar]
- Zieky, M. Practical questions in the use of DIF statistics in test development. In Differential Item Functioning; Holland, P.W., Wainer, H., Eds.; Lawrence Erlbaum: Hillsdale, NJ, USA, 1993; pp. 337–347. [Google Scholar]
- Messick, S. Standards of validity and the validity of standards in performance asessment. Educ. Meas. Issues Pract. 1995, 14, 5–8. [Google Scholar] [CrossRef]


| Item | Mean | Standard Deviation | Skewness | Kurtosis |
|---|---|---|---|---|
| Meta cognitive CQ 1 | 4.383 | 1.123 | −0.146 | 0.377 |
| Meta cognitive CQ 2 | 4.991 | 1.164 | −0.550 | 0.495 |
| Meta cognitive CQ 3 | 4.423 | 1.084 | −0.306 | 0.287 |
| Meta cognitive CQ 4 | 4.754 | 1.194 | −0.274 | −0.106 |
| Cognitive CQ1 | 3.707 | 1.227 | −0.132 | −0.210 |
| Cognitive CQ2 | 3.991 | 1.223 | −0.132 | −0.199 |
| Cognitive CQ3 | 4.063 | 1.261 | −0.206 | −0.313 |
| Cognitive CQ4 | 3.683 | 1.323 | −0.050 | −0.281 |
| Cognitive CQ5 | 3.800 | 1.338 | −0.020 | −0.499 |
| Cognitive CQ6 | 3.866 | 1.220 | 0.013 | −0.094 |
| Motivational CQ1 | 4.495 | 1.444 | −0.112 | −0.519 |
| Motivational CQ2 | 4.485 | 1.427 | −0.198 | −0.385 |
| Motivational CQ3 | 4.696 | 1.257 | −0.343 | 0.147 |
| Motivational CQ4 | 4.438 | 1.365 | −0.226 | −0.332 |
| Motivational CQ5 | 4.879 | 1.364 | −0.466 | −0.135 |
| Behavioral CQ1 | 4.539 | 1.326 | −0.346 | −0.218 |
| Behavioral CQ2 | 4.769 | 1.096 | −0.203 | 0.009 |
| Behavioral CQ3 | 4.897 | 1.034 | −0.400 | 0.650 |
| Behavioral CQ4 | 4.829 | 1.124 | −0.637 | 0.878 |
| Behavioral CQ5 | 4.785 | 1.154 | −0.446 | 0.241 |
| Item | Measure | Infit Mean Square | Outfit Mean Square | Point-Biserial Correlation |
|---|---|---|---|---|
| Meta cognitive CQ 1 | 0.06 | 0.83 | 0.84 | 0.62 |
| Meta cognitive CQ 2 | −0.64 | 1.01 | 0.98 | 0.61 |
| Meta cognitive CQ 3 | 0.01 | 0.68 | 0.67 | 0.67 |
| Meta cognitive CQ 4 | −0.36 | 0.96 | 0.96 | 0.63 |
| Cognitive CQ1 | 0.77 | 0.98 | 1.00 | 0.60 |
| Cognitive CQ2 | 0.48 | 0.84 | 0.88 | 0.66 |
| Cognitive CQ3 | 0.40 | 0.82 | 0.84 | 0.69 |
| Cognitive CQ4 | 0.79 | 1.07 | 1.11 | 0.62 |
| Cognitive CQ5 | 0.67 | 1.09 | 1.10 | 0.63 |
| Cognitive CQ6 | 0.60 | 0.78 | 0.77 | 0.69 |
| Motivational CQ1 | −0.06 | 1.01 | 1.02 | 0.76 |
| Motivational CQ2 | −0.05 | 1.11 | 1.10 | 0.71 |
| Motivational CQ3 | −0.29 | 0.99 | 0.96 | 0.67 |
| Motivational CQ4 | 0.00 | 0.99 | 0.99 | 0.71 |
| Motivational CQ5 | −0.51 | 1.31 | 1.29 | 0.63 |
| Behavioral CQ1 | −0.11 | 1.00 | 1.00 | 0.69 |
| Behavioral CQ2 | −0.38 | 1.23 | 1.24 | 0.44 |
| Behavioral CQ3 | −0.53 | 0.89 | 0.87 | 0.57 |
| Behavioral CQ4 | −0.45 | 1.18 | 1.16 | 0.49 |
| Behavioral CQ5 | −0.40 | 1.22 | 1.22 | 0.50 |
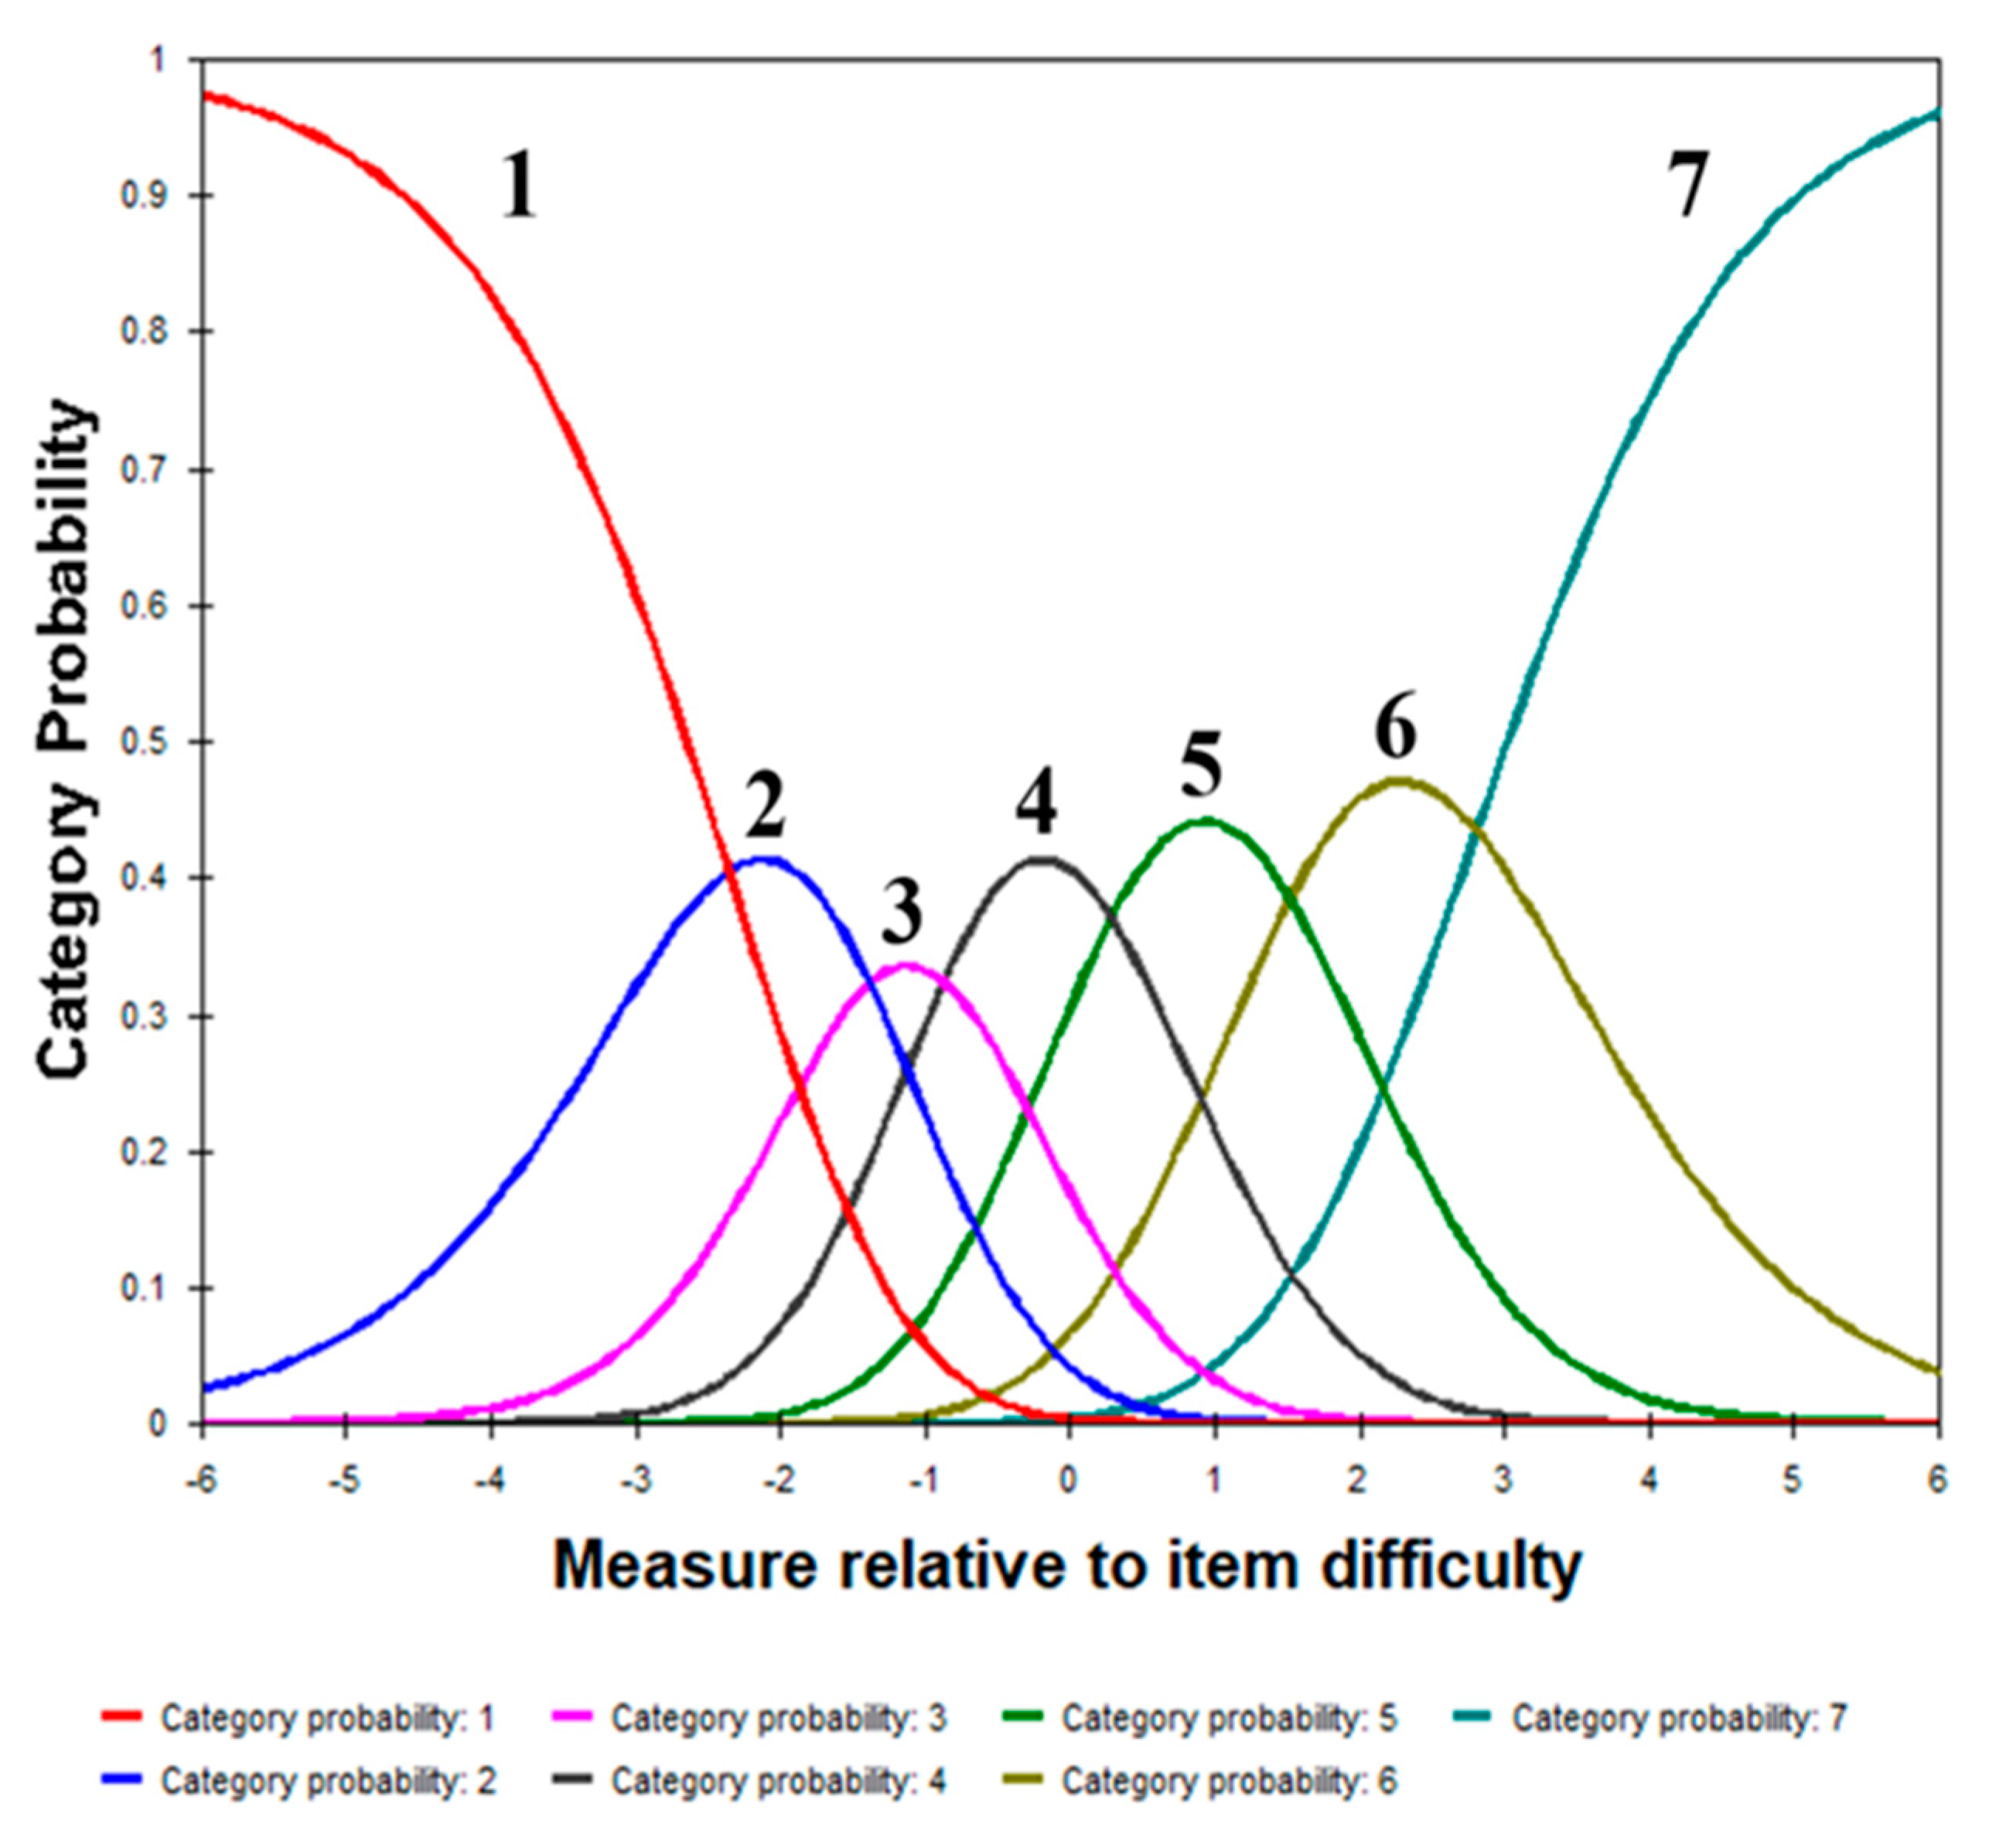
| Category Score | Measure | % | Andrich Threshold | Infit MNSQ | Outfit MNSQ | Step Calibration |
|---|---|---|---|---|---|---|
| 1 | 174 | 2 | −1.14 | 1.18 | 1.22 | - |
| 2 | 630 | 6 | −0.88 | 1.01 | 1.05 | −2.36 |
| 3 | 1347 | 14 | −0.42 | 0.96 | 0.98 | −1.38 |
| 4 | 2739 | 28 | 0.07 | 0.91 | 0.92 | −0.87 |
| 5 | 2865 | 29 | 0.61 | 0.93 | 0.93 | 0.29 |
| 6 | 1515 | 16 | 1.17 | 1.03 | 1.01 | 1.52 |
| 7 | 450 | 5 | 1.99 | 1.07 | 1.03 | 2.81 |
Publisher’s Note: MDPI stays neutral with regard to jurisdictional claims in published maps and institutional affiliations. |
© 2021 by the authors. Licensee MDPI, Basel, Switzerland. This article is an open access article distributed under the terms and conditions of the Creative Commons Attribution (CC BY) license (http://creativecommons.org/licenses/by/4.0/).
Share and Cite
Lee, S.Y.; Hong, A.J. Psychometric Investigation of the Cultural Intelligence Scale Using the Rasch Measurement Model in South Korea. Sustainability 2021, 13, 3139. https://doi.org/10.3390/su13063139
Lee SY, Hong AJ. Psychometric Investigation of the Cultural Intelligence Scale Using the Rasch Measurement Model in South Korea. Sustainability. 2021; 13(6):3139. https://doi.org/10.3390/su13063139
Chicago/Turabian StyleLee, Seung Yeon, and Ah Jeong Hong. 2021. "Psychometric Investigation of the Cultural Intelligence Scale Using the Rasch Measurement Model in South Korea" Sustainability 13, no. 6: 3139. https://doi.org/10.3390/su13063139
APA StyleLee, S. Y., & Hong, A. J. (2021). Psychometric Investigation of the Cultural Intelligence Scale Using the Rasch Measurement Model in South Korea. Sustainability, 13(6), 3139. https://doi.org/10.3390/su13063139