Abstract
The smart city concept has been gaining momentum in the scientific community because of its potentially huge impact on citizens’ quality of life. However, expectations have not yet been met in practice. This is firstly due to the sheer breadth of such projects and secondly to the lack of methodologies available to guide the development of flexible and sustainable platforms over time. In this work, we propose to address these issues by using a university campus as a less complex mock-up version of a city. Despite differences between them, we find services that are common to both, and a medium-sized city’s population is comparable to that of a university community. We propose an IT conceptual framework to model and implement smart university projects, which supports the design of a platform that is both in line with the strategic plans of universities and is flexible, sustainable, stable, and sufficiently modular to support the addition of different value-added services over the years. Our framework is based on a service provision model materialised in an IT architecture and managed following a methodology to integrate IT components that ensure the insertion of new, smart initiatives of value to the community, aligned with the university’s needs, via a value-added service planning process. The results are presented in the University of Alicante case study and the SmartUA project.
1. Introduction
The main aim of smart city projects is to improve citizens’ quality of life. In order to achieve this, they address multiple domains covering economic, operational, social, environmental, health, administrative and governmental aspects [1,2,3,4], following, at all times, the principles of efficient and sustainable service for citizens. Nevertheless, the sheer breadth of smart city projects means that the development process is highly complex. Countless imponderables arise, frequently leaving existing initiatives by the wayside or, at best, leading to humbler redefinitions of these initiatives; so much so, in fact, that very often, all that is left of the smart city is its name, or the intention behind its conception [5,6].
Clearly, universities should seek to achieve the same quality of life for their community as that expected of a smart city [7,8,9]: a medium-sized university with a single campus is a sufficiently complex environment to be highly representative of a medium-sized city. In 2019–2020, Spanish public universities accounted for over 1 million students, i.e., an average of 22,000 students per university [10]. However, they carry a considerable advantage: the impact of the obstacles to smart city proposals, i.e., legislation, urban projects, planning, etc., is much reduced.
Based on the above factors, we conceived the smart university as a university model that improves quality of life by making intensive, global, efficient and sustainable use of IT to deliver services for the benefit of the entire university community [11].
A number of previous publications describe the university as a small-scale city with the potential to be used as a model for scientific purposes [12,13,14]. We can affirm that a university campus represents an appropriate mock-up for a smart city initiative: it is representative and, in addition to serving as an example, guide and case study with which to develop viable projects in our cities, the partial results would be useful in themselves to effectively and efficiently improve the quality of life of a large number of citizens.
The design and implementation of a smart university could have a positive impact on any university campus [15,16,17]. However, this is a significant challenge, and as a result, such projects can fall through [18,19]. Coordination of a smart university project thus requires that the whole is divided into smaller, more manageable projects, perhaps over several financial years, led by different teams and involving the application of a variety of technologies.
Even successful projects usually result in a scattering of services that are hardly capable of interacting with each other or of generating new value-added services; ultimately, a multitude of technologies and services are replicated and maintained [20].
The question considered in this study is how to decompose a smart university project into different parts—due to its scale—while ensuring that each step, each investment made and each adopted decision is aligned at all times with the interests and objectives of the project in its entirety.
Our proposal is an IT conceptual framework to support, model and implement IT platforms for smart university projects. The framework is composed of a methodology, a conceptual architectural framework and a series of processes and resources. The methodology consists of analysing existing IT, decoupling the technologies and then recoupling them under a service-oriented architecture (SOA) model based on an IT architecture. This latter IT architecture meets the needs of the service provision model proposed in the framework. Moreover, the framework specifies a planning process for value-added services that supports the processes of decision-making and prioritisation of the university’s most strategic services.
The present article is structured following the methodology applied in our research to achieve the proposed solution and its validation. First, we analyse existing proposals and the state of technology in the field (Section 2); next, we present our solution, formalising the IT framework based on each of its components (Section 3, Section 4, Section 5, Section 6 and Section 7); a case study (Section 8) is then set out, in which we describe how the proposed IT framework has been applied to implement the smart university platform at the University of Alicante (SmartUA), supporting the process of IT incorporation for over six years; to finish (Section 9), we present the main conclusions and future proposals.
2. Background and Motivation
The smart city concept emerged in the 1990s. In short, it represents an overlap between the fields of technology and modern urban design [21]. The concept has matured over the years and now represents a dynamic line of research that has been generating an increasing number of publications, as reflected in [5].
A literature review reveals the scientific community’s major interest in developing efficient and sustainable models for cities. Some studies provide an overview of smart city projects and describe different case studies [5,22]. However, most research focuses on specific smart city domains, such as security and data protection [23,24,25], networking [26], detection of anomalies [27,28], transport [29,30,31], energy consumption [32,33,34], business [35] or government [36,37,38]. Thus, they centre on delimited problems that make projects more manageable. Despite this, only a small share of these projects are ultimately put into practice in real smart cities as originally intended [5].
Explanations abound for this lack of materialisation and, above all, lack of sustainability once the smart city projects are executed. One cause is the excessively complex nature of urban planning [39,40,41], making it particularly challenging to achieve the label of smart city. Numerous imponderables need to be overcome, including the huge financial investment required in many different domains (urban, technological, training, informative, etc.) [42,43]; the complicated, costly and cumbersome nature of conducting urban planning projects in consolidated cities [44,45]; the numerous changing or immature technologies on which these proposals are still based; the large number of actors involved throughout the value chain [46]; and the huge task of finding skilled labour.
A university campus of a medium-sized university is comparable to a smart city with an average or even large community in almost every domain of potential interest. In Spain, an urban concentration of more than 10,000 inhabitants is considered a city: currently, Spain has 753 cities, a population of 37.74 million inhabitants and an average of 50,000 inhabitants per city [47]. It must be noted that a medium-sized university can have an average community of fifty thousand members [48], who make intensive use of the different areas, services and technologies. To operate normally, universities require different domains in order to function in a robust and concentrated way: these are the government, organisation, mobility, university life, health, environmental sustainability, etc. A campus indeed occupies a much smaller surface area than a city, but it still represents a large urban area and shares many problems and complexities common to any city: parking lots, access, traffic, urban planning, buildings, green areas, services, catering, leisure, etc. Therefore, despite the obvious differences, it is clear that a university campus can be used as a simplified mock-up version of a city.
In line with this, there are numerous studies relating to the notion of a smart campus [49], focusing on different specific sectors, such as the management of the growing number of devices [50]; IoT architectures [51,52,53]; energy management and air quality [54,55]; flexible architectures [56,57,58,59]; sensor networks [60]; big data [53]; semantic interoperability [61]; or knowledge management [62]. Research has also been conducted on global smart university solutions, though these are implemented for specific campuses, as in [63,64]. The latter study describes a solution applied at the University of Malaga centring on sustainability. Finally, more general studies have been presented, such as [65], which examines the smart campus concept from an administrative perspective [11]; which describes the concept of a smart university; or [66], which advances the conceptualisation of a number of key smart campus components.
Another reason for the difficulty in realising smart cities is the lack of models and methodologies that allow the undertaking of projects of this scale in a systematic and structured manner, while maintaining a global vision of all subcomponents [38]. Some research, however, has been conducted in this regard, such as [67], which offers an integrative framework and shows the relationship between smart city initiatives and success factors, providing the government with a more comprehensive vision in order to launch initiatives. Other illustrations are given in [68,69], which advance predictive models aimed at planning and managing such projects. Moreover, a series of standards have been developed; they range from generic standards, focused on definitions [70,71], to more specific and technical norms [72].
In terms of more technical research, a number of works introduce specific smart city architectures [73,74,75,76]. Open-source development platforms such as Fiware [77] even exist, together with several studies that have used these platforms for their own development or validation [78,79,80].
In previous work, we identified two major problems underlying the implementation of smart city platforms. The first was the sheer complexity of urban change. We addressed this first cause by reducing the complexity and proposing a solution that was limited to a university campus. Our rationale was that, despite the clear differences between a city and a university, the results obtained using a smart university platform can, to a certain extent, be relevant to a city, provided that the platform serves an extensive community, such as that of a university campus. This assumption is supported by previous studies according to which a university campus can be used as a less complex model of a city [12,13,14,63,64,65,66,67,68,69,70,71,72,73,74,75,76,77,78,79]. Moreover, we sought previous works directly related to our hypothesis according to which the existence of a global framework, that includes a methodology for adding new services to a smart university platform and guarantees both ease of integration and strategic alignment, would make it easier to realise these types of projects. In this field, we found models focusing mainly on evaluating the relevance of end-services and their alignment [39,40,41], and other more technical proposals concentrating on valid architectures for smart city platforms [45,46,47,48,70,71,72,73]. This led to the identification of the second problem: although many potential pieces of the smart university puzzle already exist, they are dissociated. No framework has been found that allows the management of the core elements of a smart university project, nor have instruments been advanced that would enable the integration of smart university projects, from their design and governance to their management, technical implementation and deployment decisions. Thus, no framework enables the planning, modelling and implementation of the basic components that would make smart projects sustainable over time.
To specify the position of our proposal within existing lines of research and to summarise the state of the art, we created a graph (Figure 1). It shows three broad research areas related to our study, within the concepts of the smart city and smart university: works advancing specific solutions for a given environment (specific solutions); research on architectural proposals for these types of platforms (architecture); and, naturally, models and frameworks for the development and alignment of the results achieved for smart city/university solutions (models and frameworks). Our proposal represents a subdivision within the smart campus/university concept that mainly covers models and frameworks; it also includes architectural elements and shares aspects with the subdivision that contains specific solution works.
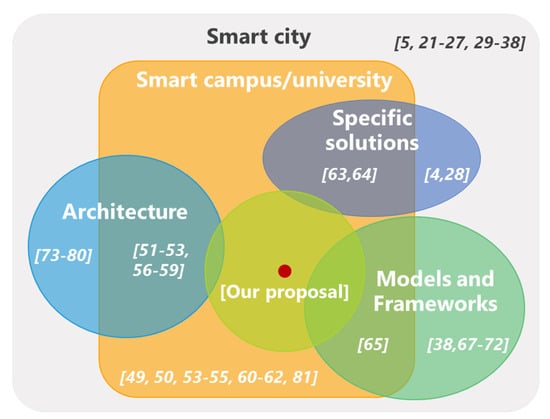
Figure 1.
State of the art analysis.
All the above factors motivated the present study, in which we present an IT conceptual framework for modelling and implementing smart university projects. The objective is not only to support the alignment of the platform’s results with university strategies, but also to offer a methodology for incorporating technologies supported by a multilayer architecture that allows the integration of new services in an agile, flexible and viable way. The IT conceptual framework proposed in this work is being implemented at the University of Alicante, which has been engaged for over six years in a smart university project called SmartUA [81]. SmartUA has been entirely developed based on the IT framework proposed in this study, and, currently, its entire maintenance and continuous improvement process follow the IT conceptual framework described below.
3. Proposed IT Conceptual Framework
A smart university project presents numerous advantages, from improving the entire university community’s quality of life, to making top-level contributions such as driving the university’s desired good governance. Nevertheless, the development of projects as intrinsically complex as smart universities is a colossal task. Without guidance, these projects generally fail if expectations are not addressed. For this reason, we focused on an IT conceptual framework that would help such projects to become successful. The framework’s objective is to set out basic principles, accompanied by a series of good practices, methodologies and models, to guarantee that the project has a solid foundation, aligned with the university’s strategy, thus raising its chances of success.
Specifically, the proposed smart university conceptual IT framework (Figure 2) consists of a service provision model, an IT architecture, an integration methodology to incorporate new IT components into a smart university project and a value-added service planning process to implement within each university. All these elements are the result of over ten years of research grounded in the specific experience of launching a smart university platform at our university, which includes a community of almost forty thousand people.
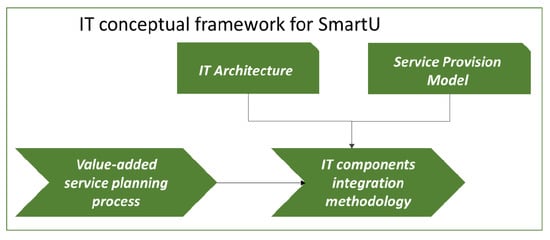
Figure 2.
IT conceptual framework for a smart university.
The proposed IT architecture is adjusted to the service provision model, which regulates how the platform offers its services to achieve scalable and sustainable solutions. These two elements represent resources used in the IT component integration methodology to provide a mechanism for incorporating technological components. It does so in such a way as to maintain the precise philosophy defined in the service provision model, favouring the reuse of components and minimising redundancy. To plan the value-added services to be developed, the framework includes a non-prescriptive process explaining which major guidelines should be followed to strategically prioritise the projects of greatest interest to the university. This process generates a roadmap that includes a prioritised list of the required services that must be implemented in accordance with the IT component integration methodology. The following sections provide a detailed description of each element included in the framework.
4. Service Provision Model
Most basic infrastructure and service providers (such as energy, water) offer solutions referred to as “smart” that are perfectly suited to the specific initiatives included within a smart university project. Each initiative involves monitoring the provider networks in order to obtain information on the state of the infrastructure or information storage or, even in the most intricate cases, on how this information is processed. The end result is a university service based on a series of indicators and warnings that support the decision-making process.
Nevertheless, the services or technological solutions are usually closed or poorly standardised, and if the institution wishes to take advantage of all the sensor networks, or of the entirety of the huge volume of information obtained—to integrate them with other data sources and to create new value-added services—it is likely that it will be simply unable to take advantage of them and must consider installing new sensor networks or replicating databases, services and infrastructures.
This is because each partial solution is initially designed following a horizontal end-to-end service provision model (Figure 3). The design requirements do not include integration into the organisation’s existing systems, thus preventing the true integration and use of its technologies, processes and services under a global project.
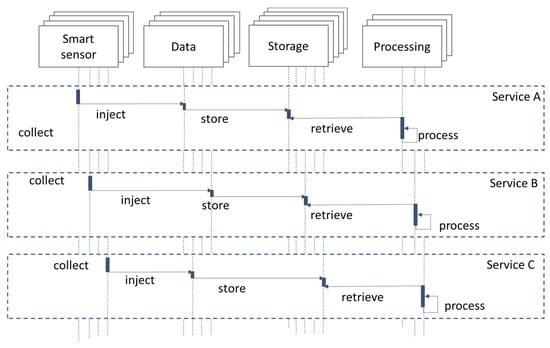
Figure 3.
Horizontal service provision.
Our hypothesis is that without the global vision offered by a methodology and a model, each action, within such a large-scale project, ultimately remains independent, making it very difficult to take advantage of the services, information and, to an even lesser extent, the existing infrastructure. Therefore, the resources used are often replicated. Thanks to a global proposal, each new addition of a value-added service within a smart university project could, where possible, leverage the existing sensor networks or provide new ones that could be reused in the future.
Our model seeks to address a series of stages that are usually common to all actions separately: collect information, store it, process it and offer a service. In the specific case of data collection, because the sensors are independent, they act together and are distributed across the compound, forming what we call a campus’s digital skin. This digital skin will be available for all services. However, it is not only the digital skin that can be reused. The model aims to make it possible to take advantage of all the existing elements. Thus, in addition to sensor networks, it should be possible to reuse databases, data processing algorithms, services, communications infrastructures, interfaces, applications, etc.
The proposed service delivery model is based on this digital skin and acts as a data acquisition component. These data in turn will be offered as a service to be stored and later converted, via data processing, into information. By thus providing this information service, it becomes possible to achieve a comprehensive, digital service model that favours transparency, reuse and entrepreneurship.
This value-added service provision model identifies a range of elements that must maintain their own identity. These elements include smart sensor networks or other data sources that are responsible for collecting the injected data for their storage and subsequent retrieval and processing to provide the service. Figure 4 shows an example of the distribution of services based on the proposed service provision model. One can observe a vertical delimitation as opposed to the horizontal solutions shown in Figure 3. In this proposal, different services can reuse the same processing, storage, data or even sensor elements, if required. The model’s only constraint is that each element in each layer must be offered as a service to its adjacent layers and, whenever possible, elements that do not occupy adjacent layers should not be directly connected.
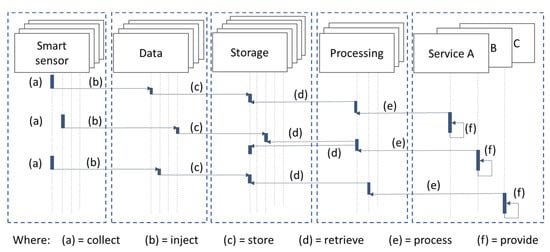
Figure 4.
Example of the use of components in the vertical distribution proposed in the service provision model.
In this way, we obtain a model that systematically integrates all present and future initiatives to ultimately provide the service through the following actions: collect, inject, store, retrieve and process data. Once isolated and converted into services, each of the system’s components may be reused by any other element or service that exists or has been incorporated into the platform.
The service provision model provides a conceptual explanation of the relationships between the components, making it clear that the data cannot be directly accessed but rather processed and offered as services before they are consumed. This guarantees, among other things, that the consumed data conform to all the security and anonymisation regulations applied to the platform since they can only be consumed from the layer that offers them as a service. There is a range of models and patterns that could be suitable when implementing this service provision model. At this point, it is the conceptual aspect that is important, regardless of whether this provision model can be implemented through microservice models, orchestrated through SOA or use patterns such as Facade or Gateway.
It is precisely this service provision model that conditions the choice of architectural style and proposed IT architecture (Section 5), aimed at supporting the elements identified for the provision of value-added services.
5. IT Architecture
The architectural style defines the layers and general tiers in which the components will be structured based on the proposed value-added service provision model. The style that we found was best adapted to the design of a technological platform for providing smart university services was an n-layer architecture [73,77]. Within this architecture, the layers that support the entire model were identified as application, service and communication.
The application tier was divided into layers and sublayers. The monitoring layer includes a monitoring sublayer and an acquisition sublayer. The business layer then contemplates sublayers for the inject, storage, retrieval, processing and service actions. Finally, the presentation layer contains the components required for delivering the services and information to end-users.
Each layer is dissociated from the rest in such a way that one layer only communicates and interacts with adjacent layers and always through a service-oriented architecture (SOA) schema. The sublayers identified for each layer collect the main categories of elements that should be decoupled to support a smart university. These elements, however, can be adjusted for each specific implementation. We would thus recommend dividing these into the sublayers proposed in the architecture, although this is not imperative.
The services layer contains the service provision platform’s global and general components, such as registration, login, authentication, connectors and scripting. Finally, the communication layer supports the service transactions generated by the other layers, through equipment interconnection systems and internetworking. The internal structure of each tier and each layer is organised by a microservices architecture pattern.
Figure 5 illustrates the proposed IT architecture with layer and tier views. These layers provide the necessary technology for smart universities to function as a whole, as well as a range of services provided to the community that will improve their quality of life.
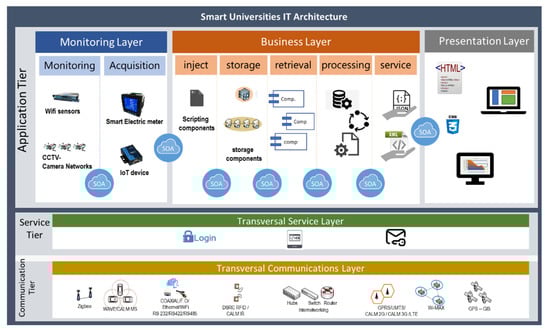
Figure 5.
General framework of the IT architecture.
The smart university’s monitoring layer oversees the capture, in a descriptive manner, of the elementary information of the object of observation using devices that record physical events, logs or devices that generate impulses. The latter will be processed so that they can be managed as data in the business layer, to generate smart services of value and improve the quality of life of the university community.
This layer covers both monitoring and data acquisition devices since these components are responsible for collecting a smart university’s input data, which ranges from sensors, cameras, RFID cards and mobile devices to actuators, third-party applications, external data sources, logs, control devices or smart meters. Therefore, identification of the type of information that is to be collected in each smart university domain will determine the technology to be applied.
All devices used in the monitoring layer must be able to work together and over the Internet, thus making the services created for a smart university highly autonomous. Under this approach, it is important to develop decoupled components that interact with these devices, to avoid any reliance on the manufacturers’ closed protocols. Therefore, the observation data are stored in a raw state (i.e., not processed in any way), so that a different, upper-level system (in which information from multiple sources is stored) applies the validation and transformation rules of the data related to the observed phenomenon.
In short, this monitoring layer is responsible for acquiring data that are as raw as possible. Therefore, it includes all the devices and applications that are used for the data sensing, regardless of their nature. These data are stored and processed in the business layer in order to transform them into community services.
The processing and storage of all the information generated in a smart university is key for all services to function properly. With the support of the communication and service layers, it is possible to interconnect and transport all the information between all the devices in the business layer, which thus constitutes the smart university’s brain.
This business layer is responsible for collecting, normalising, processing, storing and analysing isolated and big data to transform them into useful information. All this is performed within a microservices architecture model that favours services that provide interoperability, integration, scalability and compatibility between tiers and layers through architectural patterns such as SOA—which support decoupling. Thanks to all this information, as well as the storage and analysis systems used, we can generate information and offer it, in line with the SOA paradigm, to interested customers or devices. In this way, it is possible to build a unified university model that can be used by services, applications and end-users for the benefit of the university community.
First, this layer collects all the components related to the injection, from scripts to more sophisticated services which communicate directly with the storage sublayer’s components and services to make the information collected in the monitoring layer consistent. The services offered in the services sublayer obtain the processed information from the processing sublayer, and this sublayer, in turn, must use the data access components within the retrieval sublayer to obtain the information to be processed.
As explained in previous sections, it is not strictly necessary (although it is advisable) to identify each and every layer proposed in the architecture, but it is imperative, taking into account the identified sublayers, to respect the verticality of the proposal so that each layer and sublayer communicate only with adjacent ones.
The presentation layer is responsible for giving visibility to the information generated by the business layer in a formatted manner, in the form of either services or applications, for the benefit of the whole community, including users, companies and administrations. The purpose of this layer is to ensure that the information leads to improved services, management, efficiency, security, social cohesion and better quality of life for citizens.
This layer covers all the elements related to the presentation of the data to the members of the university community. In essence, it includes all the components used to display the data in the user interface clearly, concisely and intelligibly. The same data can be presented in various ways so that users who consult them, depending on their profile, can make the most of this information. The elements responsible for presenting the information to users are located in this layer and must access the data only through the services sublayer in the business layer, maintaining the architecture’s required verticality.
The service layer is transversal to all the components and services of the application tier and includes the common elements used by the different services throughout all the upper-tier sublayers. The elements of this layer must be defined for each specific implementation, taking into account that these services are transversal, such as authentication services, login, data protection and security.
The communications layer, within the tier that bears the same name, is horizontal with respect to the other layers as it encompasses the basic interaction technology of the different elements, providing the basis for internetworking in the monitoring, business and presentation layers and to the service layer. Its task is to make the other components in the architecture of the physical mechanisms—used by each technology—independent, so that they can communicate and interact. Regardless of whether low-power and low-consumption LPWAN (low-power wide-area network) networks (such as LoRa, RFID) or particular networks (such as vehicles, security cameras) can be used with lightweight protocols (such as Message Queuing Telemetry Transport - MQTT), the entirety of the infrastructure must be encapsulated and presented to the upper layers in a uniform manner through Internet networks, even over high-level protocols such as HTTP (Hypertext Transfer Protocol) and SOAP (Simple Object Access Protocol).
This proposed IT architecture describes how components are distributed in tiers and layers based on the service provision model (Section 4) and entirely aligned with the methodology (Section 6) that is proposed within the IT conceptual framework to integrate IT components into the smart university project.
6. IT Component Integration Methodology
The development of a smart university project encompasses many highly complex tasks. One of these large-scale tasks, which also repeats itself over the years within the smart university’s maintenance and continuous improvement process, is the incorporation of IT components into the platform. We include within the concept of IT components any element related to technology that will be added to the platform, ranging from sensors, internetworking devices or databases to applications, services or processes.
This incorporation of technology plays an essential role at the beginning of the project, at which point no components have yet been developed and any step that is taken to lay the foundations of the project inexorably involves the incorporation of IT components. Once a platform is built as the core of a smart university project, it also has a crucial role when new value-added services that involve IT are created for the university community. If it has not been considered in the design phases, this integration of IT components will be greatly conditioned by inherited decisions and technologies. On the whole, delays will occur, and it will be necessary to replicate sensor networks, duplicate data storage or process the same information several times. It will be difficult to take advantage of technologies and reuse services and applications.
This section presents an integration methodology that facilitates the incorporation of IT components into a smart university project. The methodology is directed towards identifying which technology is the most suitable, as well as determining how it can be incorporated into the project in a way that is adapted to the service delivery model and the proposed IT architecture. The method is applicable each time IT components are incorporated, both at the beginning of the project and in subsequent extensions or during the maintenance and update phases. The methodology, described based on processes using the Eriksson–Penker model, is shown in Figure 6.
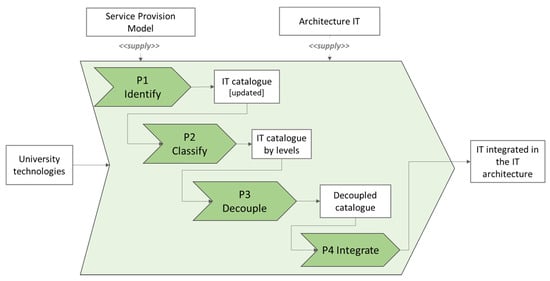
Figure 6.
Methodology for incorporating IT components into a smart university project.
The methodology also provides guidance on how to correctly implement both the IT architecture that has been proposed and the service provision model. The latter forms the basis of a flexible and scalable platform, thus presenting the key features of a platform that is sustainable over time.
The most common scenario in any existing large organisation, city or campus is that of a diversified ecosystem, made up of inherited applications, sensors, network technologies and systems, often resulting from the use of horizontal solutions (Figure 3). Therefore, the problems are inherited too. This makes it necessary to first identify (P1) the technologies and IT services related to the elements to be implemented within the smart university, to build a general idea of what currently exists and what can be done with these existing technologies.
The university’s IT catalogue, in addition to being essential in applying the methodology, is necessary to conduct highly beneficial processes, such as accreditations of the International Organization for Standardization (ISO) or the application of standards, e.g., the Information Technology Infrastructure Library (ITIL) or Control Objectives for Information and related Technology (COBIT). Many universities already have an IT catalogue, precisely because this is a requirement included within various IT governance and management standards. In such cases, the catalogue simply needs to be consulted and updated. When implementing their smart initiatives, universities that do not dispose of an IT catalogue aligned with their strategic interests must conduct a survey of the campus technologies in order to develop the IT catalogue within this identification process (P1). Once the catalogue is obtained (either because it previously existed or because it was drawn up), it is necessary to identify the new IT elements related to the component to be implemented, to review the catalogue to avoid unnecessary duplication and, ultimately, if necessary, add new elements. The process ends with the updating of the catalogue, providing the university with a revised IT catalogue that is consistent with its technological reality.
Once the IT technologies and services have been established, the next stage is to classify (P2). The proposed methodology identifies three categories, based on the layers proposed in the IT architecture application tier (Section 5): presentation layer, business layer and monitoring layer.
These technologies must then be decoupled (P3), considering the classification of each. At this point, it is necessary to ensure that the identified components are independent of closed or proprietary solutions. This decoupling often necessitates the development of specific components to achieve the objective, followed by finally returning to the integration (P4), using the IT and SOA architecture as an integration model (Figure 7).
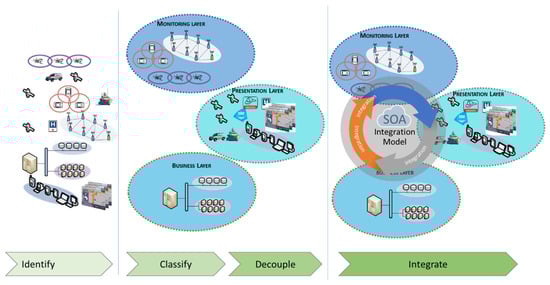
Figure 7.
IT services integration model.
The proposed methodology must be applied each time the smart university project requires the incorporation of IT components, since the identification, classification, decoupling and integration processes guarantee the correct integration of the new IT components into the existing platform, thus maintaining the characteristics of scalability, consistency, reusability and sustainability (Figure 8).
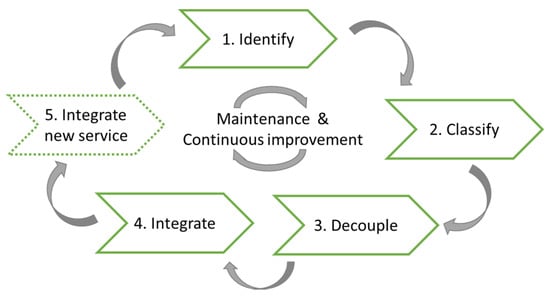
Figure 8.
Process of maintenance and continuous improvement.
To carry out process 5 in Figure 8, it is necessary to plan the services that add value to the university—specifically, the framework element described in the section below.
7. Service Planning
A smart university project is unlikely to be undertaken all at once. It will be divided into different actions, unfolding over several accounting years, during which management changes may take place. Over the years, it will gradually incorporate services for the university community. Deciding which services are the most relevant to address, as well as their timing, is critical for the global project to advance properly. The decision, however, is not trivial and must take a number of very different aspects into consideration.
Starting with the university’s needs and guided by the university’s strategic plan, the smart university dimensions and current regulations, the service planning process is conducted in order to obtain a roadmap with a prioritised list of value-added services that will enrich the smart university platform (Figure 9). This roadmap will guide the different actions to be developed in the smart university project. Applying the proposed IT framework, the inclusion of any of these services must be based on the service provision model, in accordance with the IT component incorporation methodology, which will align the service with the IT architecture.
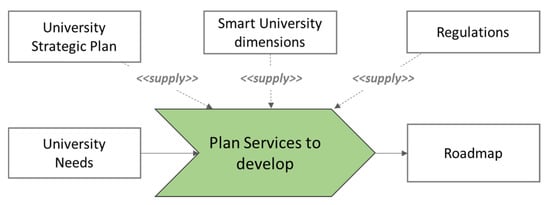
Figure 9.
Decision-making/prioritisation of services.
The university’s strategic plan and regulations depend on the university and even on the country or region in which the smart university project is to be implemented. For its part, the smart university’s dimensions analysis is, in a way, closely linked to the destination university, since it depends on specific factors such as idiosyncrasy and geographical location. It is, however, important to identify the smart pillars proposed within the smart university concept. Generally, all the smart dimensions proposed by the European Union in its Mapping Smart Cities in the EU report [82] should be taken into account. The dimensions centre around six fundamental pillars: Citizens—Smart People; Administration and Government—Smart Governance; Environment and Efficiency—Smart Environment; Mobility—Smart Mobility; Economy—Smart Economy, and Way of Life—Smart Living.
We propose to reflect the European Union’s key dimensions in the definition of this framework. They can be extended, as needs arise, to decouple areas or pillars according to the particular circumstances at the time. Indeed, implementation of a smart university entails the dynamic and constant improvement and expansion of services for the benefit of the university community. Knowledge of the smart university dimensions makes it easier to understand the domain and provides a basis for prioritising value-added services.
All these dimensions must be aligned with each university’s strategic pillars and characteristics. Indeed, the latter determine the projects and decision-making in the years to come, allowing the suitable operation, management, improvement and evolution of strategic decisions relating to the city’s development and the community’s wellbeing.
Due to the complexity of a smart university’s global implementation, once the platform to be used as the core of the smart university project has been developed, value-added services can be designed and implemented over different phases. The pillars and actions, aligned with the university’s strategies, that will be prioritised in the different phases of implementation must be selected. This continuous improvement process does not have any major implications since the platform’s core is designed from the very beginning to be flexible enough to support the gradual development of services and improvements (thanks to the service provision model, the IT architecture and the IT component incorporation methodology). Even after all the dimensions have been implemented, the monitoring and continuous improvement strategies will lead to new services being included in most of the them. These must follow the methodology and respond to the proposed models.
It is important to remember that the dimensions are not dissociated. Many sensing, monitoring or dashboard application initiatives relate to more than one pillar. Thus, once the initiatives to be implemented have been identified, the dimensions to which they relate should be correctly identified.
Another key aspect when selecting the services to be implemented is the university idiosyncrasy. Universities are based on service principles and these services will always centre around the university’s mission: teaching, research and technology transfer.
Given the type of institution that universities represent, and their form of financing, certain aspects and principles are expected to be given particular attention: transparency, participation, responsibility and accountability. All these principles correspond to good governance principles that should be applied to each action, especially when they are within the scope of the smart university.
On the other hand, a university’s community profile is much more specific than that of a city’s: the community is mainly composed of young or middle-aged adults and the presence of children or senior citizens is unlikely. The university community naturally presents a high educational level and is usually deeply involved in governmental aspects (compared to the general population). Clearly, each collective has a particular sensitivity to a specific type of initiative and the university city is no exception.
In addition to this generic university profile, each university will present needs based on their interests, sensitivities and particular strategies, which will largely depend on the environment in which they are located. Again, the latter will condition the type of added-value services under consideration and the way in which proposals should be prioritised.
By taking all the above into account (idiosyncrasy plus strategy), it is possible to determine which services should be developed in a specific university.
As explained above, a smart design or concept depends, in any university, on the needs of each of its domains, the services required and the strategic plan defined for that university. A successful outcome is undoubtedly mainly linked to and conditioned by financial and social factors, which will make it possible to measure the project’s degree of success. The process proposed here is not prescriptive, but it does include a series of recommended tasks to correctly plan the services. These tasks are summarised in Figure 10.
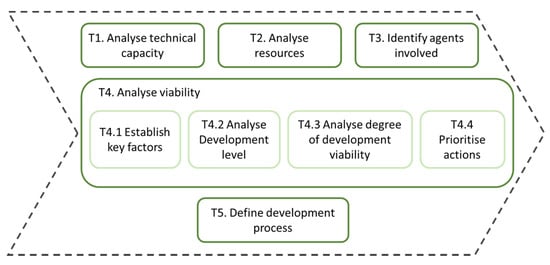
Figure 10.
Tasks of the service decision-making/prioritisation process.
Before starting to plan sustainable services or solutions, it is necessary to consider the limits imposed by social, political and economic structures, as well as the availability or non-availability of different resources. In addition, to guarantee the project’s sustainability, one must ensure that the actors involved in the maintenance (administration, government, community, individuals) fulfil both the technical and management conditions required to maintain the generated services (T1) and the sufficient resources to finance the costs generated by such maintenance in the medium and long term (T2).
The key to becoming a smart university does not only lie in planning or implementing technologies in all domains or monitoring a community’s elements. It clearly also depends on a commitment to transforming the way in which problems are solved and adapting dynamically to challenges. The implementation of a smart model is a complex process that requires a sustained, holistic vision of the task that is unfolding.
The challenge is met when these criteria become transversal and intersect with all university dimensions. For this reason, it is essential to encourage all actors in the university community (T3) to participate: citizens, university bodies, administration, ICT companies, construction companies, urban service companies and all other competent organisations.
Once the necessary agents have been identified and involved, it is important to evaluate three components for each smart factor under consideration, thus performing a feasibility analysis (T4). First, the key factors (T4.1) related to the different smart dimensions must be established to assess the degree of development (T4.2), in order to understand the university’s current situation as well as the environment in relation to each of these factors. One must then analyse whether it is feasible to develop a specific area (T4.3), while bearing in mind the contextual conditions that may limit or enhance a successful outcome: the economy, geography, culture, the environmental conditions, etc. Finally, the actions (T4.4) to be developed must be prioritised, remembering that, due to the heterogeneity of a university’s communities, the needs of each will sometimes differ. A small campus is unlikely to be problematic in domains such as mobility or the environment, but it may present problems such as inefficient energy consumption or transparency difficulties, among other limitations.
Table 1 illustrates a proposal for a template to develop task T4 within the framework. In this case, the key factors are applied to a hypothetical university to provide a full template.

Table 1.
Template of analysis of smart university indicators.
Once the key factors and their components have been established to assess the university’s required degree of development, it is necessary to define an appropriate development procedure (T5), applying a transversal and integrated vision. A defined strategy is then materialised in a roadmap which establishes the necessary steps, the activities to be carried out, the agents involved, the timeframe and the sources of financing necessary to develop value-added services.
To close the cycle and to ensure that the development is entirely consistent, contributing to maintaining the service provision model (Section 4), it is advisable to apply the methodology proposed in the framework when developing the value-added services into which the IT components need to be incorporated (6).
8. The SmartUA Case Study
The proposed IT conceptual framework has been implemented at the University of Alicante since 2014, when the university’s board decided to build the foundations of a smart university.
Notably, the University of Alicante has a community of over forty thousand people, who make intensive use of spaces, services and technologies; in comparison, approximately 96.9% of Spanish municipalities have a population of less than thirty thousand inhabitants [83].
An examination of the different smart dimensions within the University of Alicante, their cross-analysis with the university’s strategic plans [84], the main elements of the university’s idiosyncrasy, as well as a feasibility study, all led to the roadmap presented in Figure 11. It summarises the analysis carried out within the value-added service planning process (services 7).
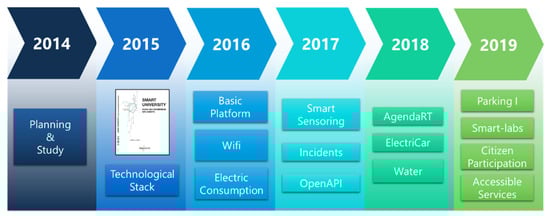
Figure 11.
SmartUA project roadmap.
Once the development of the platform was begun in 2016, it was necessary to add IT components. The methodology conceived for this task within the framework was thus applied (Section 6). At that time, no thorough technological university catalogue had been elaborated, so the identification process was conducted with the aim of building a catalogue that reflected the University of Alicante’s technological realities. This technological survey, carried out as part of the methodology, was also aligned with other university strategies related to good governance. In this way, the process of identifying the technologies allowed the implementation of the project following its designed methodology, obtaining a technological catalogue of devices and services, with a positive impact on the university’s good governance.
Once the IT components were identified, classified and decoupled, they were recoupled following SOA patterns for communication and the components were distributed according to the IT architecture (Section 5) proposed within the framework. As defined in the architecture, the monitoring layer was made up of elements used for data monitoring and acquisition. Notably, these elements can be either technological components, e.g., temperature, pollution or noise sensors, or software included within devices, making users the very carriers of the sensors capable of measuring other more complex factors, such as the quality of a service based on the time it takes to use it. The intermediate layer contains the entire business logic, including the storage, processing and provision of the stored or generated information. Finally, the presentation layer offers the formatted data to the smart community, either through ready-to-consume end-services or as services intended to be consumed by other applications or third parties.
After a review of the UA’s state of technology and its service prioritisation, we decided to implement the architecture’s different components with technologies that are currently part of distributed environments with a high density of use and users, such as the cloud and distributed web applications. For this reason, a more specific architecture was elaborated for the University of Alicante, using the layers and sublayers proposed in the framework. Figure 12 shows both the IT architecture implemented by the SmartUA solution and the technology stack used.
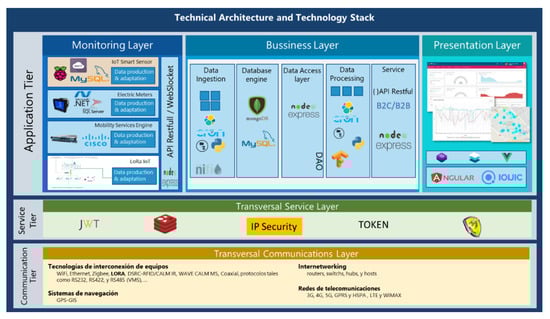
Figure 12.
Technical architecture and technological stack of the SmartUA project.
In accordance with the roadmap (Figure 11), once the architecture was implemented as part of the base platform, the Wi-Fi value-added service was developed in 2016. CISCO company tools were used to manage the wireless network at the University of Alicante. They allow the monitoring of the users who are connected in real time to each Wi-Fi network access point. These devices were added in the monitoring layer following the IT component incorporation methodology. The rest of the implemented components related to processing and storage were located in the business layer, and the elements related to publication and views were located in the presentation layer.
These purely numerical data referring to Wi-Fi network users are very useful, for example, for network administrators, but they are of little use to campus users in their pure state, since they represent a huge dataset that is very difficult to decipher. They need to be interpreted in order for their value to be fully exploited. This Wi-Fi network user indicator can serve to detect the areas in the university with the largest user concentrations. Therefore, it can help to locate and predict the areas with the highest human traffic. It can also help those concerned about topics relating to hypersensitivity disorders to electromagnetic technology to avoid certain areas. It can inform users about areas of the university in which the bandwidth is shared the most and will therefore fluctuate, or it can simply indicate the quieter places most suitable for study. It was then decided to offer this information service in the form of heat maps, which represent the geographical density of the Wi-Fi network’s use state at all times or historically (Figure 13).
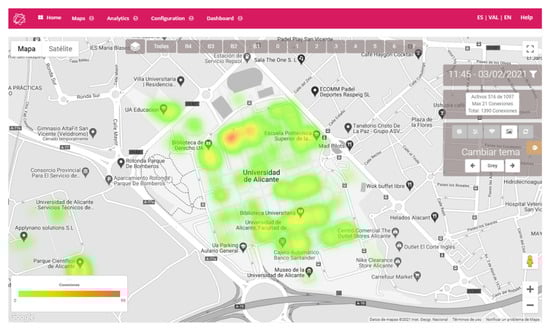
Figure 13.
Heat map showing the concentration of people in the University of Alicante based on Wi-Fi consumption.
Thanks to the framework’s application, a completely modular, scalable and flexible platform was obtained to which services can be added by integrating modules into any layer, thus allowing the building of tools in an aggregate way. This made it possible to continue with the roadmap and to develop the rest of the value-added services, such as electricity consumption (Figure 14a), agenda (Figure 14b) and vehicle recharging (Figure 14c), without any major setbacks.
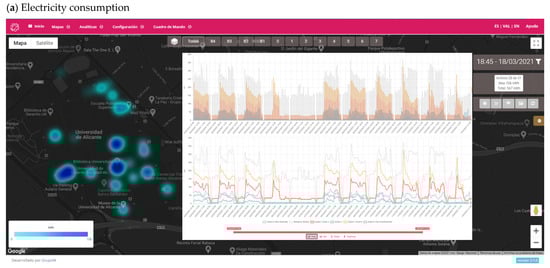
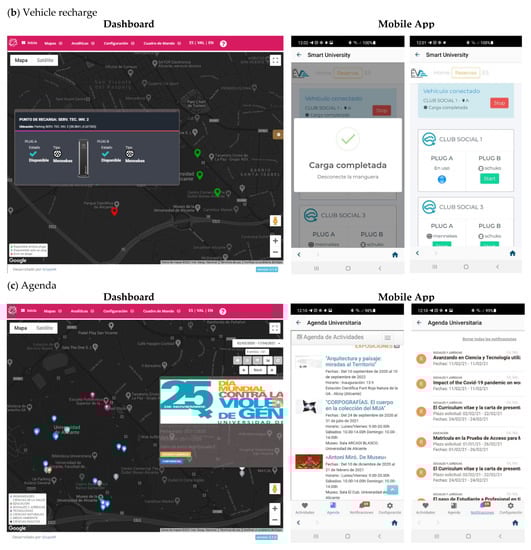
Figure 14.
Value-added services user interface. (a) Electricity consumption dashboard. (b) Vehicle recharge dashboard and user mobile app for recharge control. (c) Agenda dashboard for events control and user mobile app with recommendations.
A data access API (APIData) was developed with two main objectives. The first was to offer data of interest to third parties so that they could develop their own value-added services and contribute to the university community’s quality of life. The second was based on fulfilling one of the university’s research missions. Over the years, the platform has accumulated a very rich database of data that is offered anonymously to researchers to test and validate different studies. We found that the disposal of real and abundant data often represented a valuable research asset. The SmartUA project thus also contributes to an essential and necessary element of academia: research. The data offered by the API conform to all open data regulations of the University of Alicante, guaranteeing security, anonymity and data protection [85,86,87].
Moreover, we measured the platform usage indicators over the years, including those referring both to application users (Figure 15) and to the development and maintenance costs (Figure 16).
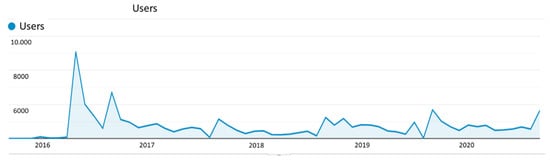
Figure 15.
SmartUA platform users.
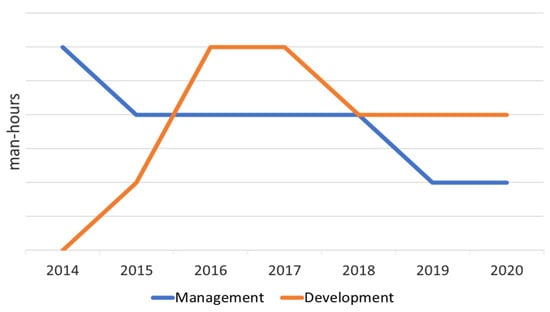
Figure 16.
Development and maintenance cost.
The data produced by the usage graphs over the years (Figure 15) demonstrate both the scope and magnitude of the platform and its services as well as the interest aroused in the university community generally. The downward user fluctuations coincide with holiday months, while peaks can be explained by the launch of new value-added services that have been incorporated into the platform in accordance with the project’s roadmap.
These usage data, combined with the platform maintenance data (Figure 16), in which management and development resources (measured in man-hours) have been stabilising in recent years, reveal a dynamic platform that, thanks to a valid methodology, has resulted in a project that is stable and sustainable over time.
Although surveys are planned for the next few years, no direct surveys have been carried out to date on the general community regarding the use of the platform and how it has influenced their quality of life. However, annual surveys have been conducted with the university’s senior management regarding their perceptions of the most positive effects of the platform’s implementation. A summary of the main indicators selected by the university management is presented in Table 2.
Table 2.
Indicators identified by the university’s senior management.
Even though over 20 value-added services have so far been developed within the SmartUA project, we cited only five in this article: Wi-Fi, car recharging, agenda, electricity consumption and access to anonymised data (APIData). The methodology proposed in the framework was applied each time it was necessary to add new IT components to each service. The reuse of existing components was possible thanks to the identification of the technologies, their classification, the decoupling of the service for which they were originally used and their integration through SOA. As can be observed in Table 3, the services that were added over the years made use, where necessary, of existing components, thus avoiding unnecessary duplication.
Table 3.
Reuse of sensors in the different SmartUA services.
The university’s Wi-Fi sensors were used for the Wi-Fi service, and the existing smart electric meters for the electricity consumption service. However, the electricity consumption service needed data on area usage, and these were obtained from the number of users connected to the Wi-Fi. The latter data were also necessary for the vehicle recharging service. For its part, the agenda service is fed by the university agenda database and the APIData service uses all the information collected from the different sensors.
The data of the different services can now be displayed in dashboards, which can be made available on-demand upon user request. They offer indicators of interest to community members, encompassing information about aspects such as Wi-Fi consumption, water and electricity consumption, agglomeration alerts, available car charging points, used and available vehicles and bicycles, classroom occupancy and air quality (Figure 17).
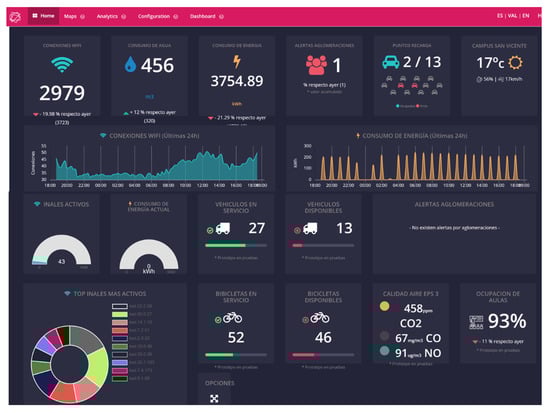
Figure 17.
Dashboard showing the main SmartUA indicators.
It is worth noting that the framework’s methodology made it possible to take advantage of many IT components, such as sensor networks, storage services and water and electricity meters that had been installed at the university, independently of the SmartUA projects. They had been set up both previously and in parallel to SmartUA. This ability to take advantage of existing IT components is among our framework’s goals. Another objective is that new IT elements generated by value-added services may be incorporated with minimal effort and without any major setbacks. Table 4 shows all the components that we have been able to integrate, through either reuse or incorporation. Only a small-sized work team was necessary, but they worked on a flexible basis thanks to the application of the framework and the clear incorporation mechanism described in our proposed methodology.
Table 4.
IT components integrated in SmartUA.
All of the above shows that the implementation of the proposed IT conceptual framework allows the suitable management of such large-scale projects as smart university projects and with limited resources. Furthermore, it brings about a positive impact not only on the government layers, thanks to its strategic alignment, but also on the more technical strata, achieving a flexible platform. Modularity is designed in the platform’s architecture: not only does this allow the correct development of the platform but, even more importantly, it makes it sustainable over time and attractive to the university community.
9. Conclusions
A distinguishing feature of universities has always been how they foster creativity, innovation, social and intellectual development and collaboration. This innovative development has the characteristic of transferring more innovation to its environment than to itself. However, the opportunity to develop complete large-scale solutions on the existing campuses of most universities makes it possible to globally systematise innovation. For this reason, a university’s shift towards a smart university model is a challenge in itself, as universities can function similarly to much of a region’s social, innovative, economic and industrial activity and export their model to communities around them.
To implement these initiatives and transition towards a smart university model, frameworks, methods and models are needed to support the different stages of macro-projects such as these. Due to their huge scale and scope, they usually take several years to accomplish. In order to make these smart university projects viable over time, mechanisms allowing the achievement of scalable, flexible and sustained solutions over time are needed. The ability to systematise/automate processes gives the project less of an artistic nature and more of an engineering one, leading to the specification of resources, timeframes, budget, etc.
Based on this assumption, we presented an IT conceptual framework for the modelling of smart university projects. The first step was a service provision model, supported by an IT architecture consolidated with a methodology for IT component integration. The latter allowed the generation of a consistent platform in which it is feasible to flexibly add new services and avoid duplications. All this was enriched with a service planning process. This can be understood as governing instruments that seek to align different actions or initiatives with the university’s strategic plans, thereby contributing to good governance.
This framework was designed before the SmartUA project was developed and it was intended to be generic. It was applied from the very beginning of the smart university project at the University of Alicante. The framework has proved its effectiveness over the six years for which it has been running. It has allowed the development of the platform in a stable way, and the secure and flexible creation of over twenty value-added services that are closely aligned with the university’s strategic plan.
The results relating to the use of the services have shown that the framework, in addition to having facilitated the development and maintenance of the smart platform, has permitted the generation of a range of services of great interest to the university community and which have been popular over the years. Finally, it is also clear, based on maintenance costs over the years, that the use of the proposed IT framework promises to make smart university projects highly sustainable.
Future improvements in the short term include not only the incorporation of new value-added services aligned with the university’s strategy but also the enhancement of performance, using both warnings and notifications. This latter work has already begun. Electronic actuators have also been incorporated. They allow the automation of crowd control elements and university processes. The concept has also started to be transferred to medium-sized populations to take advantage of the initiative and validate the platform in more open environments. In the medium and long term, we will work on incorporating artificial intelligence into the platform in different architectural layers: both in monitoring and acquisition, as well as in information storage and processing and in the processes of creating services and the generation of alerts and decision-making support more generally.
Author Contributions
All authors have contributed equally to all sections of this manuscript. All authors have read and agreed to the published version of the manuscript.
Funding
This work was supported by grant TIN2016-78103-C2-2-R and the University of Alicante (grant SmartUniversity2020).
Institutional Review Board Statement
Not applicable.
Informed Consent Statement
Not applicable.
Data Availability Statement
Data is available at https://web.ua.es/es/smart (accessed on 13 February 2021).
Conflicts of Interest
The authors declare no conflict of interest.
References
- Alawadhi, S.; Aldama-Nalda, A.; Chourabi, H.; Gil-Garcia, J.R.; Leung, S.; Mellouli, S.; Nam, T.; Pardo, T.A.; Scholl, H.J.; Walker, S. Building Understanding of Smart City Initiatives. In Lecture Notes in Computer Science (including Subseries Lecture Notes in Artificial Intelligence and Lecture Notes in Bioinformatics); Spring: Berlin, Germany, 2012; Volume 7443, pp. 40–53. [Google Scholar]
- Anavitarte, L.; Tratz-Ryan, B. Market Insight: ‘Smart Cities’ in Emerging Markets. 2010. Available online: https://www.gartner.com/en/documents/1468734/market-insight-smart-cities-in-emerging-markets (accessed on 25 December 2020).
- Washburn, D.; Sindhu, U.; Balaouras, S.; Dines, R.A.; Hayes, N.M.; Nelson, L.E. Helping CIOs Understand “Smart City” Initiatives: Defining the Smart City, Its Drivers, and the Role of the Forrester Research. 2010. Available online: www.forrester.com (accessed on 25 December 2020).
- Dameri, R.P. Searching for Smart City definition: A comprehensive proposal. Int. J. Comput. Technol. 2013, 11, 2544–2551. [Google Scholar] [CrossRef]
- Quijano-Sánchez, L.; Cantador, I.; Cortés-Cediel, M.E.; Gil, O. Recommender systems for smart cities. Inf. Syst. 2020, 92, 101545. [Google Scholar] [CrossRef]
- Caragliu, A.; Del Bo, C.; Nijkamp, P. Smart Cities in Europe. J. Urban Technol. 2011, 18, 65–82. [Google Scholar] [CrossRef]
- Fissi, S.; Romolini, A.; Gori, E.; Contri, M. The path toward a sustainable green university: The case of the University of Florence. J. Clean. Prod. 2021, 279, 123655. [Google Scholar] [CrossRef]
- Larrán Jorge, M.; Herrera Madueño, J.; Calzado Cejas, M.Y.; Andrades Peña, F.J. An approach to the implementation of sustainability practices in Spanish universities. J. Clean. Prod. 2015, 106, 34–44. [Google Scholar] [CrossRef]
- del Mar Alonso-Almeida, M.; Marimon, F.; Casani, F.; Rodriguez-Pomeda, J. Diffusion of sustainability reporting in universities: Current situation and future perspectives. J. Clean. Prod. 2015, 106, 144–154. [Google Scholar] [CrossRef]
- Spain NI of S of Spanish Register Data by Municipalities. Available online: https://www.ine.es/dyngs/INEbase/es/categoria.htm?c=Estadistica_P&cid=1254734710990 (accessed on 7 February 2021).
- Sánchez Bernabeu, J.M.; Pérez Maciá, F.; Berná Martinez, J.V.; Lorenzo Fonseca, I.; Fuster Guillo, A. Smart University: Hacia una Universidad Más Abierta; Marcombo, S.A., Ed.; Marcombo: Barcelona, Spain, 2016. [Google Scholar]
- Jovanović, D.; Milovanov, S.; Ruskovski, I.; Govedarica, M.; Sladić, D.; Radulović, A.; Pajić, V. Building Virtual 3D City Model for Smart Cities Applications: A Case Study on Campus Area of the University of Novi Sad. ISPRS Int. J. Geo-Inf. 2020, 9, 476. [Google Scholar] [CrossRef]
- Rinaldi, C.; Cavicchi, A.; Robinson, R.N.S. University contributions to co-creating sustainable tourism destinations. J. Sustain. Tour. 2020, 1–23. [Google Scholar] [CrossRef]
- Guerrieri, M.; La Gennusa, M.; Peri, G.; Rizzo, G.; Scaccianoce, G. University campuses as small-scale models of cities: Quantitative assessment of a low carbon transition path. Renew. Sustain. Energy Rev. 2019, 113, 109263. [Google Scholar] [CrossRef]
- Ahmed, V.; Abu Alnaaj, K.; Saboor, S. An Investigation into Stakeholders’ Perception of Smart Campus Criteria: The American University of Sharjah as a Case Study. Sustainability 2020, 12, 5187. [Google Scholar] [CrossRef]
- Kwet, M.; Prinsloo, P. The ‘smart’ classroom: A new frontier in the age of the smart university. Teach. High. Educ. 2020, 25, 510–526. [Google Scholar] [CrossRef]
- Chiu, P.-S.; Chang, J.-W.; Lee, M.-C.; Chen, C.-H.; Lee, D.-S. Enabling Intelligent Environment by the Design of Emotionally Aware Virtual Assistant: A Case of Smart Campus. IEEE Access 2020, 8, 62032–62041. [Google Scholar] [CrossRef]
- Hollands, R.G. Will the real smart city please stand up? City 2008, 12, 303–320. [Google Scholar] [CrossRef]
- Ahuja, K.; Khosla, A. A novel framework for data acquisition and ubiquitous communication provisioning in smart cities. Future Gener. Comput. Syst. 2019, 101, 785–803. [Google Scholar] [CrossRef]
- Giourka, P.; Sanders, M.; Angelakoglou, K.; Pramangioulis, D.; Nikolopoulos, N.; Rakopoulos, D.; Tryferidis, A.; Tzovaras, D. The Smart City Business Model Canvas—A Smart City Business Modeling Framework and Practical Tool. Energies 2019, 12, 4798. [Google Scholar] [CrossRef]
- Albino, V.; Berardi, U.; Dangelico, R.M. Smart Cities: Definitions, Dimensions, Performance, and Initiatives. J. Urban Technol. 2015, 22, 3–21. [Google Scholar] [CrossRef]
- Coletta, C.; Evans, L.; Heaphy, L.; Kitchin, R. Creating Smart Cities; Coletta, C., Evans, L., Heaphy, L., Kitchin, R., Eds.; Routledge, Taylor & Francis Group: London, UK, 2018. [Google Scholar]
- Meng, W.; Li, W.; Tug, S.; Tan, J. Towards blockchain-enabled single character frequency-based exclusive signature matching in IoT-assisted smart cities. J. Parallel Distrib. Comput. 2020, 144, 268–277. [Google Scholar] [CrossRef]
- Braun, T.; Fung, B.C.M.; Iqbal, F.; Shah, B. Security and privacy challenges in smart cities. Sustain. Cities Soc. 2018, 39, 499–507. [Google Scholar] [CrossRef]
- Abu Bakar, N.; Selamat, A.; Krejcar, O. Improving Agent Quality in Dynamic Smart Cities by Implementing an Agent Quality Management Framework. Appl. Sci. 2019, 9, 5111. [Google Scholar] [CrossRef]
- Younus, M.U.; Islam, S.U.; Ali, I.; Khan, S.; Khan, M.K. A survey on software defined networking enabled smart buildings: Architecture, challenges and use cases. J. Netw. Comput. Appl. 2019, 137, 62–77. [Google Scholar] [CrossRef]
- Bernabéu, J.M.S.; Berna-Martinez, J.V.; Pérez, F.M. Smart Sentinel: Monitoring and Prevention System in the Smart Cities. Int. Rev. Comput. Softw. 2014, 9, 1554. [Google Scholar] [CrossRef]
- Berna-Martinez, J.V.; Macia-Perez, F.; Sánchez-Bernabeu, J.M. Monitoring and Prevention the Smart Cities. Int. J. Adv. Inf. Sci. Technol. 2014, 31, 60–67. [Google Scholar]
- Benevolo, C.; Dameri, R.P.; D’Auria, B. Smart Mobility in Smart City. In Empowering Organizations; Springer: Cham, Switzerland, 2016; Volume 11, pp. 13–28. [Google Scholar]
- Horng, G.J. The Adaptive Recommendation Segment Mechanism to Reduce Traffic Congestion in Smart City. In Proceedings of the 2014 Tenth International Conference on Intelligent Information Hiding and Multimedia Signal Processing, Kitakyushu, Japan, 27–29 August 2014; pp. 155–158. [Google Scholar]
- Kong, F.; Li, J.; Lv, Z. Construction of intelligent traffic information recommendation system based on long short-term memory. J. Comput. Sci. 2018, 26, 78–86. [Google Scholar] [CrossRef]
- Anthony Jnr, B. Smart city data architecture for energy prosumption in municipalities: Concepts, requirements, and future directions. Int. J. Green Energy 2020, 17, 827–845. [Google Scholar] [CrossRef]
- Marinakis, V.; Doukas, H.; Tsapelas, J.; Mouzakitis, S.; Sicilia, Á.; Madrazo, L.; Sgouridis, S. From big data to smart energy services: An application for intelligent energy management. Future Gener. Comput. Syst. 2020, 110, 572–586. [Google Scholar] [CrossRef]
- Fotopoulou, E.; Zafeiropoulos, A.; Terroso, F.; Gonzalez, A.; Skarmeta, A.; Simsek, U.; Fensel, A. Data aggregation, fusion and recommendations for strengthening citizens energy-aware behavioural profiles. In Proceedings of the 2017 Global Internet of Things Summit (GIoTS), Geneva, Switzerland, 6–9 June 2017; pp. 1–6. [Google Scholar]
- Cioara, T.; Anghel, I.; Salomie, I.; Antal, M.; Pop, C.; Bertoncini, M.; Arnone, D.; Pop, F. Exploiting data centres energy flexibility in smart cities: Business scenarios. Inf. Sci. (NY) 2019, 476, 392–412. [Google Scholar] [CrossRef]
- Gil-Garcia, J.R.; Pardo, T.A.; Aldama-Nalda, A. Smart cities and smart governments. In Proceedings of the 14th Annual International Conference on Digital Government Research; ACM: New York, NY, USA, 2013; pp. 296–297. [Google Scholar]
- Nam, T.; Pardo, T.A. Conceptualizing smart city with dimensions of technology, people, and institutions. In Proceedings of the 12th Annual International Digital Government Research Conference on Digital Government Innovation in Challenging Times—dg.o ’11; ACM Press: New York, NY, USA, 2011; p. 282. [Google Scholar]
- Johannessen, M.R.; Berntzen, L. The Transparent Smart City. In Smart Technologies for Smart Governments; Springer: Berlin/Heidelberg, Germany, 2018; Volume 24, pp. 67–94. [Google Scholar]
- Weber, E.P.; Khademian, A.M. Wicked Problems, Knowledge Challenges, and Collaborative Capacity Builders in Network Settings. Public Adm. Rev. 2008, 68, 334–349. [Google Scholar] [CrossRef]
- Rittel, H.W.J.; Webber, M.M. Dilemmas in a general theory of planning. Policy Sci. 1973, 4, 155–169. [Google Scholar] [CrossRef]
- Caragliu, A.; Del Bo, C.F. Smart innovative cities: The impact of Smart City policies on urban innovation. Technol. Forecast. Soc. Change 2019, 142, 373–383. [Google Scholar] [CrossRef]
- Lam, P.T.I.; Yang, W. Factors influencing the consideration of Public-Private Partnerships (PPP) for smart city projects: Evidence from Hong Kong. Cities 2020, 99, 102606. [Google Scholar] [CrossRef]
- Goodman, N.; Zwick, A.; Spicer, Z.; Carlsen, N. Public engagement in smart city development: Lessons from communities in Canada’s Smart City Challenge. Can. Geogr. Le Géographe Can. 2020, 64, 416–432. [Google Scholar] [CrossRef]
- Karppi, I.; Vakkuri, J. Becoming smart? Pursuit of sustainability in urban policy design. Public Manag. Rev. 2020, 22, 746–766. [Google Scholar] [CrossRef]
- Garnett, P. Growing Smart Cities. In From Astrophysics to Unconventional Computation; Springer: Berlin/Heidelberg, Germany, 2020; pp. 299–310. ISBN 978-3-030-15792-0. [Google Scholar]
- Miller, T.R. Imaginaries of Sustainability: The Techno-Politics of Smart Cities. Sci. Cult. 2020, 29, 365–387. [Google Scholar] [CrossRef]
- Innovation M of S and Data Catalog Statistics and University Reports. Available online: https://www.ciencia.gob.es/portal/site/MICINN/menuitem.26172fcf4eb029fa6ec7da6901432ea0/?vgnextoid=9b238e2eb3856610VgnVCM1000001d04140aRCRD (accessed on 7 February 2021).
- Universidades Públicas con Más Alumnos 2019|Statista. Available online: https://es.statista.com/estadisticas/505994/universidades-publicas-de-espana-con-mas-alumnos/ (accessed on 25 December 2020).
- Muhamad, W.; Kurniawan, N.B.; Suhardi; Yazid, S. Smart campus features, technologies, and applications: A systematic literature review. In Proceedings of the 2017 International Conference on Information Technology Systems and Innovation (ICITSI), Bandung, Indonesia, 23–24 October 2017; pp. 384–391. [Google Scholar]
- Chen, C.H.; Chen, C.; Lu, S.H.; Tseng, C.C. Role-based campus network slicing. In Proceedings of the 2016 IEEE 24th International Conference on Network Protocols (ICNP), Singapore, 8–11 November 2016; pp. 1–6. [Google Scholar]
- Wang, F. Research on the Application of Smart Campus Construction under the Background of Big Data. DEStech Trans. Comput. Sci. Eng. 2017. [Google Scholar] [CrossRef]
- Kaneko, A.; Sugino, N.; Suzuki, T.; Ishijima, S. A step towards the Smart Campus: A venture project based on distance learning by a hybrid video conferencing system. In Proceedings of the SMC 2000 Conference Proceedings, 2000 IEEE International Conference on Systems, Man and Cybernetics, “Cybernetics Evolving to Systems, Humans, Organizations, and Their Complex Interactions” (Cat. No.00CH37166), Nashville, TN, USA, 8–11 October 2000; Volume 1, pp. 38–43. [Google Scholar]
- Fraga-Lamas, P.; Celaya-Echarri, M.; Lopez-Iturri, P.; Castedo, L.; Azpilicueta, L.; Aguirre, E.; Suárez-Albela, M.; Falcone, F.; Fernández-Caramés, T.M. Design and Experimental Validation of a LoRaWAN Fog Computing Based Architecture for IoT Enabled Smart Campus Applications. Sensors 2019, 19, 3287. [Google Scholar] [CrossRef] [PubMed]
- Talei, H.; Essaaidi, M.; Benhaddou, D. Smart campus energy management system. In Proceedings of the 2017 International Conference on Smart Digital Environment; Association for Computing Machinery (ACM): New York, NY, USA, 2017; pp. 1–7. [Google Scholar] [CrossRef]
- Hu, Z.; Bai, Z.; Yang, Y.; Zheng, Z.; Bian, K.; Song, L. UAV Aided Aerial-Ground IoT for Air Quality Sensing in Smart City: Architecture, Technologies, and Implementation. IEEE Netw. 2019, 33, 14–22. [Google Scholar] [CrossRef]
- Adamko, A.; Kadek, T.; Kosa, M. Intelligent and adaptive services for a smart campus. In Proceedings of the 2014 5th IEEE Conference on Cognitive Infocommunications (CogInfoCom), Vietri sul Mare, Italy, 5–7 November 2014; pp. 505–509. [Google Scholar]
- Adamkó, A.; Kollár, L. Extensible Data Management Architecture for Smart Campus Applications—A Crowdsourcing based Solution. In Proceedings of the 10th International Conference on Web Information Systems and Technologies; SCITEPRESS—Science and and Technology Publications: Setúbal, Portugal, 2014; pp. 226–232. [Google Scholar]
- Jurva, R.; Matinmikko-Blue, M.; Niemelä, V.; Nenonen, S. Architecture and Operational Model for Smart Campus Digital Infrastructure. Wirel. Pers. Commun. 2020, 113, 1437–1454. [Google Scholar] [CrossRef]
- Viñán-Ludeña, M.S.; Jacome-Galarza, L.R.; Montoya, L.R.; Leon, A.V.; Ramírez, C.C. Smart University: An Architecture Proposal for Information Management Using Open Data for Research Projects. In Information Technology and Systems; Springer: Berlin/Heidelberg, Germany, 2020; Volume 1137, pp. 172–178. [Google Scholar]
- Del-Valle-Soto, C.; Valdivia, L.J.; Velázquez, R.; Rizo-Dominguez, L.; López-Pimentel, J.-C. Smart Campus: An Experimental Performance Comparison of Collaborative and Cooperative Schemes for Wireless Sensor Network. Energies 2019, 12, 3135. [Google Scholar] [CrossRef]
- Nagowah, S.D.; ben Sta, H.; Gobin-Rahimbux, B.A. An Ontology for an IoT-enabled Smart Classroom in a University Campus. In Proceedings of the 2019 International Conference on Computational Intelligence and Knowledge Economy (ICCIKE), Dubai, United Arab Emirates, 11–12 December 2019; pp. 626–631. [Google Scholar]
- Ardito, L.; Ferraris, A.; Messeni Petruzzelli, A.; Bresciani, S.; Del Giudice, M. The role of universities in the knowledge management of smart city projects. Technol. Forecast. Soc. Chang. 2019, 142, 312–321. [Google Scholar] [CrossRef]
- Villegas-Ch, W.; Palacios-Pacheco, X.; Luján-Mora, S. Application of a Smart City Model to a Traditional University Campus with a Big Data Architecture: A Sustainable Smart Campus. Sustainability 2019, 11, 2857. [Google Scholar] [CrossRef]
- Fortes, S.; Santoyo-Ramón, J.; Palacios, D.; Baena, E.; Mora-García, R.; Medina, M.; Mora, P.; Barco, R. The Campus as a Smart City: University of Málaga Environmental, Learning, and Research Approaches. Sensors 2019, 19, 1349. [Google Scholar] [CrossRef] [PubMed]
- Min-Allah, N.; Alrashed, S. Smart campus—A sketch. Sustain. Cities Soc. 2020, 59, 102231. [Google Scholar] [CrossRef] [PubMed]
- Kwok, L. A vision for the development of i-campus. Smart Learn. Environ. 2015, 2, 2. [Google Scholar] [CrossRef]
- Chourabi, H.; Nam, T.; Walker, S.; Gil-Garcia, J.R.; Mellouli, S.; Nahon, K.; Pardo, T.A.; Scholl, H.J. Understanding Smart Cities: An Integrative Framework. In Proceedings of the 2012 45th Hawaii International Conference on System Sciences, Maui, HI, USA, 4–7 January 2012; pp. 2289–2297. [Google Scholar]
- Westraadt, L.; Calitz, A. A modelling framework for integrated smart city planning and management. Sustain. Cities Soc. 2020, 63, 102444. [Google Scholar] [CrossRef]
- Mattoni, B.; Pompei, L.; Losilla, J.; Bisegna, F. Planning smart cities: Comparison of two quantitative multicriteria methods applied to real case studies. Sustain. Cities Soc. 2020, 60, 102249. [Google Scholar] [CrossRef]
- ISO—ISO 37101:2016—Sustainable Development in Communities—Management System for Sustainable Development—Requirements with Guidance for Use. Available online: https://www.iso.org/standard/61885.html (accessed on 25 December 2020).
- ISO—ISO 37100:2016—Sustainable Cities and Communities—Vocabulary. Available online: https://www.iso.org/standard/71914.html (accessed on 25 December 2020).
- ISO—ISO/TS 37151:2015—Smart Community Infrastructures—Principles and Requirements for Performance Metrics. Available online: https://www.iso.org/standard/61057.html (accessed on 25 December 2020).
- Silva, B.N.; Khan, M.; Han, K. Towards sustainable smart cities: A review of trends, architectures, components, and open challenges in smart cities. Sustain. Cities Soc. 2018, 38, 697–713. [Google Scholar] [CrossRef]
- Anthopoulos, L.; Fitsilis, P. From Digital to Ubiquitous Cities: Defining a Common Architecture for Urban Development. In Proceedings of the 2010 Sixth International Conference on Intelligent Environments, Kuala Lumpur, Malaysia, 19–21 July 2010; pp. 301–306. [Google Scholar]
- Nandury, S.V.; Begum, B.A. Smart WSN-based ubiquitous architecture for smart cities. In Proceedings of the 2015 International Conference on Advances in Computing, Communications and Informatics (ICACCI), Kochi, India, 10–13 August 2015; pp. 2366–2373. [Google Scholar]
- Prasetyo, Y.A.; Lubis, M. Smart City Architecture Development Methodology (SCADM): A Meta-Analysis Using SOA-EA and SoS Approach. SAGE Open 2020, 10. [Google Scholar] [CrossRef]
- FIWARE Open Source Platform for Our Smart Digital Future. Available online: https://www.fiware.org/ (accessed on 25 December 2020).
- Pozo, A.; Alonso, Á.; Salvachúa, J. Evaluation of an IoT Application-Scoped Access Control Model over a Publish/Subscribe Architecture Based on FIWARE. Sensors 2020, 20, 4341. [Google Scholar] [CrossRef]
- Araujo, V.; Mitra, K.; Saguna, S.; Åhlund, C. Performance evaluation of FIWARE: A cloud-based IoT platform for smart cities. J. Parallel Distrib. Comput. 2019, 132, 250–261. [Google Scholar] [CrossRef]
- Storek, T.; Lohmöller, J.; Kümpel, A.; Baranski, M.; Müller, D. Application of the open-source cloud platform FIWARE for future building energy management systems. J. Phys. Conf. Ser. 2019, 1343, 012063. [Google Scholar] [CrossRef]
- SmartUA. Official Web Page of SmartUA Project at University of Alicante. 2020. Available online: https://web.ua.es/es/smart (accessed on 25 December 2020).
- Giffinger, R.; Fertner, C.; Kramar, H.; Meijers, E. City-Ranking of European Medium-Sized Cities. Smartcity-Ranking.eu. Available online: http://www.smartcity-ranking.eu/download/city_ranking_final.pdf (accessed on 25 December 2020).
- Spanish National Statistics Institute—Official Population Figures Referring to Revision of Municipal Register 1 January. Available online: https://www.ine.es/dynt3/inebase/es/index.htm?padre=517&capsel=525 (accessed on 25 December 2020).
- SPUA Strategic Plan of the University of Alicante, 2014–2019. Available online: https://web.ua.es/es/peua/plan-estrategico-ua-40.html (accessed on 25 December 2020).
- Zubcoff, J.J.; Vaquer, L.; Mazón, J.-N.; Maciá, F.; Garrigós, I.; Fuster, A. The University as an Open Data Ecosystem. Int. J. Des. Nat. Ecodyn. 2016, 11, 250–257. Available online: https://www.witpress.com/elibrary/dne-volumes/11/3/1196 (accessed on 13 February 2021). [CrossRef]
- Vaquer, L.; Carcel, J.V.; Fuster, A.; Garrigós, I.; Maciá, F.; Mazón, J.-N.; Zubcoff, J.J. Developing a Data Map for Opening Public Sector Information. Int. J. Des. Nat. Ecodyn. 2016, 11, 370–375. Available online: https://www.witpress.com/elibrary/dne-volumes/11/3/1208 (accessed on 13 February 2021). [CrossRef][Green Version]
- Alicante U of Open Data Portal. Available online: https://datos.ua.es/en/open-data.html (accessed on 7 February 2021).


Publisher’s Note: MDPI stays neutral with regard to jurisdictional claims in published maps and institutional affiliations. |
© 2021 by the authors. Licensee MDPI, Basel, Switzerland. This article is an open access article distributed under the terms and conditions of the Creative Commons Attribution (CC BY) license (http://creativecommons.org/licenses/by/4.0/).