Abstract
Actinidia arguta (Siebold and Zucc.) Planch.ex Miq, called “hardy kiwifruit”, “baby kiwi” or “kiwi berry”, has a unique taste, is rich in nutrients and has high economic value and broad market prospects. Active research on the potential geographic distribution of A. arguta in China aims to provide a reference basis for its resource investigation, conservation, development and utilization and introduction of cultivation. In this study, the Maxent model was used to combine climatic factors, soil factors and geographical factors (elevation, slope and aspect) to predict the current and future (2041–2060 and 2081–2100) potential distribution of A. arguta and to analyze the impact of climate change on it. The results showed that the suitable distribution range of A. arguta in China was 23–43 N and 100–125 E, with a total area of about 3.4451 × 10⁶ km2. The highly suitable area of A. arguta was mainly concentrated in the middle and low mountain areas of the south of Shaanxi, the east of Sichuan, the middle and west of Guizhou and the west of Yunnan, presenting a circular distribution. The Jackknife test was used to calculate the main environmental factors affecting the distribution of A. arguta. The first four main factors were annual mean temperature (bio_1), precipitation of the warmest quarter (bio_18), elevation (ELE) and mean temperature of the warmest quarter (bio_10), which provided a contribution up to 81.7%. Under the scenarios of three representative concentrations (SSP1_2.6, SSP2_4.5 and SSP5_8.5) in the future, the area of low and moderate suitable habitat decreased, while the area of highly suitable habitat increased. The migration direction of the centroid in the highly suitable habitat moved to the southwest in the future scenario period.
1. Introduction
Climate change is an extremely complex biogeochemical process [1]. Studies have shown that at the regional scale, climate is the main environmental factor influencing species distribution [2]. Agricultural production is closely linked to climatic and ecological conditions. Climate change will alter the existing suitability zones of crops, affecting their growth, development, and yield [3,4,5]. Species distribution models (SDMs) have played a significant role in the study of the effects of climate change on species distribution. Among them, the Maxent model is proven to be the one with the best prediction accuracy and stability [6,7]. It simulates the potentially suitable distribution of species based on existing distribution data and environmental variables in the distribution area of the species—in particular, it can be used where records of the presence of species are scarce or incomplete. It has expertise in the fields of conservation biology [8], invasion biology [9,10] and the effects of global climate change on species distribution.
Kiwifruit is known as the “third generation king of fruits” for its high nutrition and good taste. It contains a variety of vitamins, protein, calcium, phosphorus, iron and other trace elements and a variety of amino acids and other nutrients. Its amino acid content can reach 933.9 mg/100 g, and vitamin C content can reach 430 mg/100 g, which is 80–100 times higher than that of apples and pears. Among them, Actinidia arguta (hardy kiwifruit) has three times more amino acids than Actinidia chinensis (gold kiwifruit) [11]. Kiwifruit is native of China; more than 60 varieties are available. Nevertheless, only three species have commercial importance—Actinidia deliciosa (green kiwifruit), Actinidia chinensis and Actinidia arguta—with total estimated annual sales exceeding USD 10 billion worldwide [12].
Actinidia arguta (Siebold and Zucc.) Planch.ex Miq. called “hardy kiwifruit”, “baby kiwi” or “kiwi berry”, is a perennial vine native to Northeast Asian countries, including China, Japan, Korea and Siberia [13]. It can be used for raw food, brewing, processing preserves and dried fruits, etc. The processed waste can be extracted secondarily as a raw material for antioxidants or healthcare formulations [14]. It has a large natural yield and great economic value. Its flowers, fruits, stems, leaves and roots have medicinal health value, and its main chemical components include triterpenoids, flavonoids, polysaccharides and volatile oil. The fruit of A. arguta is used medicinally for its strengthening, antipyretic and astringent properties. Chinese and Korean folklore use A. arguta root in combination with other herbs to treat cancer. Modern pharmacological studies have shown that its special secondary components have a good curative effect on most human diseases (such as diabetes, hypertension, hyperlipidemia and many inflammatory diseases) [15,16,17]. Additionally, it may be a potential source of natural antioxidants, it is rich in dietary fiber and helps to maintain intestinal immune homeostasis mechanisms [18,19]. It is worth mentioning that compared to the cultivated A. deliciosa and A. chinensis, A. arguta exhibits several elite traits, such as cold tolerance (up to −30 °C in midwinter), a short growth period (about 150 days) and resistance to bacterial canker disease of kiwifruit (Pseudomonas syringae pv. actinidiae) [20]. A. arguta is widely distributed in China, but cultivation is in its infancy. In China, nearly 2800 hm2 of A. arguta was planted; the annual yield is about 1000 t, the yield rate is about 50% and the average annual net income per 666.7 m2 (1 mu) amounts to ¥3393 [21].
At present, the domestication of A. arguta has been greatly increased, and the market has a bright future [22,23]. However, relatively little research has been conducted on its geographic distribution, and the environmental factors that significantly affect it have not been identified. Due to the large study area, if a comprehensive field survey is implemented, it is not only time-consuming, difficult and labor-intensive but also difficult to comprehensively count the existing distribution area of the species. At the same time, it is also difficult to predict the suitability distribution of the species under different future changes in climatic conditions. Therefore, the use of species distribution models (SDMs) for species distribution prediction not only saves costs but also allows us to obtain comprehensive prediction results. We used the Maxent modeling method to study China as the study area and A. arguta as the study object with the following research objectives: (1) identify the most important environmental factors that affect the geographic distribution of A. arguta; (2) predict the potential suitable distribution for A. arguta using various scenarios that model the nature and trends of changes in the current and future climate; and (3) quantify the spatial patterns of changes in the extent of suitable habitat using future climate conditions in a way that will facilitate the development of appropriate planting zoning measures for the sustainable development of the A. arguta industry.
2. Materials and Methods
2.1. Species Occurrence Records Collection
To obtain the natural occurrence records for A. arguta, we checked the Chinese Virtual Herbarium (CVH, http://www.cvh.ac.cn/), the National Specimen Information Infrastructure (NSII, http://nsii.org.cn/) and the Global Biodiversity Information Facility (GBIF, https://www.gbif.org/). When occurrence records lacked exact geo-coordinates, we used Google Earth to determine the latitude and longitude, and delete duplicate and ambiguous records. For redundant data point elimination, there are two methods. One is to use a buffer function; only one point is retained in the buffer. Second, ENMTools [24] is used to automatically analyze the occurrence data and remove the redundant data in the same raster. In this study, we conducted the above two methods separately. In method 1, a buffer zone radius of 1.25 km was used; points A or B were deleted, and points C and D were retained. However, using method 2, we found that points A and B were not in the same raster (2.5 × 2.5 km) and should be retained in their entirety, while one of C and D should be deleted. After a comprehensive comparison, this study used ENMTools for redundant data point removal (Figure 1). Finally, a total of 93 occurrence records of A. arguta were obtained for constructing the models (Figure 2).
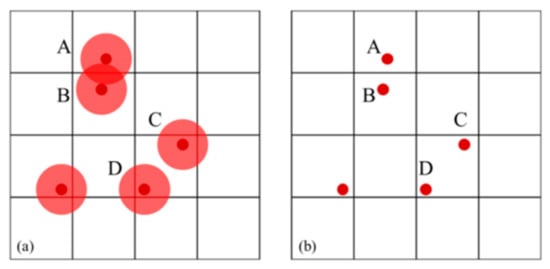
Figure 1.
Two screening methods for species occurrence records: (a) buffer function; (b) ENMTools.
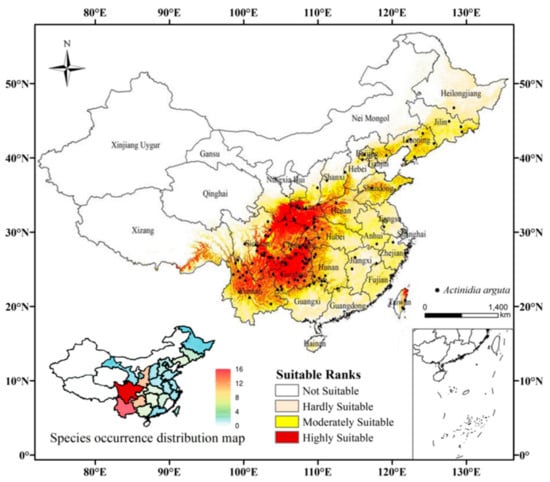
Figure 2.
Distribution records and current suitable climatic distribution of A. arguta in China.
2.2. Environmental Variables
We initially selected 33 environmental variables (climate factors, soil factors and terrain factors) that may affect the distribution of A. arguta (Table S1). These included 19 bioclimatic variables at 2.5 arc minute (ca. 4.5 km) spatial resolution downloaded from the WorldClim Database (version 2.0) (http://www.worldclim.org) [25]. In addition, A. arguta is not wind resistant and is particularly affected by high winds during flowering (May–June) and fruit set (June–August), which seriously affects yield, so the average wind speed was chosen as an additional environmental variable. Nine soil factors with significant effects on plant root growth and development were obtained from the Harmonized World Soil Database (HWSD). Terrain data were downloaded from the geospatial data cloud (http://www.gscloud.cn).
All environmental variables were preprocessed to a unified coordinate system, cell size and spatial extent. Correlations among environmental variables can reduce the accuracy of a model [26], so that the multi-collinearity of variables needs to be avoided. We used Pearson’s correlation coefficient (r) to screen environmental variables for multicollinearity. For variables with |r| ≥ 0.85, the variables with least biological meaning in the group of highly correlated variables were selected for removal, and finally the independent and biologically meaning environmental variables were selected. Finally, out of 33 variables, only 11 environmental variables were retained to simulate the current and future distributions of A. arguta in China (Table 1, Figure 3).

Table 1.
Estimates of contribution and permutation importance of environmental variables in MaxEnt modeling.
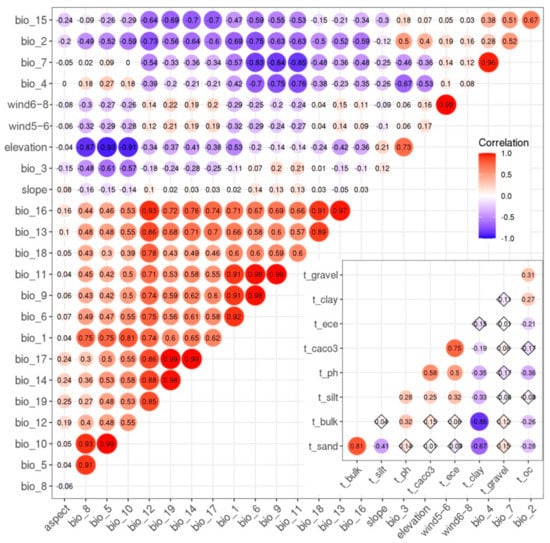
Figure 3.
Correlation matrix between environmental variables used in this study.
For future climate scenarios, we used BCC-CSM2-MR climate change modeling data (BCC, China, Beijing) under the shared socio-economic pathways (SSPs). SSPs can be used to project greenhouse gas (GHG) emission scenarios for different climate policies in 2100, unlike representative concentration pathways (RCPs), which take into account socio-economic and land-use influences on the development of regional climate change [27]. SSP1 represents a sustainable development path, which is a green development path that is low in materials, resources, and energy. SSP2 represents a moderate development path, in which the future socioeconomic development pattern continues along the current pattern. SSP5 assumes full socioeconomic development but is based on an energy-intensive economy as a driver. The SSP has a higher starting point than the RCP, more moderate and closer to the true value [28]. The three routes were chosen to predict the potential distribution areas of A. arguta for the future mid-21st century (2041–2060) and late-21st century (2081–2100) time periods while leaving all other environmental data (soil and terrain factors) constant. By comparing these results with those predicted for A. arguta under current climate conditions, we can obtain a stable habitat for this species under climate change.
2.3. MaxEnt Model Evaluation
The R-package “ENMeval” was used to adjust the Maxent model’s (V3.4.1k) [29] regularization multiplier (RM) and feature combination (FC). At present, there are 5 characteristics of the MaxEnt model, namely, the linear feature (L), quadratic feature (Q), hinge feature (H), product feature (P) and threshold feature (T). The RM was set to 0.5–4, each time increased by 0.5, using 6 feature combinations, namely, L, LQ, H, LQH, LQHP and LQHPT. In total, 70% of the occurrence points were used as a training model, and the remaining 30% were used as the test set for the verification of the model [30]. We set the number of background points in the sample to 10,000. At the same time, we also tried to increase the background points (e.g., 50,000 and 100,000), but the model did not perform better. We set the maximum number of iterations to 1500; this allows adequate time for the model to reach convergence. Furthermore, 1 × 10⁻⁵ was selected as the convergence threshold. The significance of each variable on the prediction of Maxent was tested by the Jackknife test [31]. To obtain thresholds, response curves for environmental variables were created.
The models were evaluated according to AUC.diff, OR10, delta.AICc and AUC. The AUC.diff is the difference between the training set AUC and the test set AUC values, together with the 10% training omission rate (OR10) the fit of the model to species distribution points was assessed. The Akaike information criterion (delta.AICc) was used to test model complexity; the combination of parameters whose value is 0 fits best [32,33]. The receiver operating characteristic (ROC) describes corresponding values for omission error and sensitivity. The area under the receiver operating characteristic curve (AUC) is a threshold-independent statistic, ranging from 0 to 1. The AUC threshold is divided as fail (0.5–0.6), poor (0.6–0.7), fair (0.7–0.8), good (0.8–0.9) or excellent (0.9–1.0) [34].
2.4. Species Potential Distribution and the Core Distributional Shifts
For display and further analysis, model prediction was imported into ArcGIS 10.2 and classified into four classes: not suitable habitat (0–10%), hardly suitable habitat (10–35%), moderately suitable habitat (35–68%) and highly suitable habitat (68–100%).
The SDM toolbox 2.0 package was used to quantify the effect of climate change on the geographic distribution of A. arguta [35]. This tool reduces the distribution of A. arguta to a single central point and generates a vector file that indicates the direction and magnitude of the change over time [35,36,37]. In the end, we examined the shifts in distribution by tracking how the centroid changed with different periods.
3. Results
3.1. Model Optimization Results and Contribution of Environmental Variables
After adjusting the model parameters (LQHPT), the model was better than the default parameters (LQHP) (Table 2). The AUC values of the training data and the test data were 0.950 and 0.958, respectively (Figure 4). The accuracy of prediction during the current and future periods was found to be “excellent”.
Table 2.
Evaluation metrics of MaxEnt model generated.
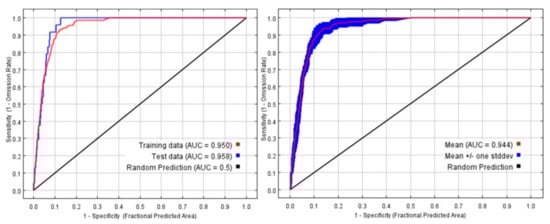
Figure 4.
Receiver operating characteristic (ROC) curve and AUC value for the current period.
The Maxent model’s internal Jackknife test can be used to obtain the contribution and importance of each environmental variable by iterative operations (Table 1). The greater the contribution, the greater the influence of specific variables on the prediction results. The environmental variables with a greater contribution are, in turn, the annual mean temperature (bio_1), precipitation of the warmest quarter (bio_18), elevation (ELE) and mean temperature of the warmest quarter (bio_10). The cumulative contributions of these factors reached values as high as 81.7% (Figure 5).
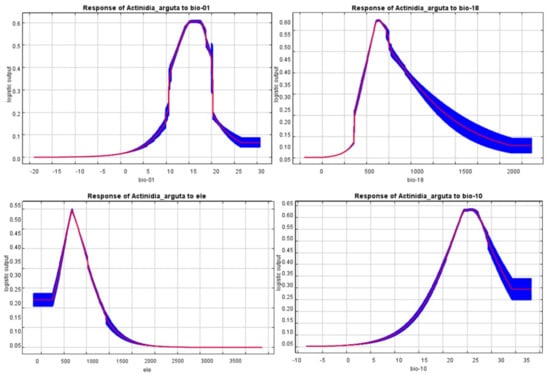
Figure 5.
Response curves for important environmental predictors in the species distribution model for A. arguta.
The fitness index of A. arguta increased and then decreased with the increase in annual mean temperature (bio_1); when the annual mean temperature (bio_1) was 12–18 °C, the fitness index was close to 0.5. The precipitation of the warmest quarter (bio_18) fitness index increased continuously from 320 to 630 mm, with the fitness index approaching 0.9 at 630 mm and then decreasing. The fitness index reached 0.5 between 580 and 840 m, and tended to 0 after the elevation (ELE) was greater than 2000 m. The mean temperature of the warmest quarter (bio_10) at 22–29 °C had a fitness index greater than 0.5.
3.2. Predicted Current Suitable Habitats
Under the present climatic conditions, the potential suitable area for A. arguta was mainly distributed 23° to 43° N and 100° to 125° E, distributed in a ringlike shape. The total area deemed suitable for A. arguta was 344.51 × 10⁴ km2, accounting for 37.98% of the total land area of China. Our results showed that the highly suitable habitat, moderately suitable habitat and hardly suitable habitat were 74.72 × 10⁴ km2, 106.47 × 10⁴ km2 and 1.6332 × 10⁶ km2, accounting for 21.69, 30.9 and 47.41% of the total suitable area, respectively (Figure 1).
From west to east, the highly suitable habitat concentrated in Sichuan Basin, Guizhou Plateau, most of Qinba Plateau, Southwest Shaanxi and Western Yunnan. Among them, the highly suitable habitat mainly concentrated in Shaanxi, Yunnan, Sichuan and Guizhou, with a total area of about 0.839 × 10⁶ km2, accounting for about 8.73% of China’s land area. The moderately suitable habitats were distributed in Liaoning, Shandong, Yunnan, Shanxi and Hubei provinces. Low suitable regional distribution was fragmented in Central and Southwestern China.
3.3. Predicted Future Suitable Habitats
From the predictions, it was found that the highly suitable habitat for A. arguta increased substantially under each climate scenario, with increases of up to about 50% under the SSP5_8.5 scenario. Hardly and moderately suitable habitats showed a decreasing trend. The highest reduction in the moderately suitable habitat was achieved under the 2041–2060, SSP2_4.5 scenario with 27.36% (Figure 6).
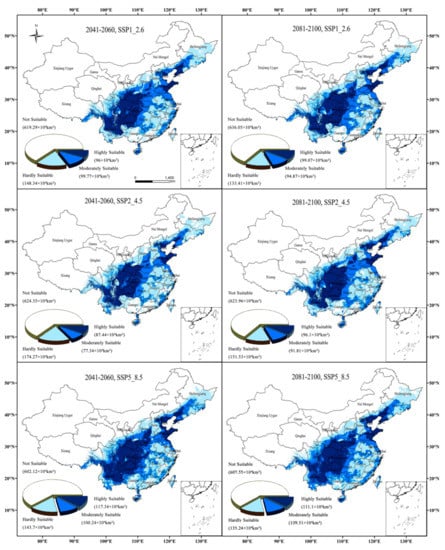
Figure 6.
Potentially suitable climatic distribution of A. arguta under different climate change scenarios in China.
Geographically, the eastern high latitudes are more suitable for A. arguta, which is closer to the center of the native range of the species. Shaanxi and the Yunnan-Guizhou plateau continued to be areas of highly suitable habitat in the future scenario period. However, the area of highly suitable habitat in Liaoning, Shandong and Eastern Hebei increased in the future scenario period. Similarly, the moderately suitable habitat of A. arguta showed an expansion trend to the east. The area of moderately suitable habitat increased in Central Jilin, Central Liaoning, Shandong, Henan, Eastern Jiangsu, Western Hunan, Fujian and Hainan. The area of hardly suitable habitat in Southern Heilongjiang, Jilin, Jiangxi, Central Hebei, Northern Shaanxi and Hainan increased. Especially under the 2041–2060, SSP5_8.5, the most significant increase, the lost area for A. arguta was predicted to be 25.85 × 10⁴ km2; the gained area was predicted to be 42.62 × 10⁴ km2; then during the 2081–2100, the loss and increase in area were 28.08 × 10⁴ km2 and 39.42 × 10⁴ km2, respectively. In contrast, under the SSP2_4.5, the smallest change in the increase and decrease in the area of A. arguta was observed. In 2041–2060, the increase and decrease in the habitat were 23.67 × 10⁴ km2 and 29.13 × 10⁴ km2, respectively. In 2081–2100, the trend of increase and decrease in the area was similar (Figure 7).
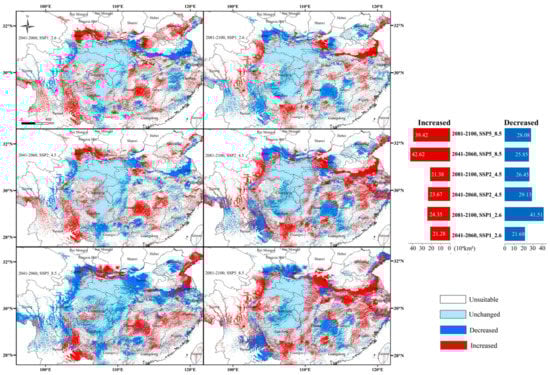
Figure 7.
Change in suitable habitat under different climate scenario for A. arguta.
3.4. The Core Distribution Shifts
The current centroid of A. arguta habitat is located in Nanyang City, Henan Province. For 2041–2060, under SSP1_2.6, the centroid moved northwest to Shangluo City, Shaanxi Province. For 2081–2100, it moved southwest to Guangyuan City, Sichuan Province. For 2041–2060, under SSP2_4.5, the centroid moved southwest of Guan’an, and for 2081–2100, to Hanzhong City, Shaanxi Province. Under the SSP5_8.5 scenario, the centroids were all located in Xiangxi Tujia Miao (Figure 8).
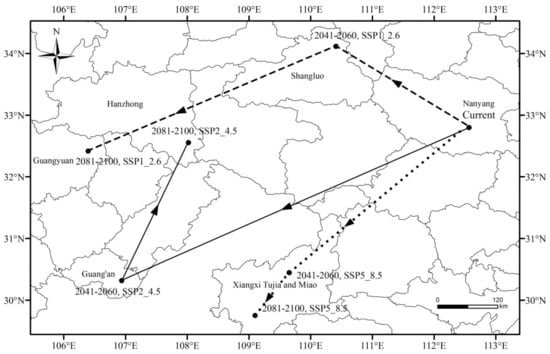
Figure 8.
The core distributional shifts of highly suitable habitat under different climate scenario for A. arguta.
4. Discussion
4.1. Environmental Variables Affecting the Potential Geographical Distribution
Under the current climatic condition, predictions found that the Yunnan-Guizhou Plateau is the region where A. arguta is more widely distributed, and Yunnan has a wide distribution of kiwifruit plants. A review of the statistical yearbooks of the relevant provinces revealed that Yunnan is the province with the highest number of known occurrences of A. arguta. A. arguta resources of Sichuan are concentrated in the ring of low and middle mountainous areas surrounding the Sichuan Basin, which is consistent with existing records [38]. In addition, the distribution of this species had not been recorded in Qinghai in the previous literature, but in recent years, the distribution of this species was found in Xining City, Qinghai, by comparison with local government websites. In summary, the modeled distribution of A. arguta showed a certain degree of reliability. The areas of high suitability indicated by the predictions have a humid subtropical monsoon climate with excellent hydrothermal conditions, abundant rainfall and year-round warmth and humidity, which is suitable for the growth of A. arguta.
Wild varieties of A. arguta were mostly found on shady slopes with fertile soil at altitudes of 500–700 m. Although the extreme temperatures in the natural distribution area reached 40–44 °C, A. arguta was mostly found in mountain woods, so it is not tolerant of high temperatures, and hot weather often causes sunburn damage, which can have serious effects on fruit development and yield [39]. Continuous rainfall also led to a reduction in kiwifruit yield, which affected pollination and fruit set [40]. Climate change affects the distribution of species [41], and thus leads to an increase or decrease in the number of species [42,43]. A. arguta was found to have a humid subtropical climate in the highly suitable habitat under different scenarios. It is worth mentioning that altitude also had a greater influence on A. arguta; 500–700 m was most suitable. Temperature conditions vary greatly—prone to frost, resulting in ulcers, etc.—which is not suitable for building an orchard. At the same time, A. arguta is not wind-resistant, and the fruit is very susceptible to dropping in windy weather. Therefore, if planting areas are established, windbreaks or windbreak trees are needed to reduce the impact of high winds on fruit production.
4.2. Effects of Future Climate Change on the Geographyical
Significant increases in the area of highly suitable habitat under different future climate scenarios were accompanied by decreases in the area of medium and low habitat. This suggests that climate change has a positive impact on the potential distribution of A. arguta under different emission scenarios. Interestingly, the area of A. arguta’s highly suitable habitat increased significantly in the SSP5 scenario. SSP5 is a traditional fossil fuel-based development pathway, which is economically rapid and produced by burning large amounts of fossil fuels. It contributes little to the improvement and mitigation of environmental problems and generates large amounts of greenhouse gas emissions. Warming affects the spatial and temporal distribution of heat and precipitation. Temperatures showed a yearly increasing trend, accompanied by an increase in precipitation in the north, but a slight decrease in precipitation in Southern China [44,45]. Changes in temperature and precipitation affect the boundaries and trends of plant growth [46]. Under the future climate scenario, the centroid moved to the southwest.
4.3. Limitations of the Modeling Approach and Future Research Directions
The importance of climatic factors in the study of crop suitability distribution is unquestionable. However, in addition, local economic policies, water and fertilizer conditions and agrotype are all important influences [47]. The potential habitat of A. arguta is mostly mountain hills, with the formation of complex and variable local microclimates, which will have an impact on the prediction results [48]. In future studies, a more comprehensive set of impact factors should be considered. With future climatic and environmental changes, although the geographical distribution of the potential habitability of A. arguta tends to migrate to high altitude areas in the southwest, its adaptability to changes in environmental factors may be severely overestimated in the future due to the rate of species turnover and interspecies competition in the community. The pressure for resource protection and management will be even greater in the future.
4.4. A. arguta Industry’s Sustainable Development Prospects
A. arguta has been cultivated in small quantities in Italy, New Zealand and other countries and in the northeast of China [20]. A. arguta is currently in the promotion stage of new products, and most of the related research is focused on physiological and biochemical reactions and analysis of active substances, and it lacks a certain degree of public awareness in marketing. However, local governments at all levels actively formulate their industrial development plans and follow a sustainable development path to maximize the benefits of cultivation. At the government level, the National Development and Reform Commission of the People’s Republic of China attaches great importance to the development of the A. arguta industry, and the Wuhan Institute of Botany of the Chinese Academy of Sciences has taken the lead in setting up a special research group on A. arguta to adapt to local conditions, strengthen the research and development of new varieties and promote sustainable development while highlighting local characteristics. In terms of market demand, the Chinese consumer market has great potential, and the climatic suitability of A. arguta is much higher than the existing planting area in China. Increased efforts to enhance deep processing capacity increase the added value of the product and expand the product sales market. Relocating protection, artificially planting excellent wild varieties and adjusting planting structure according to the environment suitable for their growth extend the market supply period and improve market competitiveness. In order to achieve the long-term, stable economic growth of the A. arguta industry and to meet the demand for its products, the production process should be combined with resource conservation and environmental improvement. To improve the sustainability of the agricultural environment, on the one hand, we should increase the environmental protection of the garden and the surrounding environment, improving the soil environment, rationalizing irrigation and improving the efficiency of water resource utilization. On the other hand, the level of environmental pollution should be controlled. To raise awareness of environmental protection among fruit farmers and encourage them not to plant blindly for short-term yield and economic gain, the amount of applied agricultural fertilizers should be planned and controlled rationally.
5. Conclusions
Within this work, we combined Maxent with ArcGIS to study the potential geographic distribution of A. arguta under climate change. Our results indicated that the area of the highly suitable habitat will increase significantly in the future, and future climate change will have a positive effect on A. arguta. The annual mean temperature (bio_1) and precipitation of the warmest quarter (bio_18) were the most important environmental variables influencing the distribution of this species. In the coming period, the potential suitability of the northeast region will gradually increase, and the potential distribution of A. arguta will move closer to the center of the native range. The projected spatial and temporal pattern of range shifts for A. arguta will be a useful reference in proposed reasonable measures for cultivation distribution.
Supplementary Materials
The following are available online at https://www.mdpi.com/2071-1050/13/6/3526/s1, Table S1: The 33 environmental variables selected for the study.
Author Contributions
Y.M.: formal analysis (equal); methodology (equal); writing—original draft (equal). X.L.: formal analysis (equal); writing—review and editing (equal). K.L.: data curation (equal); investigation (equal); resources (equal). C.W.: data curation (equal); investigation (equal); software (equal). J.Z.: conceptualization (lead); funding acquisition (equal); formal analysis (equal); project administration (lead); supervision (lead). A.G.: resources (equal); software (equal); visualization (equal). All authors have read and agreed to the published version of the manuscript.
Funding
This research was funded by National Key Research and Development Program of China (2019YFD1002201), the National Natural Science Foundation of China (41877520), the Science and Technology Development Planning of Jilin Province (20190303018SF), Key Research and Projects Development Planning of Jilin Province (20200403065SF) and the Science and Technology Planning of Changchun (19SS007).
Institutional Review Board Statement
Not applicable.
Informed Consent Statement
Not applicable.
Data Availability Statement
The data presented in this study are available on request from the corresponding author.
Conflicts of Interest
The authors declare no conflict of interest.
References
- Han, L.; Zhang, Q.; Ma, P.; Jia, J.; Wang, J. The spatial distribution characteristics of a comprehensive drought risk index in southwestern China and underlying causes. Theor. Appl. Climatol. 2016, 124, 517–528. [Google Scholar] [CrossRef]
- Birch, E.L. A Review of “Climate Change 2014: Impacts, Adaptation, and Vulnerability” and “Climate Change 2014: Mitiga-tion of Climate Change”. J. Am. Plan. Assoc. 2014, 80, 184–185. [Google Scholar] [CrossRef]
- Higgins, S.I.; Richardson, D.M. Predicting plant migration rates in a changing world: The role of long-distance dispersal. Am. Nat. 1999, 153, 464–475. [Google Scholar] [CrossRef] [PubMed]
- Zhao, J.; Yang, X.; Liu, Z.; Cheng, D.; Wang, W.; Chen, F. The possible effect of global climate changes on cropping systems boundary in China Ⅱ. The characteristics of climatic variables and the possible effect on northern limits of cropping systems in south China. Sci. Agric. Sin. 2010, 43, 1860–1867. (In Chinese) [Google Scholar] [CrossRef]
- Zhu, Y.; Wei, W.; Li, H.; Wang, B.; Yang, X.; Liu, Y. Modelling the potential distribution and shifts of three varieties of Stipa tianschanica in the eastern Eurasian Steppe under multiple climate change scenarios. Glob. Ecol. Conserv. 2018, 16, e00501. [Google Scholar] [CrossRef]
- Li, G.; Du, S.; Wen, Z. Mapping the climatic suitable habitat of oriental arborvitae (Platycladus orientalis) for introduction and cultivation at a global scale. Sci. Rep. 2016, 6, 30009. [Google Scholar] [CrossRef] [PubMed]
- Zhang, K.; Yao, L.; Meng, J.; Tao, J. Maxent modeling for predicting the potential geographical distribution of two peony species under climate change. Sci. Total Environ. 2018, 634, 1326–1334. [Google Scholar] [CrossRef]
- Wei, B.; Wang, R.; Hou, K.; Wang, X.; Wu, W. Predicting the current and future cultivation regions of Carthamus tinctorius L. using MaxEnt model under climate change in China. Glob. Ecol. Conserv. 2018, 16, e00477. [Google Scholar] [CrossRef]
- Liu, D.; Wang, R.; Gordon, D.; Sun, X.; Chen, L.; Wang, Y. Predicting Plant Invasions Following China’s Water Diversion Project. Environ. Sci. Technol. 2017, 51, 1450–1457. [Google Scholar] [CrossRef]
- Wang, C.; Hawthorne, D.; Qin, Y.; Pan, X.; Li, Z.; Zhu, S. Impact of climate and host availability on future distribution of Colorado potato beetle. Sci. Rep. 2017, 7, 4489. [Google Scholar] [CrossRef]
- Wu, H.; Ma, T.; Kang, M.; Ai, F.; Zhang, J.; Dong, G. A high-quality Actinidia chinensis (kiwifruit) genome. Hortic. Res. 2019, 6, 117. [Google Scholar] [CrossRef]
- Almeidaa, D.; Pintoa, D.; Santosa, J. Hardy kiwifruit leaves (Actinidia arguta): An extraordinary source of value-added compounds for food industry. Food Chem. 2018, 259, 113–121. [Google Scholar] [CrossRef]
- Wang, J.; Xu, L.; Wang, E.; Wang, J.; Xu, L. Editorial Board of Flora of China. In Chinese Academy of Sciences; Science Press: Beijing, China, 1995. [Google Scholar]
- Sanz, V.; L’opez-Hortas, L.; Torres, M.D.; Domínguez, H. Trends in kiwifruit and byproducts valorization. Trends Food Sci. Technol. 2021, 107, 401–414. [Google Scholar] [CrossRef]
- Kim, H.-Y.; Hwang, K.W.; Park, S.-Y. Extracts of Actinidia arguta stems inhibited LPS-induced inflammatory responses through nuclear factor-κB pathway in Raw 264.7 cells. Nutr. Res. 2014, 34, 1008–1016. [Google Scholar] [CrossRef] [PubMed]
- Kim, H.; Song, M.J. Analysis and recordings of orally transmitted knowledge about medicinal plants in the southern moun-tainous region of Korea. J. Ethnopharmacol. 2011, 134, 676–696. [Google Scholar] [CrossRef]
- Kwak, C.S.; Lee, J.H. In vitro antioxidant and anti-inflammatory effects of ethanol extracts from sprout of evening primrose (Oenothera laciniata) and gooseberry (Actinidia arguta). J. Korean Soc. Food Sci. Nutr. 2014, 43, 207–215. [Google Scholar] [CrossRef]
- Liu, Y.; Qi, Y.; Chen, X. Phenolic compounds and antioxidant activity in red- and in green-fleshed Kiwifruits. Food Res. Int. 2019, 116, 291–301. [Google Scholar] [CrossRef]
- Paturia, G.; Suzanne, M.H.; Shanthi, G.P. Kiwifruit drives human microbiota-derived DNA to stimulate IL-7 secretion in intestinal epithelial cells. J. Funct. Foods 2020, 67, 103882. [Google Scholar] [CrossRef]
- Zhu, H. Kiwifruit; China Forestry Publishing House: Beijing, China, 2009. [Google Scholar]
- Huang, G.H. Current Situation and Problems of Development of Actinidia arguta Industry. North. Fruits 2020, 1, 41–43, (In Chinese with English abstract). [Google Scholar] [CrossRef]
- Zhang, J.; Mo, Z.; Huang, S.; Guo, Z. Development of Kiwifruit industry in the world and analysis of trade and international competitiveness in China entering 21st century. Chin. Agric. Sci. Bull. 2014, 30, 48–55. (In Chinese) [Google Scholar]
- Latocha, P.; Lata, B.; Stasiak, A. Phenolics, ascorbate and the antioxidant potential of kiwiberry vs. common kiwifruit: The effect of cultivar and tissue type. J. Funct. Foods 2015, 19, 155–163. [Google Scholar] [CrossRef]
- Dan, L.W.; Richard, E.G.; Michael, T. ENMTools: A toolbox for comparative studies of environmental niche models. Ecography 2010, 33, 607–611. [Google Scholar] [CrossRef]
- Hijmans, R.J.; Cameron, S.E.; Parra, J.L.; Jones, P.G.; Jarvis, A. Very high resolution interpolated climate surfaces for global land areas. Int. J. Climatol. 2005, 25, 1965–1978. [Google Scholar] [CrossRef]
- Graham, M.H. Confronting multicollinearity in ecological multiple regression. Ecology 2003, 84, 2809–2815. [Google Scholar] [CrossRef]
- Van Vuuren, D.P.; Riahi, K. A proposal for a snew scenario framework to support research and assessment in different climate research communities. Glob. Environ. Chang. 2012, 22, 21–35. [Google Scholar] [CrossRef]
- Riahi, K. The Shared socioeconomic pathways and their energy, land use, and greenhouse gas emissions implications: An overview. Glob. Environ. Chang. 2017, 42, 153–168. [Google Scholar] [CrossRef]
- Phillips, S.J.; Anderson, R.P.; Schapire, R.E. Maximum entropy modeling of species geographic distributions. Ecol. Model. 2006, 190, 231–259. [Google Scholar] [CrossRef]
- Wasowicz, P.; Pálsson, S.; Pasierbiński, A.; Wierzgoń, M.; Ólafsson, E.; Heiðmarsson, S.; Przedpelska-Wasowicz, E.M. Alien or native? Examining a case of Melampyrum pratense in Iceland. Polar Biol. 2018, 41, 1725–1735. [Google Scholar] [CrossRef]
- Merow, C.; Smith, M.J.; Silander, J.A. A practical guide to MaxEnt for modeling species’ distributions: What it does, and why inputs and settings matter. Ecography 2013, 36, 1058–1069. [Google Scholar] [CrossRef]
- Elith, J.; Phillips, S.J.; Hastie, T.; Dudík, M.; Chee, Y.N.; Yates, C.J. A statistical explanation of MaxEnt for ecologists. Divers. Distrib. 2011, 17, 43–57. [Google Scholar] [CrossRef]
- Muscarella, R.; Galante, P.J.; Guardia-Soley, M.; Boria, R.A.; Kass, J.M.; Uriarte, M.; Anderson, R.P. ENMeval: An R package for conducting spatially independent evaluations and estimating optimal model complexity for Maxent ecological niche models. Methods Ecol. Evol. 2014, 5, 1198–1205. [Google Scholar] [CrossRef]
- Swets, J.A. Measuring the Accuracy of Diagnostic Systems. Science 1988, 240, 1285–1293. [Google Scholar] [CrossRef]
- Brown, J.L. SDMtoolbox: A python-based GIS toolkit for landscape genetic, biogeographic and species distribution model analyses. Methods Ecol. Evol. 2014, 5, 694–700. [Google Scholar] [CrossRef]
- Brown, J.L.; Bennett, J.R.; French, C.M. SDMtoolbox 2.0: The next generation Python-based GIS toolkit for landscape genetic, biogeographic and species distribution model analyses. PeerJ 2017, 5, e4095. [Google Scholar] [CrossRef]
- He, Q.; Zhou, G.; Lü, X.; Zhou, M. Climatic suitability and spatial distribution for summer maize cultivation in China at 1.5 and 2.0 °C global warming. Sci. Bull. 2019, 64, 690–697. [Google Scholar] [CrossRef]
- Qu, Z.; Zhou, G. Regionalization of Climatic Suitability for Major Kiwifruit Cultivars in China. Chin. J. Agrometeorol. 2017, 38, 257–266. (In Chinese) [Google Scholar] [CrossRef]
- Zhong, M.; Zhang, W.; Huang, C.; Tao, J.; Qu, X.; Han, W.; Xu, X. Effects of High Temperature Stress on Related Heat-resistance Index in Kiwifruit Seedlings. Hubei Agric. Sci. 2018, 57, 96–99. (In Chinese) [Google Scholar] [CrossRef]
- Liu, X. Questions and Answers on High Quality Cultivation of Kiwifruit; China Agricultural Publishing House: Beijing, China, 2009. [Google Scholar]
- Peterson, A.T. Predicting the geography of species invasions via ecological niche modeling. Q. Rev. Biol. 2003, 78, 419–433. [Google Scholar] [CrossRef] [PubMed]
- Lambers, J.H.R. Extinction risks from climate change. How will climate change affect global biodiversity? Science 2015, 348, 501–502. [Google Scholar] [CrossRef] [PubMed]
- Román-Palacios, C.; Wiens, J.J. Recent responses to climate change reveal the drivers of species extinction and survival. Proc. Natl. Acad. Sci. USA 2010, 117, 4211–4217. [Google Scholar] [CrossRef]
- Dai, S.; Li, H.; Liu, H.; Liu, E. The spatio-temporal change characteristics of agriculture climate resources in southern China under the background of global warming. Chin. J. Agric. Resour. Reg. Plan. 2014, 35, 52–60, (In Chinese with English abstract). [Google Scholar] [CrossRef]
- Wang, X.; Jiang, D.; Lang, X. Temperature and Precipitation Changes over China under a 1.5℃ Global Warming Scenario Based on CMIP5 Models. Chin. J. Atmos. Sci. 2019, 43, 1158–1170. (In Chinese) [Google Scholar] [CrossRef]
- Zhong, L.; Ma, Y.; Salama, M.S.; Su, Z. Assessment of vegetation dynamics and their response to variations in precipitation and temperature in the Tibetan Plateau. Clim. Chang. 2010, 103, 519–535. [Google Scholar] [CrossRef]
- Ren, D.; Qi, Y.B.; Yu, W.Y.; He, Y.; Deng, X.; Fu, L. Research on the degree of use and the Influencing factors of farmers’ machinery-based on the survey of 205 huseholds of kwifruit frmers in Sichuan Province. J. Sichuan. Agric. Univ. 2016, 34, 528–534. [Google Scholar] [CrossRef]
- Wu, J.; Zhou, Q.; Li, Y. Strategies of Adaptation to Climate Change for Biodiversity in China. Chin. Popul. Resour. Environ. 2011, 21, 435–439. (In Chinese) [Google Scholar]


Publisher’s Note: MDPI stays neutral with regard to jurisdictional claims in published maps and institutional affiliations. |
© 2021 by the authors. Licensee MDPI, Basel, Switzerland. This article is an open access article distributed under the terms and conditions of the Creative Commons Attribution (CC BY) license (http://creativecommons.org/licenses/by/4.0/).