
Technical Economic Analysis of Photovoltaic-Powered Electric Vehicle Charging Stations under Different Solar Irradiation Conditions in Vietnam


Abstract
:1. Introduction
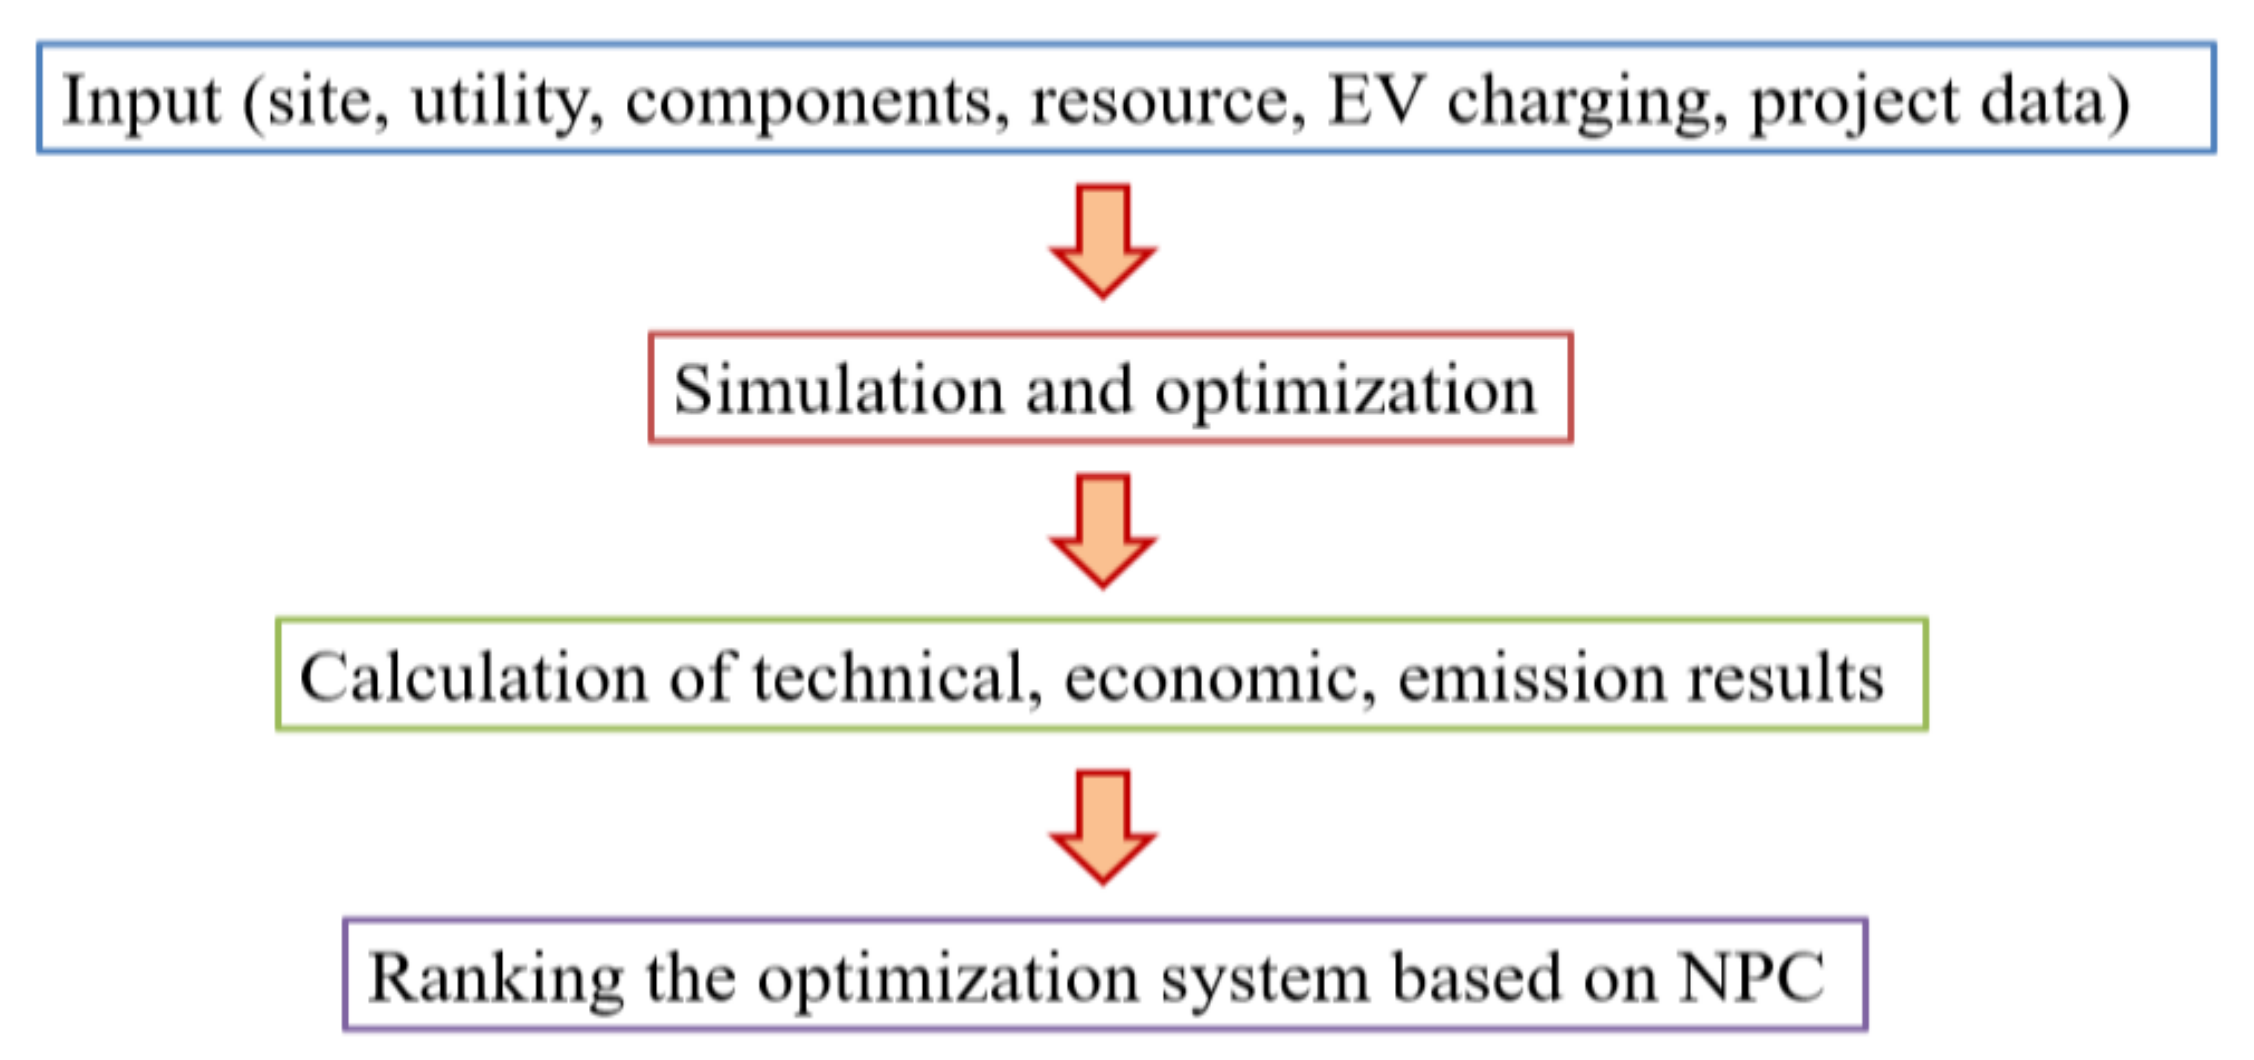
2. Materials and Methods
3. Selected Site Description
3.1. Hanoi City
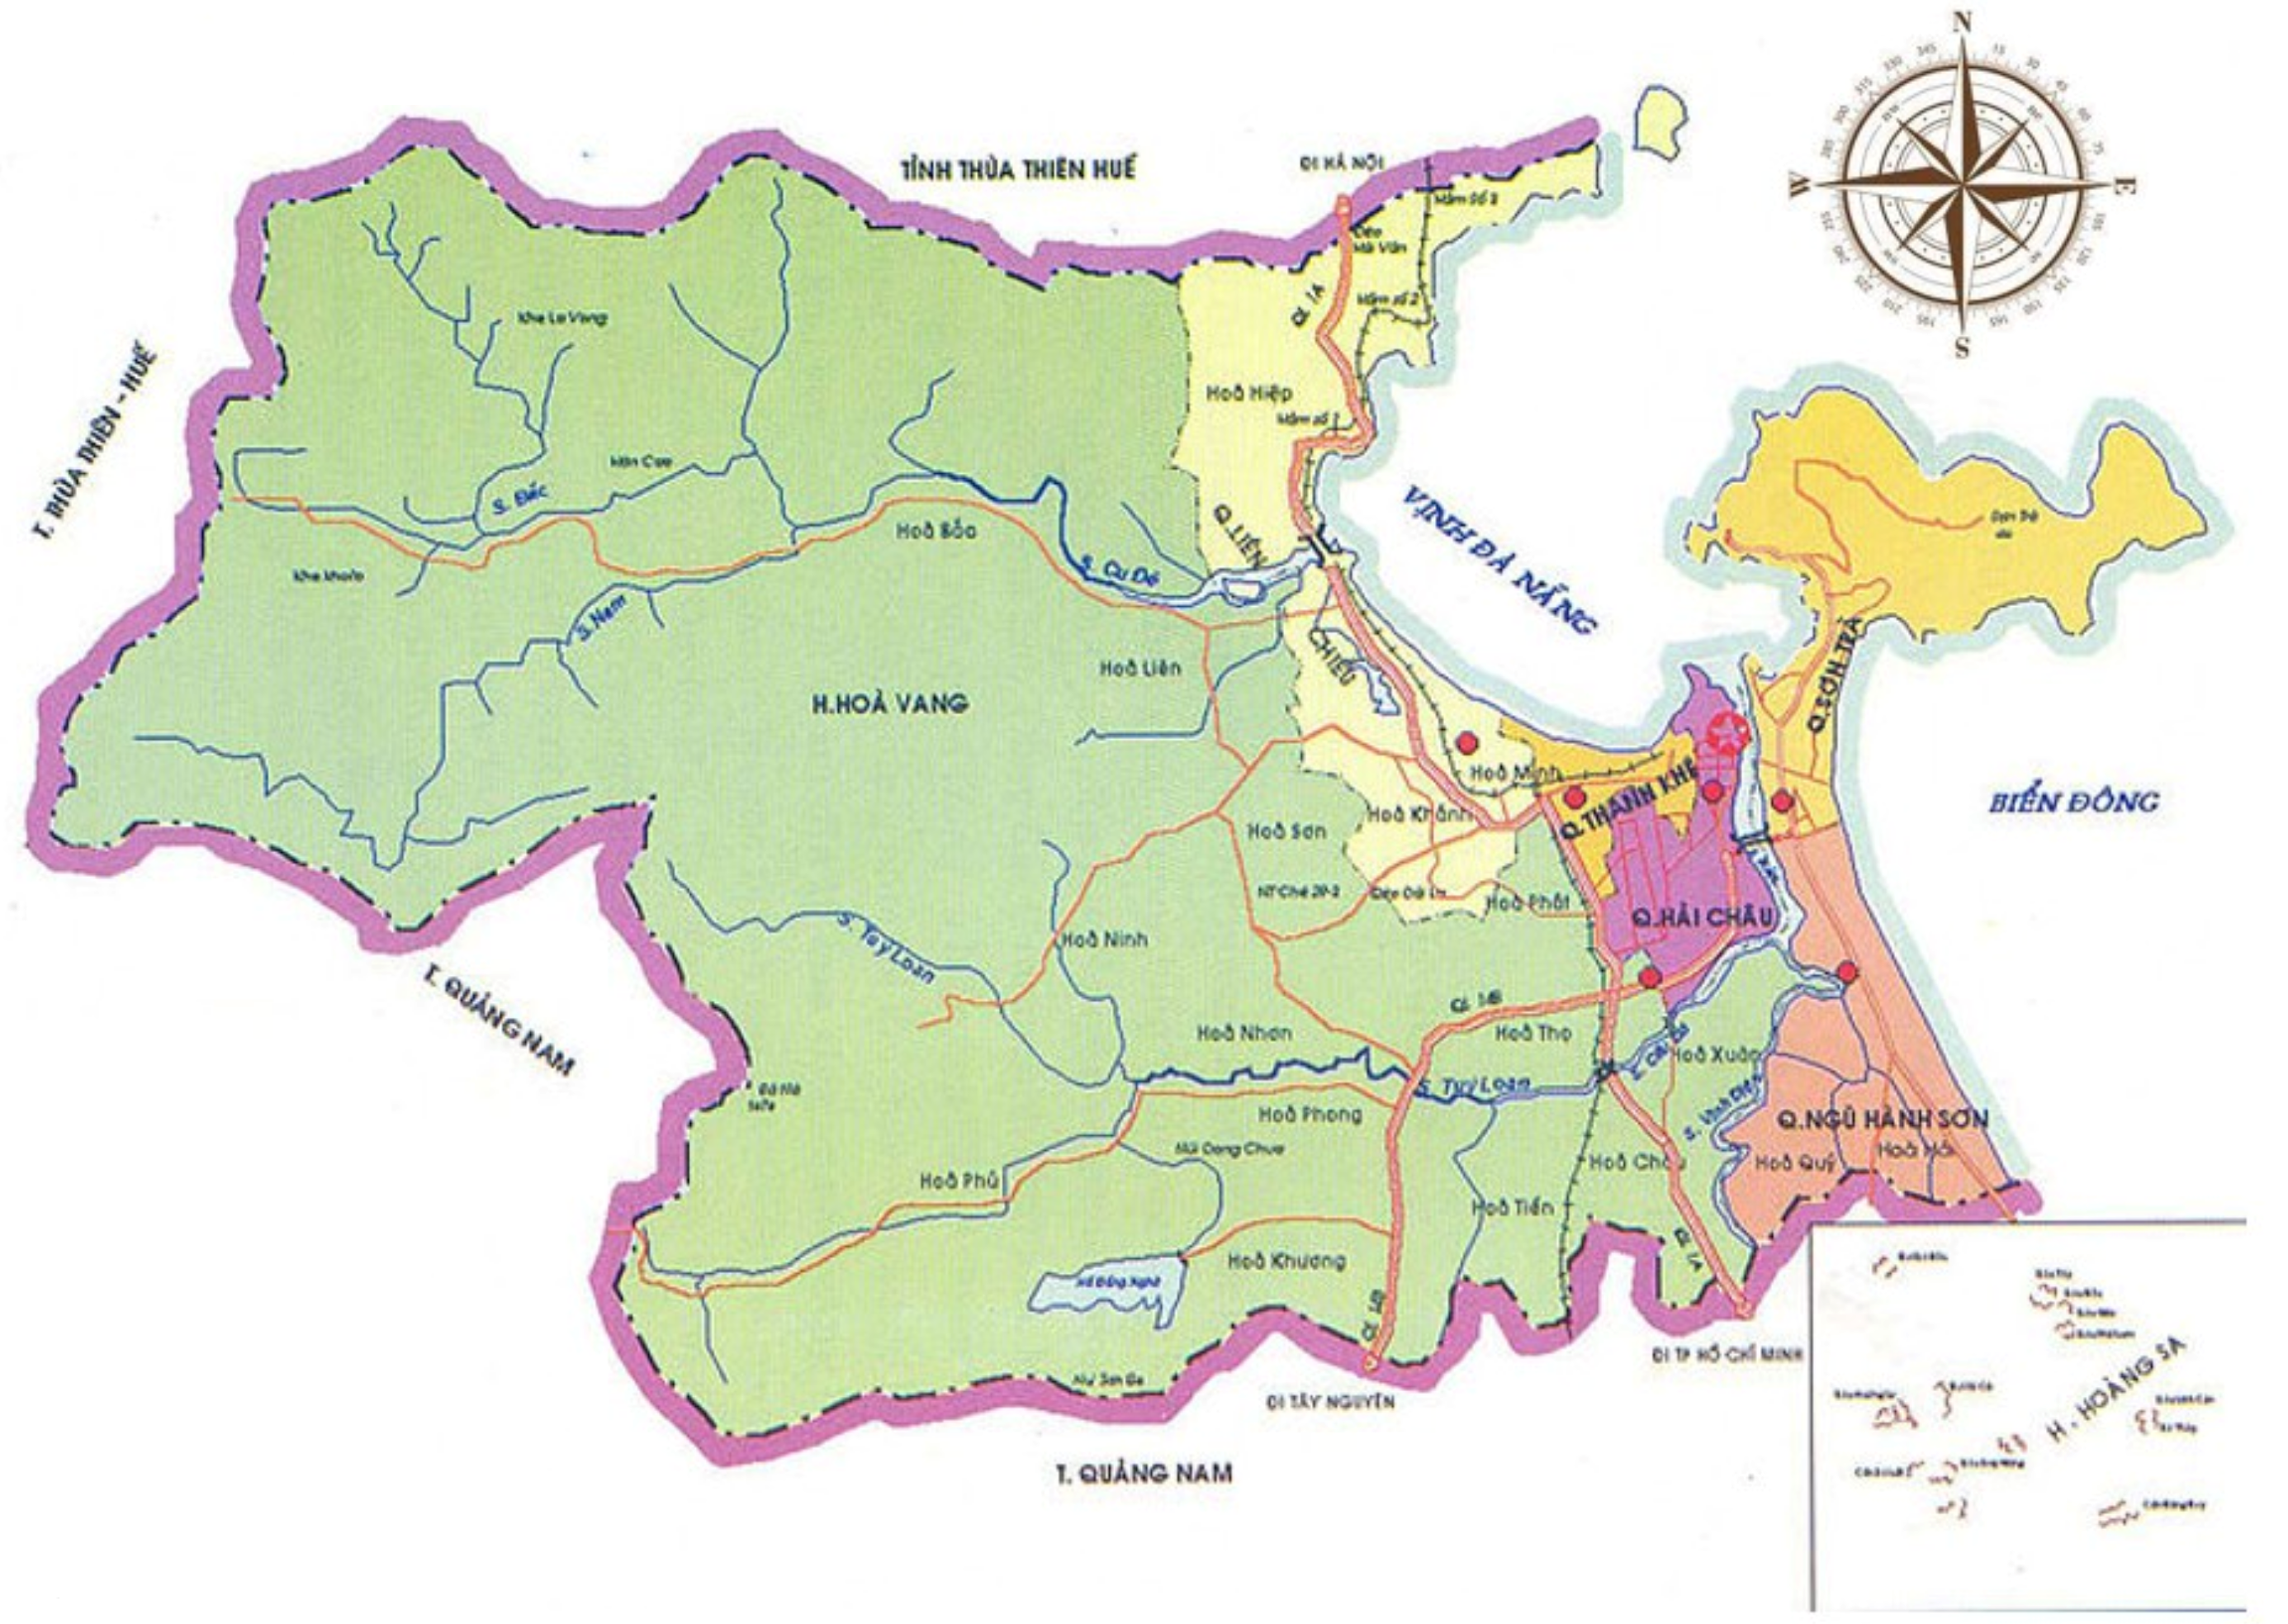
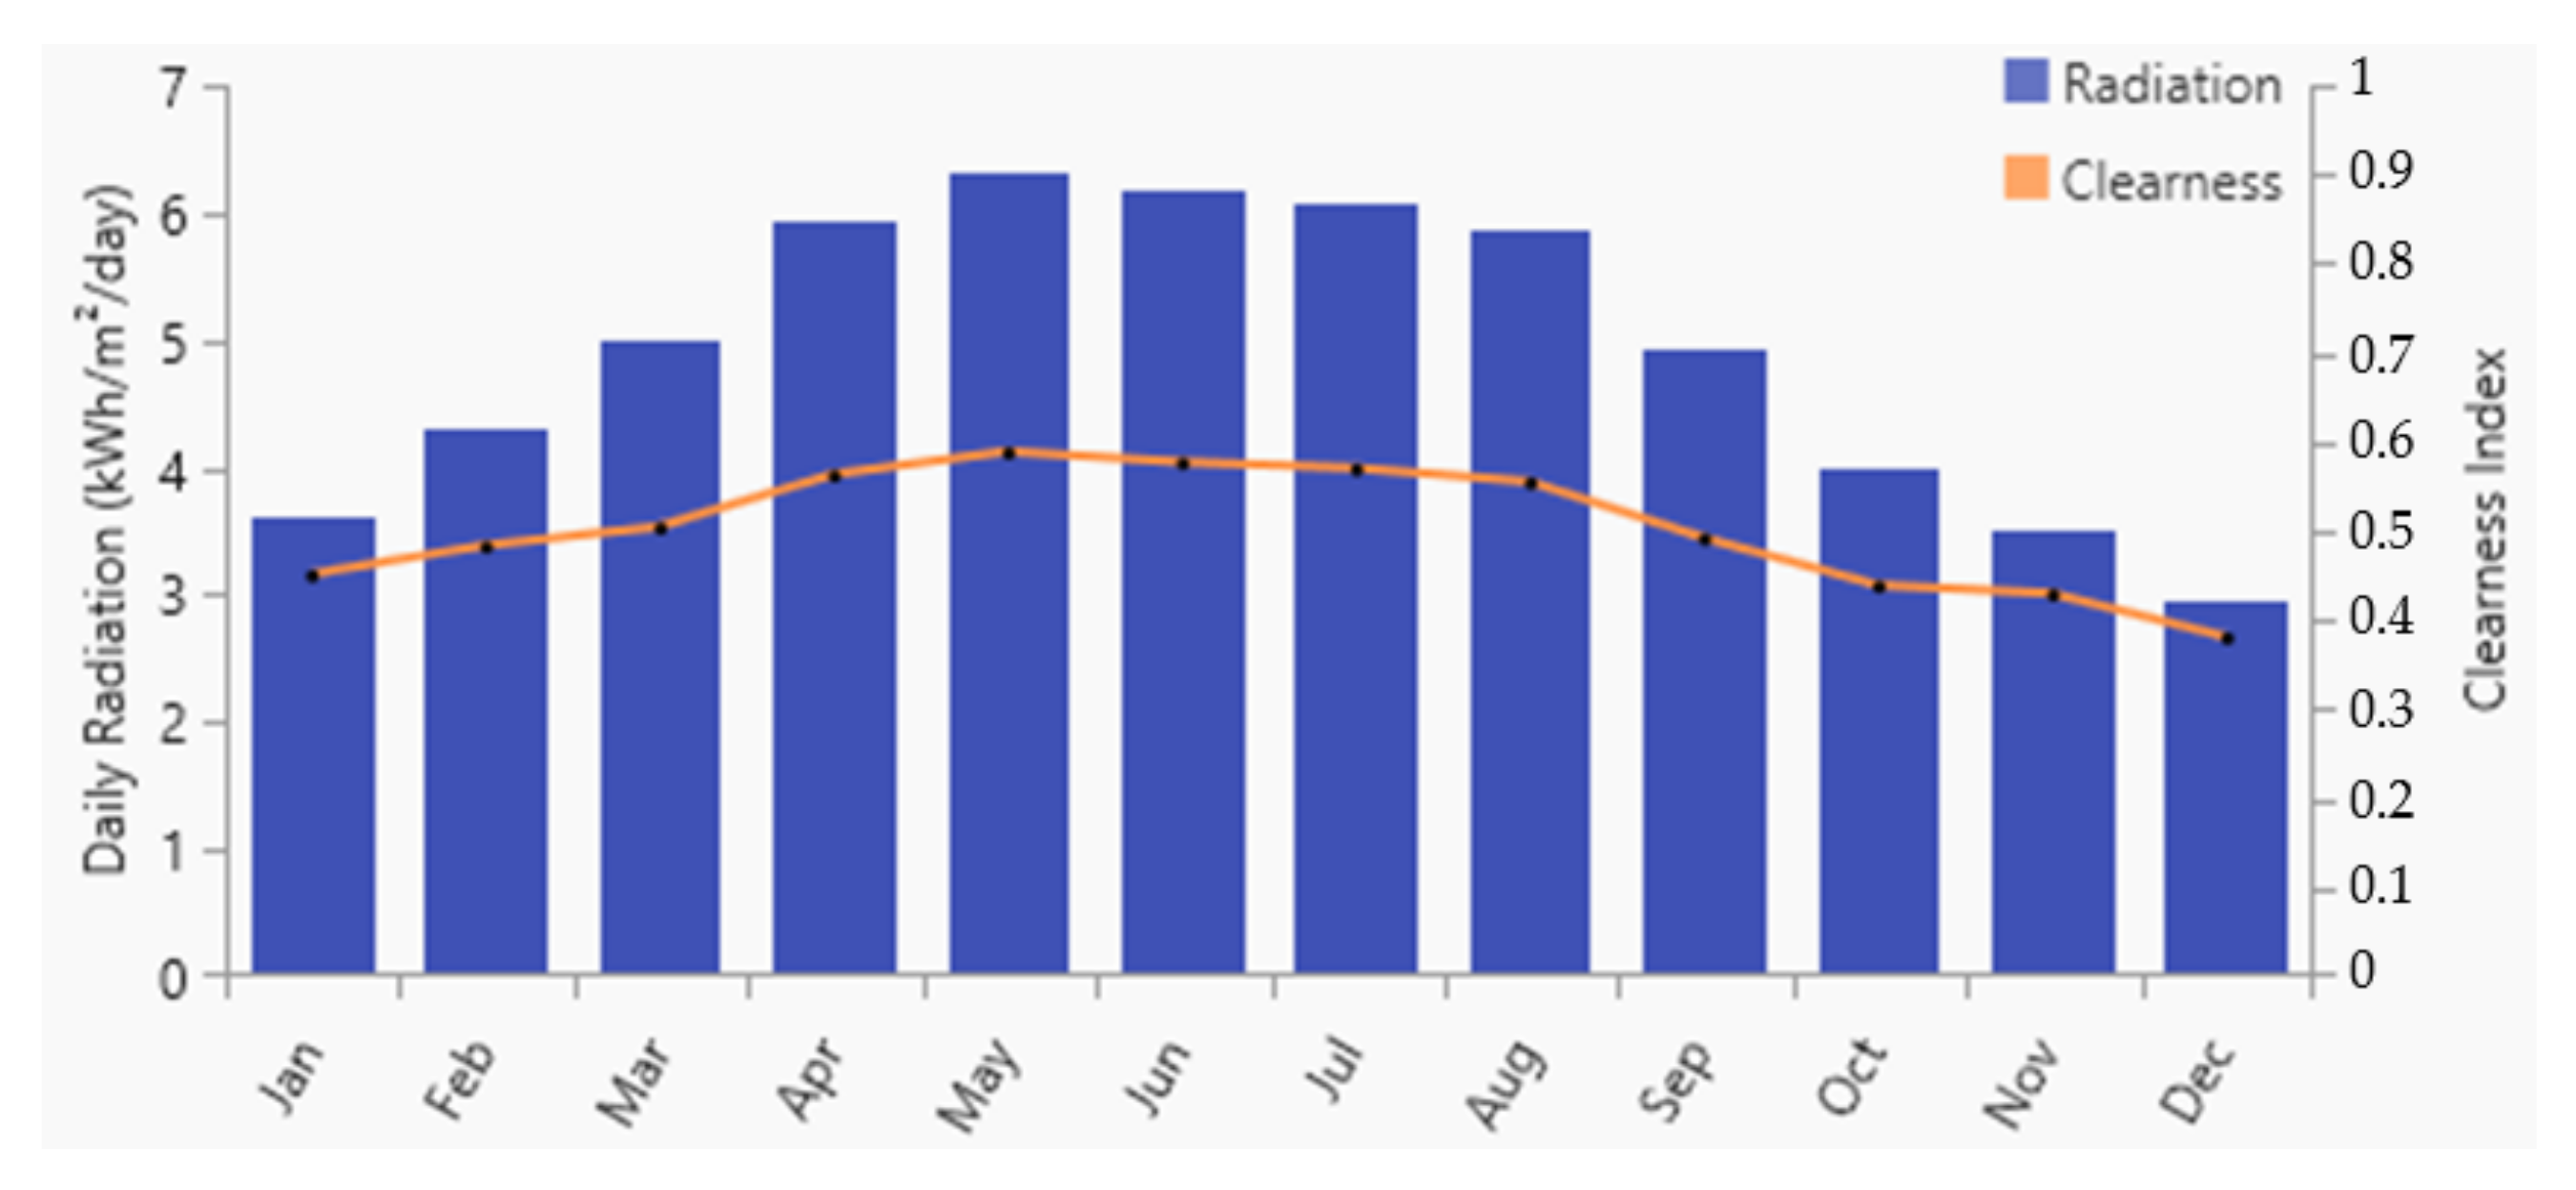
3.2. Da Nang City
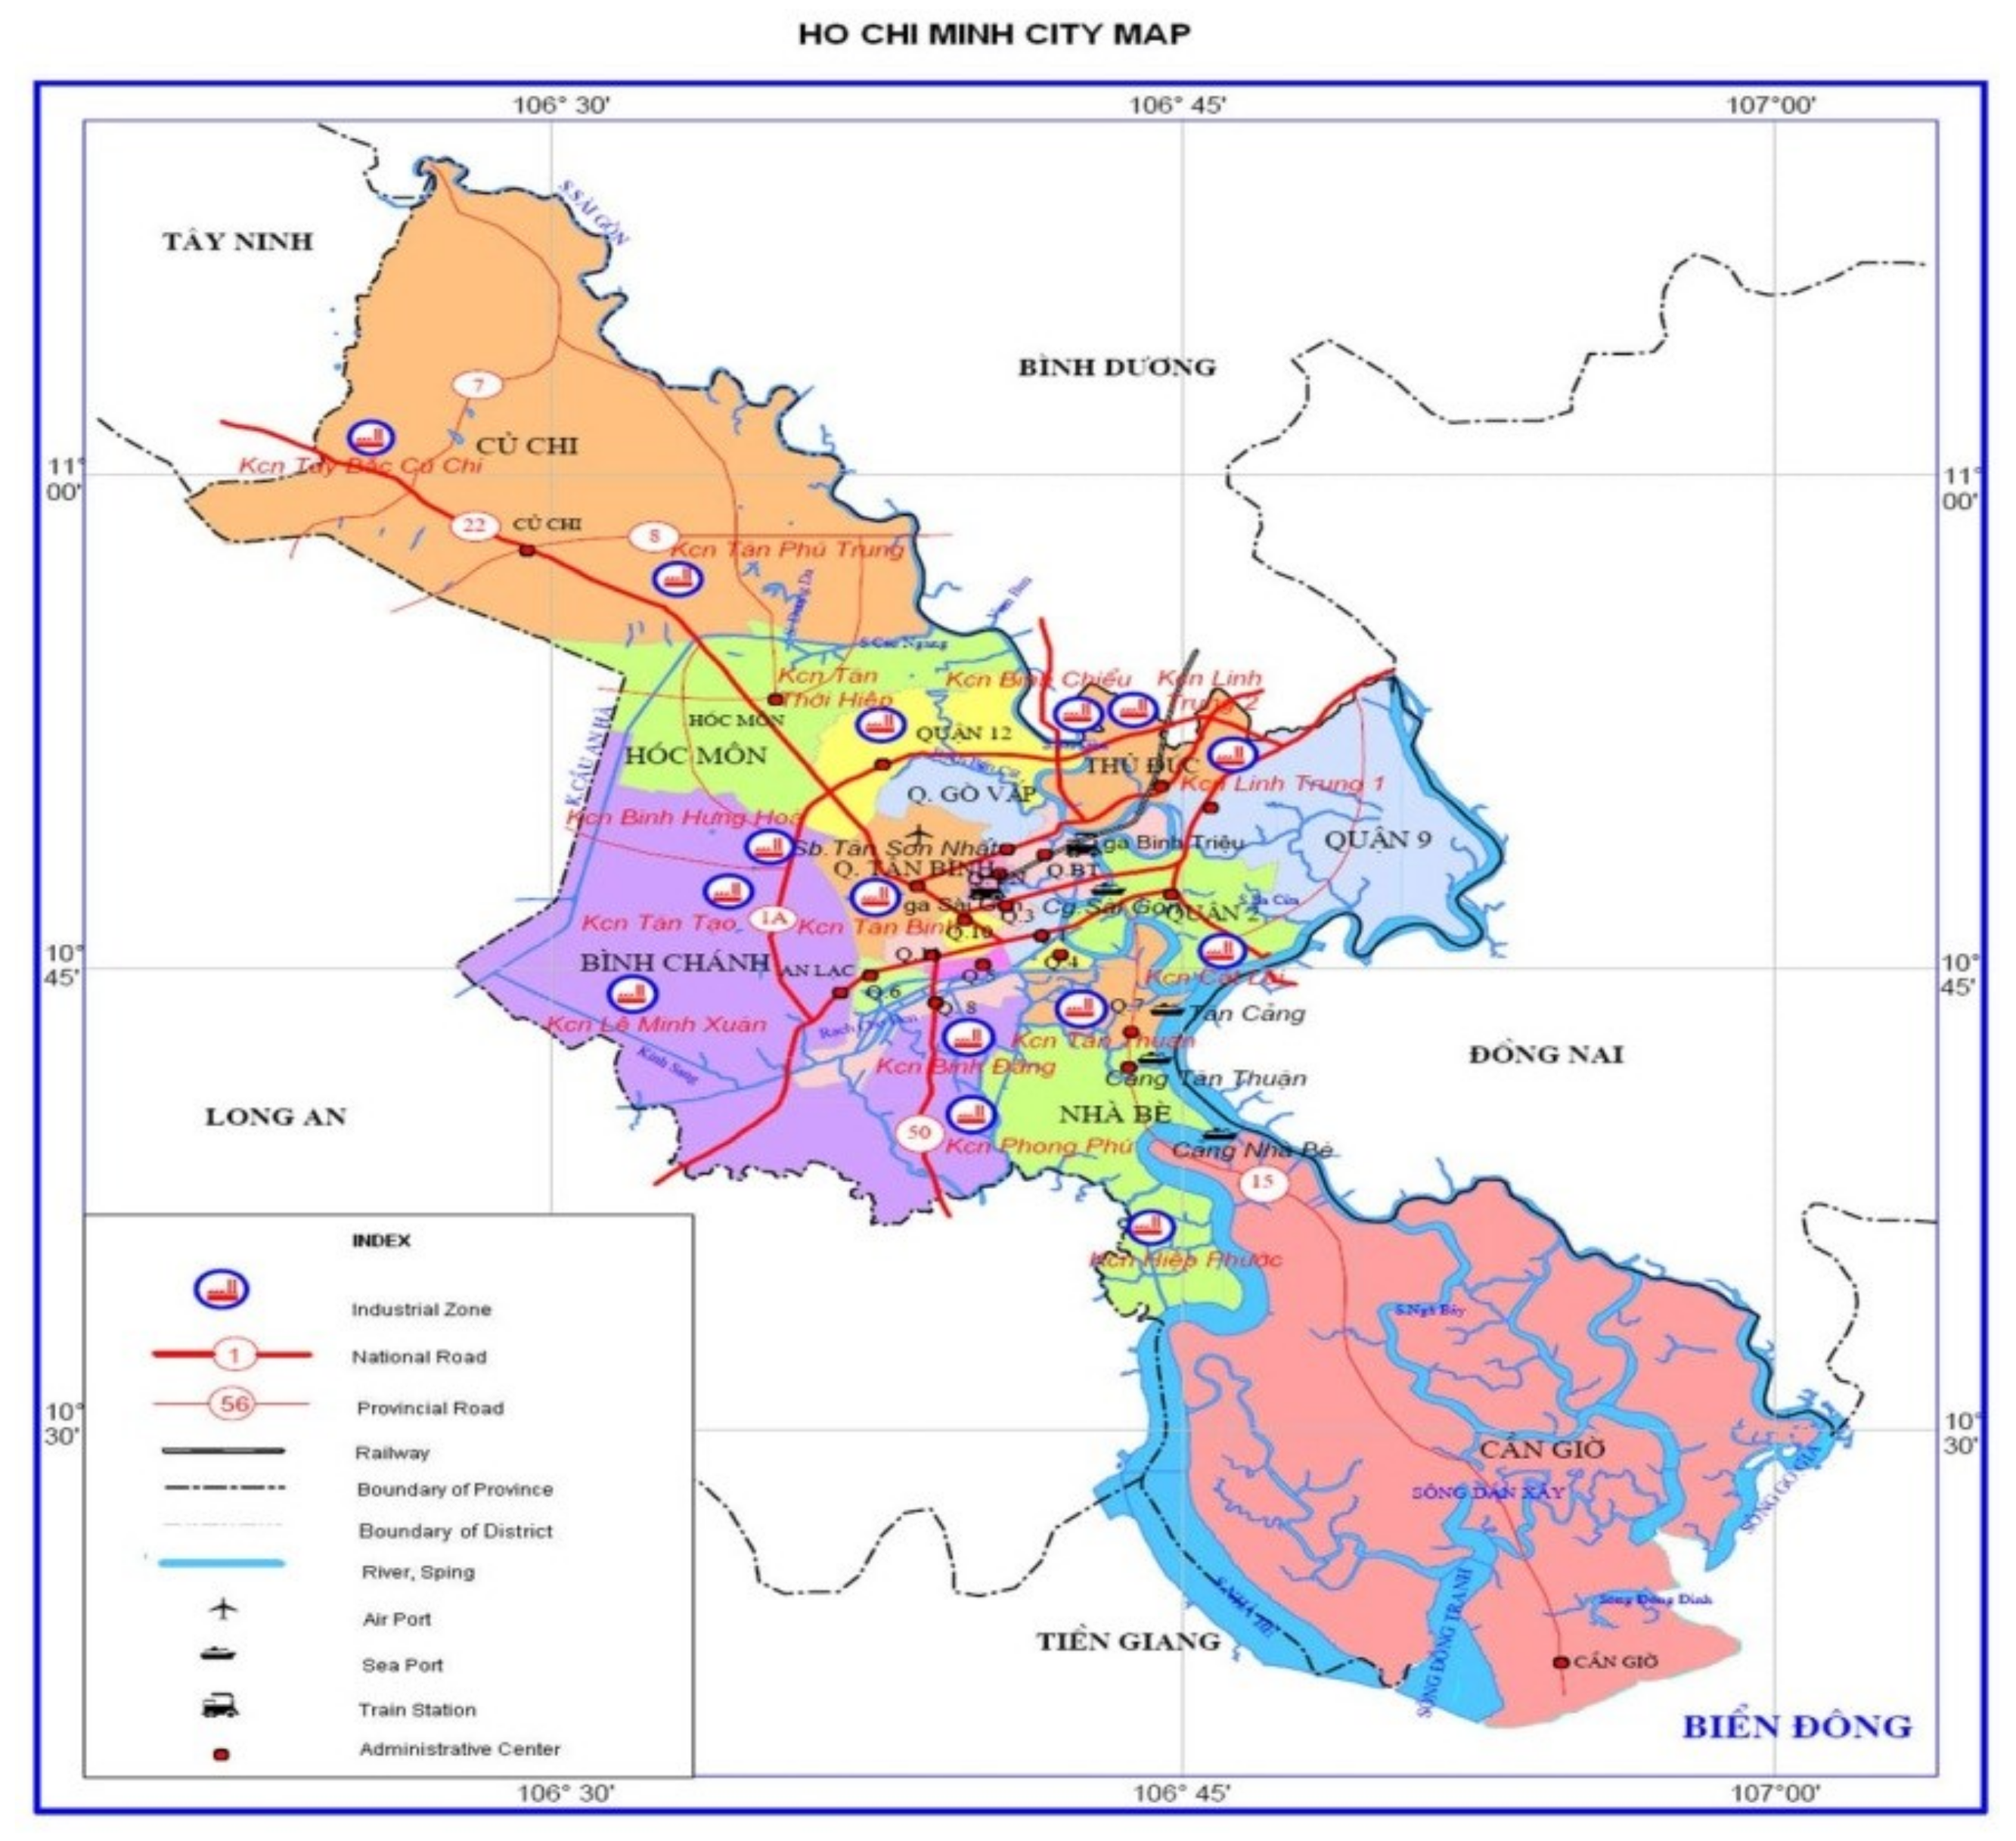
3.3. Ho Chi Minh City
4. Components of the Solar EV Charging Station
4.1. Configuration and Working Principle
4.2. System Parameters
5. Results and Discussion
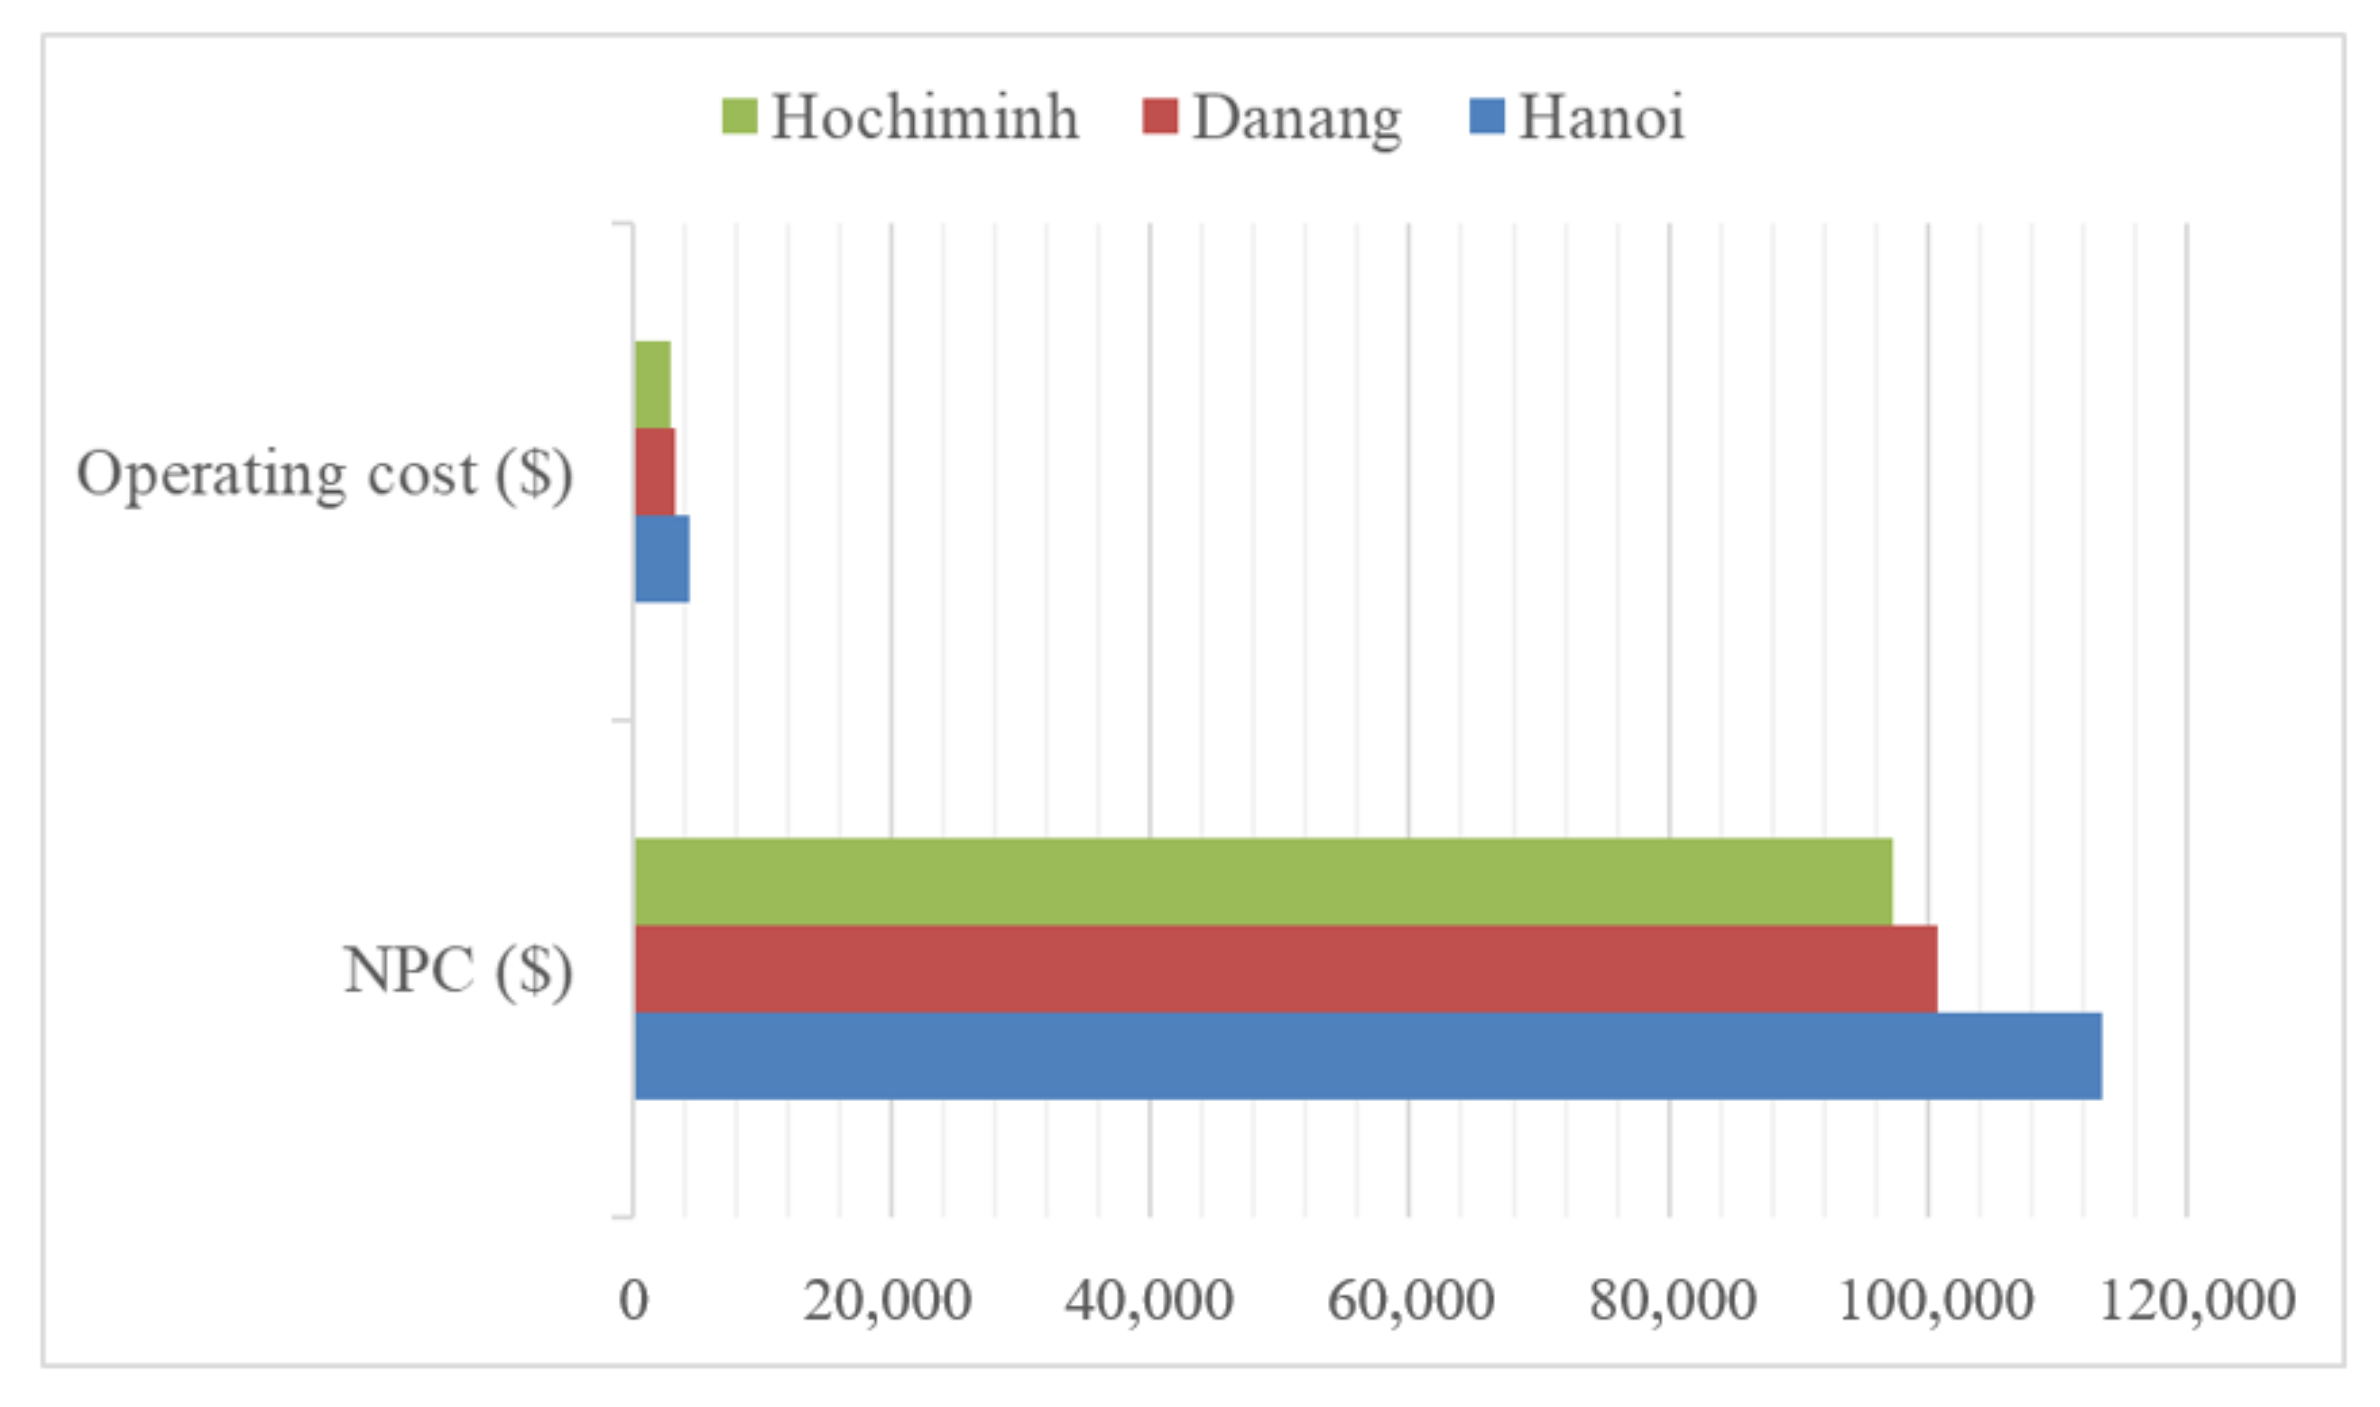
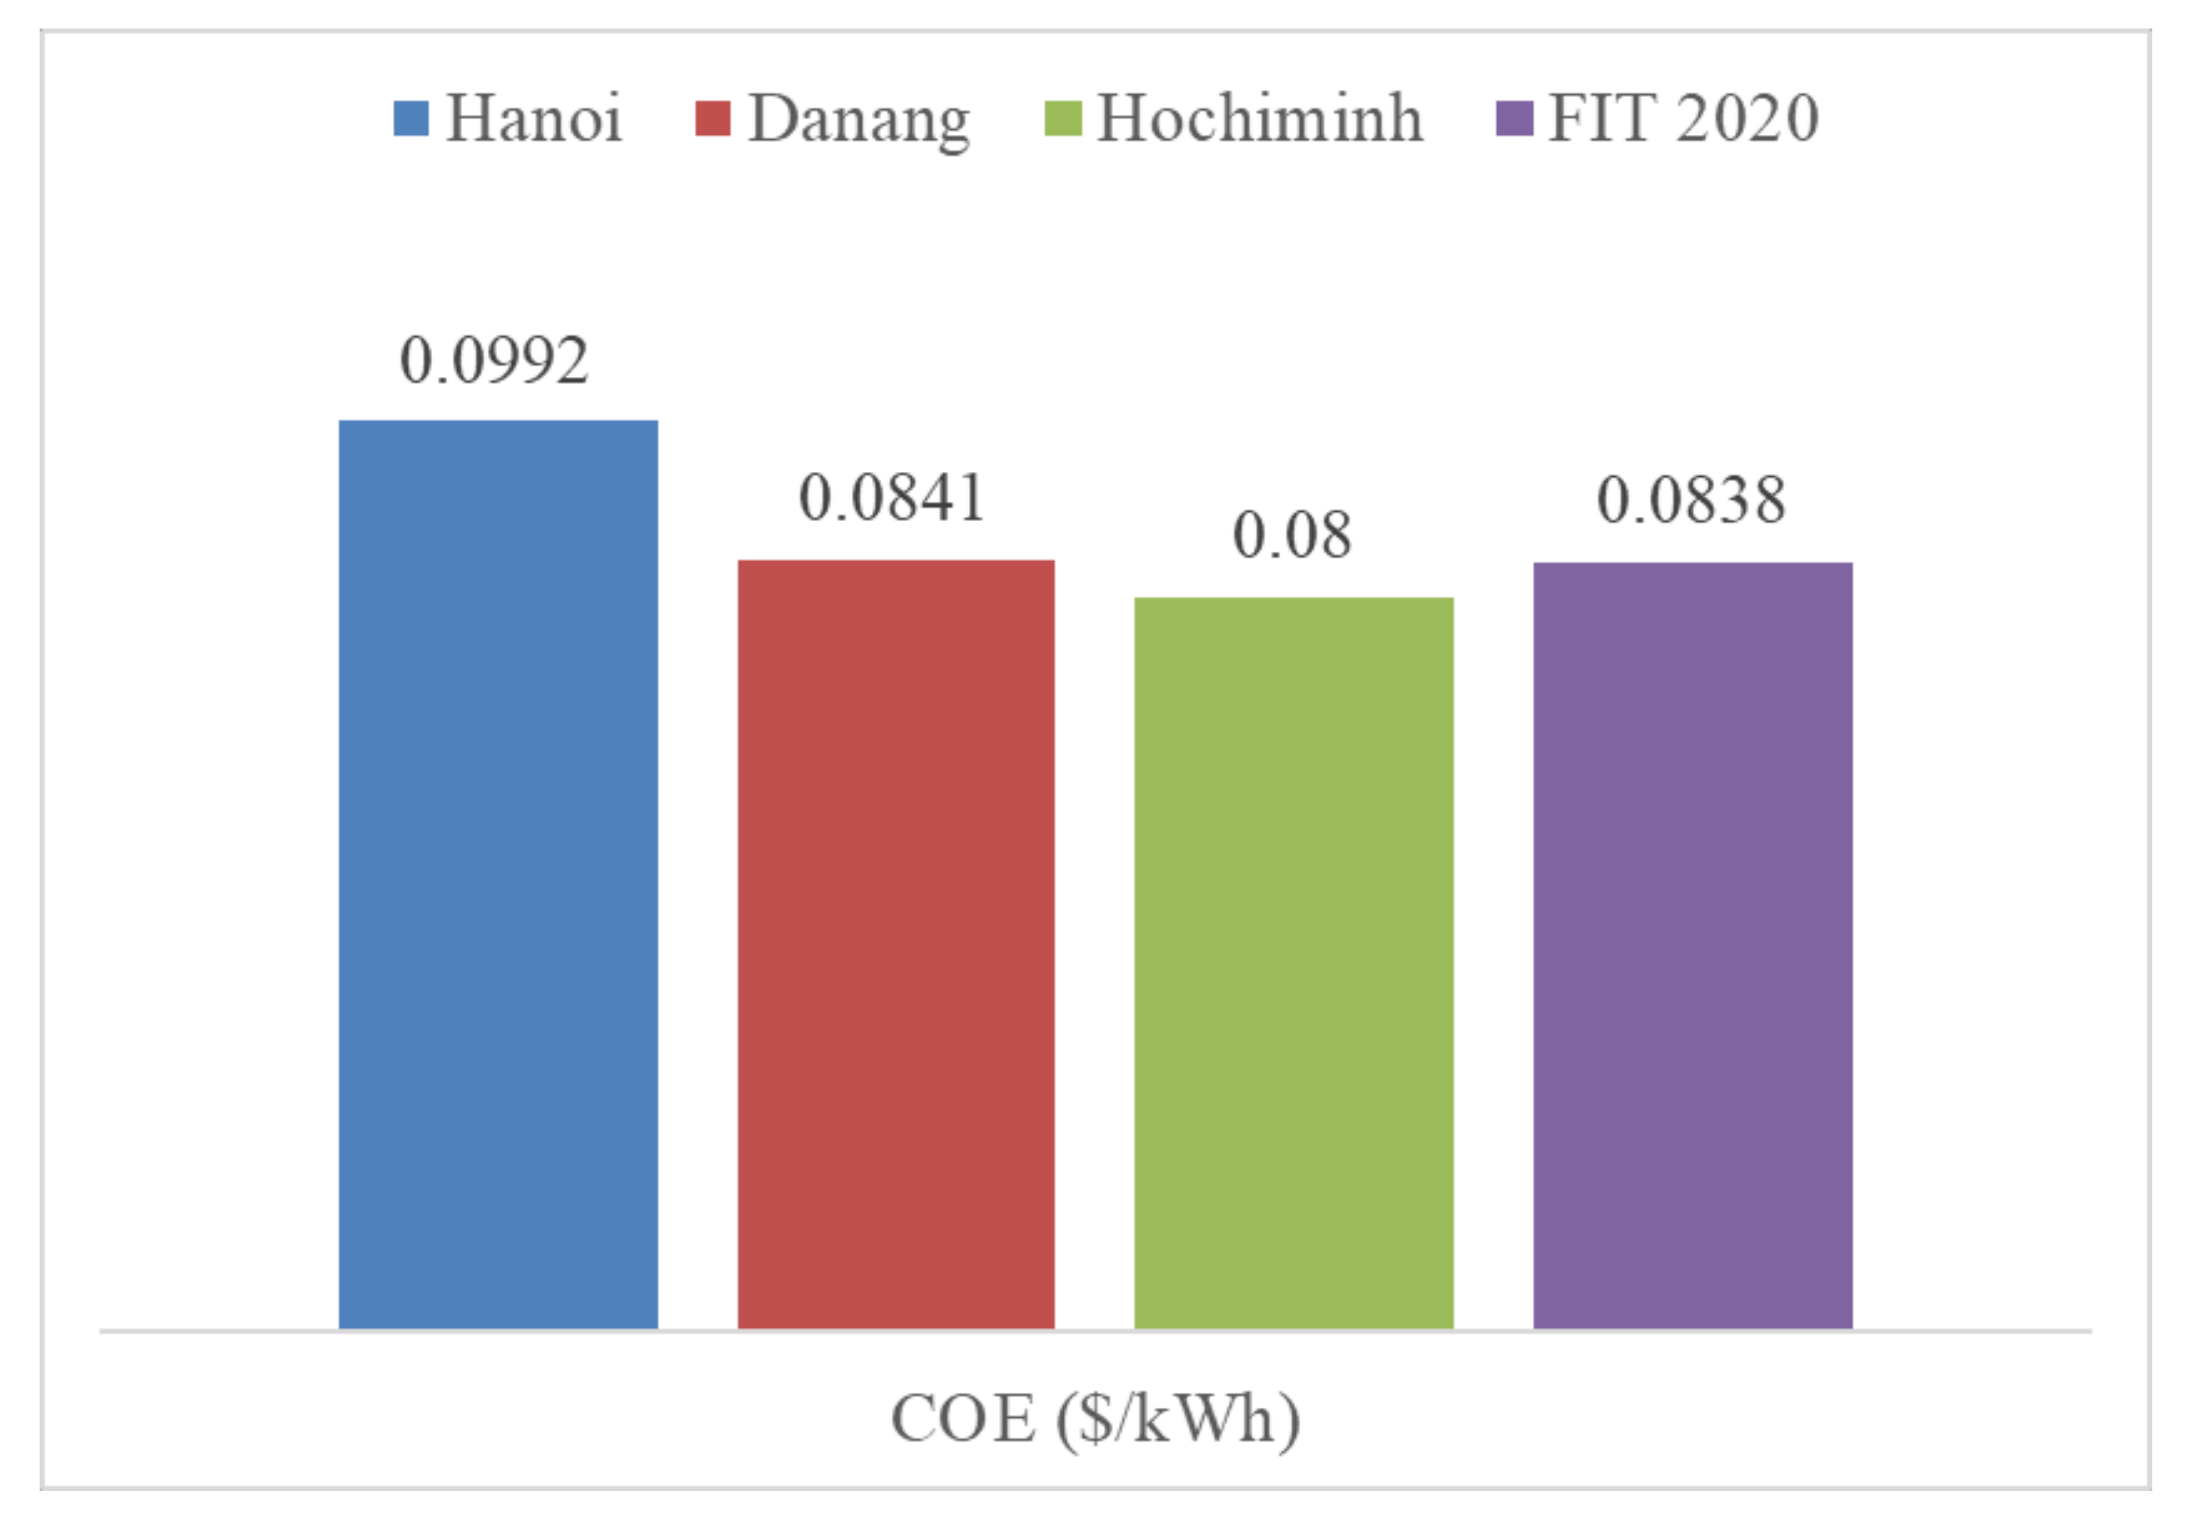
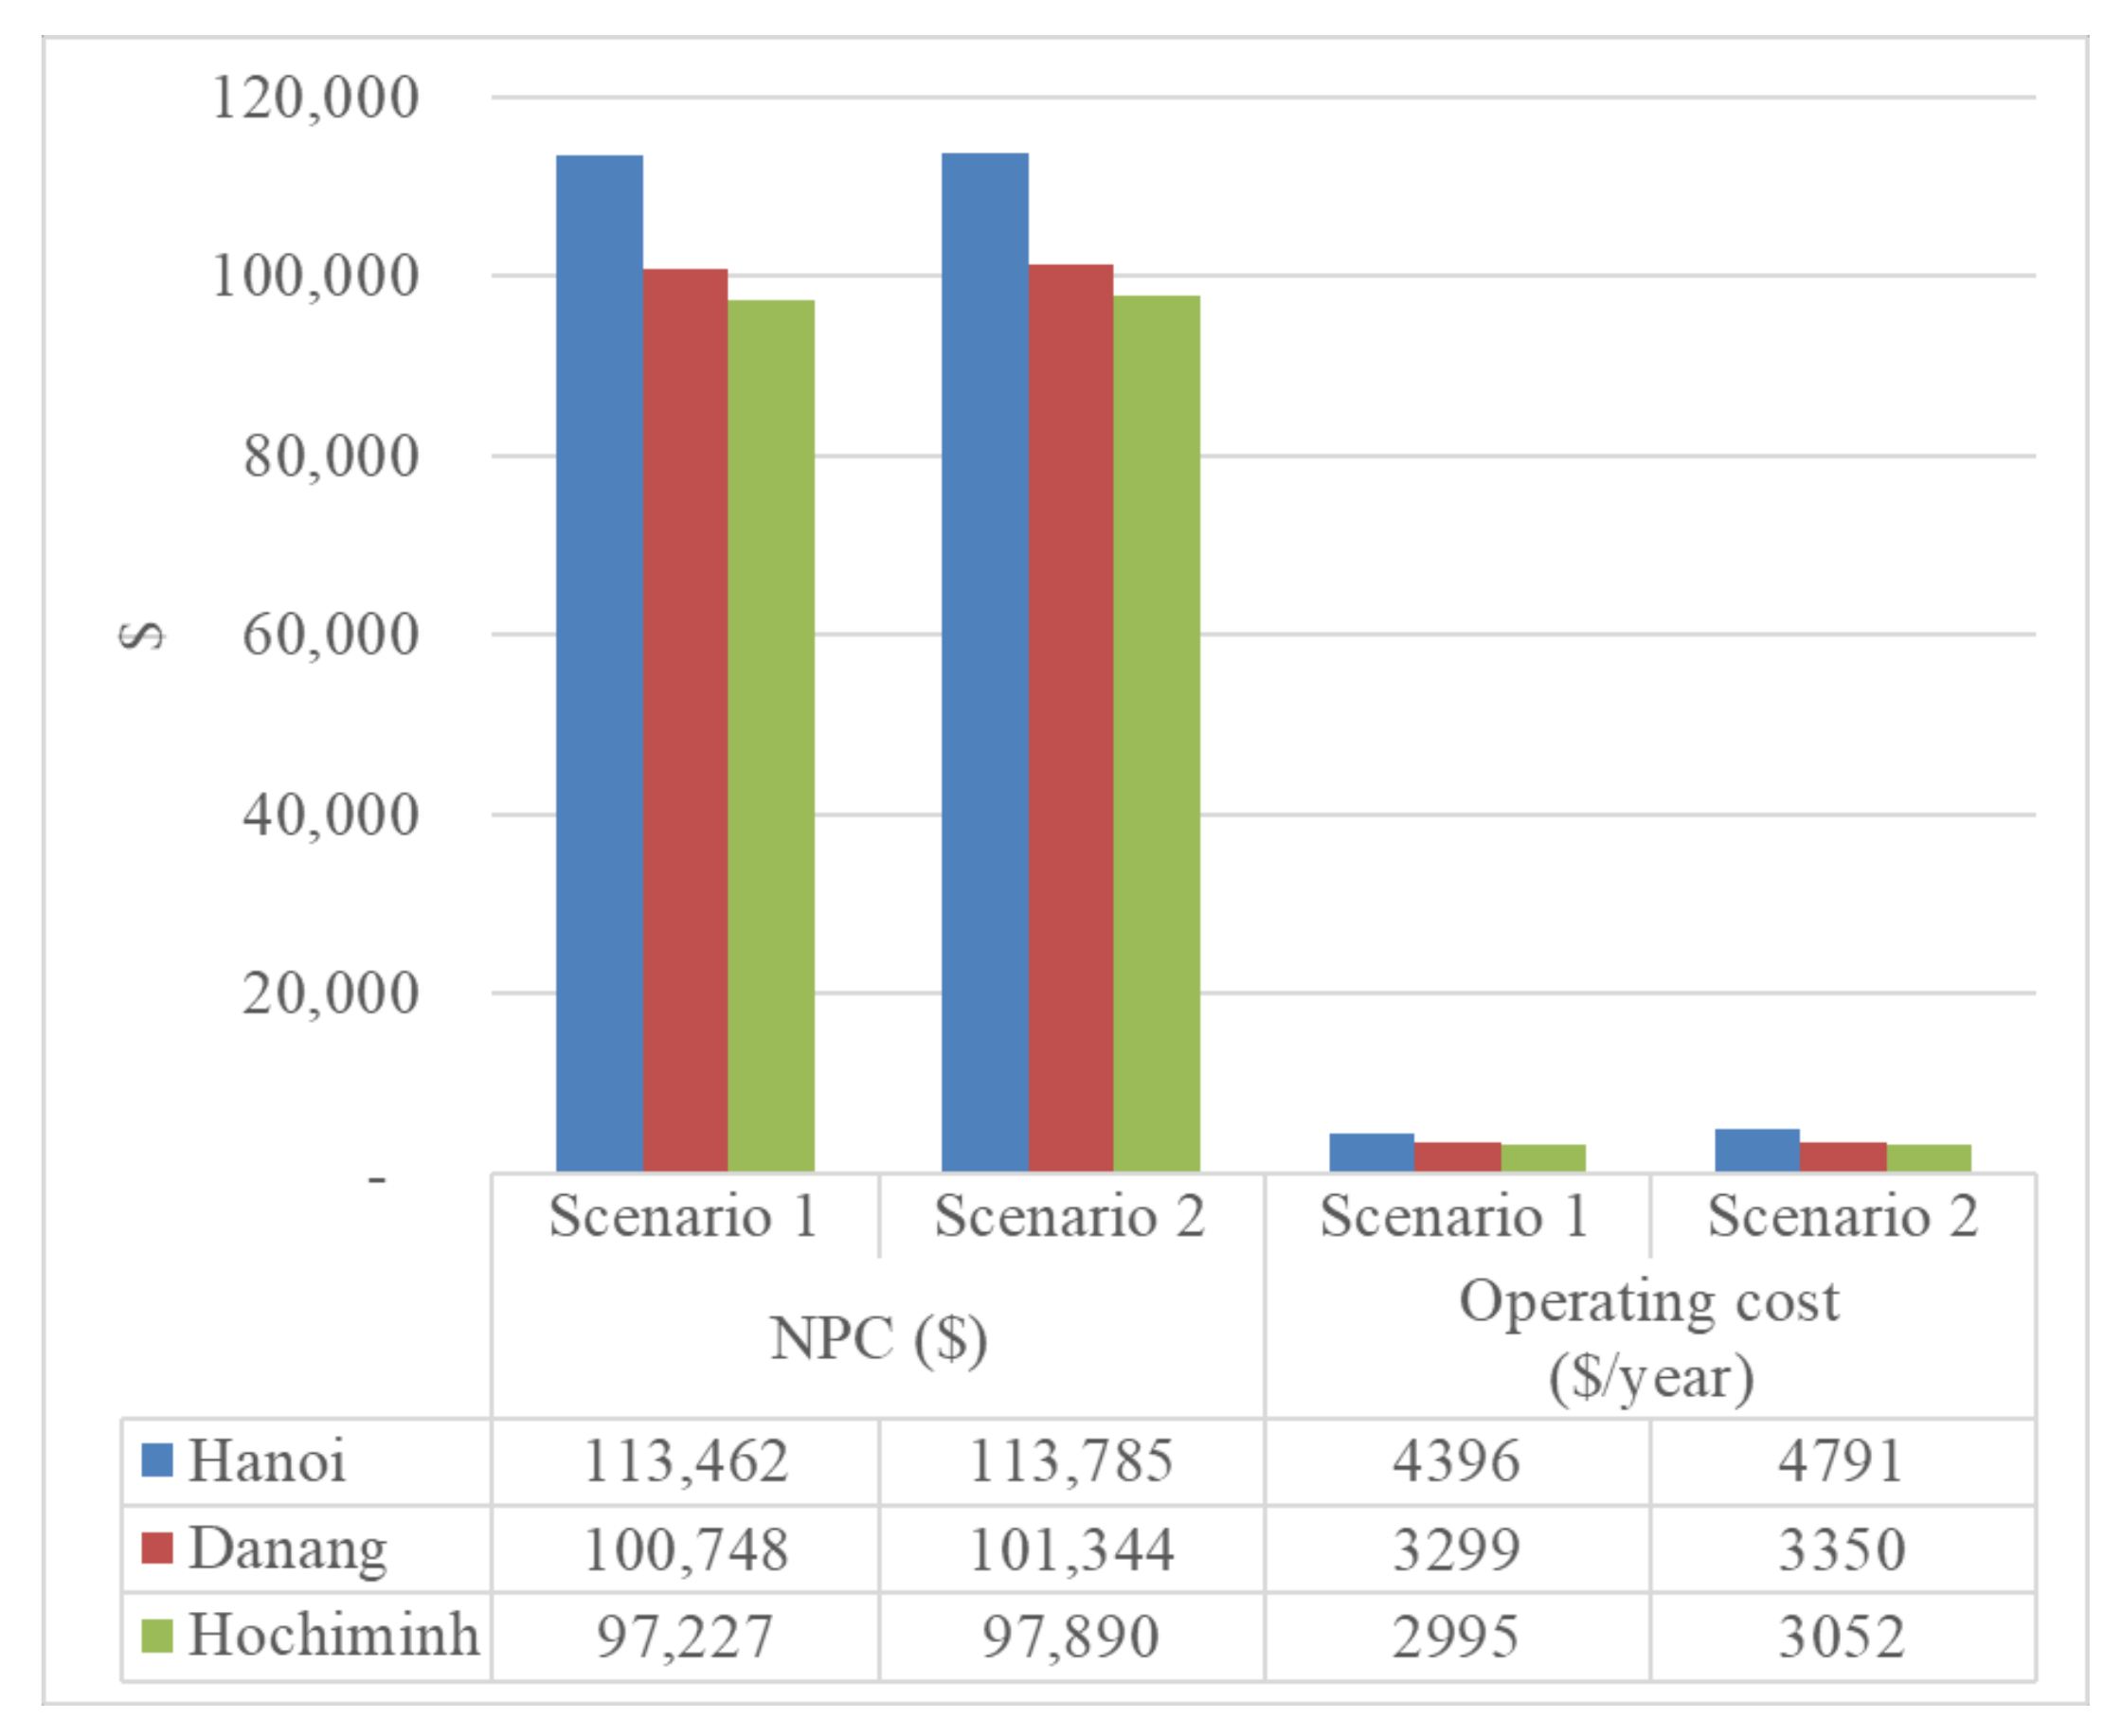
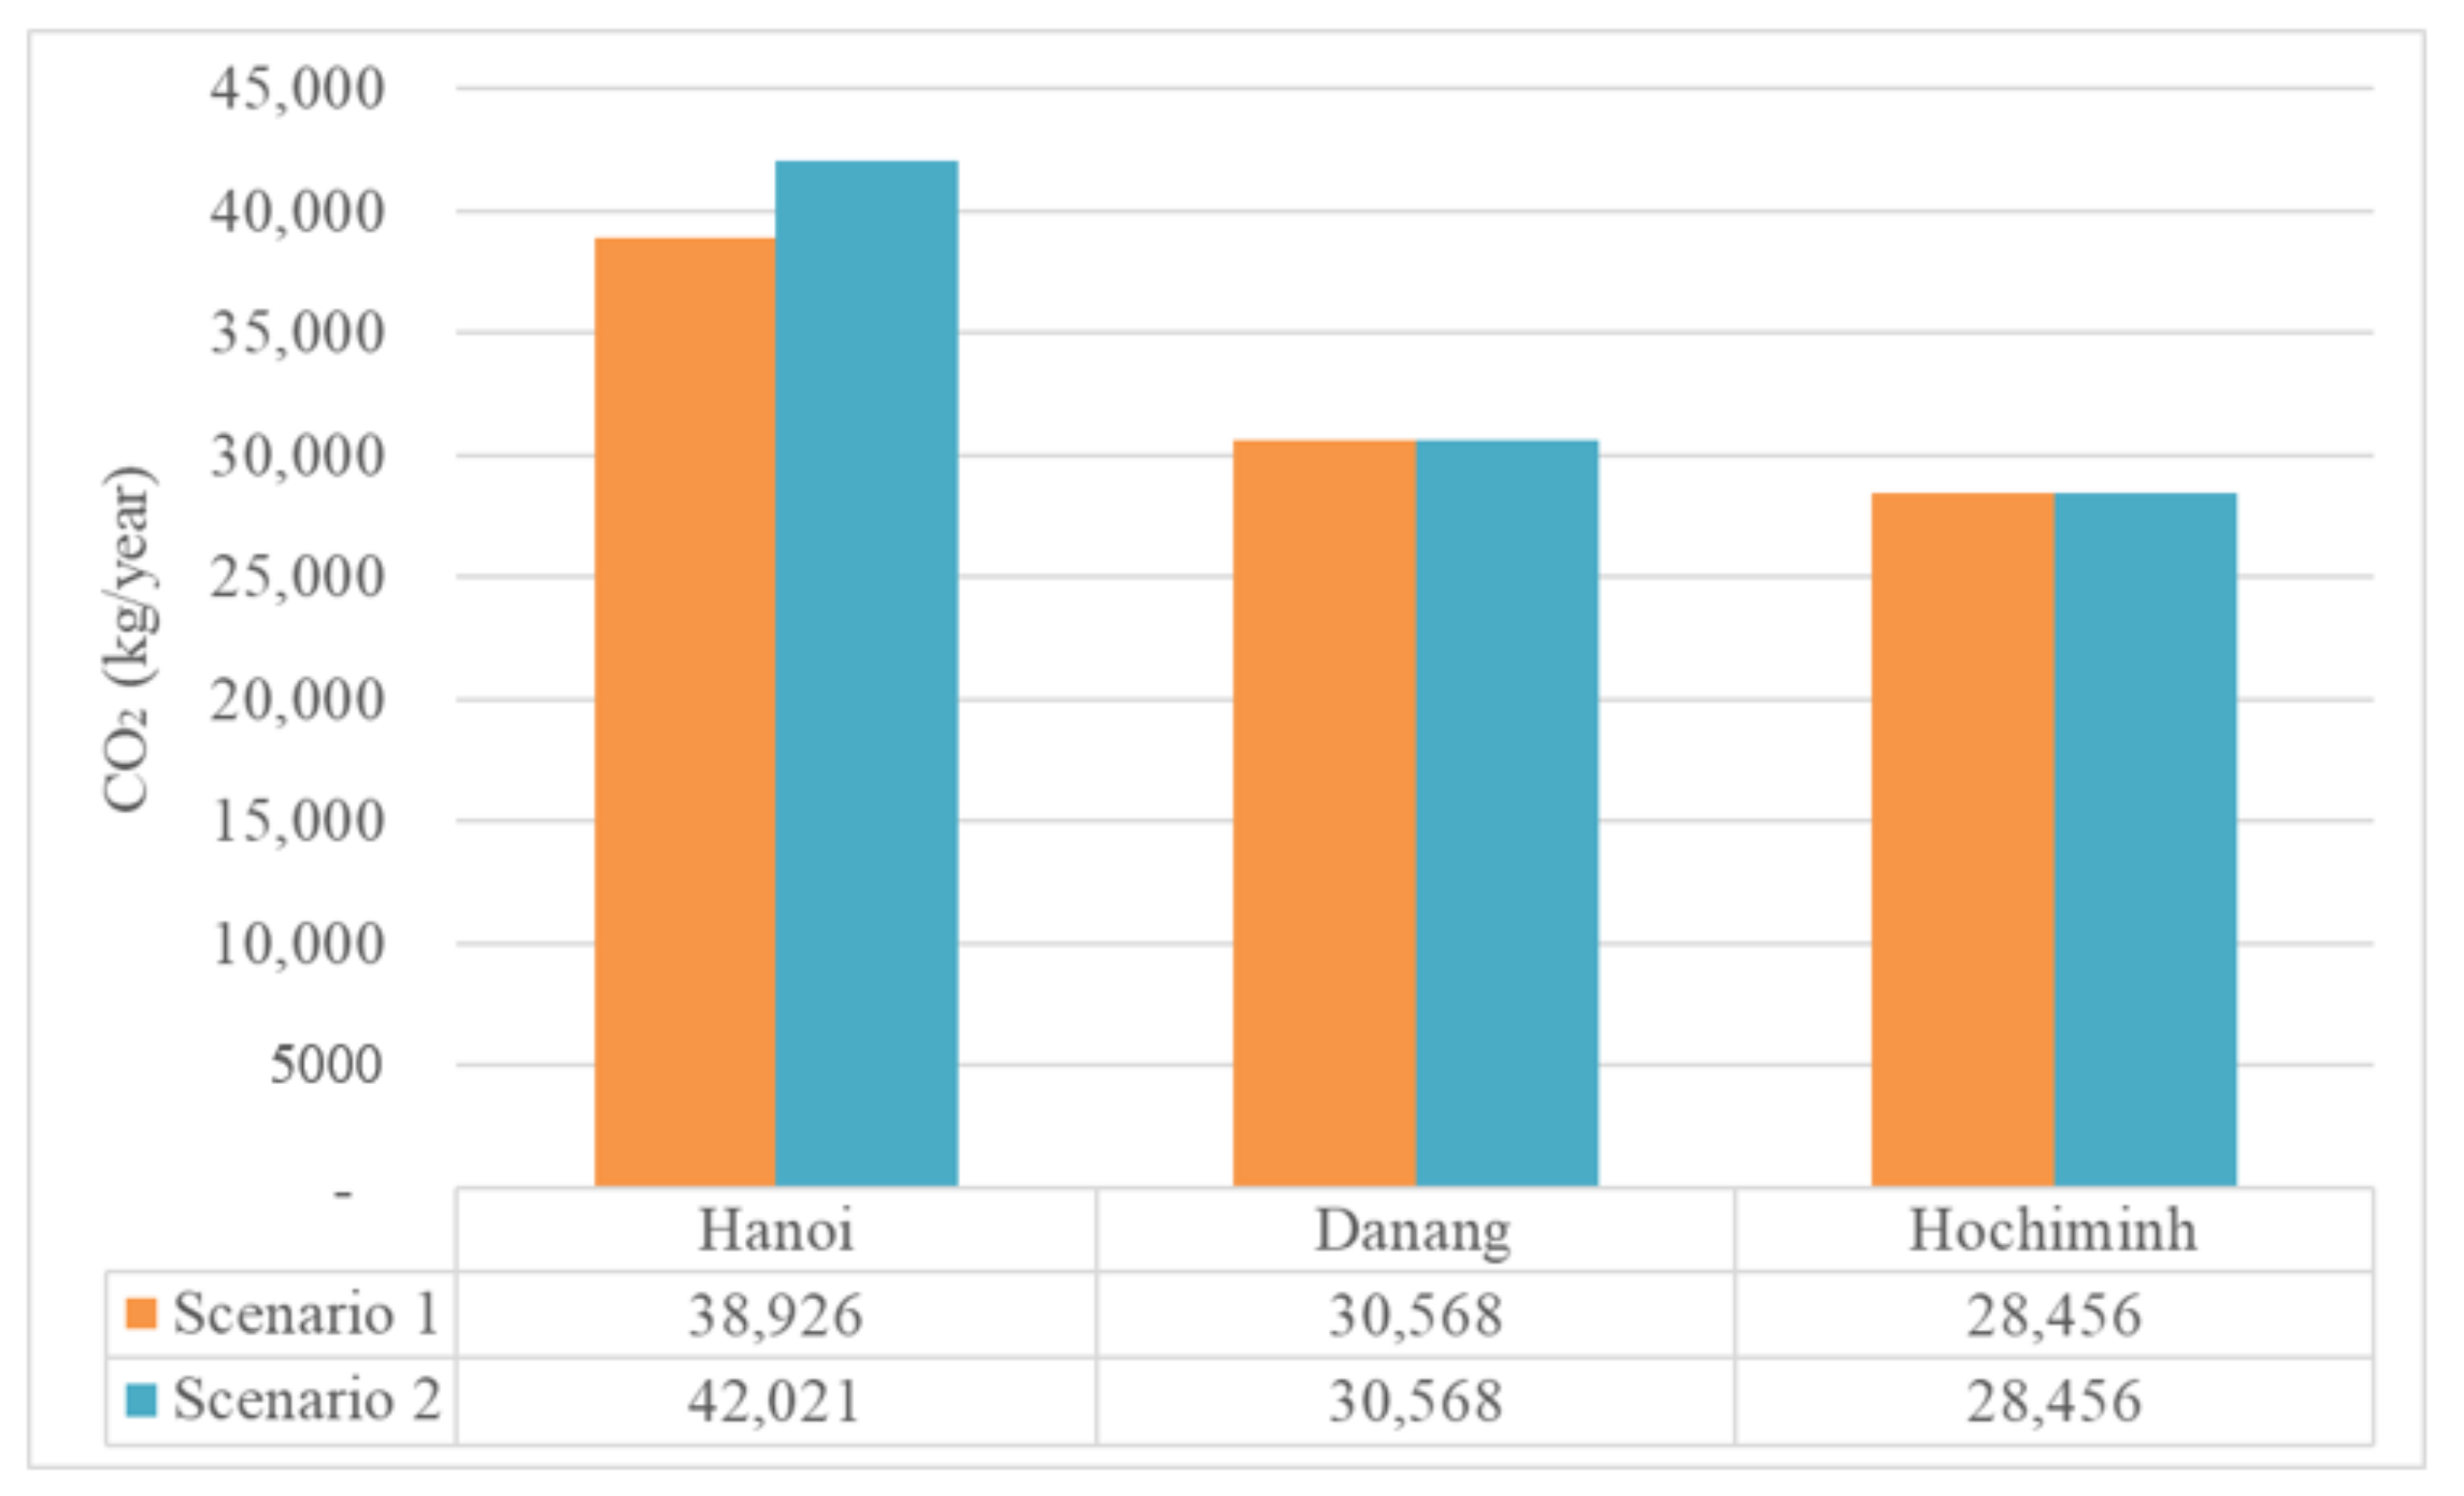
5.1. Scenario 1—The Maximum FIT Price Is 8.38 USD/kWh
5.2. Scenario 2—The Minimum FIT Price Is 8 US cents/kWh
6. Conclusions
Author Contributions
Funding
Institutional Review Board Statement
Informed Consent Statement
Data Availability Statement
Acknowledgments
Conflicts of Interest
References
- Aziz, A.S.; bin Tajuddin, M.F.N.; bin Adzman, M.R. Feasibility Analysis of PV/Wind/Battery Hybrid Power Generation: A Case Study. Int. J. Renew. Energy Res. 2018, 8, 661–671. [Google Scholar]
- List of 175 Signatories to Paris Agreement 15 States Deposit Instruments of Ratification. UNFCCC. Available online: http://newsroom.unfccc.int/paris-agreement/175-states-sign-paris-agreement/ (accessed on 15 January 2021).
- Prakash, J.; Habib, G. A technology-based mass emission factors of gases and aerosol precursor and spatial distribution of emissions from on-road transport sector in India. Atmos. Environ. 2018, 180, 192–205. [Google Scholar] [CrossRef]
- Jyotheeswara, R.K.; Natarajan, S. Energy sources and multi-input DC-DC converters used in hybrid electric vehicle applications –A review. Int. J. Hydrogen Energy 2018, 43, 17387–17408. [Google Scholar] [CrossRef]
- Lunz, B.; Sauer, D.U. 17—Electric road vehicle battery charging systems and infrastructure. In Advances in Battery Technologies for Electric Vehicles; Woodhead Publishing Series in Energy; Woodhead Publishing: Cambridge, UK, 2015; pp. 445–467. [Google Scholar]
- CAA. Types of Electric Vehicles. Available online: https://www.caa.ca/electric-vehicles/ (accessed on 15 January 2021).
- Hexeberg, L.F. Strategies for Smart Charging of Electric Vehicles. Master’s Thesis, Norwegian University of Science and Technology, Trondheim, Norway, June 2014. [Google Scholar]
- Edison, C. Electric Vehicles. Available online: https://www.coned.com/en (accessed on 15 January 2021).
- Contreras-Ocana, J.E.; Sarker, M.R.; Ortega-Vazquez, M.A. Decentralized Coordination of a Building Manager and an Electric Vehicle Aggregator. IEEE Trans. Smart Grid. 2016, 9, 2625–2637. [Google Scholar] [CrossRef]
- You, P.; Yang, Z. Efficient optimal scheduling of charging station with multiple electric vehicles via v2v. In Proceedings of the 2014 IEEE International Conference on Smart Grid Communications (SmartGridComm), Venice, Italy, 3–6 November 2014; pp. 716–721. [Google Scholar]
- Hardman, S.; Jenn, A.; Tal, G.; Axsen, J.; Beard, G.F.; Daina, N.; Pontes, P.; Refa, N.; Sprei, F.; Kinnear, N.; et al. A review of consumer preferences of and interactions with electric vehicle charging infrastructure. Transp. Res. Part D Transp. Environ. 2018, 62, 508–523. [Google Scholar] [CrossRef] [Green Version]
- Kutkut, N.H.; Klontz, K.W. Design Considerations for Power Converters Supplying the SAE J-1773 Electric Vehicle Inductive Coupler. In Proceedings of the APEC 97-Applied Power Electronics Conference, Atlanta, GA, USA, 27 February 1997; pp. 841–847. [Google Scholar]
- Yong, J.Y.; Ramachandaramurthy, V.K.; Tan, K.M.; Mithulananthan, N. A review on the state-of-the-art technologies of electric vehicle, its impacts and prospects. Renew Sustain. Energy Rev. 2015, 49, 365–385. [Google Scholar] [CrossRef]
- Williamson, S.S.; Rathore, A.K.; Musavi, F. Industrial electronics for electric transportation: Current state-ofthe-art and future challenges. IEEE Trans. Ind. Electron. 2015, 62, 3021–3032. [Google Scholar] [CrossRef]
- Yilmaz, M.; Krein, P.T. Review of battery charger topologies, charging power levels, and infrastructure for plug-in electric and hybrid vehicles. IEEE Trans. Power Electron. 2013, 28, 2151–2169. [Google Scholar] [CrossRef]
- Ibrahim, H.; Sayed, K.; Kassem, A.; Mostafa, R. A new power management strategy for battery electric vehicles. IET Electr. Syst. Transp. 2018, 9, 65–74. [Google Scholar]
- Savio, D.A.; Juliet, V.A.; Chokkalingam, B.; Padmanaban, S.; Holm-Nielsen, J.B.; Blaabjerg, F. Photovoltaic Integrated Hybrid Microgrid Structured Electric Vehicle Charging Station and Its Energy Management Approach. Energies 2019, 12, 168. [Google Scholar] [CrossRef] [Green Version]
- Fan, Y.; Zhu, W.; Xue, Z.; Zhang, L.; Zou, Z. A multi-function conversion technique for vehicle-to-grid applications. Energies 2015, 8, 7638–7653. [Google Scholar] [CrossRef] [Green Version]
- Neumann, H.; Schar, D.; Baumgartner, F. The potential of photovoltaic carports to cover the energy demand of road passenger transport. Prog. Photovolt. Res. Appl. 2012, 20, 639–649. [Google Scholar] [CrossRef]
- Ashish Kumar Karmaker, M.; Alamgir, H.; Nallapaneni, M.K.; Vishnupriyan, J.; Arunkumar, J.; Biplob, R. Analysis of Using Biogas Resources for Electric Vehicle Charging in Bangladesh: A Techno-Economic-Environmental Perspective. Sustainability 2020, 12, 2579. [Google Scholar] [CrossRef] [Green Version]
- Ingersoll, J.G.; Perkins, C.A. The 2.1 kW photovoltaic electric vehicle charging station in the city of Santa Monica, California. In Proceedings of the Twenty Fifth IEEE Photovoltaic Specialist’s Conference, Washington, DC, USA, 13–17 May 1996. [Google Scholar]
- Locment, F.; Sechilariu, M.; Forgez, C. Electric vehicle charging system with PV grid-connected configuration. In Proceedings of the IEEE Vehicle Power and Propulsion Conference (VPPC), Lille, France, 1–3 September 2010. [Google Scholar]
- Letendre, S. Solar electricity as a fuel for light vehicles. In Proceedings of the 2009 American Solar Energy Society Annual Conference, Boulder, CO, USA, 11–16 May 2009. [Google Scholar]
- The War in the Vietnamese Electric Motorcycle Market is Heating up. Available online: https://laodong.vn/xe/cuoc-chien-tren-thi-truong-xe-may-dien-viet-tang-nhiet-651973.ldo (accessed on 16 January 2021).
- Great Battle in the Electric Motorcycle Market. Available online: http://tapchitaichinh.vn/tai-chinh-kinh-doanh/dai-chien-thi-truong-xe-may-dien-313214.html (accessed on 16 January 2021).
- VinFast Inaugurated the Manufacturing Plant and Launched the Smart Electric Car Model. Available online: https://nhandan.com.vn/tin-tuc-kinh-te/vinfast-khanh-thanh-nha-may-san-xuat-va-ra-mat-mau-xe-dien-thong-minh-339920/ (accessed on 16 January 2021).
- Demand for Charging Stations Causes Jam in EV Advancement. Available online: https://www.vir.com.vn/demand-for-charging-stations-causes-jam-in-ev-advancement-72610.html (accessed on 16 January 2021).
- Homer. Available online: https://www.homerenergy.com/products/pro/index.html (accessed on 16 January 2021).
- Krishan, O.; Suhag, S. Techno-economic analysis of a hybrid renewable energy system for an energy poor rural community. J. Energy Storage 2019, 23, 305–319. [Google Scholar] [CrossRef]
- Stadler, M.; Marnay, C.; DeForest, N.; Eto, J.; Cardoso, G.; Klapp, D.; Lai, J. Web-Based Economic and Environmental Optimization of Microgrids. In Proceedings of the IEEE Innovative Smart Grid Technologies (ISGT), Washington, DC, USA, 16–20 January 2012. [Google Scholar]
- Hafez, O.; Bhattacharya, K. Optimal Planning and Design of a Renewable Energy Based Supply System for Microgrids. Renew. Energy 2012, 45, 7–15. [Google Scholar] [CrossRef]
- Narayan, A.; Ponnambalam, K. Risk-Averse Stochastic Programming Approach for Microgrid Planning under Uncertainty. Renew. Energy 2017, 101, 399–408. [Google Scholar] [CrossRef]
- Tulpule, P.J.; Marano, V.; Yurkovich, S.; Rizzoni, G. Economic and environmental impacts of a PV powered workplace parking garage charging station. J. Appl. Energy 2013, 108, 323–332. [Google Scholar] [CrossRef]
- Birnie, D.P., III. Solar-to-vehicle (S2 V) systems for powering commuters of the future. J. Power Sources 2009, 186, 539–542. [Google Scholar] [CrossRef]
- HOMER Grid 1.8. Available online: https://www.homerenergy.com/products/grid/docs/latest/how_homer_calculates_the_maximum_battery_charge_power.html (accessed on 17 January 2021).
- Tang, J.; Ye, B.; Lu, Q.; Wang, D.; Li, J. Economic Analysis of Photovoltaic Electricity Supply for an Electric Vehicle Fleet in Shenzhen, China. Int. J. Sustain. Transp. 2014, 8, 202–224. [Google Scholar] [CrossRef]
- Final Report on the Study and Development of Emission Factor (Ef) for Vietnamese Electrical Grid in 2018. Available online: http://vepg.vn/wp-content/uploads/2020/09/Final_Report_Emission_Factor_EN.pdf (accessed on 16 January 2021).
- Ministry of Industry and Trade of the Socialist Republic of Vietnam. Maps of Solar Resource and Potential in Vietnam, 2015; Ministry of Industry and Trade of the Socialist Republic of Vietnam: Hanoi, Vietnam, 2015.
- Nguyen, T.M.; Tang-Huang, L.; Hai-Po, C. The Environmental Effects of Urban Development in Hanoi, Vietnam from Satellite and Meteorological Observations from 1999–2016. Sustainability 2019, 11, 1768. [Google Scholar] [CrossRef] [Green Version]
- Introduction and Overview about the Geography of Hanoi City. Available online: https://hanoi.gov.vn/diachihanoi/-/hn/RtLibd2X8kEn/1001/124742/gioi-thieu-tong-quan-va-khai-quat-ve-dia-li-thanh-pho-ha-noi.html. (accessed on 18 January 2021).
- Phap, V.M.; Huong, N.T.T.; Hanh, P.H.; Duy, P.V.; Binh, D.V. Assessment of rooftop solar power technical potential in Hanoi city, Vietnam. J. Build. Eng. 2020, 32, 101528. [Google Scholar] [CrossRef]
- Hanoi: Electricity Load Growth Is Maintained at over 9% per Year. Available online: https://hanoi.gov.vn/tintuc_sukien/-/hn/ZVOm7e3VDMRM/7320/2834006/2/ha-noi-tang-truong-phu-tai-ien-duy-tri-o-muc-tren-9nam.html (accessed on 18 January 2021).
- Da Nang Portal. Available online: https://danang.gov.vn/web/en (accessed on 18 January 2021).
- World Bank. World Bank: Developing Sustainable Rooftop PV in Vietnam #1259789: HCMC and Danang; Final Inception Report; World Bank: Washington, DC, USA, 2019. [Google Scholar]
- Da Nang Electricity Reached 3 billion kWh of Commercial Electricity. Available online: https://www.phapluatplus.vn/kinh-te-cong-nghe/dien-luc-da-nang-lan-dau-can-moc-3-ty-kwh-dien-thuong-pham-d109986.html (accessed on 18 January 2021).
- Ho Chi Minh City. Available online: http://www.mpi.gov.vn/Pages/tinhthanhchitiet.aspx?idTinhThanh=35 (accessed on 18 January 2021).
- Power System in Ho Chi Minh City. Available online: http://kinhtevn.com.vn/he-thong-dien-tp-ho-chi-minh-san-sang-cho-phu-tai-tang-cao-vao-mua-kho-31954.html (accessed on 18 January 2021).
- EVN Retail Electricity Tariff. Available online: https://en.evn.com.vn/d6/gioi-thieu-d/RETAIL-ELECTRICITY-TARIFF-9-28-252.aspx (accessed on 20 January 2021).
- Government of the Socialist Republic of Vietnam. Decision No 13/2020/QD-TTg: On Mechanisms to Promote the Development of Solar Power Projects in Vietnam; Government of the Socialist Republic of Vietnam: Hanoi, Vietnam, 2020.


| Component | Size and Unit Number | Life | Other Information |
|---|---|---|---|
| PV system | 45, 46, 47, 48, 49, 50 kW | 25 years | Derating factor: 80% |
| Bidirectional Converter | 50 kW | 10 years | Converter efficiency: 98% Rectifier efficiency: 95% |
| Utility grid | 50 kW | Purchase: 0.077 $/kWh Scenario 1: Sellback: 0.0838 $/kWh Scenario 2: Sellback: 0.08 $/kWh | |
| Battery | 16 units | 10 years | Properties per unit: Voltage: 6 V Capacity: 167 Ah |
| EV charging | 30 units of SUV EV 150 kW and 70 units of small EV 50 kW | Max charger output power: 48 kW |
| Component | Capital Cost | Replacement Cost | O&M Cost |
|---|---|---|---|
| PV system | 850 $/kW | 800 $/kW | 20 $/kW/year |
| Bidirectional Converter | 225 $/kW | 200 $/kW | |
| Lithium Battery | 550 $/unit | 550 $/unit | 10 $/unit/year |
| Architecture | Cost | System | ||||||
|---|---|---|---|---|---|---|---|---|
| PV (kW) | Battery | Utility Grid | Converter (kW) | NPC ($) | COE ($) | Operating Cost ($/year) | Initial Capital ($) | Ren Frac (%) |
| 50 | 16 | 1 | 50 | $113,462 | $0.0992 | $4396 | $62,550 | 56.8 |
| 49 | 16 | 1 | 50 | $113,471 | $0.0997 | $4471 | $61,700 | 56.0 |
| 48 | 16 | 1 | 50 | $113,479 | $0.1000 | $4545 | $60,850 | 55.1 |
| 47 | 16 | 1 | 50 | $113,485 | $0.1010 | $4619 | $60,000 | 54.2 |
| 46 | 16 | 1 | 50 | $113,489 | $0.1010 | $4692 | $59,150 | 53.3 |
| 45 | 16 | 1 | 50 | $113,493 | $0.1020 | $4766 | $58,300 | 52.3 |
| Architecture | Cost | System | ||||||
|---|---|---|---|---|---|---|---|---|
| PV (kW) | Battery | Utility Grid | Converter (kW) | NPC ($) | COE ($) | Operating Cost ($/year) | Initial Capital ($) | Ren Frac (%) |
| 50 | 16 | 1 | 50 | $100,748 | $0.0841 | $3299 | $62,550 | 67.6 |
| 49 | 16 | 1 | 50 | $101,030 | $0.0850 | $3396 | $61,700 | 66.8 |
| 48 | 16 | 1 | 50 | $101,308 | $0.0858 | $3494 | $60,850 | 65.9 |
| 47 | 16 | 1 | 50 | $101,583 | $0.0866 | $3591 | $60,000 | 64.9 |
| 46 | 16 | 1 | 50 | $101,857 | $0.0874 | $3688 | $59,150 | 64.0 |
| 45 | 16 | 1 | 50 | $102,130 | $0.0882 | $3785 | $58,300 | 63.0 |
| Architecture | Cost | System | ||||||
|---|---|---|---|---|---|---|---|---|
| PV (kW) | Battery | Utility Grid | Converter (kW) | NPC ($) | COE ($) | Operating Cost ($/year) | Initial Capital ($) | Ren Frac (%) |
| 50 | 16 | 1 | 50 | $97,227 | $0.0800 | $2995 | $62,550 | 70.3 |
| 49 | 16 | 1 | 50 | $97,580 | $0.0809 | $3098 | $61,700 | 69.4 |
| 48 | 16 | 1 | 50 | $97,931 | $0.0818 | $3202 | $60,850 | 68.5 |
| 47 | 16 | 1 | 50 | $98,281 | $0.0827 | $3306 | $60,000 | 67.6 |
| 46 | 16 | 1 | 50 | $98,629 | $0.0836 | $3409 | $59,150 | 66.6 |
| 45 | 16 | 1 | 50 | $98,973 | $0.0845 | $3512 | $58,300 | 65.6 |
| Content | Hanoi | Da Nang | Ho Chi Minh |
|---|---|---|---|
| Solar irradiation (kWh/m2.day) | 3.84 | 4.89 | 5.09 |
| Production | |||
| Optimal PV capacity (kW) | 50 | 50 | 50 |
| PV (kWh/year) | 57,620 | 71,808 | 75,704 |
| Utility grid (kWh/year) | 42,635 | 33,481 | 31,168 |
| Total (kWh/year) | 100,255 | 105,290 | 106,872 |
| Consumption | |||
| EV charger served (kWh/year) | 89,884 | 89,884 | 89,884 |
| Grid sales (kWh/year) | 8858 | 13,556 | 15,057 |
| Total (kWh/year) | 98,742 | 103,440 | 104,941 |
| Renewable fraction (%) | 56.8 | 67.6 | 70.3 |
| Architecture | Cost | System | ||||||
|---|---|---|---|---|---|---|---|---|
| PV (kW) | Battery | Utility Grid | Converter (kW) | NPC ($) | COE ($) | Operating Cost ($/year) | Initial Capital ($) | Ren Frac (%) |
| 45 | 16 | 1 | 50 | $113,785 | $0.1020 | $4791 | $58,300 | 52.3 |
| 46 | 16 | 1 | 50 | $113,800 | $0.1010 | $4719 | $59,150 | 53.3 |
| 47 | 16 | 1 | 50 | $113,814 | $0.1010 | $4647 | $60,000 | 54.2 |
| 48 | 16 | 1 | 50 | $113,828 | $0.1010 | $4575 | $60,850 | 55.1 |
| 49 | 16 | 1 | 50 | $113,840 | $0.1000 | $4502 | $61,700 | 56.0 |
| 50 | 16 | 1 | 50 | $113,852 | $0.0996 | $4430 | $62,550 | 56.8 |
| Architecture | Cost | System | ||||||
| PV (kW) | Battery | Utility Grid | Converter (kW) | NPC ($) | COE ($) | Operating Cost ($/year) | Initial Capital ($) | Ren Frac (%) |
| 50 | 16 | 1 | 50 | $101,344 | $0.0846 | $3350 | $62,550 | 67.6 |
| 49 | 16 | 1 | 50 | $101,593 | $0.0854 | $3445 | $61,700 | 66.8 |
| 48 | 16 | 1 | 50 | $101,839 | $0.0862 | $3540 | $60,850 | 65.9 |
| 47 | 16 | 1 | 50 | $102,084 | $0.0870 | $3634 | $60,000 | 64.9 |
| 46 | 16 | 1 | 50 | $102,328 | $0.0878 | $3729 | $59,150 | 64.0 |
| 45 | 16 | 1 | 50 | $102,573 | $0.0886 | $3823 | $58,300 | 63.0 |
| Architecture | Cost | System | ||||||
|---|---|---|---|---|---|---|---|---|
| PV (kW) | Battery | Utility Grid | Converter (kW) | NPC ($) | COE ($) | Operating Cost ($/year) | Initial Capital ($) | Ren Frac (%) |
| 50 | 16 | 1 | 50 | $97,890 | $0.0806 | $3052 | $62,550 | 70.3 |
| 49 | 16 | 1 | 50 | $98,207 | $0.0814 | $3153 | $61,700 | 69.4 |
| 48 | 16 | 1 | 50 | $98,524 | $0.0823 | $3253 | $60,850 | 68.5 |
| 47 | 16 | 1 | 50 | $98,840 | $0.0832 | $3354 | $60,000 | 67.6 |
| 46 | 16 | 1 | 50 | $99,155 | $0.0841 | $3455 | $59,150 | 66.6 |
| 45 | 16 | 1 | 50 | $99,468 | $0.0849 | $3555 | $58,300 | 65.6 |
| Content | Hanoi | Da Nang | Ho Chi Minh |
|---|---|---|---|
| Solar irradiation (kWh/m2.day) | 3.84 | 4.89 | 5.09 |
| Production | |||
| Optimal PV capacity (kW) | 45 | 50 | 50 |
| PV (kWh/year) | 51,865 | 71,808 | 75,704 |
| Utility grid (kWh/year) | 46,025 | 33,481 | 31,168 |
| Total (kWh/year) | 97,890 | 105,290 | 106,872 |
| Consumption | |||
| EV charger served (kWh/year) | 89,884 | 89,884 | 89,884 |
| Grid sales (kWh/year) | 6638 | 13,556 | 15,057 |
| Total (kWh/year) | 96,522 | 103,440 | 104,941 |
| Renewable fraction (%) | 52.3 | 67.6 | 70.3 |
Publisher’s Note: MDPI stays neutral with regard to jurisdictional claims in published maps and institutional affiliations. |
© 2021 by the authors. Licensee MDPI, Basel, Switzerland. This article is an open access article distributed under the terms and conditions of the Creative Commons Attribution (CC BY) license (http://creativecommons.org/licenses/by/4.0/).
Share and Cite
Minh, P.V.; Le Quang, S.; Pham, M.-H. Technical Economic Analysis of Photovoltaic-Powered Electric Vehicle Charging Stations under Different Solar Irradiation Conditions in Vietnam. Sustainability 2021, 13, 3528. https://doi.org/10.3390/su13063528
Minh PV, Le Quang S, Pham M-H. Technical Economic Analysis of Photovoltaic-Powered Electric Vehicle Charging Stations under Different Solar Irradiation Conditions in Vietnam. Sustainability. 2021; 13(6):3528. https://doi.org/10.3390/su13063528
Chicago/Turabian StyleMinh, Phap Vu, Sang Le Quang, and Manh-Hai Pham. 2021. "Technical Economic Analysis of Photovoltaic-Powered Electric Vehicle Charging Stations under Different Solar Irradiation Conditions in Vietnam" Sustainability 13, no. 6: 3528. https://doi.org/10.3390/su13063528
APA StyleMinh, P. V., Le Quang, S., & Pham, M.-H. (2021). Technical Economic Analysis of Photovoltaic-Powered Electric Vehicle Charging Stations under Different Solar Irradiation Conditions in Vietnam. Sustainability, 13(6), 3528. https://doi.org/10.3390/su13063528