Abstract
Sand–clay mixtures can be encountered in both natural soils (e.g., residual soils, clay deposits and clinosols) and artificial fills. The method of utilising biopolymers in ground improvement for sand–clay mixtures has emerged recently. However, a full understanding of the strengthening effect of biopolymer-treated sand–clay mixtures has not yet been achieved due to a limited number of relevant studies. In this study, xanthan gum (XG), as one of the eco-friendly biopolymers, was used to treat reconstituted sand–clay mixtures that had various compositions in related to clay (or sand) content and clay type (kaolin and bentonite). A series of laboratory unconfined compression strength (UCS) tests were conducted to probe the performances of XG-treated sand–clay mixtures from two aspects, i.e., optimum treatment conditions (e.g., XG content and initial moisture content) to achieve the maximum strengthening effect and strengthening efficiency for the sand–clay mixtures with different compositions. The experimental results indicated that the optimum initial moisture content decreased as the sand content increased. The optimum XG content, which also decreased with the increasing sand content, remained approximately 3.75% for all sand–kaolin mixtures and 5.75% for all sand–bentonite mixtures if calculated based on clay fraction. While untreated sand–kaolin mixtures and sand–bentonite mixtures had comparable UCS values, XG-treated sand–kaolin mixtures seemed to have better improved mechanical strength due to higher ionic (or hydrogen) bonds with XG and low-swelling properties compared with bentonite. The deformation modulus of XG-treated sand–clay mixtures were positively related with UCS. The variation in UCS and stiffness for each treatment condition increased as the sand content was elevated for both sand-kaolin and sand-bentonite mixtures. An increment in the proportion of the heterogeneous composite formed by irregular sand particles conglomerated with the XG–clay matrix in total soil might be responsible for this phenomenon.
1. Introduction
Mechanical properties are key engineering properties of soils in geotechnical engineering practices. For those natural soils that have insufficient mechanical strength, soil treatment is often employed [1,2,3,4,5,6,7]. Recently, the incorporation of biopolymers into soil stabilisation has gained increasing credence in sustainable geotechnical engineering for their environmental benefits [8,9,10,11], high strengthening efficiency [12,13,14], abundance in nature [15,16,17], suitable functional properties such as pH stability and ionic salt compatibility [18,19,20] and reasonable prices [8,21,22]. Selected polysaccharide biopolymers (e.g., xanthan gum, agar gum, gellan gum, chitosan, beta-glucan, starch, guar gum and carrageenan) have proved their potential in improving the soil performances under external loads in terms of unconfined compression, triaxial compression, direct shear, interface shear, tension, three-point bending and split [20,23,24,25,26,27,28,29,30,31,32,33,34].
Although biopolymers are able to reinforce both fine-grained soils and coarse-grained soils, they have shown better strengthening effect in fine-grained soils [12,25,35,36]. For sands, biopolymer hydrogels become rigid fibres after drying and act as bridges to connect sand particles, leading to increased cohesion and improved mechanical strength [9,37]. For clays, along with these bridge connections, biopolymers interact directly with the clay particles through ionic bonds or hydrogen, which enhances strength improvement [10,12,23,35]. Furthermore, sand–clay mixtures have their mechanical strength more effectively enhanced by biopolymers than pure sands or clays [35].
Sand–clay mixtures are widely encountered in both natural soils, e.g., residual soils, marine deposits and clinosols [10,38,39] and artificial fills [40,41,42]. Their engineering characteristics mainly, on one hand, depend on clay mineralogy. For example, structural differences between high-swelling bentonite with solvated interlayer cations and low-swelling clay minerals leads to different ranges for Atterberg limit [43,44,45] which has a close relation with undrained shear strength [46,47,48,49]. Karakan and Demir [50] conducted the undrained shear strength tests on sand–clay mixtures and pointed out that sand–bentonite mixtures had higher undrained shear strength but a lower maximum dry density compared with sand–kaolin mixtures. Chang and Cho [35] predicted that sand–bentonite mixtures might need a higher biopolymer content for soil reinforcement than sand–kaolin mixtures due to the higher specific surfaces of bentonite. On the other hand, the mechanical performances of sand–clay mixtures are affected by the clay (or sand) content. Results from various experimental tests on sand with clay contents varying from 0 to 100% indicate that there exists transition (or threshold) fines content [51,52] which distinguishes between clay matrix-dominated behaviour and sand matrix-dominated behaviour. For the former, the shear strength of sand–clay mixtures increases with the increasing clay content [53,54]. For the latter, the shear strength either decreases for the specimens with larger relative density [55,56] or increases for the specimens with smaller relative density [54], with the increasing clay content. The transition fines content is not unique and varies from soil to soil, ranging from 20 to 35% and mainly depending on clay type, sand grading, initial condition and stress condition [39,52]. In addition, the compressibility [52,57,58], permeability [39,41,59], the Atterberg limit [38,60] and cone penetration [61,62] of sand–clay mixtures have also been investigated.
To the authors’ knowledge, the mechanical behaviours of sand–clay mixtures treated with biopolymers have not been comprehensively understood due to a limited number of relevant studies. To this end, laboratory tests have been conducted on xanthan gum (XG)-treated reconstituted soils made of sand and clay in this study. Two types of clays including kaolin and bentonite have been selected, as they have representative clay minerals in natural soils [10,23,42,63] and have been widely used to prepare reconstituted sand–clay mixtures [39,40,41,52,64,65]. The performances of XG-treated sand–clay mixtures have been probed from two aspects, i.e., optimum treatment conditions (e.g., xanthan gum content and initial moisture content) to achieve the optimum strengthening effect and strengthening efficiency for different soil compositions.
2. Materials and Methods
2.1. Components of Sand–Clay Mixtures
Fujian sand (a standard sand in Fujian Province, China), commercial white kaolin clay (Yangzhou, Jiangsu Province, China) and commercial bentonite clay (Xinyang, Henan Province, China) were used to produce sand–clay mixtures. The basic engineering properties of these soils are described as follows.
Sand has specific gravity Gs = 2.63, maximum void ratio emax = 0.815 and minimum void ratio emin = 0.613, respectively. Sieving test was conducted to obtain the sand grading property Dmax = 0.6 mm, D50 = 0.46 mm, coefficient of uniformity Cu = 1.44 and coefficient of curvature Cc = 0.96, based on which the sand can be described as poorly graded with relatively uniform particle size.
Kaolin clay has soil properties of PL = 17, LL = 31, Gs = 2.6, D50 = 47 μm, clay activity A = 0.93 and can be classified as CL according to the USCS classification. Bentonite clay (80% Ca-Montmorillonite) can be classified as CH according to the USCS classification, based on the soil properties of PL = 26, LL = 59, Gs = 2.5, D50 = 9 μm and A = 1.83.
2.2. Xanthan Gum
Xanthan gum (XG) is a polysaccharide formed by the fermentation of sugar (e.g., glucose or sucrose) with the involvement of the bacterium Xanthomonas campestris. XG was chosen to treat the sand–clay mixtures for its suitable functional properties, e.g., cold water dissolving capacity, pH stability, storage stability, ionic salt compatibility and pseudo-plastic flow characteristics [66,67]. The XG powder used in this study was produced by Shandong Fufeng Fermentation Co., Ltd., Fufeng County, Shandong Province, China.
2.3. Experimental Scheme and Sample Preparation
The sand–clay mixtures were obtained by blending kaolin or bentonite with sand at different mass ratios. For example, samples SK13, SK11 and SK31 were produced by setting kaolin fractions as 75% (mass ratio of sand to kaolin = 1:3), 50% (mass ratio of sand to kaolin = 1:1) and 25% (mass ratio of sand to kaolin = 3:1), respectively, while sample K represented pure kaolin. For each soil composition, five initial moisture contents were used. For pure kaolin (PL = 17) and bentonite (PL = 26), the initial moisture content w = 20% and w = 28% (the mass of water with respect to the mass of total solids, e.g., dry soil and XG) were employed as the minimum initial moisture contents for sample preparation, respectively, to allow strengthen improvement to occur [31]. Afterwards, the initial moisture content was increased at an interval of 2%. For sand–clay mixtures, the minimum initial moisture content was lowered taken into account the addition of sand fractions as shown in Table 1. Then, for a sand–clay mixture with given clay content and initial moisture content, five XG contents (the mass of dry XG powder mb with respect to the mass of dry soil ms, including sand and clay), e.g., mb/ms = 1%, 2%, 3%, 4% and 5%, were used. The test program for determining unconfined compression strength (UCS) is shown in Table 1.

Table 1.
Unconfined compression strength (UCS) test program.
The oven dried base soils (sand, kaolin and bentonite) were thoroughly mixed with XG, after which distilled water was added [25,29]. The sample preparation was in accordance with standard geotechnical testing method (GB/T 50123-2019, China). A homogeneous XG-soil substrate was obtained through a manual mixing and then placed inside a mounted cylindrical mould (39.1 mm diameter and 80 mm height) in three layers. For each layer, 25 blows were applied through a 305.5 g rammer dropping from a 247 mm height. The energy delivered by this compaction procedure was 577.7 kN·m/m3, which was slightly smaller than that from standard proctor compaction (600 kN·m/m3) in accordance with ASTM D698. After compaction, the samples were extruded out of the mould as shown in Figure 1 and cured in a controlled environment (60% relative humidity and 20 °C). A curing period of 14 days was adopted as the growth rate of mechanical strength was observed to be lowered after 14 days [12,23,68]. The UCS test were conducted under the strain-controlled condition at a loading rate of 1.5%/min in accordance with ASTM D2166 at the end of 14-day curing period. For each treatment condition, triplicates were measured to obtain average UCS values. It should be noted that it was difficult to obtain certain densities for all specimens with several XG contents, initial moisture contents and soil compositions. Therefore, all specimens were prepared at the maximum density according to their compaction as aforementioned, which was also adopted by [20]. For each treatment condition, the dry density was tested at the moment of sample preparation before curing. As shown in Table 2, there exists a range of dry density for each soil composition due to various XG contents and initial moisture contents.
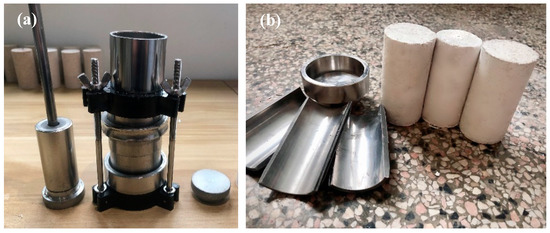
Figure 1.
Preparation of cylindrical xanthan gum (XG)-treated soil samples. (a) Compaction hammer, mounted three-petal mould before filling and accessory for extrusion. (b) Three-petal mould and prepared samples after extrusion.
Table 2.
Dry density of sand–clay mixtures.
3. Results and Discussion
3.1. Effect of Initial Moisture Content
The presentation of the stress–strain behaviours of XG-treated sand–clay mixtures under all five XG gum content (1%, 2%, 3%, 4% and 5%) might seem cumbersome, and therefore the typical curves of axial stress versus axial strain for the XG-treated soils made of kaolin and sand (K, SK13, SK11 and SK31) with a medium XG content (3%) are presented in Figure 2. Taking the sand–kaolin mixture (SK13) as an example, the uniaxial compression behaviour was gradually improved as the initial moisture content increased from 16 to 22%. Further increasing the amount of water for sample preparation seemed not to provide additional benefit. Ni et al. [31] has reported this phenomenon as well for a natural clayey soil in Shanghai, China. While insufficient water results in a poorly dissolved biopolymer hydrogel that adversely affects the workability of the biopolymer-soil matrix and its consequent mechanical strength [12,29], excessive water weakens the mechanical strength of biopolymer treated soils [35] due to excessive voids left behind in the biopolymer–soil matrix after drying. For the other three soils (K, SK11 and SK31) as shown in Figure 2, it was also observed that a proper initial moisture content contributed to the optimum strengthening effect. When the kaolin was replaced with the bentonite in the soil mixtures, a similar trend was found as shown in Figure 3.
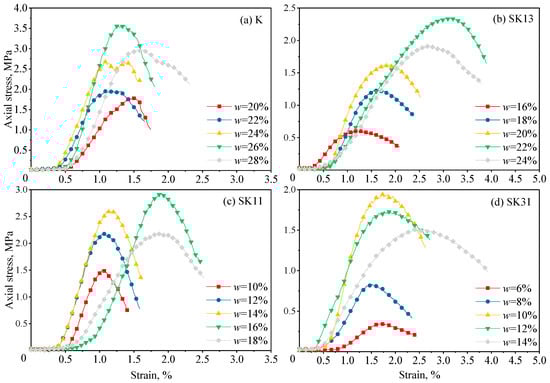
Figure 2.
Typical stress–strain behaviours of XG-treated sand–kaolin mixtures with various initial moisture contents (3% XG). (a) K (pure kaolin), (b) SK13 (mass ratio of sand to kaolin = 1:3), (c) SK11 (mass ratio of sand to kaolin = 1:1), (d) SK31 (mass ratio of sand to kaolin = 3:1).
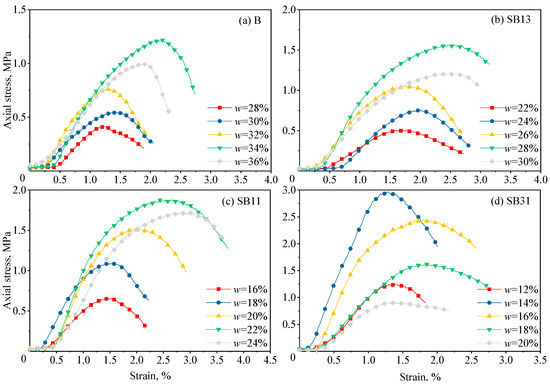
Figure 3.
Typical stress–strain behaviours of XG-treated sand–bentonite mixtures with various initial moisture contents (3% XG). (a) B (pure bentonite), (b) SB13 (mass ratio of sand to bentonite = 1:3), (c) SB11 (mass ratio of sand to bentonite = 1:1), (d) SB31 (mass ratio of sand to bentonite = 3:1).
The UCS variations of samples K, SK13, SK11 and SK31 are plotted against the initial moisture contents in Figure 4. For pure kaolin, a common trend of UCS was observed for 1% to 5% XG; i.e., there existed an identical optimum initial moisture content (OIMC), at which the samples had a maximum strength. For sand–kaolin mixtures, similar phenomena were observed although some divergence occurred; e.g., sample SK11 had OIMC of 14% for 1 to 2% XG and 16% for 3 to 5% XG, respectively. This OIMC divergence might be due to the variation of consistency of biopolymer–soil matrix. XG molecules have abundant hydrophilic groups (e.g., –OH and –COOH) and therefore are capable of attracting water molecules and retaining water [29,31,69,70,71]. As a result, elevating the XG content from 1 to 5% raised the amount of absorbed water that was needed to achieve the optimum reinforcing effect. Figure 5 shows the UCS variations of pure bentonite and sand–bentonite mixtures versus the initial moisture contents. Again, there also existed an OIMC corresponding to the optimum strengthening effect for a given soil composition.
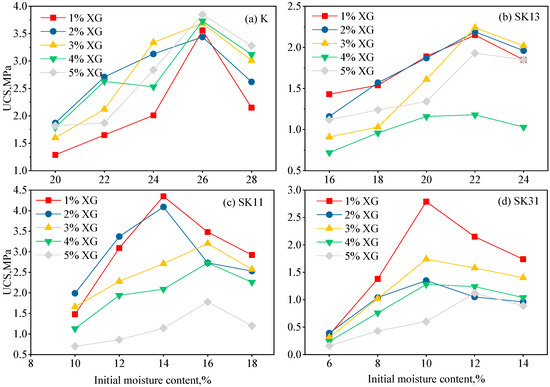
Figure 4.
Relationship of UCS versus initial moisture content for different XG contents (a) K (pure kaolin) (b) SK13 (mass ratio of sand to kaolin = 1:3) (c) SK11 (mass ratio of sand to kaolin = 1:1) (d) SK31 (mass ratio of sand to kaolin = 3:1).
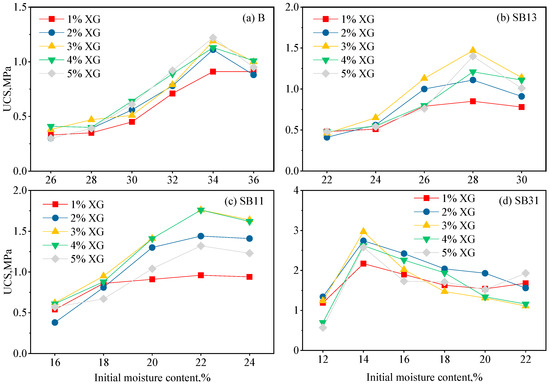
Figure 5.
Relationship of UCS versus initial moisture content for different XG contents. (a) B (pure bentonite), (b) SB13 (mass ratio of sand to bentonite = 1:3), (c) SB11 (mass ratio of sand to bentonite = 1:1), (d) SB31 (mass ratio of sand to bentonite= 3:1).
3.2. Effect of XG Content
The effect of XG content on the axial stress–axial strain relationship of pure kaolin and sand–kaolin mixtures is presented in Figure 6. While increasing the XG content increased the axial stress–axial strain curves of pure kaolin, it lowered those of sand–kaolin mixtures (e.g., SK11 and SK31). This phenomenon was also detected if kaolin was replaced with bentonite as shown in Figure 7.
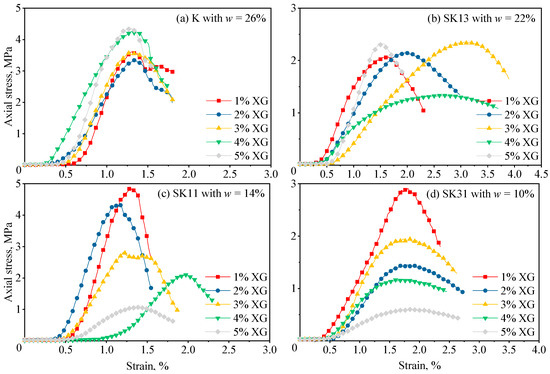
Figure 6.
Stress–strain relationships for the XG-treated sand–kaolin mixtures with various XG contents. (a) K (pure kaolin), (b) SK13 (mass ratio of sand to kaolin = 1:3), (c) SK11 (mass ratio of sand to kaolin = 1:1), (d) SK31 (mass ratio of sand to kaolin = 3:1).
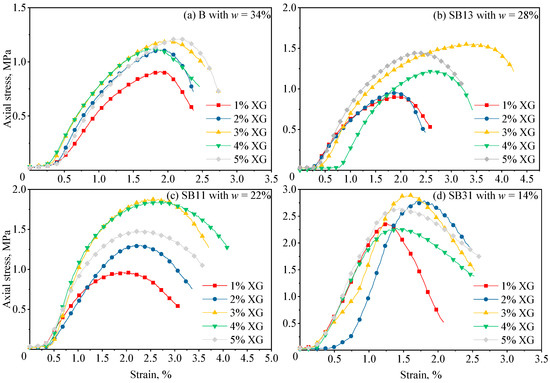
Figure 7.
Stress–strain relationships for the XG-treated sand–bentonite mixtures with various XG contents. (a) B (pure bentonite), (b) SB13 (mass ratio of sand to bentonite = 1:3), (c) SB11 (mass ratio of sand to bentonite = 1:1), (d) SB31 (mass ratio of sand to kaolin = 3:1).
Based on Figure 6 and Figure 7, the effect of the XG content on deformation modulus E50 for different sand–clay mixtures is shown in Figure 8. It is clear that sand–kaolin mixtures had greater values of E50 compared with sand–bentonite mixtures (except for SK31 and SB31). While sand–kaolin mixtures were more likely to have larger stiffness with a relatively low XG content (1% to 2% XG) as shown in Figure 8a, sand–bentonite mixtures tended to have larger stiffness with a relatively high XG content (4% to 5% XG) As shown in Figure 8b. Figure 9 shows the relationship of peak strain and XG content for different sand–clay mixtures. By observation, peak strain did not show a clear dependence on XG content. However, both sand-kaolin and sand-bentonite mixtures seemed to have higher peak strains with 25% sand content. In addition, sand–bentonite mixtures had slightly larger peak strains than sand–kaolin mixtures.
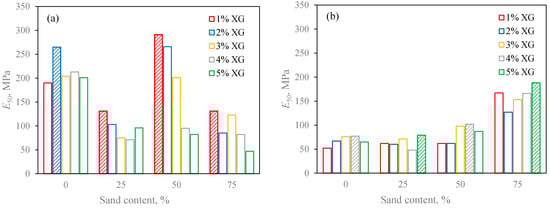
Figure 8.
Relationship of deformation modulus E50 versus sand content for different XG contents. (a) Sand–kaolin mixtures, (b) sand–bentonite mixtures.
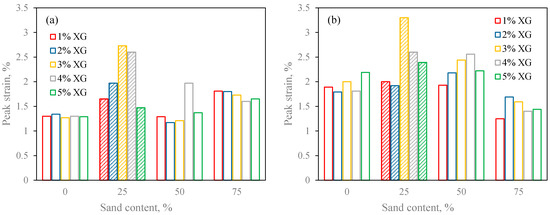
Figure 9.
Relationship of peak strain versus sand content for different XG contents. (a) Sand–kaolin mixtures, (b) sand–bentonite mixtures.
The UCS values of pure kaolin and sand–kaolin mixtures are plotted against the XG contents in Figure 10. It can be seen that the trends of UCS might be considered roughly the same for five initial moisture contents, given an identical soil composition. Pure kaolin seemed to gain strength as the XG content gradually increased from 1% to 5%, while sample SK31 with 25% clay content had a decreasing trend of UCS with the increasing XG content. For samples SK13 and SK11 with 75% and 50% clay contents, respectively, there seemed to be an optimum XG content between 1–5% XG leading to the maximum UCS. Figure 11 also indicates that the UCS variations with XG contents was identical to some extent for a given soil composition (or sand content) and diverged as the soil composition changed. As can be seen, there existed an optimum XG content for each soil composition. Excessive XG content might lead to either ionic repulsion or hydrological swelling [35] and impair the consequent strength improvement of the XG-treated sand–clay mixtures.
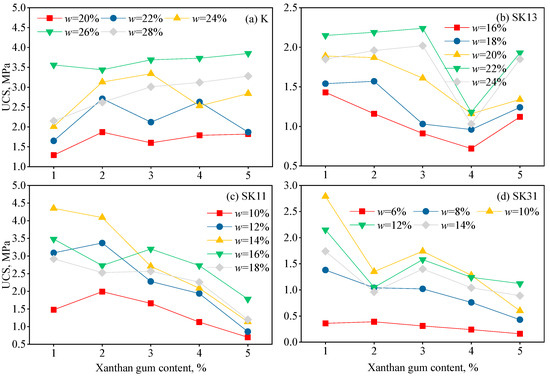
Figure 10.
Relationship between UCS and XG content for different initial moisture contents. (a) K (pure kaolin), (b) SK13 (mass ratio of sand to kaolin = 1:3), (c) SK11 (mass ratio of sand to kaolin = 1:1), (d) SK31 (mass ratio of sand to kaolin = 3:1).
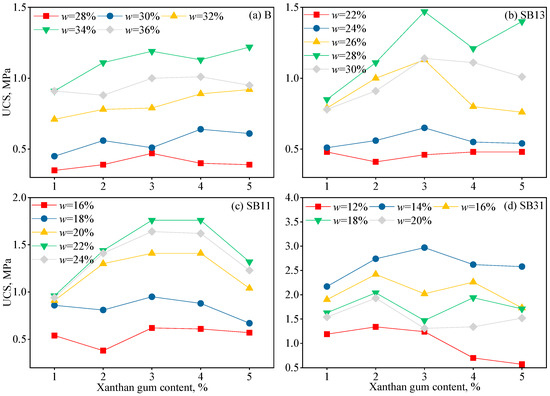
Figure 11.
Relationship between UCS and XG content for different initial moisture contents. (a) B (bentonite), (b) SB13 (mass ratio of sand to bentonite = 1:3), (c) SB11 (mass ratio of sand to bentonite = 1:1), (d) SB31(mass ratio of sand to bentonite = 3:1).
3.3. Optimum Treatment Conditions for Different Sand–Clay Mixtures
As mentioned above, the test results implied that there might be optimum treatment conditions (e.g., initial moisture content and XG content) for a given soil composition, under which the treated soil mixtures gained the optimum reinforcing effect. Figure 12a shows the OIMC for different soil mixtures. As the sand content increased, the OIMC had a decreasing trend. By comparison, the samples containing bentonite needed much more water than kaolin.
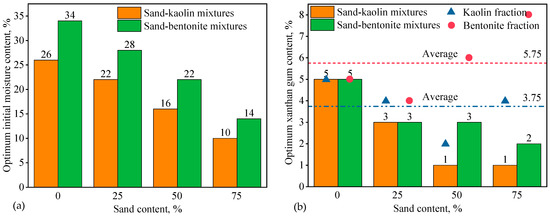
Figure 12.
(a) Optimum initial moisture content for different soil mixtures. (b) Optimum XG content for different soil mixtures.
Figure 12b shows the optimum XG content for different soil mixtures. Similar to Figure 12a, the optimum XG content decreased from 5% to 1% (or 2%) with the increasing sand content. Furthermore, the soil mixtures containing bentonite seemed to have a higher request of XG than kaolin. Alternatively, if the optimum XG content was calculated based on clay fraction alone defined as the mass of dry XG powder mb with respect to the mass of dry soil ms, including clay only, then fluctuation was observed. For convenience, two averages represented by dash lines are also shown in Figure 12b. The sand–kaolin mixtures had 3.75% optimum XG content based on clay fraction, which is similar to 4% reported by [35], while sand–bentonite mixtures had 5.75% optimum XG content.
3.4. Strengthening Efficiency for Different Sand–Clay Mixtures
Figure 13 shows the UCS comparison between untreated and XG-treated soils. The trends for untreated soils in Figure 13a,b show that the addition of 25% sand helped to slightly reinforce the pure fine-grained soils. Once the sand content exceeded 50%, the sand–clay mixtures suffered a reduction in UCS. The lowest strength was obtained at 75% sand content. On the other hand, although the sand–kaolin mixtures had higher UCS values than the sand–bentonite mixtures due to a much more condensed stacking layered structure as shown in Figure 14a,b, these values were comparable with the largest difference occurring between untreated SK11 (0.53 MPa) and untreated SB11 (0.39 MPa) by 35.89%.
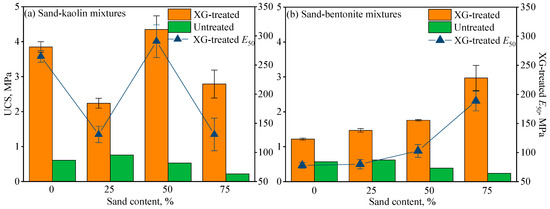
Figure 13.
Comparison of XG-treated and untreated soil mixtures. (a) Sand–kaolin mixtures, (b) sand–bentonite mixtures.
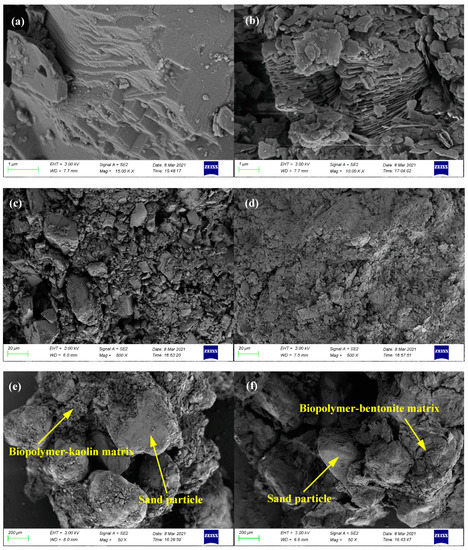
Figure 14.
SEM images of mb/ms = 1% xanthan gum-treated sand–clay mixtures. (a) K, 1 μm; (b) B, 1 μm; (c) K, 20 μm; (d) B, 20 μm; (e) SK31, 200 μm; (f) SB31, 200 μm.
By contrast, the XG-treated sand–kaolin mixtures and sand–bentonite mixtures had much more different values of UCS; e.g., treated K and SK11 had UCS values of 3.85 MPa and 4.35 MPa which were around three times and 2.5 times the UCS values of the treated B (1.22 MPa) and treated SK11 (1.76 MPa), respectively. However, the treated soil mixtures with 75% sand content (SK31 and SB31) had comparable UCS values of 2.79 MPa and 2.97 MPa. Furthermore, Figure 13a,b show different trends of UCS as the sand content increased. For sand–kaolin mixtures, the XG was mostly effective in reinforcing the mixed soil with 50% sand content, by increasing the UCS from 0.53 MPa to 4.35 MPa by 700%. While the sand–bentonite mixtures had a trend of strength ever increasing with the increasing sand content. In addition, the values of E50 for treated sand–clay mixtures are presented in Figure 13 as well, showing similar trend with UCS. This phenomenon is in accordance with the test result from [72], in which E50 is linearly correlated with UCS.
As can be seen from Figure 13, it is reasonable to conclude that XG might be more useful in reinforcing some particular fine soils, such as kaolin. This phenomenon might be explained as follows: Kaolin particles had higher edge charge and van der Waals force interaction than bentonite particles [45], and therefore the electrostatic interaction between the negative charged XG and the positive charged kaolin particles formed more well-bonded XG–clay matrix. On the other hand, the highly expendable nature of bentonite allowed the water molecules to enter the interlayer region [73,74]. Due to the hydrophilic property of XG, this water absorption behaviour was more remarkable for XG-treated soils than untreated soils. In summary, stronger ironic (or hydrogen) bonds between XG and kaolin and a more condensed microstructure made kaolin have better performances under XG treatment. An exception was found for SK31 and SB31. As can be seen in Figure 14e,f, xanthan gum did not directly interact with sand particle [35,75], while clay particles and xanthan gum monomers formed a well-bonded xanthan gum–clay matrix through hydrogen or ionic bonds [76,77]. Therefore, the strengthening behaviour of xanthan gum-treated sand–clay mixtures can be attributed to the formation of XG–clay matrix and the cumulation of XG-–clay matrix among sand particles. For SK31 and SB31 that had a sand content up to 75%, although the type of clay in XG–clay matrix had an effect on the strengthening efficiency, the mechanical strength would be largely controlled by the sand [53,54,78,79].
Despite the dissimilarity, there is a common phenomenon shown in Figure 13 for both sand–clay mixtures, in which the variation in UCS and stiffness for each treatment condition, represented by an error bar, increased as the sand content increased. Irregular and independent sand particles (Figure 14e,f) usually formed larger void spaces compared with fine particles (Figure 14c,d). After xanthan gum was added to the soil, the XG-clay matrix filled or partially filled these void spaces among sand particles. Along with water evaporation and drying, XG-clay matrix gradually precipitated and shrank, acting as bridges to provide connection between the individual sand particles. The composite formed by irregular sand particles conglomerated with XG-clay matrix had a higher strength. However, the bonding condition and pattern varied under the dry condition as can be seen Figure 14e,f, which is also confirmed by [37]. Therefore, the heterogeneous composite soil material resulted in variation in the mechanical behaviour of treated soils. For sand–clay mixtures, an increment in sand fraction increased the proportion of heterogeneous composite in total soil and therefore increased the variation in UCS and stiffness.
4. Conclusions
A series of UCS tests were carried out on the XG-treated sand–clay mixtures that contained different clay (or sand) contents and types of clay (e.g., kaolin and bentonite). Both XG contents and initial moisture contents varied so as to explore the optimum treatment conditions and strengthening efficiency for different soil mixtures. Some major conclusions were drawn, as follows:
- Both of the optimum XG content and optimum initial moisture content to achieve the maximum strengthening effect decreased as the sand content increased. However, the XG content, if calculated based on the clay fraction, seemed to be constant, i.e., approximately 3.75% and 5.75% for sand–kaolin mixtures and sand–bentonite mixtures, respectively.
- XG-treated sand–kaolinite mixtures had much more improved UCS compared with XG-treated sand–bentonite mixtures due to kaolin’s higher ionic (or hydrogen) bonds with XG and low-swelling properties.
- Both sand–kaolin mixtures and sand–bentonite mixtures tended to have more variation in UCS and stiffness as the sand fraction was elevated, which might be due to the increased proportion of the heterogeneous composite formed by irregular sand particles conglomerated with the XG–clay matrix in total soil.
Author Contributions
Conceptualization, J.N. and L.M.; investigation, G.-L.H., L.M. and J.-Q.C.; writing—original draft preparation, G.-L.H.; writing—review and editing, J.N. and X.-Y.G.; funding acquisition, J.N. and X.-Y.G. All authors have read and agreed to the published version of the manuscript.
Funding
This research was funded by National Natural Science Foundation of China, grant number 51608323, 51678319 and 51978533; European Union’s Horizon 2020 Framework program Marie Skłodowska-Curie Individual Fellowships, grant number 897701; Marie Skłodowska-Curie Actions Research and Innovation Staff Exchange (RISE), grant number 778360.
Institutional Review Board Statement
Not applicable.
Informed Consent Statement
Not applicable.
Data Availability Statement
Not applicable.
Acknowledgments
The work described in this paper was supported by the National Natural Science Foundation of China (51608323, 51678319, 51978533). In addition, this project has received funding from the European Union’s Horizon 2020 Framework programme Marie Skłodowska-Curie Individual Fellowships under grant agreement No. 897701 and Marie Skłodowska-Curie Actions Research and Innovation Staff Exchange (RISE) under grant agreement No. 778360.
Conflicts of Interest
The authors declare no conflict of interest.
References
- Dos Santos, A.; Consoli, N.; Baudet, B. The mechanics of fibre-reinforced sand. Géotechnique 2010, 60, 791–799. [Google Scholar] [CrossRef]
- Chai, J.; Horpibulsuk, S.; Shen, S.; Carter, J.P. Consolidation analysis of clayey deposits under vacuum pressure with horizontal drains. Geotext. Geomembr. 2014, 42, 437–444. [Google Scholar] [CrossRef]
- Latifi, N.; Rashid, A.S.A.; Siddiqua, S.; Horpibulsuk, S. Micro-structural analysis of strength development in low- and high swelling clays stabilized with magnesium chloride solution—A green soil stabilizer. Appl. Clay Sci. 2015, 118, 195–206. [Google Scholar] [CrossRef]
- Anagnostopoulos, C.A. Strength properties of an epoxy resin and cement-stabilized silty clay soil. Appl. Clay Sci. 2015, 114, 517–529. [Google Scholar] [CrossRef]
- Rashid, A.S.A.; Shahrin, M.I.; Horpibulsuk, S.; Hezmi, M.A.; Yunus, N.Z.M.; Borhamdin, S. Development of sustainable ma-sonry units from flood mud soil: Strength and morphology investigations. Constr. Build. Mater. 2017, 131, 682–689. [Google Scholar] [CrossRef]
- Geng, X.; Yu, H.-S. A large-strain radial consolidation theory for soft clays improved by vertical drains. Géotechnique 2017, 67, 1020–1028. [Google Scholar] [CrossRef]
- Morales, L.; Garzón, E.; Romero, E.; Sánchez-Soto, P. Microbiological induced carbonate (CaCO3) precipitation using clay phyllites to replace chemical stabilizers (cement or lime). Appl. Clay Sci. 2019, 174, 15–28. [Google Scholar] [CrossRef]
- Chang, I.; Im, J.; Cho, G.-C. Introduction of Microbial Biopolymers in Soil Treatment for Future Environmentally-Friendly and Sustainable Geotechnical Engineering. Sustainability 2016, 8, 251. [Google Scholar] [CrossRef]
- Chang, I.; Im, J.; Cho, G.-C. Geotechnical engineering behaviors of gellan gum biopolymer treated sand. Can. Geotech. J. 2016, 53, 1658–1670. [Google Scholar] [CrossRef]
- Latifi, N.; Horpibulsuk, S.; Meehan, C.L.; Abd Majid, M.Z.; Rashid, A.S.A. Xanthan gum biopolymer: An eco-friendly additive for stabilization of tropical organic peat. Environ. Earth Sci. 2016, 75, 825. [Google Scholar] [CrossRef]
- Chang, I.; Lee, M.; Tran, A.T.P.; Lee, S.; Kwon, Y.-M.; Im, J.; Cho, G.-C. Review on biopolymer-based soil treatment (BPST) technology in geotechnical engineering practices. Transp. Geotech. 2020, 24, 100385. [Google Scholar] [CrossRef]
- Chang, I.; Im, J.; Prasidhi, A.K.; Cho, G.-C. Effects of Xanthan gum biopolymer on soil strengthening. Constr. Build. Mater. 2015, 74, 65–72. [Google Scholar] [CrossRef]
- Fatehi, H.; Abtahi, S.M.; Hashemolhosseini, H.; Hejazi, S.M. A novel study on using protein based biopolymers in soil strengthening. Constr. Build. Mater. 2018, 167, 813–821. [Google Scholar] [CrossRef]
- Lee, S.; Chung, M.; Park, H.M.; Song, K.I.; Chang, I. Xanthan gum biopolymer as soil-stabilization binder for road construction using local soil in sri lanka. J. Mater. Civil Eng. 2019, 31, 06019012. [Google Scholar] [CrossRef]
- Brinchi, L.; Cotana, F.; Fortunati, E.; Kenny, J. Production of nanocrystalline cellulose from lignocellulosic biomass: Technology and applications. Carbohydr. Polym. 2013, 94, 154–169. [Google Scholar] [CrossRef] [PubMed]
- Khalil, H.P.S.A.; Saurabh, C.K.; Adnan, A.S.; Nurul Fazita, M.R.; Syakir, M.I.; Davoudpour, Y.; Rafatullah, M.; Abdullah, C.K.; Haafiz, M.K.M.; Dungani, R. A review on chitosan-cellulose blends and nanocellulose reinforced chitosan biocomposites: Properties and their applications. Carbohydr. Polym. 2016, 150, 216–226. [Google Scholar] [CrossRef]
- Ng, C.; So, P.; Lau, S.; Zhou, C.; Coo, J.; Ni, J. Influence of biopolymer on gas permeability in compacted clay at different densities and water contents. Eng. Geol. 2020, 272, 105631. [Google Scholar] [CrossRef]
- Leela, J.K.; Sharma, G. Studies on xanthan production from Xanthomonas campestris. Bioprocess Biosyst. Eng. 2000, 23, 687–689. [Google Scholar] [CrossRef]
- Hardacre, A.K.; Clark, S.M. The effect of hybrid and growing environment on the rheological properties of starch and flour from maize (Zea mays L.) grain dried at four temperatures. Int. J. Food Sci. Technol. 2006, 41, 144–150. [Google Scholar] [CrossRef]
- Ayeldeen, M.K.; Negm, A.M.; El Sawwaf, M.A. Evaluating the physical characteristics of biopolymer/soil mixtures. Arab. J. Geosci. 2016, 9, 1–13. [Google Scholar] [CrossRef]
- Ayeldeen, M.; Negm, A.; El-Sawwaf, M.; Kitazume, M. Enhancing mechanical behaviors of collapsible soil using two biopolymers. J. Rock Mech. Geotech. Eng. 2017, 9, 329–339. [Google Scholar] [CrossRef]
- Mendonça, A.; Morais, P.V.; Pires, A.C.; Chung, A.P.; Oliveira, P.V. A Review on the Importance of Microbial Biopolymers Such as Xanthan Gum to Improve Soil Properties. Appl. Sci. 2020, 11, 170. [Google Scholar] [CrossRef]
- Chang, I.; Cho, G. Strengthening of korean residual soil with β-1,3/1,6-glucan biopolymer. Constr. Build. Mater. 2012, 30, 30–35. [Google Scholar] [CrossRef]
- Khatami, H.R.; O’Kelly, B.C. Improving Mechanical Properties of Sand Using Biopolymers. J. Geotech. Geoenviron. Eng. 2013, 139, 1402–1406. [Google Scholar] [CrossRef]
- Chang, I.; Prasidhi, A.K.; Im, J.; Cho, G.-C. Soil strengthening using thermo-gelation biopolymers. Constr. Build. Mater. 2015, 77, 430–438. [Google Scholar] [CrossRef]
- Aguilar, R.; Nakamatsu, J.; Ramírez, E.; Elgegren, M.; Ayarza, J.; Kim, S.; Pando, M.A.; Ortega-San-Martin, L. The potential use of chitosan as a biopolymer additive for enhanced mechanical properties and water resistance of earthen construction. Constr. Build. Mater. 2016, 114, 625–637. [Google Scholar] [CrossRef]
- Chang, I.; Im, J.; Lee, S.-W.; Cho, G.-C. Strength durability of gellan gum biopolymer-treated Korean sand with cyclic wetting and drying. Constr. Build. Mater. 2017, 143, 210–221. [Google Scholar] [CrossRef]
- Nakamatsu, J.; Kim, S.; Ayarza, J.; Ramírez, E.; Elgegren, M.; Aguilar, R. Eco-friendly modification of earthen construction with carrageenan: Water durability and mechanical assessment. Constr. Build. Mater. 2017, 139, 193–202. [Google Scholar] [CrossRef]
- Muguda, S.; Booth, S.J.; Hughes, P.N.; Augarde, C.E.; Perlot, C.; Bruno, A.W.; Gallipoli, D. Mechanical properties of biopolymer-stabilised soil-based construction materials. Géotech. Lett. 2017, 7, 309–314. [Google Scholar] [CrossRef]
- Hataf, N.; Ghadir, P.; Ranjbar, N. Investigation of soil stabilization using chitosan biopolymer. J. Clean. Prod. 2018, 170, 1493–1500. [Google Scholar] [CrossRef]
- Ni, J.; Li, S.-S.; Ma, L.; Geng, X.-Y. Performance of soils enhanced with eco-friendly biopolymers in unconfined compression strength tests and fatigue loading tests. Constr. Build. Mater. 2020, 263, 120039. [Google Scholar] [CrossRef]
- Chen, C.; Wu, L.; Harbottle, M. Exploring the effect of biopolymers in near-surface soils using xanthan gum–modified sand under shear. Can. Geotech. J. 2020, 57, 1109–1118. [Google Scholar] [CrossRef]
- Lee, M.; Im, J.; Cho, G.-C.; Ryu, H.H.; Chang, I. Interfacial Shearing Behavior along Xanthan Gum Biopolymer-Treated Sand and Solid Interfaces and Its Meaning in Geotechnical Engineering Aspects. Appl. Sci. 2020, 11, 139. [Google Scholar] [CrossRef]
- Sujatha, E.R.; Atchaya, S.; Sivasaran, A.; Keerdthe, R.S. Enhancing the geotechnical properties of soil using xanthan gum—An eco-friendly alternative to traditional stabilizers. Bull. Int. Assoc. Eng. Geol. 2021, 80, 1157–1167. [Google Scholar] [CrossRef]
- Chang, I.; Cho, G.-C. Shear strength behavior and parameters of microbial gellan gum-treated soils: From sand to clay. Acta Geotech. 2019, 14, 361–375. [Google Scholar] [CrossRef]
- Buchmann, C.; Steinmetz, Z.; Brax, M.; Peth, S.; Schaumann, G.E. Effect of matric potential and soil-water-hydrogel interactions on biohydrogel-induced soil microstructural stability. Geoderma 2020, 362, 114142. [Google Scholar] [CrossRef]
- Chen, C.; Wu, L.; Perdjon, M.; Huang, X.; Peng, Y. The drying effect on xanthan gum biopolymer treated sandy soil shear strength. Constr. Build. Mater. 2019, 197, 271–279. [Google Scholar] [CrossRef]
- Yin, J. Properties and behaviour of Hong Kong marine deposits with different clay contents. Can. Geotech. J. 1999, 36, 1085–1095. [Google Scholar] [CrossRef]
- Deng, Y.; Wu, Z.; Cui, Y.; Liu, S.; Wang, Q. Sand fraction effect on hydro-mechanical behavior of sand-clay mixture. Appl. Clay Sci. 2017, 135, 355–361. [Google Scholar] [CrossRef]
- Graham, J.; Saadat, F.; Gray, M.N.; Dixon, D.A.; Zhang, Q.-Y. Strength and volume change behaviour of a sand–bentonite mixture. Can. Geotech. J. 1989, 26, 292–305. [Google Scholar] [CrossRef]
- Boutin, C.; Kacprzak, G.; Thiep, D. Compressibility and permeability of sand-kaolin mixtures. Experiments versus non-linear homogenization schemes. Int. J. Numer. Anal. Methods Géoméch. 2010, 35, 21–52. [Google Scholar] [CrossRef]
- Wang, S.; Zhu, W.; Fei, K.; Xu, C.; Zhang, N. Study on non-darcian flow sand-clay mixtures. Appl. Clay Sci. 2018, 151, 102–108. [Google Scholar] [CrossRef]
- Garzón, L.X.; Caicedo, B.; Sánchez-Silva, M.; Phoon, K.K. Physical modelling of soil uncertainty. Int. J. Phys. Model. Geotech. 2015, 15, 19–34. [Google Scholar] [CrossRef]
- Spagnoli, G.; Stanjek, H.; Sridharan, A. Some observations considering undrained shear strength, liquidity index, and flu-id/solid ratio of mono-mineralic clays with water–ethanol mixtures. Can. Geotech. J. 2018, 55, 1048–1053. [Google Scholar] [CrossRef]
- Chang, I.; Kwon, Y.-M.; Im, J.; Cho, G.-C. Soil consistency and interparticle characteristics of xanthan gum biopolymer–containing soils with pore-fluid variation. Can. Geotech. J. 2019, 56, 1206–1213. [Google Scholar] [CrossRef]
- Skemption, A.W.; Northey, R.D. The Sensitivity of Clays. Géotechnique 1952, 3, 30–53. [Google Scholar] [CrossRef]
- Wroth, C.P.; Wood, D.M. The correlation of index properties with some basic engineering properties of soils. Can. Geotech. J. 1978, 15, 137–145. [Google Scholar] [CrossRef]
- Yılmaz, I. Evaluation of shear strength of clayey soils by using their liquidity index. Bull. Int. Assoc. Eng. Geol. 2000, 59, 227–229. [Google Scholar] [CrossRef]
- Kuriakose, B.; Abraham, B.M.; Sridharan, A.; Jose, B.T. Water Content Ratio: An Effective Substitute for Liquidity Index for Prediction of Shear Strength of Clays. Geotech. Geol. Eng. 2017, 35, 1577–1586. [Google Scholar] [CrossRef]
- Karakan, E.; Demir, S. Effect of fines content and plasticity on undrained shear strength of quartz-clay mixtures. Arab. J. Geosci. 2018, 11, 1–12. [Google Scholar] [CrossRef]
- Skempton, A.W. Residual strength of clays in landslides, folded strata and the laboratory. Géotechnique 1985, 35, 3–18. [Google Scholar] [CrossRef]
- Monkul, M.M.; Ozden, G. Compressional behavior of clayey sand and transition fines content. Eng. Geol. 2007, 89, 195–205. [Google Scholar] [CrossRef]
- Vallejo, L.E.; Mawby, R. Porosity influence on the shear strength of granular material–clay mixtures. Eng. Geol. 2000, 58, 125–136. [Google Scholar] [CrossRef]
- Kim, U.; Kim, D.; Zhuang, L. Influence of fines content on the undrained cyclic shear strength of sand–clay mixtures. Soil Dyn. Earthq. Eng. 2016, 83, 124–134. [Google Scholar] [CrossRef]
- Abedi, M.; Yasrobi, S.S. Effects of plastic fines on the instability of sand. Soil Dyn. Earthq. Eng. 2010, 30, 61–67. [Google Scholar] [CrossRef]
- Karabash, Z.; Cabalar, A.F. Effects of sand grains shape on the behaviour of sand-clay mixtures. Geotech. Eng. Infrastruct. Dev. 2015, 6, 3117–3121. [Google Scholar]
- Cabalar, A.; Hasan, R. Compressional behaviour of various size/shape sand–clay mixtures with different pore fluids. Eng. Geol. 2013, 164, 36–49. [Google Scholar] [CrossRef]
- Chu, C.; Wu, Z.; Deng, Y.; Chen, Y.; Wang, Q. Intrinsic compression behavior of remolded sand–clay mixture. Can. Geotech. J. 2017, 54, 926–932. [Google Scholar] [CrossRef]
- Shi, X.S.; Yin, J. Estimation of hydraulic conductivity of saturated sand-marine clay mixtures with a homogenization approach. Int. J. Geomech. 2018, 18, 04018082. [Google Scholar] [CrossRef]
- Kumar, G.V.; Wood, D.M. Fall cone and compression tests on clay±gravel mixtures. Géotechnique 1999, 49, 727–739. [Google Scholar] [CrossRef]
- Suzuki, Y.; Lehane, B.M. Cone penetration at variable rates in kaolin–sand mixtures. Int. J. Phys. Model. Geo. 2015, 15, 1–11. [Google Scholar] [CrossRef]
- Awad, M.; Sasanakul, I. Centrifuge modelling of cone penetration tests in unsaturated clayey sand under various hydraulic conditions. Int. J. Phys. Model. Geotech. 2020, 1–14. [Google Scholar] [CrossRef]
- Eisazadeh, A.; Kassim, K.A.; Nur, H. Morphology and BET surface area of phosphoric acid stabilized tropical soils. Eng. Geol. 2013, 154, 36–41. [Google Scholar] [CrossRef]
- Chu, J.; Leong, W.K. Effect of fines on instability behaviour of loose sand. Géotechnique 2002, 52, 751–755. [Google Scholar] [CrossRef]
- Watabe, Y.; Yamada, K.; Saitoh, K. Hydraulic conductivity and compressibility of mixtures of Nagoya clay with sand or bentonite. Géotechnique 2011, 61, 211–219. [Google Scholar] [CrossRef]
- Barrére, G.C.; Barber, C.E.; Daniels, M.J. Molecular cloning of genes involved in the production of the extracellular poly-saccharide xanthan by xanthomonas campestris pv. campestris. Int. J. Biol. Macromol. 1986, 8, 372–374. [Google Scholar] [CrossRef]
- Rosalam, S.; England, R. Review of xanthan gum production from unmodified starches by Xanthomonas comprestris sp. Enzym. Microb. Technol. 2006, 39, 197–207. [Google Scholar] [CrossRef]
- Lekha, B.M.; Sarang, G.; Shankar, A.U.R. Effect of Electrolyte Lignin and Fly Ash in Stabilizing Black Cotton Soil. Transp. Infrastruct. Geotechnol. 2015, 2, 87–101. [Google Scholar] [CrossRef]
- García-Ochoa, F.; Santos, V.; Casas, J.; Gómez, E. Xanthan gum: Production, recovery, and properties. Biotechnol. Adv. 2000, 18, 549–579. [Google Scholar] [CrossRef]
- Ham, S.M.; Chang, I.; Noh, D.H.; Kwon, T.H.; Muhunthan, B. Improvement of surface erosion resistance of sand by microbial biopolymer formation. J. Geotech. Geoenviron. 2018, 144, 06018004. [Google Scholar] [CrossRef]
- Orta, M.D.M.; Martín, J.; Santos, J.L.; Aparicio, I.; Medina-Carrasco, S.; Alonso, E. Biopolymer-clay nanocomposites as novel and ecofriendly adsorbents for environmental remediation. Appl. Clay Sci. 2020, 198, 105838. [Google Scholar] [CrossRef]
- Liu, Y.; Chang, M.; Wang, Q.; Wang, Y.; Liu, J.; Cao, C.; Zheng, W.; Bao, Y.; Rocchi, I. Use of Sulfur-Free Lignin as a novel soil additive: A multi-scale experimental investigation. Eng. Geol. 2020, 269, 105551. [Google Scholar] [CrossRef]
- Biswas, B.; Chakraborty, A.; Sarkar, B.; Naidu, R. Structural changes in smectite due to interaction with a biosurfac-tant-producing bacterium Pseudoxanthomonas kaohsiungensis. Appl. Clay. Sci. 2017, 136, 51–57. [Google Scholar] [CrossRef]
- Li, G.L.; Zhou, C.H.; Fiore, S.; Yu, W.H. Interactions between microorganisms and clay minerals: New insights and broader applications. Appl. Clay Sci. 2019, 177, 91–113. [Google Scholar] [CrossRef]
- Wen, K.; Li, Y.; Huang, W.; Armwood, C.; Amini, F.; Li, L. Mechanical behaviors of hydrogel-impregnated sand. Constr. Build. Mater. 2019, 207, 174–180. [Google Scholar] [CrossRef]
- Laird, D.A. Bonding between Polyacrylamide and Clay Mineral Surfaces. Soil Sci. 1997, 162, 826–832. [Google Scholar] [CrossRef]
- Nugent, R.A.; Zhang, G.; Gambrell, R.P. Effect of Exopolymers on the Liquid Limit of Clays and Its Engineering Implications. Transp. Res. Rec. J. Transp. Res. Board 2009, 2101, 34–43. [Google Scholar] [CrossRef]
- Georgiannou, V.N.; Burland, J.B.; Hight, D.W. The undrained behaviour of clayey sands in triaxial compression and extension. Géotechnique 1990, 40, 431–449. [Google Scholar] [CrossRef]
- Pitman, T.D.; Robertson, P.K.; Sego, D.C. Influence of fines on the collapse of loose sands. Can. Geotech. J. 1994, 31, 728–739. [Google Scholar] [CrossRef]


Publisher’s Note: MDPI stays neutral with regard to jurisdictional claims in published maps and institutional affiliations. |
© 2021 by the authors. Licensee MDPI, Basel, Switzerland. This article is an open access article distributed under the terms and conditions of the Creative Commons Attribution (CC BY) license (http://creativecommons.org/licenses/by/4.0/).