Article

Deciphering the Effects of Waste Amendments on Particulate Organic Carbon and Soil C-Mineralization Dynamics

1
Shanghai Academy of Landscape Architecture Science and Planning, Shanghai 200232, China
2
Shanghai Engineering Research Center of Landscaping on Challenging Urban Sites, Shanghai 200232, China
*
Author to whom correspondence should be addressed.
Sustainability 2021, 13(7), 3790; https://doi.org/10.3390/su13073790
Submission received: 4 February 2021 / Revised: 24 March 2021 / Accepted: 24 March 2021 / Published: 29 March 2021

Abstract

:
It is important to understand the dynamics of soil carbon to study the effects of waste amendment inputs on soil organic carbon decomposition. The aim of this study was to evaluate the effect of waste amendment carbon input on the soil organic carbon (SOC) content, soil particulate organic carbon (POC) content and soil organic carbon mineralization rate dynamics. A 60-day experiment was carried out in the laboratory. The following treatments were compared: (1) CK: soil without amendments; (2) FW1: soil with food waste compost (soil/food waste compost = 100:1); (3) FW2: soil with food waste compost (soil/food waste compost = 100:2); (4) GW1: soil with garden waste compost (soil/garden waste compost = 100:0.84); (5) GW2: soil with garden waste compost (soil/garden waste compost = 100:1.67); (6) FGW1: soil amendments mixture (soil/food waste compost/garden waste compost = 100:0.5:0.42); (7) FGW2: soil amendments mixture (soil/food waste compost/garden waste compost = 100:1:0.84); the inputs of amendment carbon to FW1, GW1 and FGW1 were 2.92 g kg−1, the inputs of amendment carbon to FW2, GW2 and FGW2 were 5.84 g kg−1. The results showed that the addition of waste amendments increased the amount of cumulative mineralization from 95% to 262% and accelerated the rate of soil mineralization. After adding organic materials, the change in the soil organic carbon mineralization rate could be divided into two stages: the fast stage and the slow stage. The dividing point of the two stages was approximately 10 days. When equal amounts of waste amendment carbon were input to the soil, there was no significant difference in SOC between food waste and garden waste. However, SOC increased with the amount of amendment addition. However, for POC, there was no significant difference between the different amounts of carbon input to the garden waste compost treatments. SOC and POC were significantly correlated with the cumulative emissions of CO2.

1. Introduction

With the rapid expansion of cities, food waste and garden waste have become the two main organic wastes that affect the urban ecological environment. The production of food waste in China is about 500,000 tons every day. Meanwhile, approximately 5 million tons of garden waste are generated in China each year [1]. At present, the rate of harmless treatment of food waste and garden waste is low. Improper handling can cause environmental pollution and disease spread, and there are few resource-based applications of these organic waste, which has become a major obstacle to carbon emission reduction in the new century. Therefore, if these large amounts of organic waste are disposed of arbitrarily without taking effective measures, it will not only affect the appearance of the city but also cause different degrees of environmental pollution [2,3]. At present, China has issued a series of policies intended to use food waste compost and garden waste for soil quality improvement [4].
However, at present, most studies still focus on the impact of agricultural waste compost products on soil quality. Straw compost products are the most common exogenous carbon additives, the garden waste compost products are similar to straw, and both come from plant materials. Returning straw to the field and litter to the forest were effective for increasing the soil organic carbon (SOC) [5], and soil total organic carbon and labile organic carbon fraction contents were significantly affected by straw returns and were higher under straw return treatments than under non-straw return at three depths (0–7 cm, 7–14 cm and 14–21 cm) [6]. Kubar et al. [7] indicated that straw return enhanced the relative contents of O-alkyl C, carbonyl C, alkyl C, the A/O-A ratio and aromaticity. Miao et al. [8] found that litter addition enhanced soil dissolved organic carbon and microbial biomass carbon and nitrogen most likely due to the increased decomposition of old soil carbon, although litter addition had no effects on SOC and total nitrogen. However, Wang et al. [9] found that increasing litter inputs caused a significant increase in SOC in pine forests, whereas an insignificant negative effect was simulated in broadleaf forests. D’Orazio et al. [10] found that Pinus halepensis L. and mixed Quercus trojana Webb. and Quercus ilex L. species that are in a protected forest area of southern Italy under different plant covers promote carbon accumulation and stock in the underlying soils due to a greater decomposition of their litter. Above all, straw returning to the field in agriculture and litter returning to the forest in forestry play an important role in the improvement of SOC and organic carbon fractions. Thus, the effects of garden waste on the improvement of SOC, organic carbon components and soil mineralization in greenland soil remain unclear. The physical and chemical characteristics of food waste are high moisture and high organic matter content [11]. The application of food waste compost significantly improved the soil total organic carbon and migration of SOC from the surface in deep orchard soil [12]. The treatment of soil with food waste compost could significantly improve the SOC level and the stability of soil aggregates [13]. Yang et al. [14] found that food waste treatments had the greatest numbers of bacteria, fungi and actinomycetes in soils and that the shoot biomass, fruit diameter and fruit yield of tomatoes increased by 40.0% compared to soil without amendments (CK). Jo et al. [15] found that the content of 15% food waste compost gave the highest antler-type fruiting body yield, which was 44% higher than the yield of the control treatment. However, few studies have examined the effect of food waste compost on particulate organic carbon and soil C-mineralization dynamics.
Therefore, a detailed analysis on the accumulation and mineralization of SOC after different waste amendment additions is needed to instruct the application of organic waste in greenland soil. It was thus hypothesized that waste amendment input could not only increase the SOC contents and POC content but also increase the mineralization rate of SOC; however, the effects of different waste amendment input on SOC may vary due to large variations in the amount and type of the organic material. The objectives of this study were (1) to evaluate the accumulation of waste amendment carbon in greenland soil and (2) to assess waste amendment mineralization dynamics in soil.

2. Materials and Methods

2.1. Materials

The test soil was sampled from Shanghai, China with the soil sampling point located at the Shanghai Academy of Landscape Architecture Science and Planning (31°9′ N, 121°26′ E). In a 20 square meter greenland, 5 points were selected according to an S-shaped distribution. After removing the debris on the surface of the sampling points, 5 kg topsoil (0~20 cm) were collected at each sampling point, and then the samples from all 5 points were mixed. The soil samples were taken back to the laboratory for natural air drying, and the stones, plant residues and other materials were removed. The soil samples were pulverized and sieved through a 2 mm mesh. The soil type was typical calcareous alluvial soil, and the chemical properties of the study soil are given in Table 1. Food waste compost was made of food waste composted with 15% sawdust and 10% black carbon for 6 months. At this time, the maturity index of the compost product was 3, and the product reached maturity. The garden waste compost was made of garden waste (such as dead branches, fallen leaves, grass clippings and flowers) composted with 10% dried cow dung for 6 months. The chemical properties of food waste compost and garden waste are given in Table 1.
After the two waste amendment samples were pulverized and sieved through a 2 mm mesh, they were added and mixed with the soil. The organic carbon was added at 2 levels (2.92 g kg−1 and 5.84 g kg−1) for each amendment, the experimental design included 7 treatments: (1) CK: soil without amendments; (2) FW1: soil with food waste (soil/food waste = 100:1); (3) FW2: soil with food waste (soil/food waste = 100:2); (4) GW1: soil with garden waste (soil/garden waste = 100:0.84); (5) GW2: soil with garden waste (soil/garden waste = 100:1.67); (6) FGW1: soil amendments mixture (soil/food waste:garden waste = 100:0.5:0.42); (7) FGW2: soil amendments mixture (soil/food waste:garden waste = 100:1:0.84), the input of amendment carbon at FW1, GW1 and FGW1 was 2.92 g kg−1 and the input of amendment carbon at FW2, GW2 and FGW2 was 5.84 g kg−1. There were three replicates per treatment (Table 2). The experiment was carried out under laboratory incubation for 60 days.

2.2. Soil Incubation Experiment

800 g soil sample with waste amendments of different added proportions were mixed and put into a 1 L beaker: The addition of amendment carbon at FW1, GW1 and FGW1 was 2.34 g (800 g soil × 2.92 g kg−1, Table 2) and the addition of amendment carbon at FW2, GW2 and FGW2 was 4.68 g (800 g soil × 5.84 g kg−1, Table 2). The soil moisture content of all treatments was maintained at 65% water-holding capacity, and the samples were incubated at room temperature (25 ± 1 °C) during the incubation period. Each treatment was properly mixed to ensure homogeneity and 60 g samples were taken for analysis at days 1, 3, 5, 8, 12, 18, 26, 36, 48 and 60. Samples were air-dried naturally and pulverized and sieved through a 2 mm mesh, and then the soil was used to analyze the organic carbon content and particulate organic carbon (POC) content of the soil.

2.3. Soil Mineralization Experiment

The soil mineralization experiment performed measurements at 1, 3, 5, 8, 12, 18, 26, 36, 48 and 60 days, the same as the soil incubation experiment. Soil mineralization was determined according to the following procedure: 10.0 g of soil sample and waste amendment material of different added proportions were mixed and placed in a 250 mL glass tissue culture bottle. Next, the moisture content was adjusted with distilled water to 65% of the field water capacity. The small glass bottle containing 5 mL of 0.5 N sodium hydroxide solution was carefully placed in the tissue culture flask, sealed and placed in a biochemical incubator at 25 ± 1 °C for 60 days at a constant temperature, and all treatments were repeated 3 times. During the cultivation process, the soil moisture content was calibrated regularly by a weighing method. At 1, 3, 5, 8, 12, 18, 26, 36, 48 and 60 days, the small glass bottle containing sodium hydroxide 0.5 N solution was exchanged for a new bottle, and then the experiment continued. Emission of CO2 during the incubation period captured by the sodium hydroxide 0.5 N solution was precipitated by 2 mL of 1 N BaCl2. The amount of sodium hydroxide remaining in the solution was titrated with 0.5 N hydrochloric acid (HCl) in the presence of phenolphthalein [16]. Meanwhile, 3 tissue culture bottles without soil samples in the corresponding container were set as blank controls. The difference in the values observed between each of the treatments (soil amendment mixture) and the control (without soil) was considered as the amount of CO2 coming from the soil amendments or soil. A soil mineralization experimental device diagram is given in Figure 1.

2.4. Determination of Soil Properties, SOC and POC

The pH and EC of the soils and waste amendment materials were measured in a 1:2.5 and 1:5 (m v−1) soil/distilled water suspensions with a pH meter and EC meter, respectively. SOC was determined by the potassium dichromate–external heating oxidation method [17]. Determination of total nitrogen in the soil was performed by a Kjeldahl instrument. The soil particulate organic carbon content was determined according to the following procedure [18]: 10.0 g of soil sample was sieved through a 2 mm mesh with waste amendments was mixed in a 100 mL centrifuge tube and dispersed in 50 mL of sodium hexametaphosphate solution (5 g L−1). After 3 min of manual shaking, the soil suspension was shaken for 18 h by a horizontal shaker at a speed of 90 rpm and then passed through 53 µm sieves. The sieves were washed repeatedly with distilled water, and all the soil left on the sieves was collected and weighed after oven-drying at 60 °C. The particulate organic carbon content in the oven-dried sample was determined using the improved potassium dichromate–external heating method.

2.5. Data Process

Amendment carbon utilization rate:
Carbon utilization rate (%) = (Cb − Ca)/Cinput
In the formula, Cb is the amount of soil organic carbon in the amendment addition treatments at 60 days, Ca is the amount of soil organic carbon of CK at 60 days and Cinput is the initial amendment carbon input.
Mineralization amount of soil organic carbon:
CO2-C (mg kg−1) = 1/2 × CHCl × (V0 − V) × 12/m
In the formula, CHCl is the concentration of hydrochloric acid (mol L−1), V0 is the blank titration value (mL), V is the volume of hydrochloric acid consumed (mL) and m is the dry soil and waste amendment weight (g).
The cumulative emission of CO2-C (mg kg−1) refers to the total amount of soil CO2-C released from the beginning of incubation to a certain time point.
The mineralization rate of soil organic carbon:
CO2-C (mg kg−1 d−1) = mineralization amount of organic carbon under incubation time (CO2-C(mg kg−1))/incubation time.
The following kinetic models were used to describe C mineralization [19]:
Single-index model: Ct = C0 × (1-e−kt)
Two-index model: Ct = C1 × (1-e−kt) + C2 × (1-e−ht)
Ct represents the cumulative C mineralized after time t (mg kg−1), C0 represents the potentially mineralizable carbon (mg kg−1), C1 represents the easily mineralizable carbon (mg kg−1), C2 represents the slowly mineralizable carbon (mg kg−1), k represents the rate constant of the fast mineralization C (mg day−1), h represents the rate constant of the slow mineralization C (mg day−1) and t represents the mineralization time (days).

2.6. Statistical Analyses

Statistical analysis of data and analysis of variance were performed using SAS 9.2 (SAS Institute Inc, Cary, NC, USA), and data were analyzed using a one-way ANOVA followed by Duncan’s test (p < 0.05) as a post hoc test to detect statistically significant differences among all treatments. Plotting was performed with Origin 8.5 software (OriginLab Corporation, Northampton, MA, USA).

3. Results

3.1. Effect of Different Amounts of Waste Amendments on SOC and POC

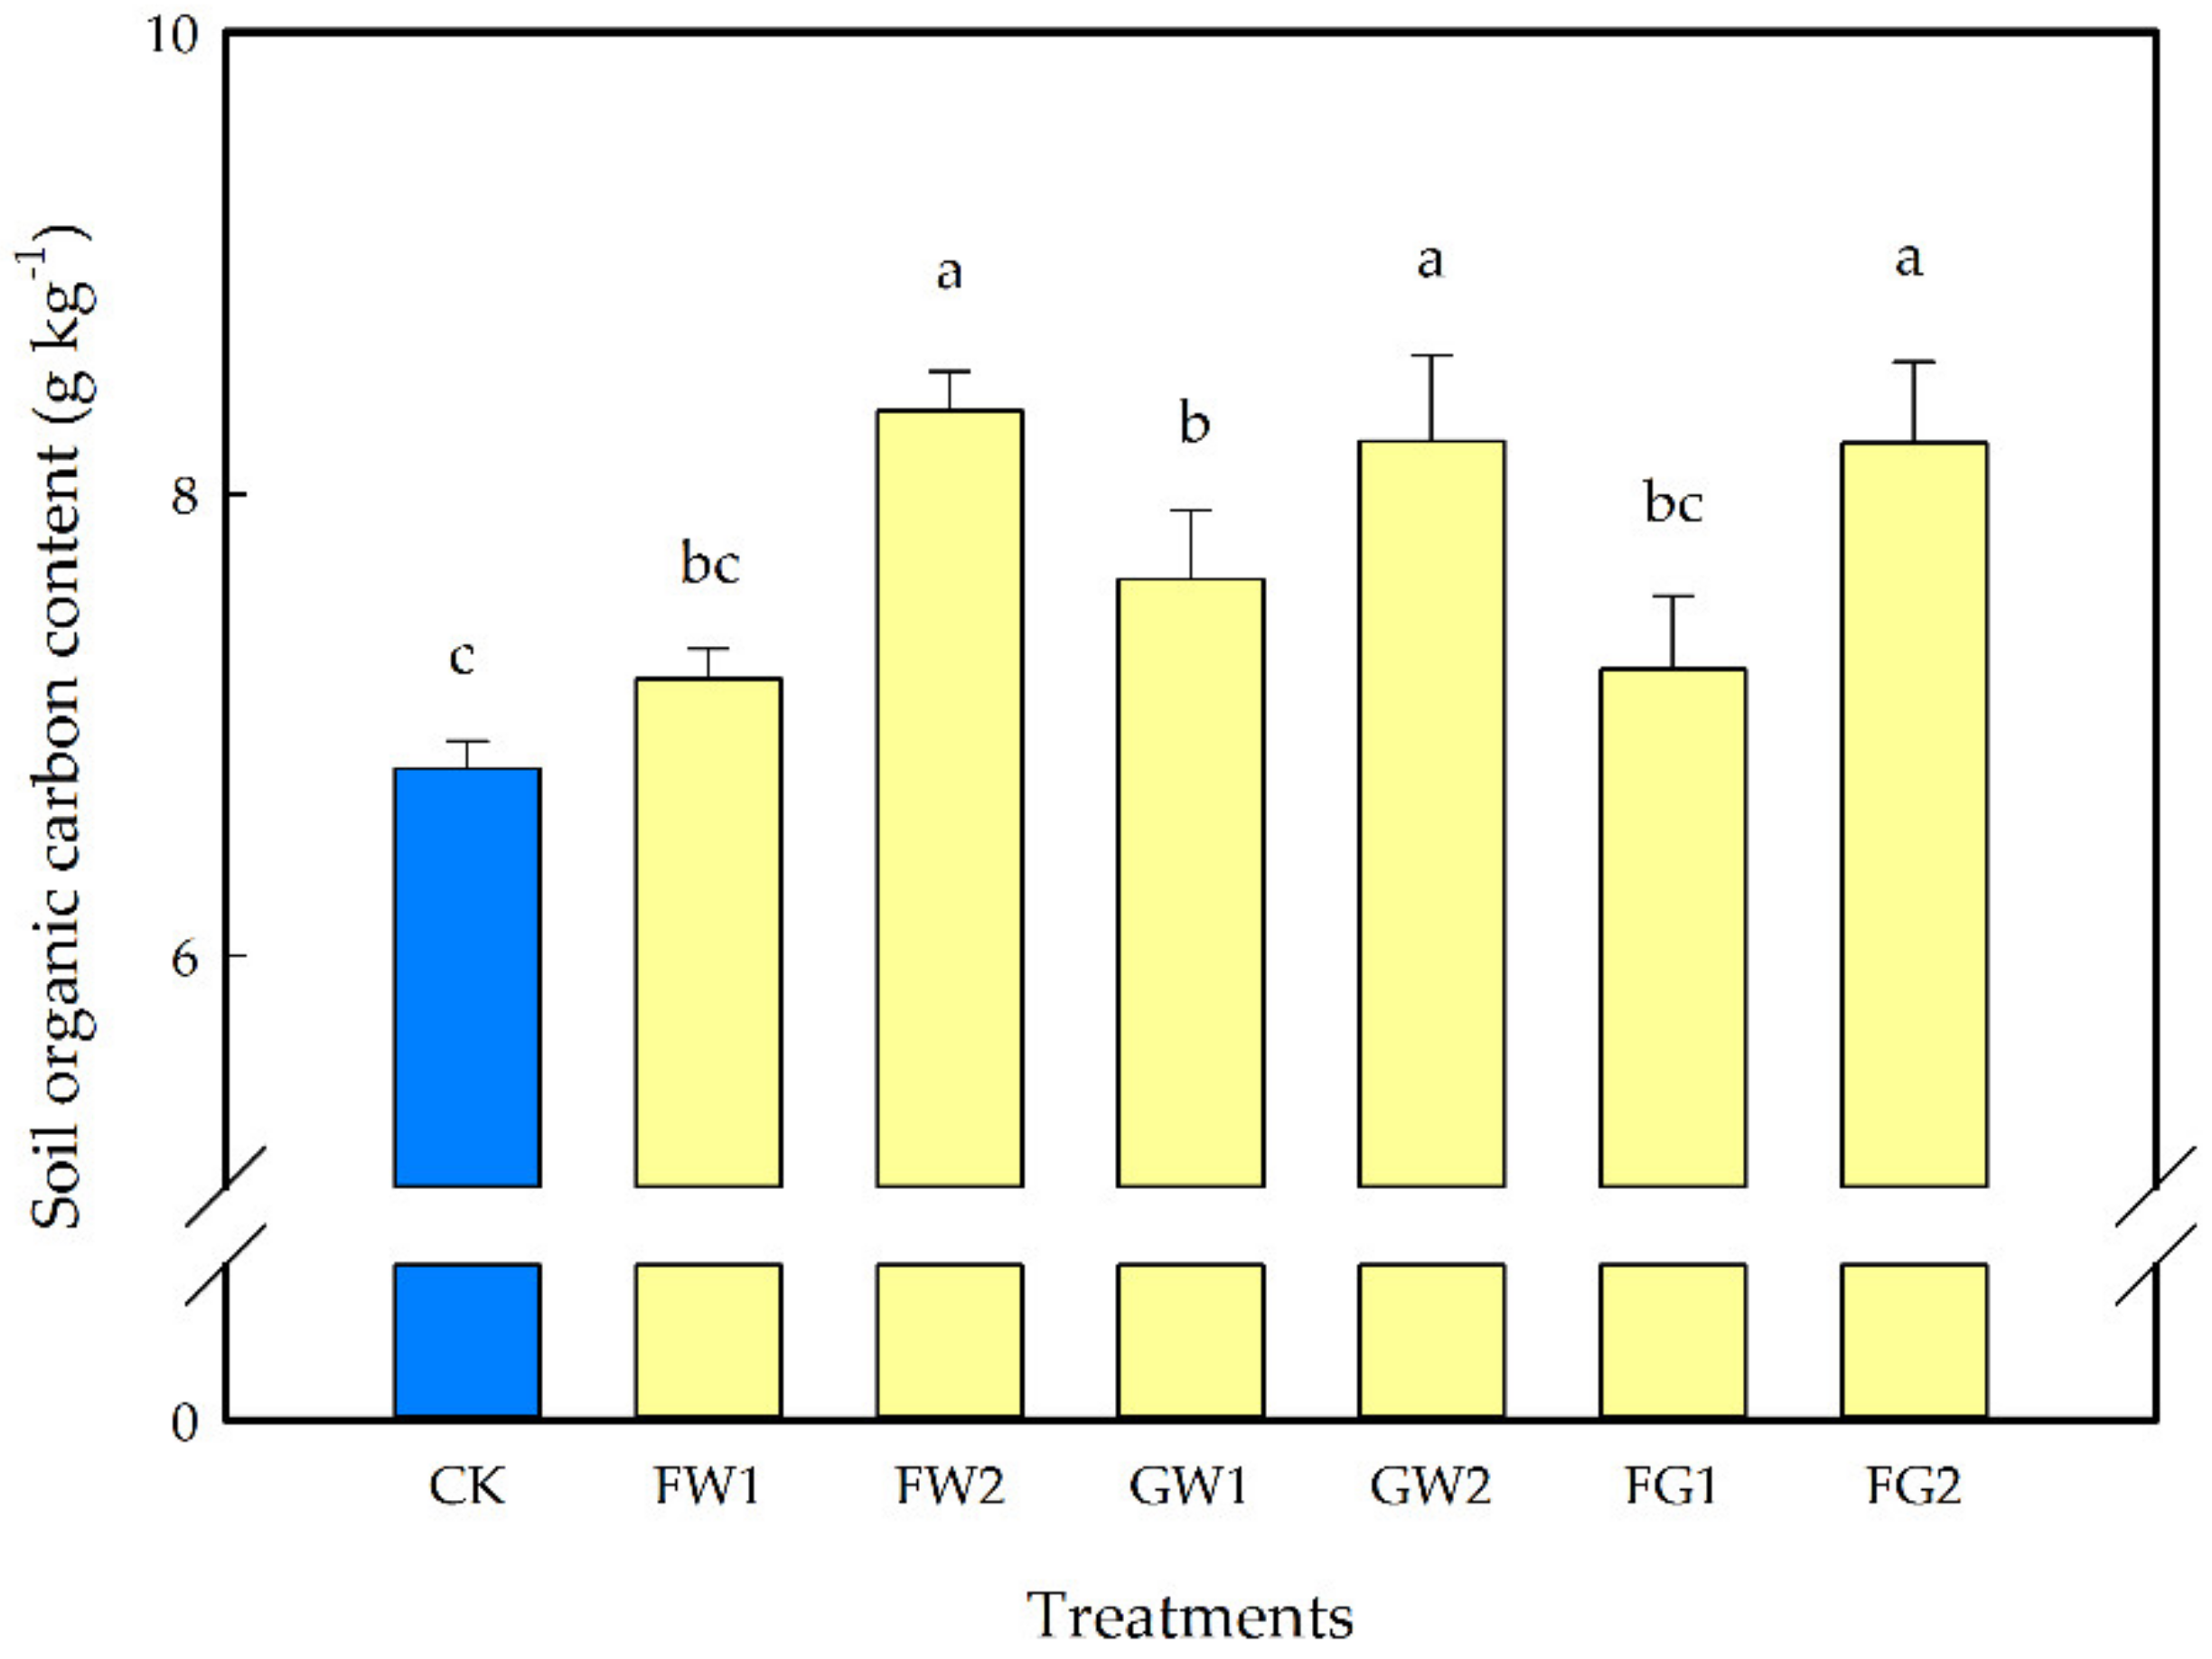
3.1.1. Effect of Different Amounts of Waste Amendments on SOC

The SOC of different treatments after 60 days of incubation is shown in Figure 2, ranging from 6.71 to 8.62 g kg−1. The results of the variance analysis showed that there were significant differences in SOC among the different carbon input treatments. Compared with CK, the SOC of the waste amendment treatment increased by 1.10~26.63% after 60 days of incubation. There was no significant difference between FW1, FG1 and CK (p > 0.05), but GW1 was significantly higher than CK (p < 0.05). It could be seen that it was more conducive to the accumulation of organic carbon with the input of garden waste compost. However, with the increase of waste amendments, the organic carbon content of soil had no significant difference between the different amendments. When the application of amendment carbon was 2.34 g, the average utilization rate of food waste compost carbon and a mixture of food waste compost and garden waste compost carbon was 13.9%. However, the utilization rate of garden waste compost carbon was 27.7%, and with the application of amendment carbon at 4.68 g, the average utilization rate of amendment carbon was not significantly different, at approximately 25%.

3.1.2. Effect of Different Amount of Waste Amendments on POC

As an important part of the soil active organic carbon pool, POC has a fast turnover speed in soil. It requires a sensitive index to judge the short-term impact of external factors on SOC. It can be seen from Table 3 that in the overall trend, the content of POC in different treatments gradually decreased with the extension of incubation time. The higher the content of waste amendment material, the higher the content of POC. After 60 days of incubation, the order of POC content in different treatments was: FW2 > GW2 > FG2 > GW1 > FG1 > FW1 > CK. The input of organic materials significantly increased the content of soil particulate organic carbon. FW1, FW2, GW1, GW2, FG1 and FG2 increased POC by 140, 210, 160, 210, 150 and 170% compared to CK, respectively. When the amount of waste amendment carbon was 2.92 g kg−1, when compared to garden waste compost, the application of food waste compost was conducive to the accumulation of POC from 12 days to 36 days of cultivation. However, the application of garden waste compost was conducive to the accumulation of POC from 48 days to 60 days of cultivation time. At the end of the incubation, there was no significant difference between GW2 and GW1 or between FGW1 and FGW2, but FW2 was significantly larger than FW1. This may be because the decomposition and transformation rate of food waste compost products in soil is faster than that of garden waste compost.

3.2. Effect of Different Amounts of Waste Amendments on Soil Organic Carbon Mineralization

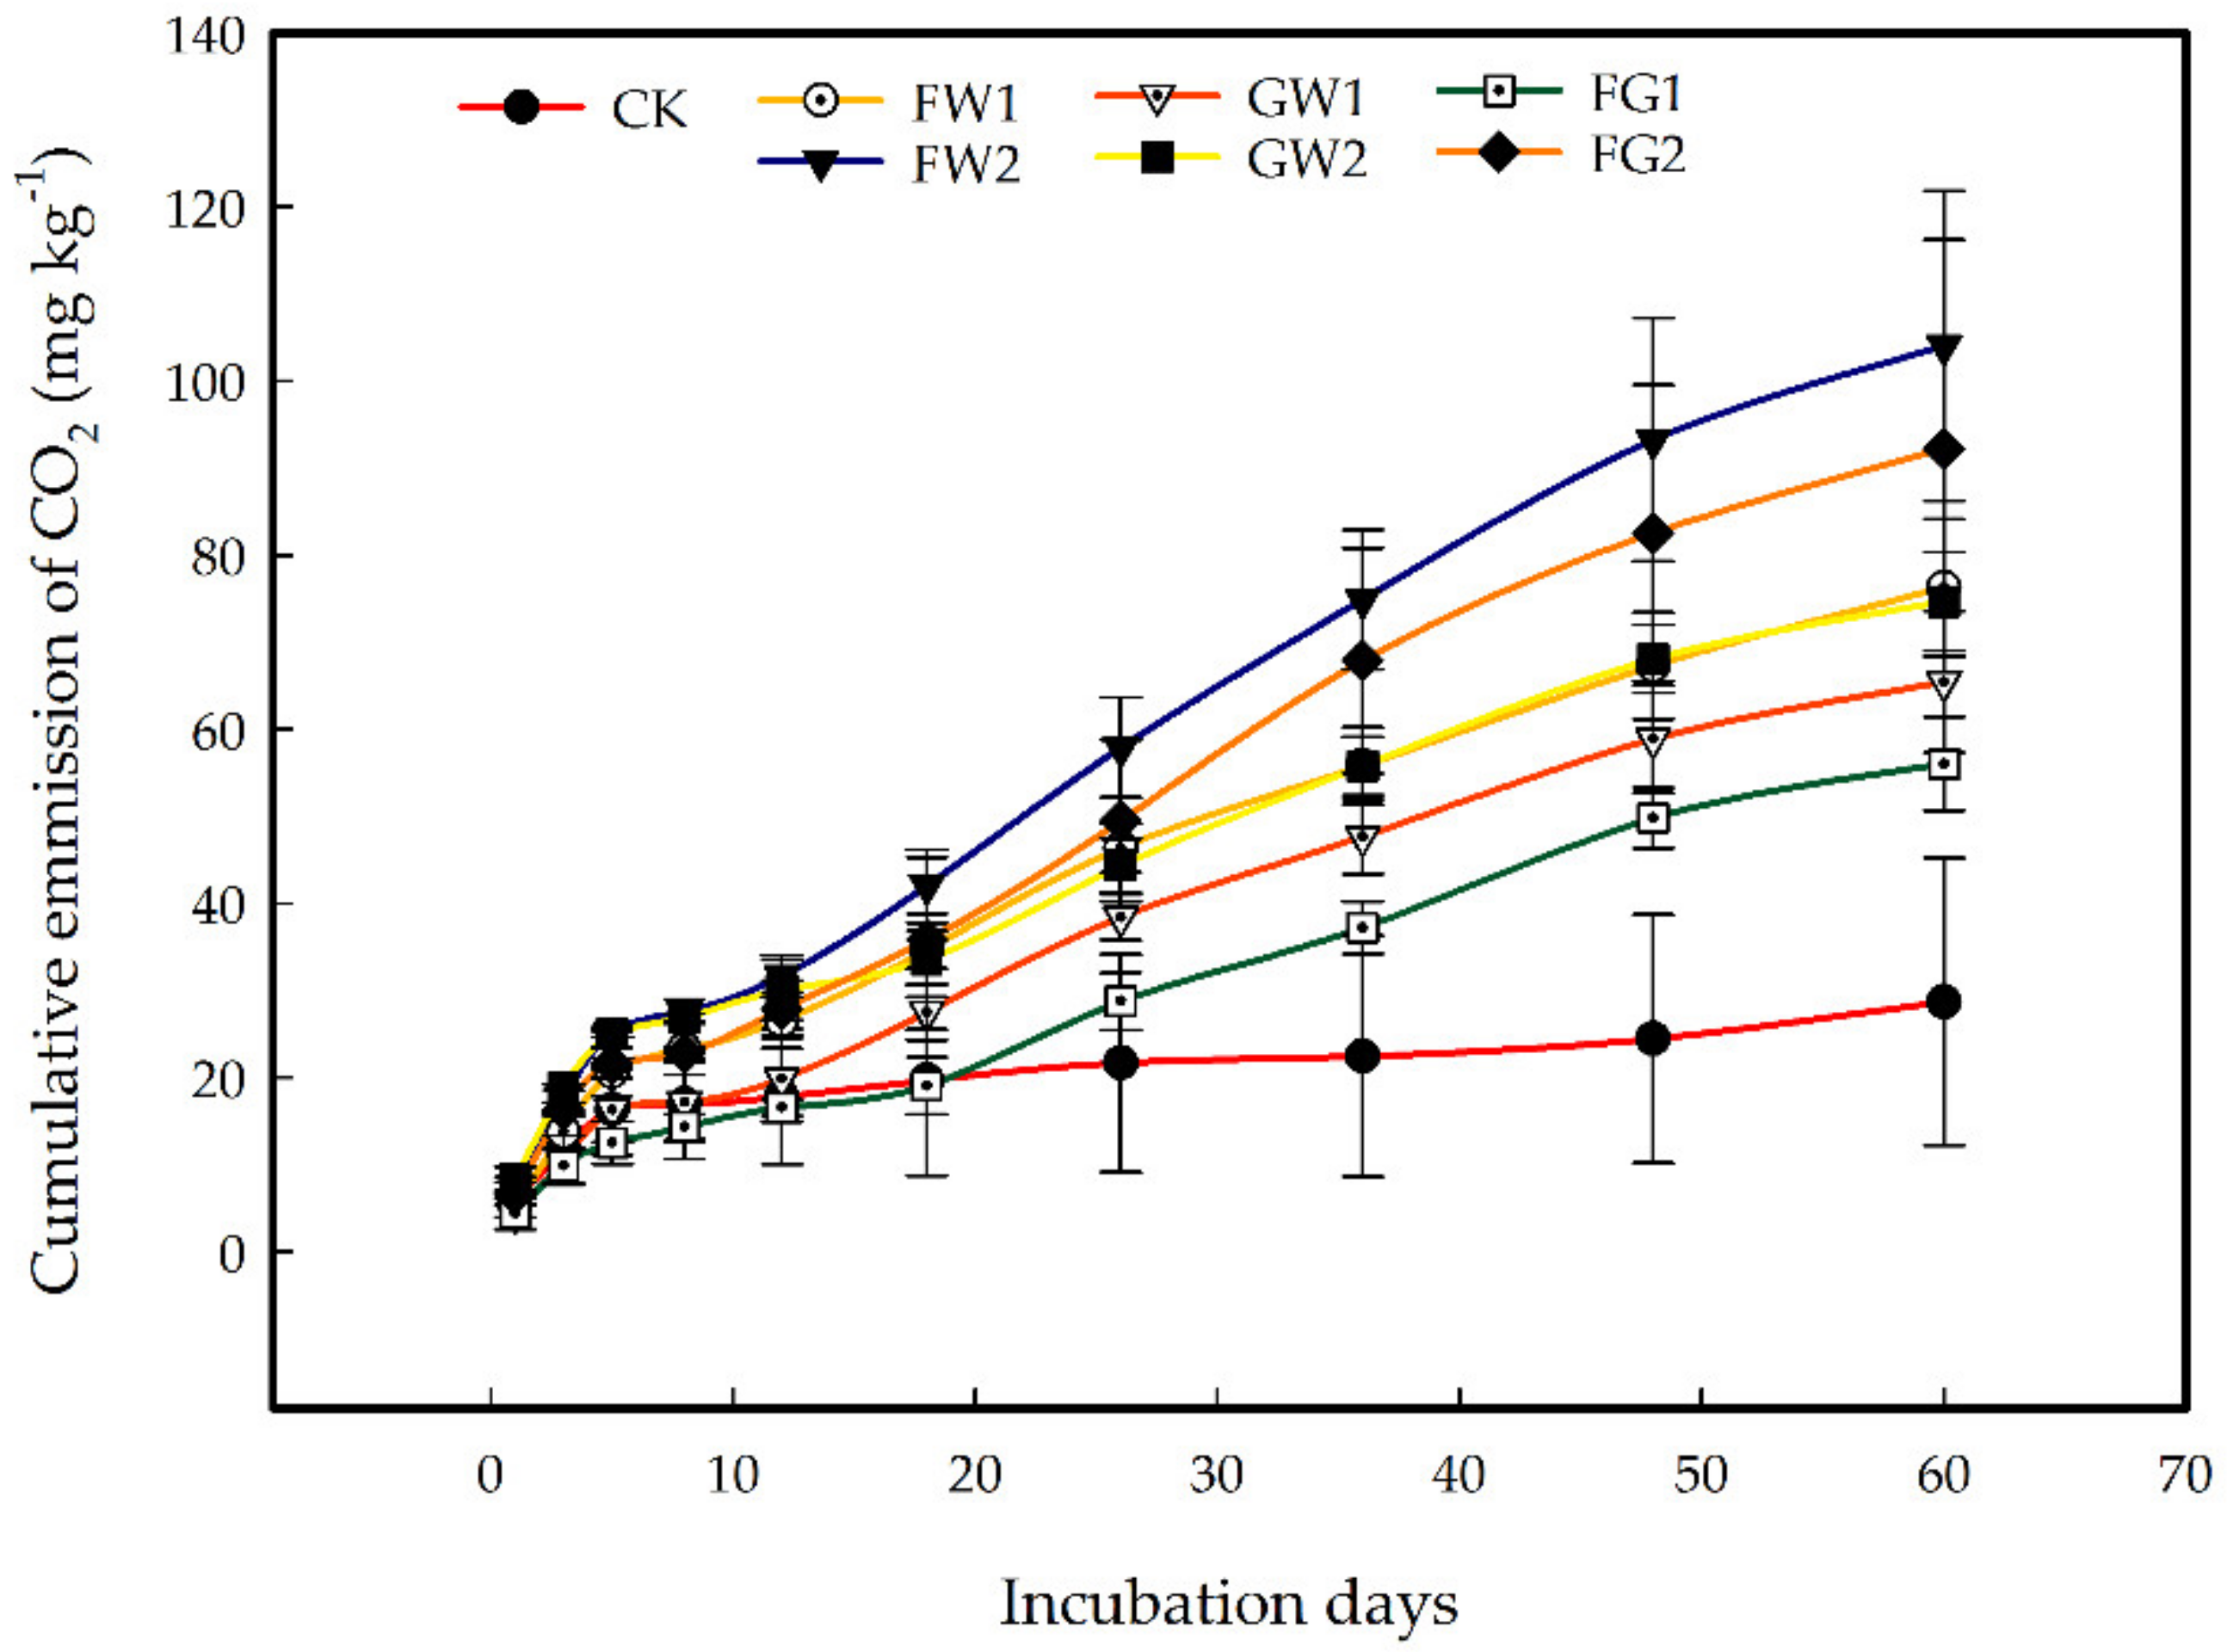
3.2.1. Effect of Different Amounts of Waste Amendments on Cumulative Emissions of CO2

The cumulative emissions of CO2 refers to the amount of carbon dioxide released by the mineralization of SOC in a certain period of time under certain cultivation conditions, which is an indicator of the mineralization characteristics of organic carbon. The cumulative emission of CO2 increased with incubation time under different treatments (Figure 3). The cumulative emission of CO2 was not significantly different (p > 0.05) between the different waste amendment treatments in the early stage of incubation (within 8 days), and the cumulative emission of CO2 was higher with the increase in waste amendment input at 60 days of incubation time. After 60 days of incubation, the cumulative emissions of CO2 in CK and FW1, FW2, GW1, GW2, FG1 and FG2 were 52.9, 75.1, 102.4, 63.6, 72.8, 55.6 mg kg−1 and 100.8 mg kg−1, respectively. This showed that the greater the use of waste amendment materials, the greater the cumulative emissions of CO2 from the soil. By comparing the cumulative release of carbon dioxide from treatment with different organic materials, it was found that the type of material significantly affected the cumulative release of carbon dioxide. Under the same amendment organic carbon addition ratio, the cumulative emissions of CO2 showed that food waste compost > food waste compost mixture with garden waste compost > garden waste compost.

3.2.2. Simulation of SOC Mineralization

According to the release of CO2 measured in each stage within 60 days of different treatments, the kinetic equation model was used to conduct independent linear regression analysis for each repeated result, and the values of C1, C2, k and h were fitted. Table 4 shows that the fitting of the two-index model to the SOC mineralization dynamics achieved good results in the amendment treatments (R2 > 0.98), but for the CK treatment, the best fitting model was the single-index model, which may have been due to the relatively stable organic carbon component of the soil treated with CK, so it can be described by a component parameter. C1 indicates the content of the easily mineralizable carbon. When 2.92 g kg−1 amendment carbon was input to soil, the food waste compost treatment had the largest easily mineralizable carbon pool (C1), which was 12.12 g kg−1, and the garden waste compost treatment had the smallest C1, which was 7.28 g kg−1. However, the mineralization rates of the easily mineralizable carbon pool (k) of FW1, GW1 and FGW1 were 0.54, 0.74 and 1.08 mg d−1, respectively. The rate of food waste compost was the smallest. When the carbon input of organic materials was increased to 5.84 g kg−1, different materials showed the same law. When the carbon storage capacity was large, the decomposition rate constant was smaller. The rate constant of the easily mineralizable carbon pool (k) in all treatments ranged from 0.19 to 1.08 mg d−1, FG1 had the largest rate among all treatments, CK was the smallest and the value of k was not consistent with the increase in the application amount of waste amendment. C2 indicates the content of the slow mineralizable carbon. When 2.92 g kg−1 amendment carbon was input to soil, FGW1 had the largest slow mineralizable carbon pool of 185.64 mg kg−1, and GW1 had the smallest slow mineralizable carbon pool of 129.36 mg kg−1. When 5.84 g kg−1 amendment carbon was input to soil, GW2 had the largest slow mineralizable carbon pool of 333.28 mg kg−1 and FGW2 had the smallest slow mineralizable carbon pool of 272.91 mg kg−1. The rate constant of the slow mineralizable carbon pool (h) ranged from 0.0032 to 0.0114 mg d−1, FGW1 had the largest rate among all treatments and GW2 had the smallest rate. With the increase in the application amount of waste amendment, the h value showed a decreasing trend. C1 + C2 indicates the potential mineralized carbon pool in soil and C1/(C1 + C2) indicates the easily mineralizable carbon pool ratio in the potential mineralized carbon pool. In the food waste compost treatment, after the material organic carbon input was increased from 2.92 g kg−1 to 5.84 g kg−1, the proportion of easily mineralized organic carbon was reduced by 3.68%, but the garden waste compost treatment was only reduced by 0.16%.

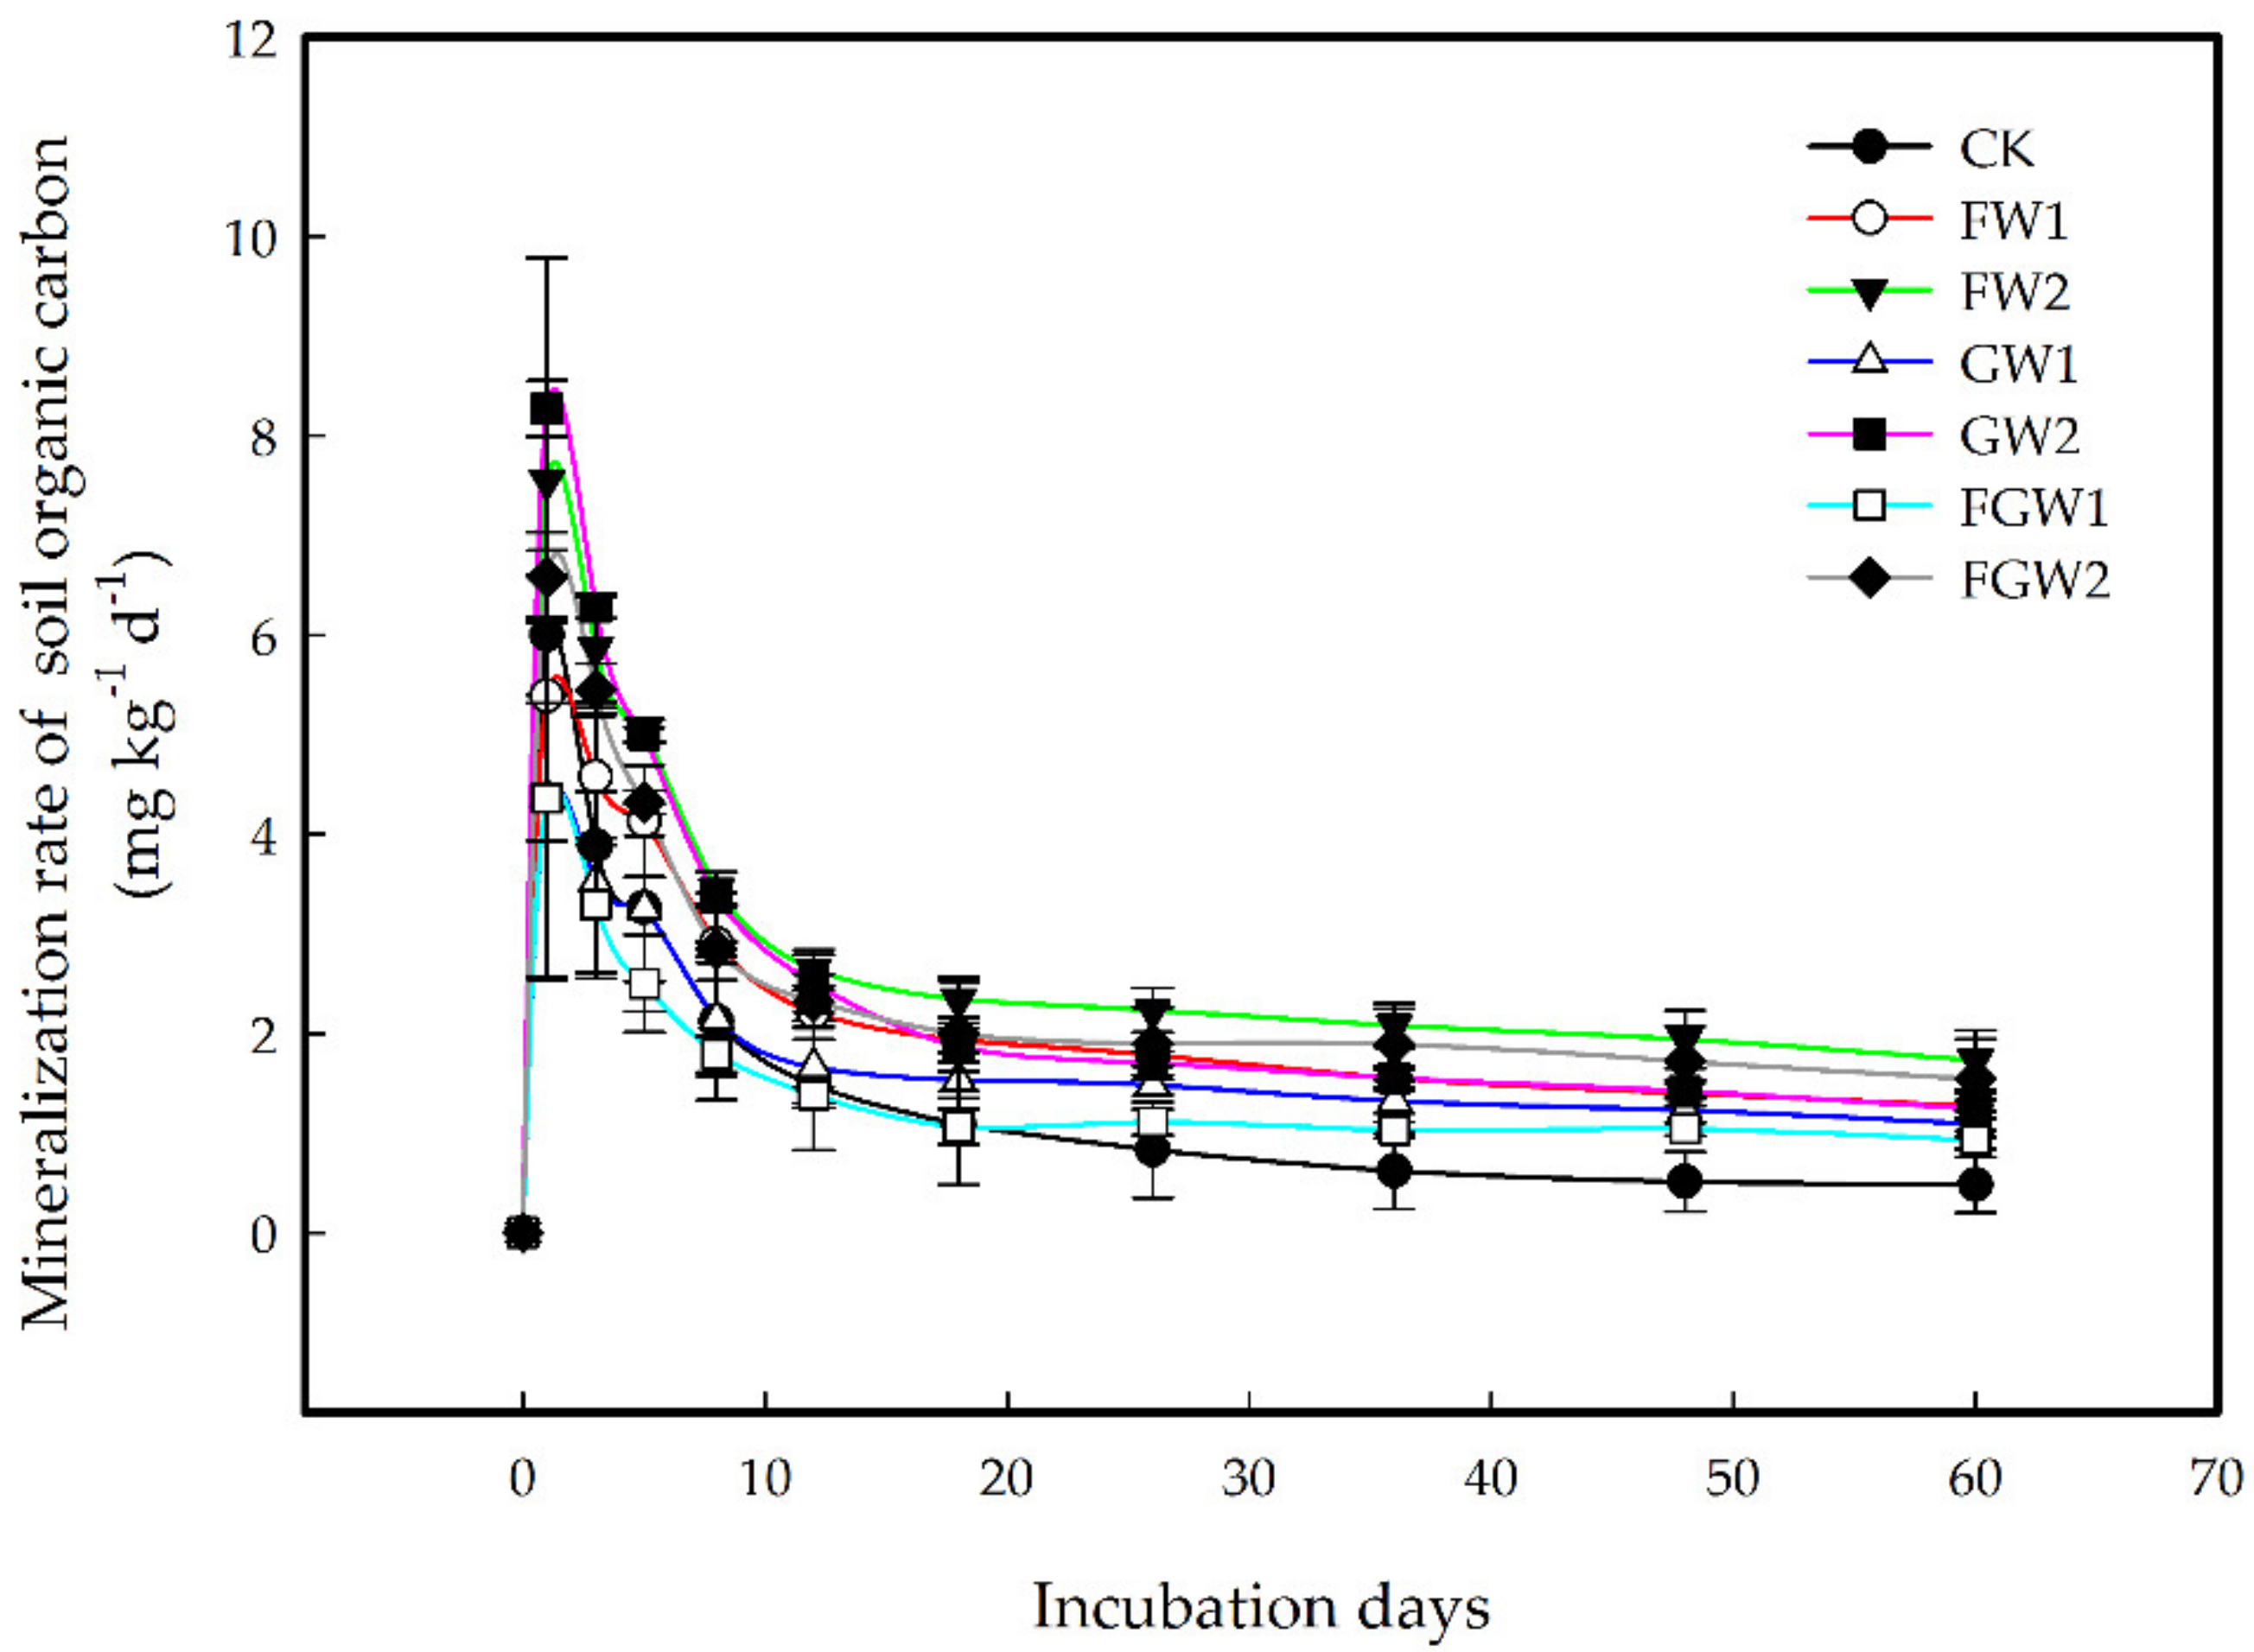
3.2.3. Effect of Different Amounts of Waste Amendments on the Soil Mineralization Rate

The mineralization rate of SOC reflected the difficulty of SOC release to some extent. The high mineralization rate indicated that organic carbon easily decomposed and accumulated relatively poorly. Compared with CK, the rate of SOC mineralization with waste amendment content was higher and gradually increased with the increasing of waste amendment content (Figure 4). The trend of the rate of SOC mineralization in each treatment showed an obvious a two-stage process (Figure 5) with increasing incubation time. Through equation fitting, the dividing points of the two stages for FW1, FW2, GW1, GW2, FGW1 and FGW2 were 10.40 ± 0.47, 9.39 ± 0.43, 9.74 ± 0.49, 9.34 ± 0.55, 9.03 ± 0.62 and 9.09 ± 0.23, respectively. There was no significant difference between the different treatments. The mineralization rate peaked at 1 day of incubation time, when the amendment carbon input was 2.92 g kg−1, the mineralization rate ranged from 4.36~5.39 mg kg−1 d−1, and when the amendment carbon input was 5.84 g kg−1, the mineralization rate ranged from 6.58~8.27 mg kg−1 d−1. From day 1 to day 10 of incubation, the mineralization rate of carbon decreased rapidly from the initial maximum, and the mineralization rate on the day 10 was approximately 35% of that on the first day. From 10 days to the end of the incubation period, the average rate of SOC mineralization in the amendment addition treatment decreased from 2.12 mg kg−1 d−1 to 1.30 mg kg−1 d−1. At 60 days of incubation, the order of the mineralization rate of SOC was as follows: FW2 > FG2 > FW1 > GW2 > GW1 > FG1 > CK.

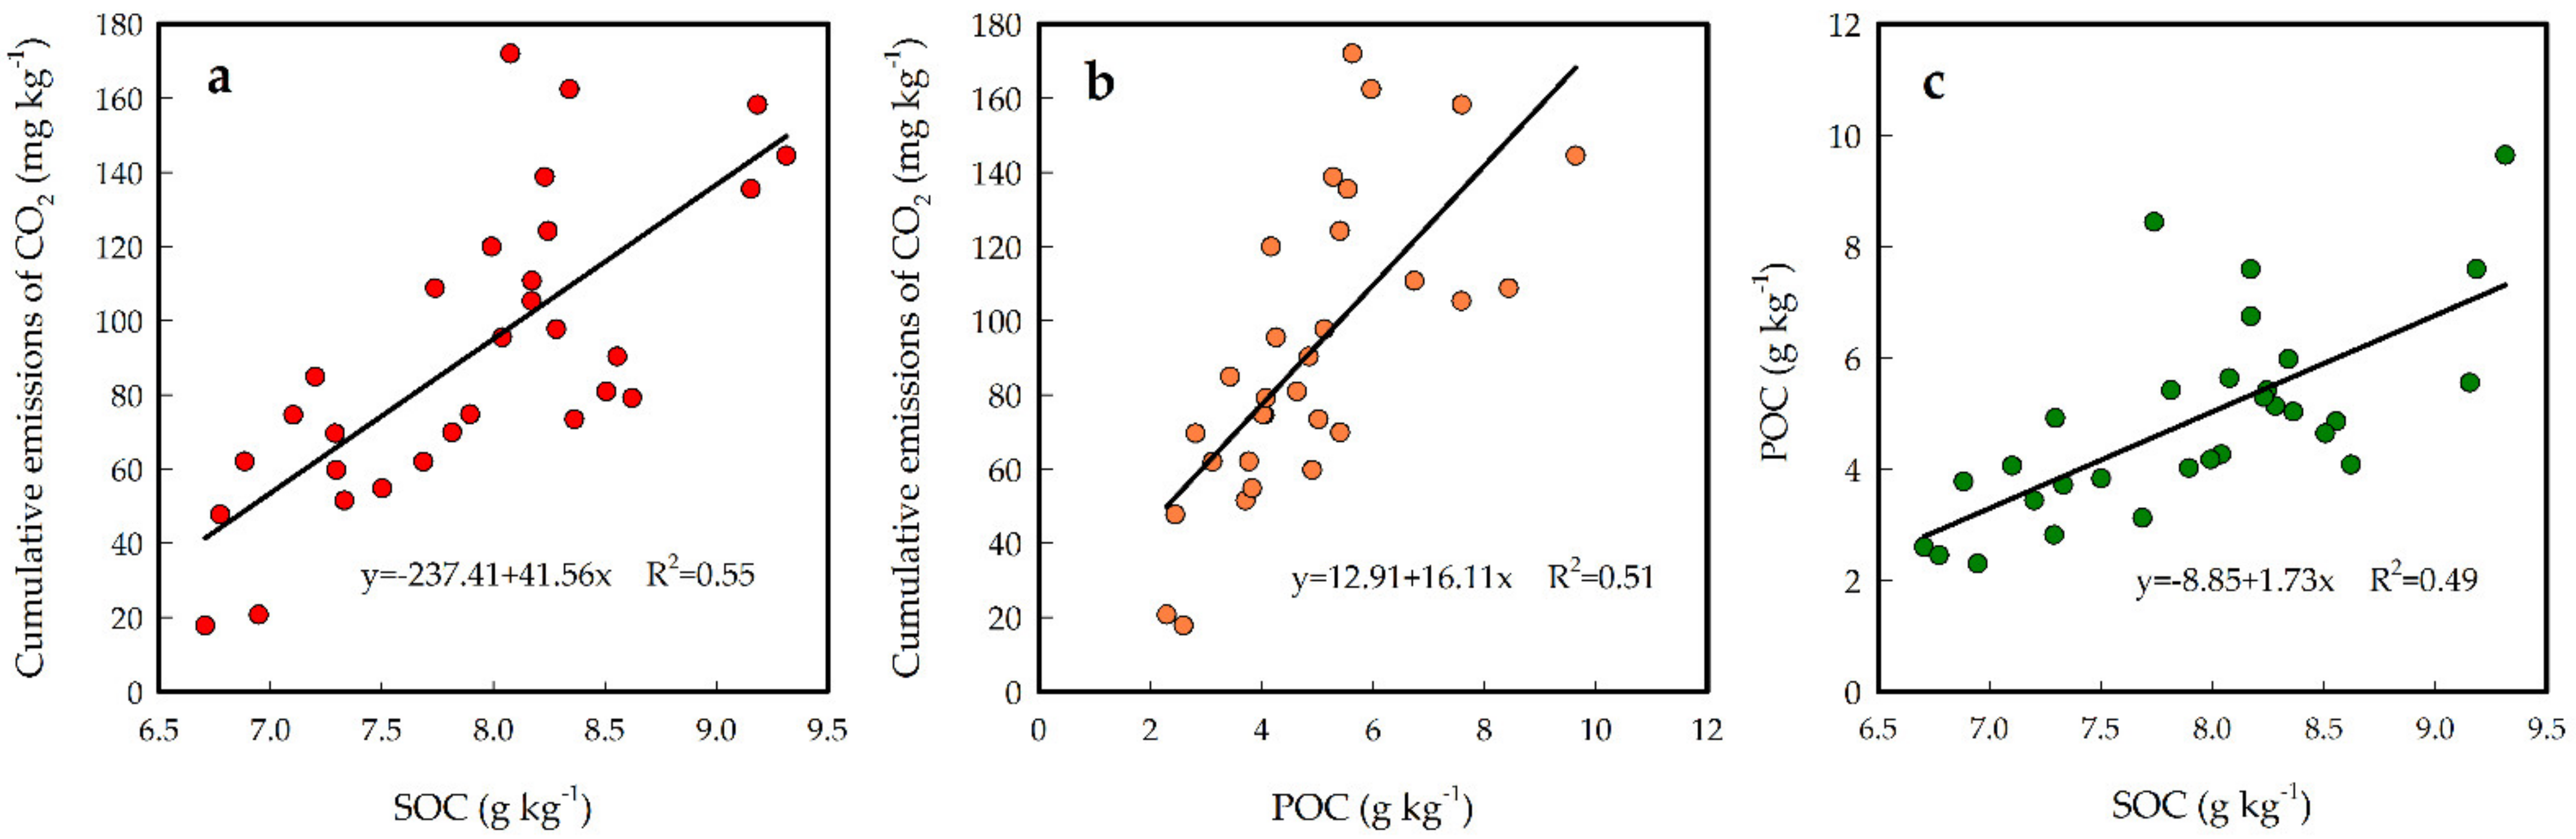
3.3. Correlation Analysis among SOC, POC and Cumulative Emissions of CO2

Figure 6 shows a close association between SOC, POC and cumulative emissions of CO2. Analysis of the correlation between the cumulative emissions of CO2 of soil and different carbon forms during the cultivation process showed that SOC and POC were positively significantly correlated with the cumulative emissions of CO2 (p < 0.05). According to the fitted equation, for every 1 g kg−1 increase in soil organic carbon, the cumulative release of soil carbon dioxide increases by 41.56 mg kg−1 (Figure 6a) and for every 1 g kg−1 increase in soil particulate organic carbon, the cumulative release of soil carbon dioxide increases by 16.11 mg kg−1 (Figure 6b). The results indicate that various organic carbons are closely related to organic carbon mineralization. POC was positively significantly (p < 0.05) related to SOC (Figure 6c); this showed that activated organic carbon was not only different from the total organic carbon but also closely connected with the total organic carbon (R2 = 0.49) and was part of the total organic carbon in the soil.

4. Discussion

In recent years, food waste compost and garden waste compost have been used as soil amendments to improve soil quality. The production of food waste compost in China is approximately 500,000 tons every day, and there are approximately 5 million tons of garden waste compost generated in China each year [1]. Compost organic waste can be applied to greenland soil in the form of organic fertilizer to achieve a win–win situation of ecological, economic and social benefits. Jia et al. [13] found that long-term application of food waste compost improved orchard soil carbon stability and fertility. However, is it that the more waste amendments added, the greater the accumulation of organic carbon? The results of this study indicated that waste amendments did significantly affect the SOC content, which was consistent with previous research results [20,21]. The main reason is that the input of waste amendments changes the basic C/N of soil and the life activities of microorganisms and then produces the binders and carriers that cause the formation of soil aggregates and increase the number of soil aggregates, improving the stability of the agglomerates, which will improve the stability of POC and be conducive to soil carbon [22,23].This study also showed that the SOC of amendment addition treatments gradually increased with increasing amounts of amendment. When the input of amendment carbon was 2.92 g kg−1, the average SOC at 60 days was 7.36 g kg−1, and when the input of amendment carbon was 5.84 g kg−1, the average SOC at 60 days was 8.27 g kg−1, which was consistent with previous research results [24,25,26,27]. The results also showed that the amount of amendment added significantly affects the utilization rate of the amendment carbon. For food waste compost treatments, when the carbon input was 2.92 g kg−1, the utilization rate was nearly 13.2%, and when the carbon input was 5.84 g kg−1, the utilization rate was nearly 27.7%. This could be caused by the activity of microorganisms being suppressed with increasing waste amendment amounts, which was more conducive to the conversion of waste amendment materials to organic carbon. However, in the garden waste compost treatments, when carbon input was 2.92 g kg−1, the utilization rate was nearly 27.9%, and when the carbon input was 5.84 g kg−1, the utilization rate was nearly 25.3%, and this result was obviously inconsistent with the results of food waste compost. This may have been related to the addition of food waste compost and garden waste compost that stimulated different types of microorganisms in the soil, which was conducted in the next step.
In soil, POC has high availability and is easily decomposed and utilized by soil microorganisms. The soil C/N, C/P, and N/P ratios were significantly associated with the SOC fractions [28], and soil stoichiometry directly affected the plant nutrient supply. POC is the most sensitive fraction with increasing SOC content [29,30], but it is more sensitive than total organic carbon for indicating changes in soil quality and soil fertility and can reflect changes in soil fertility and physical properties more accurately and practically. In our study, the POC of waste amendment treatments gradually increased with increasing added amounts at the early stages, which was consistent with previous research results [23]. This relates to organic carbon input-derived SOC experiencing higher accumulation in macroaggregates [31]. Although the amount of organic material carbon added is the same, the effects of different materials on soil particulate organic carbon are significantly different. In our study, the overall trend was that the organic carbon content of soil particles in food waste compost treatments was higher than that of garden waste compost in the early stage, but there was no significant difference between these two materials in the later stage, and even food waste compost treatment was lower than garden waste compost. Qu et al. [32] also found that the average POC mineralization rates of the treatments with added animal manure or plant residues were 31.5% and 29.8%, respectively. The POC in the animal manure treatment more easily mineralized than that in the plant residue treatment. This may be related to the influence of different organic materials on the chemical composition of soil particulate organic carbon. Chen et al. [33] showed that returning straw to the field increased the aromatic carbon content in POC, while manure treatment reduced the aromatic carbon content in soil POC.
SOC mineralization is a complex process that is the result of the combined action of factors such as soil type, particle composition, nutrition level and organic carbon chemical structural stability [34,35]. The application of waste amendment treatment in this study showed that cumulative emission of CO2 was positively significantly correlated with amendment carbon input, as previously reported in other studies. Guo [36] showed that organic fertilizer treatment could significantly increase organic carbon mineralization. Adnan et al. [37] found that long-term fertilization using manure combined with mineral fertilizer could improve both the SOC sequestration and mineralization. In our study, the total amount of CO2 released after 60 days of incubation was significantly higher in the waste amendment treatment than the CK treatment. These data support our hypothesis that waste amendment treatment can significantly increase organic carbon mineralization. The differences in the effects of equal carbon of food waste compost and garden waste compost on the mineralization of soil organic carbon were due to substrate types [38]. The results of our study showed that the mineralization rate decreased rapidly from the beginning to nearly 10 days of incubation, the mineralization rate at 10 days was approximately 35% of that at 1 day, and it tended to be stable in the middle and late periods (10–60 days). The mineralization rate at 60 days was approximately 61.4% of that at 10 days, which was consistent with previous research results [39]. This is mainly because the simple and easily decomposed organic carbon in the soil provides more nutrients to microorganisms in a short period of time, which makes the microbial activities intense and the decomposition rate quickly decrease. In the middle and later stages, the mineralization rate gradually decreased with the decrease in easily decomposed organic matter. The refractory organic matter (cellulose, lignin, etc.) could not be utilized by microorganisms, and its activity was inhibited, so the carbon mineralization rate decreased and tended to be stable [40,41].
The potential mineralized carbon pool (C1 + C2) can reflect the content of potentially active nutrients in soil. With the increase in the application amount of waste amendments, C1 + C2 shows an increasing trend. This is mainly because the available organic carbon source in the soil increased with the increase in the application amount of waste amendments, the organic carbon content involved in soil respiration increased and the bioactive organic carbon pool increased. In addition, the turnover rate constant of easily mineralized organic carbon (k) is a sign of mineralization speed, which can reflect the nutrient supply and circulation in the soil. In our study, the k values of the waste amendment treatments were significantly higher than that of the CK treatment. This result indicated that food waste compost and garden waste compost application could accelerate the turnover rate and increase the turnover time of SOC, which could be due to the influence of waste amendments on soil structure and chemical properties.
Dai et al. [38] found that the effects of carbon inputs on CO2 production varied with SOC content and substrate type. Setia et al. [42] found that cumulative CO2-C emissions were significantly positively related to the content of POC in wheat residue-amended soils. This is consistent with the results of this study, which showed that there was a close relationship between POC, SOC and the cumulative emission of CO2. This indicated that the active organic carbon in soil was an important carbon source for organic carbon mineralization.

5. Conclusions

The results showed that SOC at 60 days increased with the increase in amendment input, but there was no difference between the different amendments. When the input of the amendment carbon ratio was 2.92 g kg−1, the average SOC of the different treatments was 7.36 g kg−1. When the input of the amendment carbon ratio was 5.84 g kg−1, the average SOC of the different treatments was 8.27 g kg−1. The amount of material added only significantly affected the soil particle organic carbon content in the early stage of cultivation, and there was no significant difference between the different addition amounts at the end of cultivation. Waste amendments had an important effect on SOC mineralization by significantly increasing the cumulative mineralization amount and SOC mineralization rate. The dynamic of soil cumulative emissions of carbon dioxide preferably followed the two-index kinetic equation for amendment input treatments (R2 > 0.99). After adding organic materials, the change in the soil organic carbon mineralization rate could be divided into two stages: fast stage and slow stage. The dividing point of the two stages was approximately 10 days. SOC and POC were significantly correlated with cumulative CO2 emissions.

Author Contributions

This paper was written with the contribution of all authors as follows: Conceptualization, J.L., X.M., Q.Z. and H.W.; methodology, J.L. and X.M.; data curation, Q.Z.; writing—original draft preparation, X.M. and Q.Z.; writing—review and editing, X.M. and Q.Z.; visualization, J.L.; supervision, J.L.; project administration, J.L.; funding acquisition, J.L. All authors have read and agreed to the published version of the manuscript.

Funding

This research was funded by Science and Technology Project of Shanghai Landscaping &City Appearance Administrative Bureau (Grant No. G200202).

Institutional Review Board Statement

Not applicable.

Informed Consent Statement

Not applicable.

Data Availability Statement

Data available on request.

Conflicts of Interest

The authors declare no conflict of interest.

References

  1. Statistics Bureau of the People’s Republic of China. China Statistical Yearbook; China Statistics Press: Beijing, China, 2020.
  2. Amritha, P.K.; Anilkumar, P.P. Development of landscaped landfills using organic waste for sustainable urban waste management. Procedia Environ. Sci. 2016, 35, 368–376. [Google Scholar] [CrossRef]
  3. Amritha, P.K.; Kumar, P.A. Productive landscapes as a sustainable organic waste management option in urban areas. Environ. Dev. Sustain. 2019, 21, 709–726. [Google Scholar] [CrossRef]
  4. Wan, Y.; Wang, D.L. Research on Policy Expression and Evolution Logic in the Change of Municipal Solid Waste Management Policy in China: An Empirical Analysis Based on 169 Policy Texts from 1986 to 2018. Adm. Trib. 2020, 2, 75–85. [Google Scholar]
  5. Zou, H.T.; Ye, X.H.; Li, J.Q.; Lu, J.; Fan, Q.F.; Yu, N.; Zhang, Y.L.; Dang, X.L.; Zhang, Y.L. Effects of straw return in deep soils with urea addition on the soil organic carbon fractions in a semi-arid temperate cornfield. PLoS ONE 2016, 11, e0153214. [Google Scholar] [CrossRef]
  6. Zhu, L.Q.; Hu, N.J.; Yang, M.F.; Zhan, X.H.; Zhang, Z.W. Effects of different tillage and straw return on soil organic carbon in a rice-wheat rotation system. PLoS ONE 2014, 9, e88900. [Google Scholar] [CrossRef] [Green Version]
  7. Kubar, K.A.; Huang, L.; Lu, J.W.; Li, X.K.; Xue, B.; Yin, Z.Y. Long-term tillage and straw returning effects on organic C fractions and chemical composition of SOC in rice-rape cropping system. Arch. Agron. Soil Sci. 2018, 65, 125–137. [Google Scholar] [CrossRef]
  8. Miao, R.H.; Ma, J.; Liu, Y.Z.; Liu, Y.C.; Yang, Z.L.; Guo, M.X. Variability of aboveground litter inputs alters soil carbon and nitrogen in a coniferous-broadleaf mixed forest of central China. Forests 2019, 10, 188. [Google Scholar] [CrossRef] [Green Version]
  9. Wang, G.S.; Huang, W.J.; Mayes, M.A.; Zhou, G.Y. Soil moisture drives microbial controls on carbon decomposition in two subtropical forests. Soil Biol. Biochem. 2018, 130, 185–194. [Google Scholar] [CrossRef]
  10. D’Orazio, V.; Traversa, A.; Senesi, N. Forest Soil Organic Carbon Dynamics as Affected by Plant Species and Their Corresponding Litters: A Fluorescence Spectroscopy Approach. Plant Soil 2013, 374, 473–484. [Google Scholar] [CrossRef]
  11. Jo, E.Y.; Cheon, J.L.; Ahn, J.H. Effect of Food Waste Compost on the Antler-Type Fruiting Body Yield of Ganoderma lucidum. Mycobiology 2013, 41, 42–46. [Google Scholar] [CrossRef] [Green Version]
  12. Wei, Q.; Zhang, W.; Guo, J.; Wu, S.; Tan, T.; Wang, F.; Dong, R. Performance and kinetic evaluation of a semi-continuously fed anaerobic digester treating food waste: Effect of trace elements on the digester recovery and stability. Chemosphere 2014, 117, 477–485. [Google Scholar] [CrossRef] [PubMed]
  13. Jia, X.; Zhao, B.; Ren, L.; Li, M.; Zhang, X.; Hou, J.; He, L. Effects of Food Waste Soil Conditioner on Organic Carbon Distribution in Orchard Soil. Res. Environ. Sci. 2019, 32, 485–493. [Google Scholar]
  14. Wang, Y.; Liu, D.; Hou, J.; Hao, Y.; Meng, F.; Li, M.; Fan, H. Effect of Exogenous Organic Carbon Prepared from Food Waste on Soil Aggregates. Res. Environ. Sci. 2019, 32, 166–174. [Google Scholar]
  15. Yang, L.; Li, F.; Chu, H. Effects of Food Waste Compost on Soil Microbial Populations, Tomato Yield, and Tomato Quality. Commun. Soil Sci. Plant Anal. 2014, 45, 1049–1058. [Google Scholar] [CrossRef]
  16. Pedra, F.; Polo, A.; Ribeiro, A.; Domingues, H. Effects of municipal solid waste compost and sewage sludge on mineralization of soil organic matter. Soil Biol. Biochem. 2007, 39, 1375–1382. [Google Scholar] [CrossRef]
  17. Nelson, D.W.; Sommers, L.E.; Sparks, D.L.; Page, A.L.; Helmke, P.A.; Loeppert, R.H.; Soltanpour, P.N.; Tabatabai, M.A.; Johnston, C.T.; Sumner, M.E. Total carbon, organic carbon, and organic matter. Methods Soil Anal. Part 3 Chem. Methods 1996, 9, 961–1010. [Google Scholar]
  18. Garten, C.T.; Post, W.M.; Hanson, P.J.; Cooper, L.W. Forest soil carbon inventories and dynamics along an elevation gradient in the southern Appalachian Mountains. Biogeochemistry 1999, 45, 115–145. [Google Scholar] [CrossRef]
  19. Saviozzi, A.; Vanni, G.; Cardelli, R. Carbon mineralization kinetics in soils under urban environment. Appl. Soil Ecol. 2014, 73, 64–69. [Google Scholar] [CrossRef]
  20. Long, R.J.; Brown, R.N.; Amador, J.A. Growing food with garbage: Effects of six waste amendments on soil and vegetable crops. Hortscience 2017, 52, 896–904. [Google Scholar] [CrossRef] [Green Version]
  21. Morlat, R.; Chaussod, R. Long-term additions of organic amendmentsin a Loire Valley Vineyard: I. Effects on properties of a calcareous sandy soil. Am. J. Enol. Vitic. 2008, 59, 353–363. [Google Scholar] [CrossRef] [Green Version]
  22. Piccolo, A.; Mbagwu, J.S.C. Effects of different organic waste amendments on soil microaggregates stability and molecular sizes of humic substances. Plant Soil 1990, 123, 27–37. [Google Scholar] [CrossRef]
  23. Qu, X.J.; Wu, J.G.; Zhao, J.H.; Li, J.M.; Hu, J.; Yaa, O.K. Effects of Solid Organic Wastes on Soil Particulate Organic Carbon Structure Under Different Water Conditions. Clean 2019, 47, 1900187.1–1900187.9. [Google Scholar] [CrossRef]
  24. Pagano, L.; Iovieno, P.; Zaccardelli, M.; Morra, L.; Costantini, E. Soil organic matter dynamic as affected by municipal food waste compost fertilization in southern Italy. In Proceedings of the 5th International Congress of the European Society for Soil Conservation” Soils Changing in a Changing World: The Soils of Tomorrow”, Palermo, Italy, 25–30 June 2007. [Google Scholar] [CrossRef]
  25. Iovieno, P.; Morra, L.; Leone, A.; Pagano, L.; Alfani, A. Effect of organic and mineral fertilizers on soil respiration and enzyme activities of two Mediterranean horticultural soils. Biol. Fertil. Soils 2009, 45, 555–561. [Google Scholar] [CrossRef]
  26. Yang, X.M.; Reynolds, W.D.; Drury, C.F.; Fleming, R.; Tan, C.S.; Denholm, K.; Yang, J.Y. Organic carbon and nitrogen stocks in a clay loam soil 10 years after a single compost application. Can. J. Soil Sci. 2014, 94, 357–363. [Google Scholar] [CrossRef]
  27. Li, J.; Evanylo, G.K. The effects of long-term application of organic amendments on soil organic carbon accumulation. Soil Sci. Soc. Am. J. 2013, 77, 964. [Google Scholar] [CrossRef]
  28. Abrar, M.M.; Xu, H.; Aziz, T.; Sun, N.; Adnan, M.; Aslam, M.W.; Syed, A.; Khalid, M.; Zhou, B.; Ma, X.; et al. Carbon, nitrogen, and phosphorus stoichiometry mediate sensitivity of carbon stabilization mechanisms along with surface layers of a Mollisol after long-term fertilization in Northeast China. J. Soils Sediments 2021, 21, 705–723. [Google Scholar] [CrossRef]
  29. Ali, S.S.A.; Xu, M.; Abrar, M.M.; Shi, S. Long-term fertilization affects functional soil organic carbon protection mechanisms in a soil profile of Chinese loess plateau soil. Chemosphere 2021, 267, 128897. [Google Scholar] [CrossRef]
  30. Muhammad, M.A.; Xu, M.G.; Syed, A.A.; Muhammad, W.A.; Tariq, A.; Adnan, M.; Muhammad, N.A.; Zhou, B.; Ma, X. Variations in the profile distribution and protection mechanisms of organic carbon under long-term fertilization in a Chinese Mollisol. Sci. Total Environ. 2020, 723, 138181. [Google Scholar]
  31. Mustafa, A.; Xu, M.; Atizaz, S.; Nuez-Delgado, A. Soil aggregation and soil aggregate stability regulate organic carbon and nitrogen storage in a red soil of southern China. J. Environ. Manag. 2020, 270–281. [Google Scholar] [CrossRef]
  32. Qu, X.J.; Wu, J.G.; Li, J.M.; Hu, J.; Zhang, L. Effect of Exogenous Organic Carbon on Soil Organic Carbon and Particulate Organic Carbon in Black Soil. J. Soil Water Conserv. 2017, 31, 278–287. [Google Scholar]
  33. Chen, X.D.; Wu, J.G. Infrared Spectrum Characteristics of Particulate Organic Carbon in Soil Fertilizing with Different Organic Materials. Chin. J. Anal. Chem. 2021, 49(3), 468–473. [Google Scholar] [CrossRef]
  34. Rabbi, S.M.F.; Wilson, B.R.; Lockwood, P.V.; Daniel, H.; Young, I.M. Soil organic carbon mineralization rates in aggregates under contrasting land uses. Geoderma 2014, 216, 10–18. [Google Scholar] [CrossRef]
  35. Wang, Q.; Zeng, Z.; Zhong, M. Soil moisture alters the response of soil organic carbon mineralization to litter addition. Ecosystems 2016, 19, 450–460. [Google Scholar] [CrossRef]
  36. Guo, Z.; Han, J.; Li, J.; Xu, Y.; Wang, X. Effects of long-term fertilization on soil organic carbon mineralization and microbial community structure. PLoS ONE 2019, 14, e0211163. [Google Scholar] [CrossRef] [Green Version]
  37. Adnan, M.; Xu, H.; Muhammad, M.A.; Syed, A.; Sun, N.; Qudsia, S.; Muhammad, K.; Muhammad, N.; Manuel, C.; Gao, H.; et al. Long-term fertilization enhanced carbon mineralization and maize biomass through physical protection of organic carbon in fractions under continuous maize cropping. Appl. Soil Ecol. 2021, 165. [Google Scholar] [CrossRef]
  38. Dai, S.S.; Li, L.J.; Ye, R.; Zhu-Barker, X.; Horwath, W.R. The temperature sensitivity of organic carbon mineralization is affected by exogenous carbon inputs and soil organic carbon content. Eur. J. Soil Biol. 2017, 81, 69–75. [Google Scholar] [CrossRef]
  39. Leirós, M.C.; Trasar-Cepeda, C.; Seoane, S.; Gil-Sotres, F. Dependence of mineralization of soil organic matter on temperature and moisture. Soil Biol. Biochem. 1999, 31, 327–335. [Google Scholar] [CrossRef]
  40. Jia, J.; Yu, D.P.; Zhou, W.M.; Zhou, L.; Bao, Y.; Meng, Y.Y.; Dai, L.M. Variations of soil aggregates and soil organic carbon mineralization across forest types on the northern slope of Changbai Mountain. Acta Ecol. Sin. 2015, 35, 1–7. [Google Scholar] [CrossRef]
  41. El-Naggar, A.H.; Usman, A.R.A.; Al-Omran, A.; Ok, Y.S.; Ahmad, M.; Al-Wabel, M.I. Carbon mineralization and nutrient availability in calcareous sandy soils amended with woody waste biochar. Chemosphere 2015, 138, 67–73. [Google Scholar] [CrossRef] [PubMed]
  42. Setia, R.; Marschner, P.; Baldock, J.; Chittleborough, D.; Verma, V. Relationships between carbon dioxide emission and soil properties in salt-affected landscapes. Soil Biol. Biochem. 2011, 43, 667–674. [Google Scholar] [CrossRef]
Figure 1. Soil mineralization experimental device.
Sustainability 13 03790 g001
Figure 2. The soil organic carbon content of different treatments after 60 days of incubation. CK: soil without amendments; FW1: soil with food waste compost (soil/food waste compost = 100:1); FW2: soil with food waste compost (soil/food waste compost = 100:2); GW1: soil with garden waste compost (soil/garden waste compost = 100:0.84); GW2: soil with garden waste compost (soil/garden waste compost = 100:1.67); FGW1: soil amendments mixture (soil/food waste compost/garden waste compost = 100:0.5:0.42); FGW2: soil amendments mixture (soil/food waste compost/garden waste compost = 100:1:0.84). Different lowercase letters indicate that the soil organic carbon differed significantly by Duncan’s test (p < 0.05). Error bars represent the standard deviation (n = 3).
Sustainability 13 03790 g002
Figure 3. The effects of waste amendment addition on soil organic carbon mineralization. CK: soil without amendments; FW1: soil with food waste compost (soil/food waste compost = 100:1); FW2: soil with food waste compost (soil/food waste compost = 100:2); GW1: soil with garden waste compost (soil/garden waste compost = 100:0.84); GW2: soil with garden waste compost (soil/garden waste compost = 100:1.67); FGW1: soil amendments mixture (soil/food waste compost/garden waste compost = 100:0.5:0.42); FGW2: soil amendments mixture (soil/food waste compost/garden waste compost = 100:1:0.84). Error bars represent the standard deviation (n = 3).
Sustainability 13 03790 g003
Figure 4. The effects of waste amendments on the soil organic carbon mineralization rate. CK: soil without amendments; FW1: soil with food waste compost (soil/food waste compost = 100:1); FW2: soil with food waste compost (soil/food waste compost = 100:2); GW1: soil with garden waste compost (soil/garden waste compost = 100:0.84); GW2: soil with garden waste compost (soil/garden waste compost = 100:1.67); FGW1: soil-amendments mixture (soil/food waste compost/garden waste compost = 100:0.5:0.42); FGW2: soil-amendments mixture (soil/food waste compost/garden waste compost = 100:1:0.84). Error bars represent the standard deviation (n = 3).
Sustainability 13 03790 g004
Figure 5. The dynamic change of the soil organic carbon mineralization rate. CK: soil without amendments; FW1: soil with food waste compost (soil/food waste compost = 100:1); FW2: soil with food waste compost (soil/food waste compost = 100:2); GW1: soil with garden waste compost (soil/garden waste compost = 100:0.84); GW2: soil with garden waste compost (soil/garden waste compost = 100:1.67); FGW1: soil-amendments mixture (soil/food waste compost/garden waste compost = 100:0.5:0.42); FGW2: soil-amendments mixture (soil/food waste compost/garden waste compost = 100:1:0.84). Error bars represent the standard deviation (n = 3).
Sustainability 13 03790 g005
Figure 6. Relationships among; (a) soil organic carbon (SOC) and cumulative emissions of CO2; (b) soil particulate organic carbon (POC) and cumulative emissions of CO2; (c) soil organic carbon (SOC) and soil particulate organic carbon.
Sustainability 13 03790 g006
Table 1. The properties of test soil and amendments.
ParameterSoilFood Waste CompostGarden Waste Compost
pH6.847.227.18
EC (mS cm−1)0.243.590.62
Organic carbon content (g kg−1)6.75292.10349.60
Total N (g kg−1)1.4221.009.69
C/N ratio4.7513.9036.10
Table 2. Experimental design of each treatment.
Treatments NumberSoil (%)Food Waste Compost (%)Garden Waste Compost (%)Amendment Carbon (g kg−1)
CK100000
FW11001.0002.92
FW21002.0005.84
GW110000.842.92
GW210001.675.84
FGW11000.500.422.92
FGW21001.000.845.84
CK: control soil; FW: soil with food waste compost; GW: soil with garden waste compost; FGW: soil with food waste compost and garden waste compost.
Table 3. The content of particulate organic carbon at different incubation times of each treatment.
Incubation TimeCKFW1FW2GW1GW2FGW1FGW2
1 d2.84 ± 0.50A5.82 ± 0.45A6.54 ± 0.55AB5.29 ± 0.99A8.47 ± 0.87A4.97 ± 1.30A5.65 ± 1.12AB
c b ab b a b b
12 d2.05 ± 0.50C4.51 ± 0.16B5.59 ± 1.96AB3.75 ± 0.03AB5.88 ± 1.27BC3.80 ± 0.47A6.34 ± 0.62A
c ab ab bc ab bc a
18 d2.07 ± 0.10C3.90 ± 0.47B6.72 ± 0.22AB2.87 ± 0.24B4.21 ± 0.12D3.55 ± 1.09A4.25 ± 0.41B
d bc a cd b bc b
26 d2.59 ± 0.10AB4.10 ± 0.28B7.60 ± 0.78A3.70 ± 0.09AB4.08 ± 0.01D3.28 ± 0.30A4.81 ± 0.43AB
d bc a cd bc cd b
36 d1.82 ± 0.12C4.18 ± 0.65B5.12 ± 0.07B4.08 ± 0.82AB6.54 ± 0.09B3.84 ± 0.01A4.93 ± 0.65AB
d bc b bc a c bc
48 d1.95 ± 0.13C3.35 ± 0.18B5.26 ± 0.65AB3.38 ± 0.40B4.53 ± 0.04CD3.37 ± 0.01A4.75 ± 1.28AB
c b a b ab b ab
60 d2.44 ± 0.21B3.43 ± 0.88B5.13 ± 0.39B4.01 ± 1.27AB5.02 ± 0.55BCD3.77 ± 0.08A4.17 ± 0.13B
c bc a abc ab abc ab
Mean value ± standard deviation. Different lowercase letters indicate that the soil particulate organic carbon differed significantly by Duncan’s test (p < 0.05) between different treatments (horizontal). Different uppercase letters indicate that the soil particulate organic carbon differed significantly by Duncan’s test (p < 0.05) between different incubation times (vertical). CK: soil without amendments; FW1: soil with food waste compost (soil/food waste compost = 100:1); FW2: soil with food waste compost (soil/food waste compost = 100:2); GW1: soil with garden waste compost (soil/garden waste compost = 100:0.84); GW2: soil with garden waste compost (soil/garden waste compost = 100:1.67); FGW1: soil amendments mixture (soil/food waste compost/garden waste compost = 100:0.5:0.42); FGW2: soil amendments mixture (soil/food waste compost/garden waste compost = 100:1:0.84).
Table 4. Fitting of the equation to the soil organic carbon mineralization dynamics.
Treatments NumberC1 (mg kg−1)K (mg d−1)C2 (mg kg−1)H (mg d−1)C1 + C2 (mg kg−1)C1/(C1 + C2) (%)R2
CK23.240.19 0.8324
FW112.120.54139.240.0104 151.368.01%0.9973
FW212.710.77280.440.0068 293.144.33%0.9948
GW17.280.74129.360.0102 136.645.33%0.9954
GW218.170.62333.280.0032 351.455.17%0.9934
FGW18.231.08185.640.0114 193.874.24%0.9930
FGW210.490.89272.910.0061 283.403.70%0.9942
CK: soil without amendments; FW1: soil with food waste compost (soil/food waste compost = 100:1); FW2: soil with food waste compost (soil/food waste compost = 100:2); GW1: soil with garden waste compost (soil/garden waste compost = 100:0.84); GW2: soil with garden waste compost (soil/garden waste compost = 100:1.67); FGW1: soil amendments mixture (soil/food waste compost/garden waste compost = 100:0.5:0.42); FGW2: soil amendments mixture (soil/food waste compost/garden waste compost = 100:1:0.84).
Publisher’s Note: MDPI stays neutral with regard to jurisdictional claims in published maps and institutional affiliations.

