Article

Wind Coefficient Distribution of Arranged Ground Photovoltaic Panels

1
Department of Architecture Engineering, Songwon University, Gwangju 61756, Korea
2
Department of Architecture Engineering, Jeonbuk National University, Jeonju 54896, Korea
3
Department of Mechanical and Shipbuilding Convergence Engineering, Pukyong National University, Busan 48547, Korea
*
Authors to whom correspondence should be addressed.
Sustainability 2021, 13(7), 3944; https://doi.org/10.3390/su13073944
Submission received: 18 February 2021 / Revised: 22 March 2021 / Accepted: 23 March 2021 / Published: 2 April 2021

Abstract

:
Solar panels installed on the ground receive wind loads. A wind experiment was conducted to evaluate the wind force coefficient acting on a single solar panel and solar panels arranged in an array. The surface roughness did not have a significant effect on the change in vertical force, which is the wind force coefficient acting on the vertical surface of a single solar panel. An examination of the change in wind direction angle showed that the largest vertical force coefficient was distributed in the 0° forward wind direction on the front of the solar panel, the 345° reverse wind direction on the rear side, and the 135° and 225° diagonal directions on the rear panel. Furthermore, an examination of the change in wind force coefficient according to the change in solar panel inclination angle (β) showed that the drag coefficient was the highest at the 40° inclination angle of the panel (β), followed by the 30° and 20° inclination angles. However, the lift coefficient and vertical force coefficient were not significantly affected by the inclination angle of the panel. The wind force coefficient of the panels arranged in an array was influenced by the wind direction angle and panel position. With the exclusion of the nearest row at a wind direction angle of 0°, all the panels in the array showed lower coefficients than those in the single-panel experiment. In the case of the panels placed inside, the wind speed was decreased by the surrounding panels. As a result, the wind force coefficient was lower than that of the single-panel experiment. This outcome is attributed to the small delamination at the end of the panels by the surrounding array of panels compared with that of the single-panel experiment.

1. Introduction

The supply of solar energy has been expanding rapidly, and many studies on solar energy have been reported. Materials and performance related to solar panels have been steadily studied, and various attempts have been made through grafting with other fields, which has also increased the performance and role of solar panels. However, research on the performance of components made up of solar energy systems is progressing more slowly than the research on solar panels. Furthermore, there is a lack of research on the entire solar energy system in which these components are supported as a single structure. Depending on the nature of the solar energy system installed outdoors, it is inevitable that it will be significantly affected by such natural events as wind, snow, and earthquakes, besides being vulnerable to strong winds, such as typhoons. Previously, solar panels were installed on roofs or rooftops of homes, but, recently, they have been installed on a large scale in the form of solar complexes; if the solar complex is damaged, the damage affects the entire solar structure, which is serious. Solar energy systems, under the influence of strong winds, such as typhoons, are often severely damaged. Most of the damage is to connecting members and panel closures, or it takes the form of separation from supported columns and foundations, rather than the direct destruction of panels. Breakdown by separation from columns or members in a large array has a significant impact on the entire array. Korean standards do not exist for the design and loading of solar panels and systems, and reported studies conducted in other countries have not addressed array-placed solar energy systems installed on the ground rather than small systems installed on roofs.
The use of photovoltaic systems and the wind load of panels have been studied extensively. In the mid-1970s, solar energy was used to supply hot water during the warm season in Radu et al. [1], and Miller and Zimmerman [2] began research on solar energy to generate electricity and contribute to the national energy supply. In previous work [1,2], wind loads acting on solar arrays were analysed, and the use of fences or barriers was proposed to reduce wind loads acting on the edges or edges of panels. These early solar energy systems only produced a small amount of electricity, and the scale was extremely small. Therefore, solar systems were often installed on the roofs of relatively small buildings [1,3,4,5,6,7,8,9,10].
Aly and Bitsuamlak [7] conducted experiments with panels of varying sizes placed horizontally or vertically on the gable roof; however, at the end of the roof, the panel size did not significantly affect the average wind pressure, but it was observed that, the larger the panel size, the lower the peak wind pressure. Banks [6] examined the effect of wind loads on each section by installing solar panels in nine sections, most of which were affected by significant flows on the roof and panels, which moved the panel over the panel and changed the wind impact, rather than by itself. Aly and Bitsuamlak [5] placed solar panels perpendicular to or parallel to the long direction of the roof on a gable roof of a residential low-rise building and also installed them at a distance from corners to evaluate the wind loads acting on the panel with ASCE 7–16 criteria(After six years of intensive effort by nearly 350 volunteers, the 2016 edition of the ASCE 7 Standard on Minimum Design Loads and Associated Criteria for Buildings and Other Structures (ASCE/SEI 7–16) is now complete and available for purchase through the ASCE bookstore (www.asce.org/asce-7/). The ASCE criteria were similar to the horizontal placement of the panels in the experiment. Nevertheless, the ASCE criteria underestimated the negative pressure by 34%. In addition, the pressure applied to the solar panels installed on the roof corners was lower than the external pressure on the bare roof under ASCE (American Society of Civil Engineering) standards, and ASCE overestimated the negative pressure by 32%. Consequently, it is recommended that solar panel installations be avoided at the corners of roofs. Common to all the above studies was that solar panels were located at the edge of the roof or at the edge of the ridge. A thin roof can be negatively pressurized by the wind.
Mohapatra [11] installed a ground-type solar panel in a straight line with a single module and array in the mean flow direction, resulting in JIS-like results for wind coefficients acting on a single module, but with large panel widths, approximated by the angle of installation. In addition, if panels are installed in a straight line, the wind factor decreases as the separation distance increases. Ikeda et al. [12] conducted experiments by installing arrays in a 3 × 7 arrangement, and among the multiple solar panels, the wind direction angle with the maximum wind coefficient was 30°. It was shown in the top-stream heat end panel, which also showed fence effects. The wind factor of the upstream panel decreased by 10–15% owing to the presence of the downstream panel at a wind direction angle of 0–45°. Using computational fluid dynamics, Shademan et al. [13] conducted experiments to ensure that the gap between the solar panels and the height difference between the ground and the array gap were adjusted only at a 0° solar wind direction. The solar panels installed alone received the greatest force of headwinds. Moreover, as the gap between the panels increased, the magnitude decreased, and the average wind load on the structure increased as the gap ratio increased. In addition, the array had less wind load. The shelter effects of the first panel were also investigated based on the reduction of wind loads on the second panel, as was also done by Radu [1].
Abiola-Ogedengbe et al. [14] conducted wind tunnel experiments on surface tides C when ground-type solar energy systems were replaced with uniform and Korean standards and confirmed that the equilibrium state was under greater pressure than surface tides C. In other work, Ikeda et al. [15] conducted experiments on the intervals from solar panels to the ground. The wind coefficient tended to increase as the support height increased, regardless of the angle of the solar panels. A common reference in the above-ground work on array placement was that, on array corner panels, the greater the gap between panels and the greater the gap between the front and back, the less significant the gap between the ground and the panels.
Stathopoulos et al. [10] analysed research on wind pressure coefficients in similar configurations by classifying them into three points: panels installed on flat roofs, panels installed on sloping roofs, and those installed on rooftop corners or ends. For panels installed on flat roofs, there were significant differences in wind pressure coefficients across the board, such as different tendencies or large differences in coefficients, indicating that it is difficult to generate design regulations for codes and standards suitable for solar and similar systems. This difference between data is believed to be caused by differences in the wind tunnel conditions, modules, and scales. Similar arrangements and configurations [16,17], as reviewed by Stenabaugh et al. [18], also resulted in significant differences because of relatively small differences in wind tunnels and modules. This suggests that there are many variables in the actual solar energy system, such as builder experience and judgement of installation methods, settlement position columns, and the type and degree of the arrays, which, if installed on the same scale, may differ more than previously believed.
The latest issue considering wind loads on PV and wind pressures on ground-mounted PV panels is the topic of a special issue of smart energy for a sustainable future and the operation of solar power systems (https://www.mdpi.com/journal/sustainability/special_issues/Smart_Energy). First, Trejos-Grisales et al. [19] proposed the following in a study. The proposed modelling approach is based on detecting the inflection points that are caused by the bypass diodes activation, which enables to narrow the range in which the modules voltages are searched, thus reducing the calculation time. Therefore, this fast model is useful in designing the fixed connections of PV arrays that are subjected to shading conditions, in order to reconfigure the PV array in real-time, depending on the shading pattern, among other applications. Gimeno-Sales et al. [20] conducted research on technical solutions for monitoring and tracking PV systems, and realized systems for new semi-real-time monitoring systems. Finally, PVWPS (PV water pumping schemes) with Li-ion batteries propose to use an open source Internet of Things (IoT) tool. Through many researchers [21,22,23,24], many factors affect maintaining the high efficiency of solar power. One of the most influential factors is the stability of structures designed to ensure that solar panels remain vertical at all times. Since solar energy systems use solar energy light, they need to be precise, but if they are not structurally stable, no matter how much heat efficient panels are used, there are problems in producing electric energy. In addition, since solar power systems are installed outdoors, they should be exposed to the natural environment and have sufficient strength to withstand external forces due to wind loads or snow. In addition, it is important to secure the reliability of the model through wind load experiments.
In this study, a single-panel experiment and a location-specific wind experiment of an array in which several solar panels were placed were conducted to identify the wind loads acting on the solar panels. Wind tunnel experiments provide the drag force, lift force, and normal force acting on the panels from the position of the solar panels to determine the characteristics of the entire wind load distribution in the solar complex. The goal was to analyse the tendency within the array and present data to establish a systematic criterion for wind loads acting on solar panels.

2. Experiment and Methods

2.1. Experimental Model

The subjects for the experiments were divided into a single solar panel (Case 1) and several solar panels into an array type (Case 2) as shown in Figure 1. The scale of the experimental model was 1/25. The experimental panel was a 325-mm (W) × 160-mm (L) rectangle with a thickness of 3 mm. To ensure sufficient rigidity of the model, the thickness of the panel model was greater than the actual scale. The panel support columns were 9 mm thick and 140 mm high. The solar panel angles to the ground in the wind experiments ranged from 20° to 40°. The gap between solar cells placed inside the solar panels is the most common in practice, but the gap between the models was too narrow to reproduce all experimental models on a 1:25 scale. Thus, the gap inside the panels was not considered in the experimental conditions to focus on the wind direction and panel gradient. In the solar array, the gap between the sides of the solar panels was 2 cm, considering the model scale (1:25). In addition, the back-and-forth separation of the solar arrays (X) was calculated according to regional latitudes. Using the expression in Table 1, 270 mm was planned considering the latitude of the suburban area of the city centre. Figure 1 presents the dimensions of the single-panel experiment (Case 1) and array experiment (Case 2) experimental models installed inside the wind tunnel.

2.2. Wind Tunnel Experiment

The wind experiments to determine the distribution characteristics of wind coefficients acting on solar panels used boundary layer wind turbines with applying similarity law as shown in Table 2. The dimensions of the measuring part of the wind tunnel are 20 m (L), 5 m (W), and 2.5 m (H), with a wind speed range of 0.5 m/s to 30 m/s. The experimental wind velocity distribution applied in the experiment used uniform flow and turbulent hardness layers. The wind tunnel experiments were conducted under the conditions of the surface roughness classification α = 0.15, representing air flow on the solar panels, which are placed in multiple columns on hills or mountainsides, and uniform flows by solar height. Figure 2a is from within a wind tunnel and shows the distribution of wind speed and turbulence intensity by height in the free boundary layer state. The wind speed and turbulence were formed at a height of more than 40 cm in the wind tunnel. Figure 2b shows the vertical distribution of the average wind speed and turbulence intensity by the height of the boundary layer created using light blocks and spires inside the wind tunnel. The airflow in the wind tunnel was measured using a heated wind speedometer (IFA-300). In addition, wind experiments on solar panels used a six-minute dynamometer (LAT-1010KA-1). The experimental wind speed was 5.0 m/s at the solar height. The experiment was conducted by installing a table plate at a height of 40 cm with a constant wind speed inside the wind tunnel. Figure 3 shows the case-specific experimental wind direction angles. The experimental wind direction of Cases 1 and 2 was measured by rotating the turntable counterclockwise for eight directions at 45° intervals.

3. Results

Wind experiments were conducted to obtain wind coefficients acting on panels when deployed alone and when deployed as arrays of ground-type solar energy systems. Wind coefficients of solar panels were obtained for the surface wind distribution (equivalent and boundary layers) and for solar energy systems placed alone and in arrays.

3.1. Wind Power Coefficients

Figure 4 shows the measurements used to calculate the drag coefficients (CD), lift coefficients (CL), and vertical force coefficients (CF) that act on the model of a 6-min dynamometer for measuring the wind coefficients of solar panels. The definition of wind and headwind according to the direction of wind acting on the solar panels is shown in Figure 5. The wind factor is defined by Equations (1)–(3).
In fluid dynamics, drag (sometimes called air resistance, a type of friction, or fluid resistance, another type of friction or fluid friction) is a force acting opposite to the relative motion of any object moving with respect to a surrounding fluid as shown in Equation (1). This can exist between two fluid layers (or surfaces) or a fluid and a solid surface. Unlike other resistive forces, such as dry friction, which are nearly independent of velocity, drag force depends on velocity.
A fluid flowing around the surface of an object exerts a force on it. Lift is the component of this force that is perpendicular to the oncoming flow direction as shown in Equation (2). It contrasts with the drag force, which is the component of the force parallel to the flow direction. Lift conventionally acts in an upward direction in order to counter the force of gravity, but it can act in any direction at right angles to the flow.
Drag force:
C D = F D 1 2 ρ V H 2 A r e f ¯
Lift force:
C L = F L 1 2 ρ V H 2 A r e f ¯
Normal force:
C FN = F F N 1 2 ρ V H 2 A r e f ¯
F D = F y × cos ( θ ) F x × sin ( θ ) ,
F N = F y × cos ( β ) F x × sin ( β )
F x : Horizontal force in x-direction
F y : Horizontal force in y-direction
F z : Horizontal force in z-direction
A r e f : Solar panel area
V H ¯ : Average wind velocity (m/s) at the height of the ground and centre of the solar panel

3.2. Single Panel (Case I)

3.2.1. Surface Wind Speed Distribution

Figure 6 shows the drag coefficient, lift coefficient, and vertical force coefficient of the solar panels according to the surface roughness classification. In the distribution characteristics of wind coefficients by wind direction (0°) and reverse wind direction (180°) on the front of the solar panel, drag coefficients were equally seen near 0.5 to 0.6 parts, but, in the case of the solar coefficients, the direction of wind was more than 20% larger than the reverse. This is attributed to the fact that the air force (Fx, Fy) receives more force in the direction of the wind than the headwind direction. The vertical force coefficient of the solar panels was distributed with the same values in the wind directions 0° and 180°. Fy and Fz, the air forces used to calculate the vertical force coefficient, are considered to be less affected by the airflow characteristics owing to changes in surface roughness in the wind tunnel. The drag coefficients, lift coefficients, and vertical coefficients acting on the solar panels were distributed at minimum values of 90° and 270°. This is because the solar panel had the least air power owing to the side angle. The largest wind coefficients for changes in the wind direction were 0° and 135° to 25°. In particular, except for a net wind of 0°, the largest wind coefficient was distributed at 135° to 225° to 225° of headwind, which confirms that the headwind direction has a significant impact on the wind load of solar panels. This trend was similar to that reported by Shademan et al. [13] and Lopez et al. [25]. In addition, in the characteristics of wind coefficients resulting from changes in airflow in the wind tunnel, the drag coefficients were distributed in uniform flows up to 10% greater or equal to the boundary layer. However, the solar and vertical force coefficients were distributed almost equally, regardless of the airflow. The drag coefficient was highly affected by the airflow.

3.2.2. Gradient Angle Change of Photovoltaic Panel

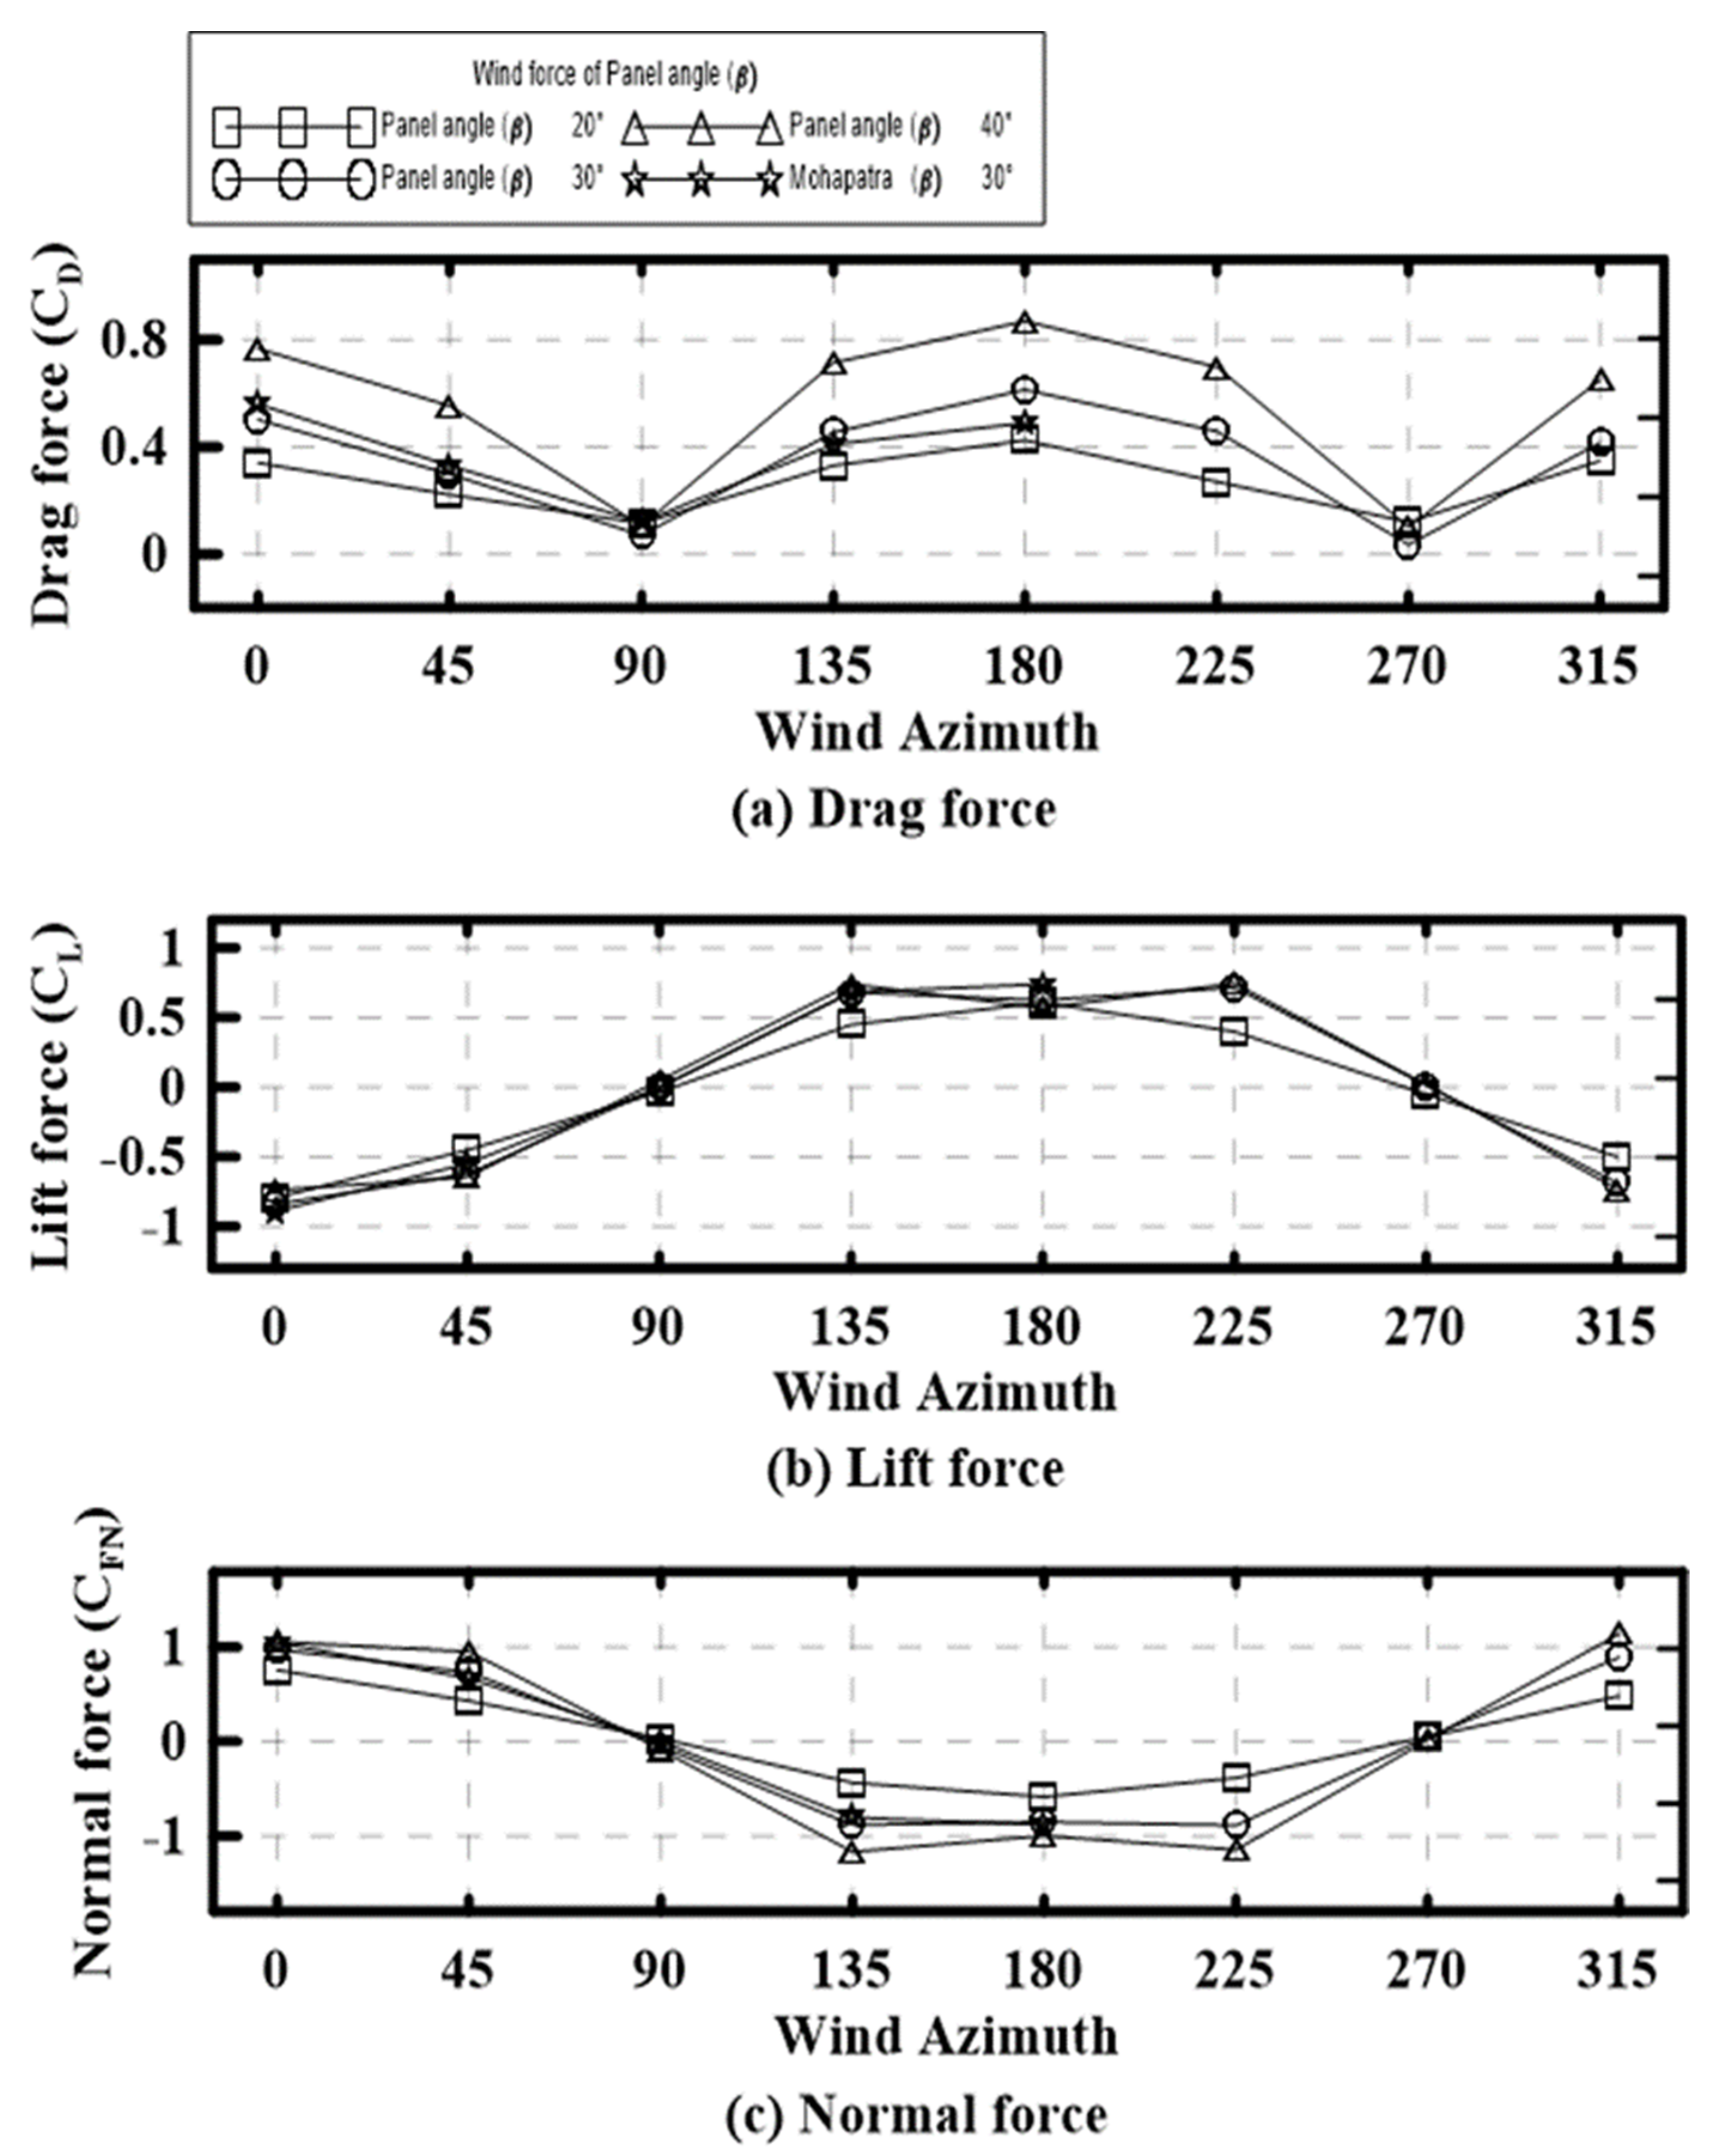
Figure 7 represents the distribution of wind coefficients in the solar panels according to changes in wind direction angle (0–180°) and slope angle (20°, 30°, and 40°) of the solar panels acting on surface roughness. The experimental results of this study were compared with the distribution of wind coefficients of a single solar panel gradient (β) of 30° obtained by Mohapatra et al. [11]. The experiments in this study show that the distribution of wind coefficients caused by wind direction changes was almost identical to Mohapatra’s gradient angle (β) of 30°. The drag coefficient increased in the order of the slope angle of the panel (β) 40° > 30° > 20° from the change in the wind coefficient resulting from the change in the slope angle of the solar panel (β). In addition, if the wind direction angle was 0° (pure wind) and 90° (backwind), the drag coefficient was maximum at the angle of inclination of all panels. However, in the wind direction at the 90° and 270° angles on the sides of the solar panel, the drag coefficient was measured to be close to zero. The solar force coefficient was not affected by the angle of the solar panel, but it was heavily influenced by the wind direction angle acting on the panel. The maximum force coefficient (based on absolute value) was found for a wind direction angle of 0°, but the minimum force coefficient (based on absolute value) was observed for a headwind of 135–180°. In addition, for the vertical force of the solar panels, the wind factor was large, with absolute values near 0° and 135° to 225°. If it works in the direction of the headwind rather than the direction of the wind, the force coefficient and vertical force coefficient are affected at a wide wind direction angle. The wind factor acting on a certain range angle (20–40°) of the solar panel was more affected by the wind direction angle than the angle of the panel.

3.3. Array Panel (Case 2)

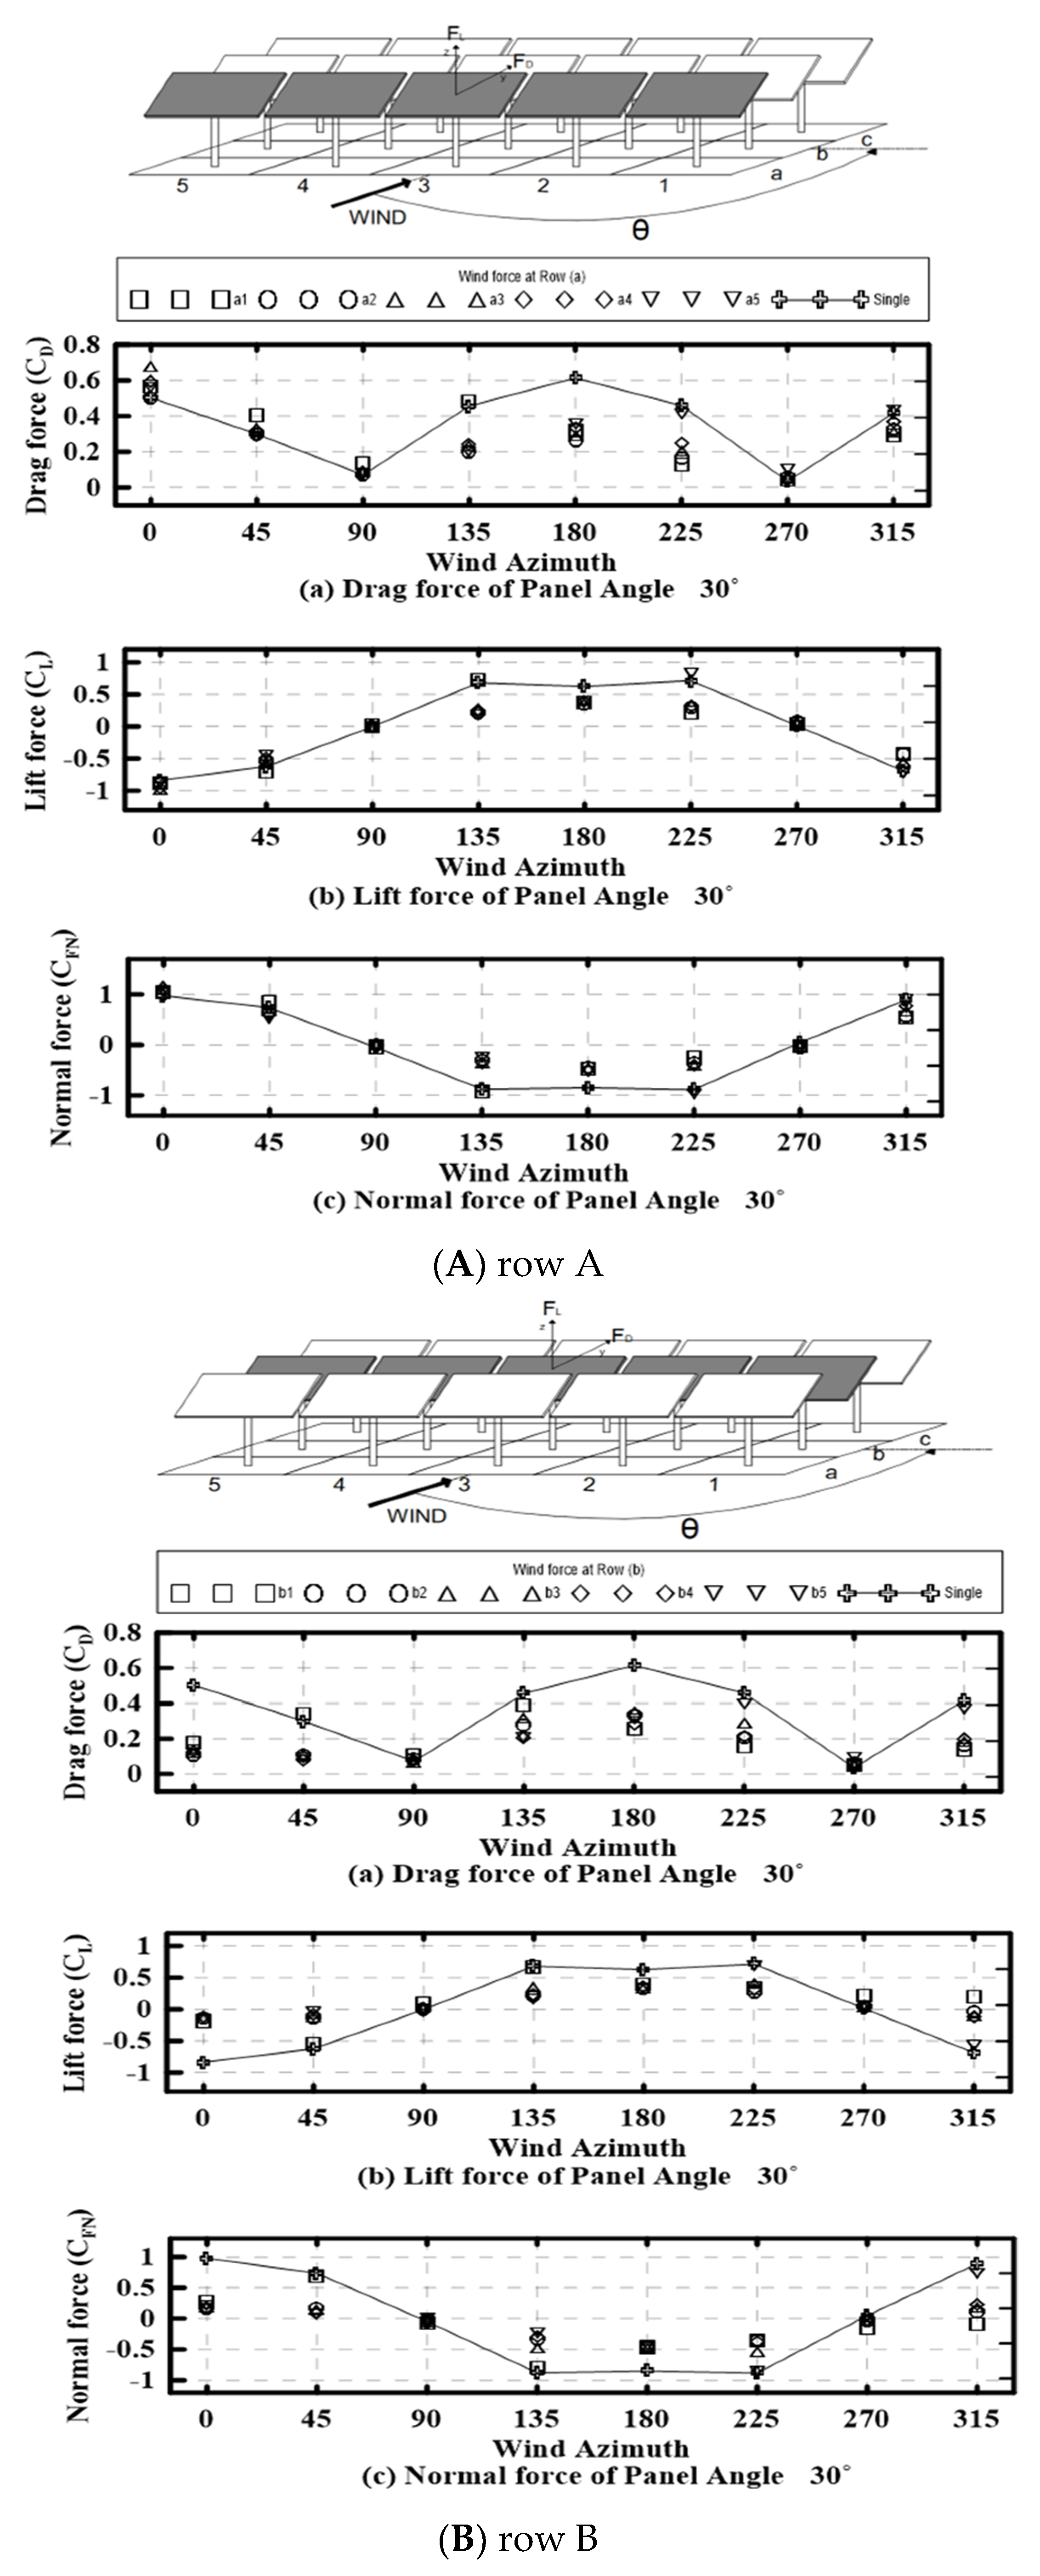
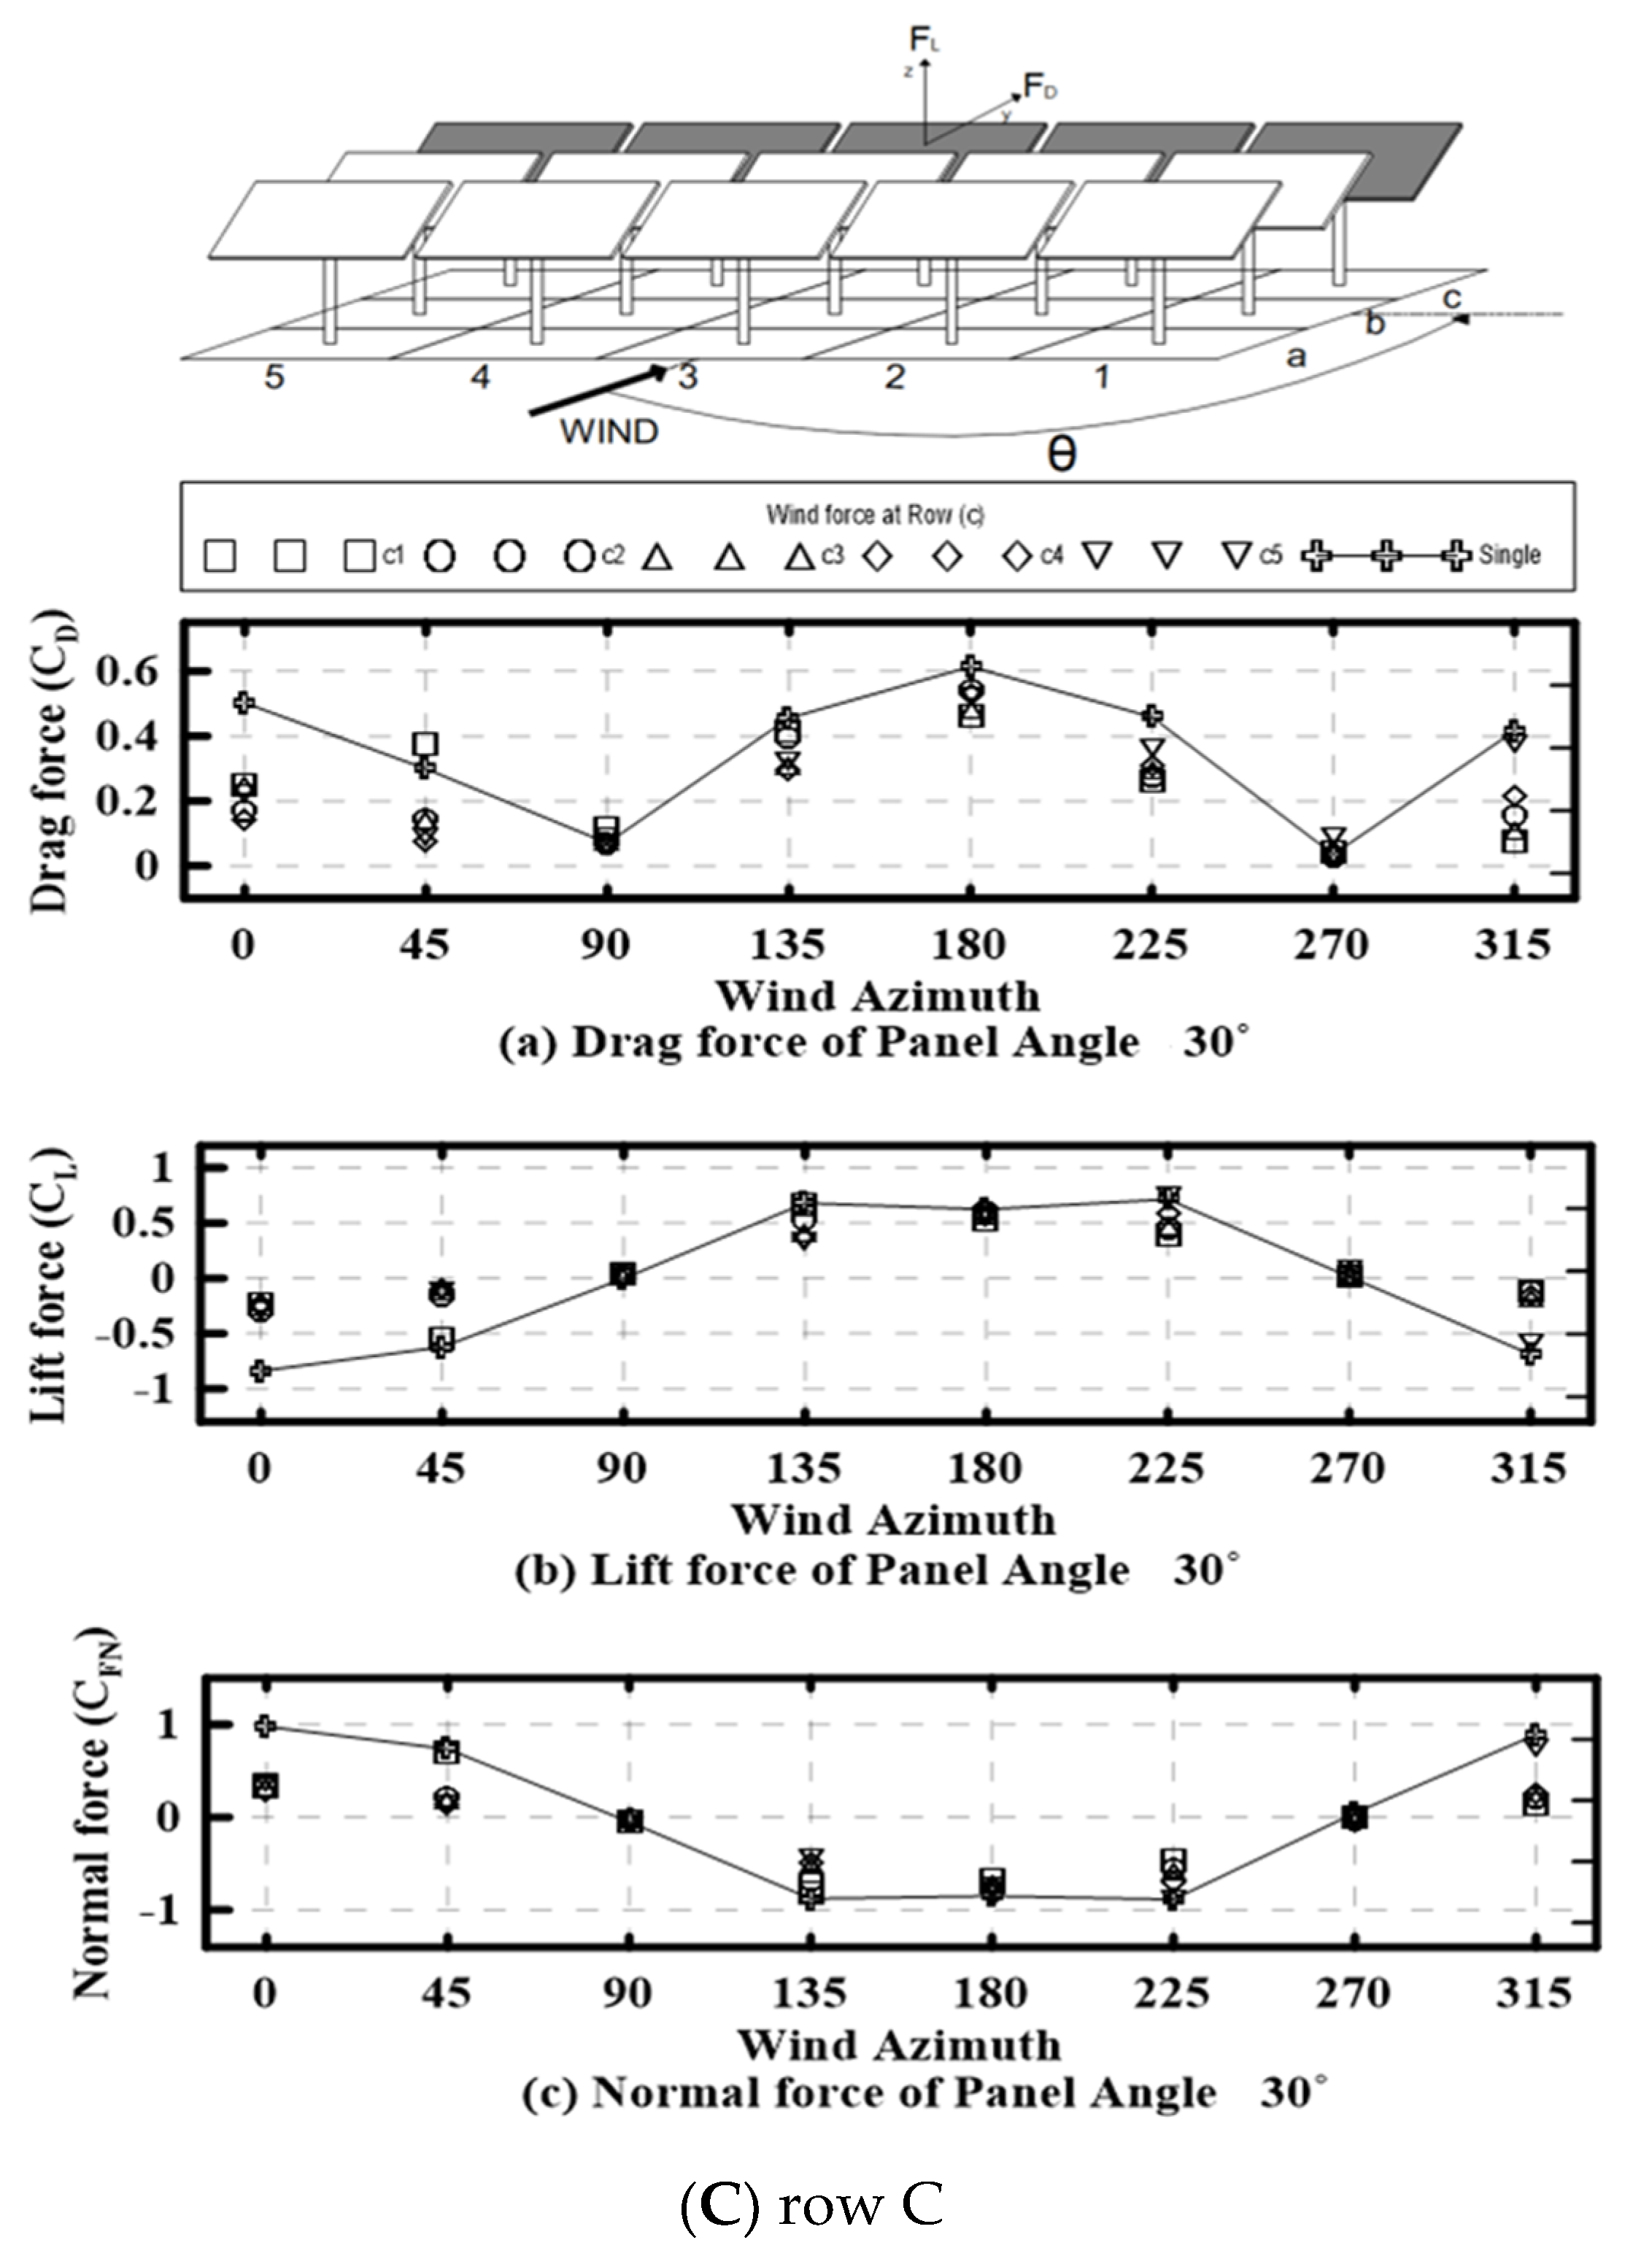
Figure 8 shows the distribution of wind coefficients by the location of the panels according to the array arrangement of the solar panels. The solar panels in the array were placed at a 30° angle. The arrangement of the solar panels defines the wind-driven front row as rows A, B, and C. In addition, the wind coefficient for each location on the solar panels due to the changes in the wind direction angle was compared with that of the single panel. Overall, the value for the single panel was larger than the wind factor value of the array-type batch. However, depending on the location and wind direction angle, the wind value of the single panel was greater than the wind factor value. For example, in Figure 8, when the wind direction angle on the array panel was in the direction of the wind, the drag coefficient was greater than 23% in part a3 located in the centre of row a. In other locations, the drag coefficient was between 5% and 10% larger than that of the single panel. However, as the wind direction increased and the wind direction changed in the direction of the headwind, the drag coefficient value of row A was reduced by as much as 60% compared with the single panel. In addition, in the case of the solar panel, the force coefficient or vertical force coefficient was not significantly different from that of the single panel by location, except for the direction of the reverse wind direction of the panel at 180°. In the case of the row b panel located in the middle of the array layout, there were significant differences in the angles compared with row a. In the case of the wind direction acting on solar panels (0° wind direction angle), there was a decrease of as much as 40% to 50% in all coefficients, regardless of the position of the solar panels. In the reverse wind direction (wind direction angle of 180°), there was no significant change in wind coefficients due to wind direction changes, as shown in row a. In particular, the magnitude change of the vertical force caused by the change in the wind direction angle of the solar panel in row b, which was located inside, was less variable compared to rows a and c. This is because of the decrease in wind speed resulting from the influence of the other panels around the panels located inside. The change in the wind coefficient for row c showed a minimum value of 0° and a maximum value of 180° in the reverse direction for the drag coefficient placed in the wind direction. In the case of 0°, which is the direction of the wind, it is located in the last row of the array layout, and the wind speed is reduced owing to the influence of the previous panel layout. This decrease in wind speed also affected the solar and vertical force coefficients. Unlike in row a, the distribution of the solar coefficient was shown to be smaller in absolute values than the single panels at 0–45° and 315° with wind direction. This effect was also observed for the vertical force coefficient. This is believed to have reduced the wind speed as the wind direction passed through the front two rows, affecting the wind factor less. The analysis of row c and row a compared with that of the single panel indicates that row c in the wind direction and row a in the headwind direction were affected by the placement of the solar panels. The corner angles of the arrayed panels, 45° and 225°, were distributed in columns 1 and 5, with approximately the same wind factor as the single panel, under the influence of wind coefficients on solar panels resulting from changes in the wind direction angle. In the other columns, the drag and lift coefficients were as much as 75%, and the vertical coefficients were less than 50%. These values were smaller than those of single panels. This had a significant influence on the inner panels in rows 2–4 for the corner wind angles. For the side angles of the arrayed solar panels, 90° and 270°, both had the same wind factor as the single panel. This shows that, if the wind were to blow from the side angle, it would not have a significant impact on the solar wind coefficient.

3.4. Distribution of Wind Coefficients in Solar Arrays

3.4.1. Wind Factor Distribution Plot for Wind Flow

Figure 9 shows the distribution of wind coefficients for the wind in solar arrays. The forward wind acts on the front of the solar panel, targeting wind angles of 0°, 45°, and 315°. For wind direction angles of 90° and 270°, the coefficients were very small, so the distribution of the mean wind force coefficients for the wind was excluded.
The position of the largest coefficient in the drag force for the wind in Figure 9a is row a, which is located in the front row. The largest coefficient of the a3 position, located in the centre of row a. The lift force in Figure 9b shows that the downward forces of the solar panel act with negative values. The drag force was also approximately 4.5 and 3 times larger at the centre of row a, at −0.67, compared with the maximum negative values in rows b and c. The normal force in Figure 9c is also the largest in row a, and the shelter effect is clearly visible, with the coefficient decreasing in the second row.

3.4.2. Distribution of Wind Coefficients for Headwinds

Figure 10 shows the distribution of wind coefficients for headwinds in solar arrays. The headwind was applied to the rear of the solar panels, targeting wind angles of 180°, 135°, and 225°.
Figure 10a shows the drag force distribution plot of the array when a headwind acts upon it. The drag coefficients acting on the penalty are calculated as average values, and they are distributed in the ranges of (c) 0.39, (b) 0.27, and (a) 0.27, respectively. The shelter effect of rows a and b was minimal.
The distribution plot of the lift force in Figure 10b shows a large coefficient in row c. In addition, relatively large coefficients were distributed at edges c1 and c5 at 0.53 and 0.55, respectively. In addition, for rows other than row c, higher coefficients than for the perimeter were also found, with the a1 and a5 locations corresponding to the edges of the array being 0.44, and 0.46, respectively. In addition, the normal force distribution plot in Figure 10c shows the largest coefficient value distributed across the entire array from c5 to −0.7. This was approximately 1.4 times larger than b5 and 1.2 times larger than a5.

4. Conclusions

In this study, a single-panel experiment and a location-specific wind experiment of an array in which several solar panels were placed were conducted to identify the wind loads acting on the solar panels. Wind tunnel experiments provide the drag force, lift force, and normal force acting on the panels from the position of the solar panels to determine the characteristics of the entire wind load distribution in the solar complex. The following conclusions can be drawn from the wind factor distribution characteristics of the ground-type solar panels.
(1)
In the case of drag coefficients and lift coefficients, the distribution was almost the same regardless of air flows, and it was found that the drag coefficients were highly influenced by air flows.
(2)
The change in vertical force, which is the wind factor acting on the vertical surface of a single solar panel, was not affected by surface roughness. In addition, wind direction changes were distributed with the largest vertical force coefficients in the 0° forward wind direction relative to the front of the solar panel and in the 345° backward wind direction and 135° and 225° rear diagonal directions.
(3)
In addition, after investigating the change in wind coefficients with changes in solar panel inclination, drag coefficients were the highest at 40° sloping angles on the panel, followed by 30° and 20° sloping angles. However, the lift coefficient and vertical force coefficient were not significantly affected by the tilt angle of the panel.
(4)
The drag coefficient increased in the order 40° > 30° > 20° of the slope angle of the panel (β) from the change in the wind coefficient according to the change in the slope angle of solar panel (β). However, the coefficients of lift and vertical force were not significantly affected by the slope angle of the panel.
(5)
The wind factor of the arrayed panel was affected by the wind direction angle and panel position. The array, as a whole, exhibited a lower coefficient distribution than in the single-panel experiment, except for row a, which was closest to the wind direction angle of 0°. In the case of panels placed inside, the surrounding panels reduced the wind speed, indicating that the wind factor value was distributed lower than in the single-panel experiment. This is attributed to the lack of significant delamination at the end of the panel because of the surrounding array compared with the single-panel experiment.
(6)
The wind factor acting on the solar panels placed in the array was larger than that in the headwind. The effect of the fence on the reduction of wind coefficients owing to the location of solar panels was greater than that of the headwinds. In the normal force, up to 60% or more of the backwind was larger, indicating that the back of the panel was affected more than the front.

Author Contributions

J.Y. and C.L. conceived and designed the experiments; K.Y. performed the experiments; C.L. analysed the data; M.L. contributed reagents/materials/analysis tools; C.L. wrote the article. All authors have read and agreed to the published version of the manuscript.

Funding

The APC was funded by a National Research Foundation of Korea (NRF) grant funded by the Korean government (MSIT) (No. 2019R1A2C1010055).

Institutional Review Board Statement

Not applicable.

Informed Consent Statement

Not applicable.

Data Availability Statement

Not applicable.

Acknowledgments

This work was supported by the National Research Foundation of Korea (NRF) grant funded by the Korean government (MSIT). (No. 2020R1A2C1014044).

Conflicts of Interest

The authors declare no conflict of interest.

References

  1. Radu, A.; Axinte, E.; Theohari, C. Steady wind pressures on solar collectors on flat-roofed buildings. J. Wind Eng. Ind. Aerodyn. 1986, 23, 249–258. [Google Scholar] [CrossRef]
  2. Miller, R.D.; Zimmerman, D.K. Wind Loads on Flat Plate Photovoltaic Array Fields; Boeing Engineering and Construction Co.: Seattle, WA, USA, 1981. [Google Scholar]
  3. Bienkiewicz, B.; Endo, M. Wind considerations for loose-laid and photovoltaic roofing systems. In Structures Congress 2009: Don’t Mess with Structural Engineers: Expanding Our Role; 2009 American Society of Civil Engineers: Austin, TX, USA, 2009; pp. 1–10. [Google Scholar]
  4. Bronkhorst, A.; Franke, J.; Geurts, C.; van Bentum, C.; Grepinet, F. Wind tunnel and CFD modelling of wind pressures on solar energy systems on flat roofs. In Proceedings of the 5th International Symposium on Computational Wind Engineering (CWE2010), Chapel Hill, NC, USA, 23–27 January 2010. [Google Scholar]
  5. Aly, A.M.; Bitsuamlak, G. Wind-induced pressures on solar panels mounted on residential homes. J. Archit. Eng. 2014, 20, 04013003. [Google Scholar] [CrossRef]
  6. Banks, D. The role of corner vortices in dictating peak wind loads on tilted flat solar panels mounted on large, flat roofs. J. Wind Eng. Ind. Aerodyn. 2013, 123, 192–201. [Google Scholar] [CrossRef]
  7. Aly, A.M.; Bitsuamlak, G. Aerodynamic loads on solar panels. In Structures Congress 2013: Bridging Your Passion with Your Profession; American Society of Civil Engineers: Pittsburgh, PA, USA, 2013; pp. 1555–1564. [Google Scholar]
  8. Geurts, C.; Blackmore, P. Wind loads on stand-off photovoltaic systems on pitched roofs. J. Wind Eng. Ind. Aerodyn. 2013, 123, 239–249. [Google Scholar] [CrossRef]
  9. Stathopoulos, T.; Zisis, I.; Xypnitou, E. Wind loads on solar collectors: A review. In Structures Congress; 2013 American Society of Civil Engineers: Chicago, IL, USA, 2012; pp. 1169–1179. [Google Scholar]
  10. Stathopoulos, T.; Xypnitou, E.; Zisis, I. Wind Loads on Rooftop Solar Panel Systems: A Contribution to NBCC 2015. In Proceeding of the 7th Workshop on Regional Harmonization of Wind Loading and Wind Environmental Specifications in Asia-Pacific Econo-mies, Hanoi, Vietnam, 12–13 November 2012. [Google Scholar]
  11. Mohapatra, S. Wind Tunnel Investigation of Wind Load on a Ground Mounted Photovoltaic Tracker. Master’s Thesis, Colorado State University, Fort Collins, CO, USA, 2011. [Google Scholar]
  12. Ikeda, H.; Kimura, K.; Kobayashi, T.; Kato, K.; Kubo, Y.; Ikeda, K. A study on the effects of wind direction on the wind force coefficient of solar panels arranged in rows for a solar panel power plant. J. Struct. Eng. 2012, 58, 559–566. [Google Scholar]
  13. Shademan, M.; Barron, R.M.; Balachandar, R. Nnsteady wind loading of solar panels in arrayed configuration. In Proceedings of the Canadian Society for Mechanical Engineering International Congress 2014, CSME International Congress 2014, Toronto, ON, Canada, 1–4 June 2014. [Google Scholar]
  14. Abiola-Ogedengbe, A.; Hangan, H.; Siddiqui, K. Experimental investigation of wind effects on a standalone photovoltaic (PV) module. Renew. Energy 2015, 78, 657–665. [Google Scholar] [CrossRef]
  15. Ikeda, H.; Matsuda, K.; Kato, K.; Ikeda, K. Estimation and refinement of wind-force coefficient acting on a photovoltaic array on the ground. J. JSCE 2015, 3, 45–59. [Google Scholar] [CrossRef] [Green Version]
  16. Ginger, J.; Payne, M.; Stark, G.; Sumant, B.; Leitch, C. Investigation on Wind Loads Applied to Solar Panels Mounted on Roofs; Report No. TS 821, Cyclone Testing Station, School of Engineering and Physical Sciences, James Cook University, reviewed by J. Holmes, December 22, Townsville, Australia; Cyclone Testing Station: Townsville, Australia, 2011. [Google Scholar]
  17. You, K.P.; Kim, Y.M.; You, J.Y. Characteristics of Wind Pressure Distributions Acting on Solar Collector Plate. J. Korean Assoc. Spat. Struct. 2013, 13, 67–73. [Google Scholar] [CrossRef]
  18. Stenabaugh, S.E.; Iida, Y.; Kopp, G.A.; Karava, P. Wind loads on photovoltaic arrays mounted parallel to sloped roofs on low-rise buildings. J. Wind Eng. Ind. Aerodyn. 2015, 139, 16–26. [Google Scholar] [CrossRef]
  19. Trejos-Grisales, L.A.; Bastidas-Rodríguez, J.D.; Ramos-Paja, C.A. Mathematical Model for Regular and Irregular PV Arrays with Improved Calculation Speed. Sustainability 2020, 12, 10684. [Google Scholar] [CrossRef]
  20. Gimeno-Sales, F.J.; Orts-Grau, S.; Escribá-Aparisi, A.; González-Altozano, P.; Balbastre-Peralta, I.; Martínez-Márquez, C.I.; Gasque, M.; Seguí-Chilet, S. PV Monitoring System for a Water Pumping Scheme with a Lithium-Ion Battery Using Free Open-Source Software and IoT Technologies. Sustainability 2020, 12, 10651. [Google Scholar] [CrossRef]
  21. Aly, A.M. On the evaluation of wind loads on solar panels: The scale issue. Sol. Energy 2016, 135, 423–434. [Google Scholar] [CrossRef]
  22. Shademan, R.M.; Balachandar, R.M. Barron, Detached eddy simulation of flow past an isolated inclined solar panel. J. Fluids Struct. 2014, 50, 217–230. [Google Scholar] [CrossRef] [Green Version]
  23. Shademan, M.; Barron, R.M.; Balachandar, R.; Hangan, H. Numerical simulation of wind loading on ground-mounted solar panels at different flow configurations. Can. J. Civ. Eng. 2014, 41, 728–738. [Google Scholar] [CrossRef]
  24. Stathopoulos, T.; Zisis, I.; Xypnitou, E. Local and overall wind pressure and force coefficients for solar panels. J. Wind Eng. Ind. Aerodyn. 2014, 125, 195–206. [Google Scholar] [CrossRef]
  25. López, A.; Parnás, V.E.; Cataldo, J. Wind tunnel experiments on ground-mounted photovoltaic solar panels. Rev. Ing. de Construcción 2019, 34, 15–24. [Google Scholar] [CrossRef] [Green Version]
Figure 1. Models in wind tunnel.
Sustainability 13 03944 g001aSustainability 13 03944 g001b
Figure 2. Vertical distribution of mean wind velocity and turbulence intensity.
Sustainability 13 03944 g002
Figure 3. Wind direction.
Sustainability 13 03944 g003
Figure 4. Definition of wind force and coefficient acting on panel.
Sustainability 13 03944 g004
Figure 5. Fair wind and backwind.
Sustainability 13 03944 g005
Figure 6. Wind force coefficient of single solar panel.
Sustainability 13 03944 g006
Figure 7. Wind force coefficient of single solar panel according to various slope angle.
Sustainability 13 03944 g007
Figure 8. Distribution of wind force coefficients by location of array solar panel.
Sustainability 13 03944 g008aSustainability 13 03944 g008b
Figure 9. Distribution of the wind coefficient for the array against the wind.
Sustainability 13 03944 g009aSustainability 13 03944 g009b
Figure 10. Distribution plot of the wind coefficient for the array for headwinds.
Sustainability 13 03944 g010aSustainability 13 03944 g010b
Table 1. Specifications of models.
CASE1
(Single)
2
(Array)
Size of panel
(W × L × H)
325 × 160 × 270-
Size of array
(W’ × L’ × H’)
-1705 × 700 × 270
Table 2. Similarity law.
Classificationα = 0.15
Model scale1/25
Height (m)3.5
Basic wind velocity (m/s)26
Design wind velocity (m/s)22.28
Experiment wind velocity (m/s)5
Velocity scale4.46
Time scale5.61
Sampling frequency200 Hz (0.005 s)
Measurement time (s)110
Real time (min)10.29
Ensemble averagingFive times (number 2048)
Lowpass filter100 Hz
Publisher’s Note: MDPI stays neutral with regard to jurisdictional claims in published maps and institutional affiliations.